1
F.C. Donders Centre for Cognitive Neuroimaging, Radboud University Nijmegen, The Netherlands
2
Nijmegen Institute for Cognition and Information, Radboud University Nijmegen, The Netherlands
Several studies have revealed that posterior parietal and frontal regions support planning of hand movements but far less is known about how these cortical regions interact during the mental simulation of a movement. Here, we have used magnetoencephalography (MEG) to investigate oscillatory interactions between posterior and frontal areas during the performance of a well-established motor imagery task that evokes motor simulation: mental rotation of hands. Motor imagery induced sustained power suppression in the alpha and beta band over the precentral gyrus and a power increase in the gamma band over bilateral occipito-parietal cortex. During motor imagery of left hand movements, there was stronger alpha and beta band suppression over the right precentral gyrus. The duration of these power changes increased, on a trial-by-trial basis, as a function of the motoric complexity of the imagined actions. Crucially, during a specific period of the movement simulation, the power fluctuations of the frontal beta-band oscillations became coupled with the occipito-parietal gamma-band oscillations. Our results provide novel information about the oscillatory brain activity of posterior and frontal regions. The persistent functional coupling between these regions during task performance emphasizes the importance of sustained interactions between frontal and occipito-parietal areas during mental simulation of action.
Several studies have shown that the selection and preparation of hand movements is supported by posterior parietal and frontal regions (Kalaska and Crammond, 1995
; Thoenissen et al., 2002
). However, far less is known about how and when these regions interact during the formation of a movement plan. To address this issue, it is important to disentangle planning-related activity from the effects of motor execution and sensory feedback (Blakemore and Sirigu, 2003
; Davidson and Wolpert, 2003
; Grush, 2004
). A fruitful approach to studying movement planning in absence of motor execution and sensory feedback is to use motor imagery. This approach is supported by the considerable cognitive overlap between planning and imagining to carry out an action (Jeannerod, 1994
). Moreover, imaging studies have observed activity in similar portions of posterior parietal and frontal regions during motor imagery of hand movements and during action selection and preparation (de Lange et al., 2005
; Johnson et al., 2002
; Parsons et al., 1995
).
In the current study, subjects performed a well-established motor imagery task, mental rotation of hands (Parsons, 1987
; Sekiyama, 1982
), while we investigated oscillatory power modulations in posterior and frontal areas, as well as their interactions using MEG. We hypothesized that if motor imagery involves a motoric simulation of a left/right hand movement, this should lead to a contralateral activity in the motor system. Moreover, if posterior and frontal areas are jointly engaged in the formation of a motor plan, there should be increased functional connectivity between these regions during motor imagery.
Oscillatory brain responses are a temporally sensitive index of brain dynamics (Hari and Salmelin, 1997
; Salinas and Sejnowski, 2001
; Singer, 1999
) that characterize both evoked (phase-locked) and induced (non-phase-locked) components of neural activity. In contrast, electrophysiological methods averaging single trial responses to external stimuli in the time domain may, due to poor temporal phase-locking, miss the neural dynamics of an internally generated phenomenon like motor imagery (Tallon-Baudry and Bertrand, 1999
). Accordingly, several electrophysiological studies of motor imagery have focused on oscillatory neural responses, identifying imagery-related power reductions in the alpha and beta band over motor and pre-motor areas (McFarland et al., 2000
; Pfurtscheller et al., 2006
). These power reductions are also present during motor preparation and execution (Hari and Salmelin, 1997
; Neuper et al., 2006
), and could arise from reduced inhibition from the basal ganglia during the formation of the motor plan (Cassidy et al., 2002
). Furthermore, both frontal and parietal regions display increased gamma synchronisation during preparation of a movement (Grammont and Riehle, 2003
; Pesaran et al., 2002
; Sanes and Donoghue, 1993
; Scherberger et al., 2005
; Schoffelen et al., 2005
).
Previous electrophysiological studies have also characterized changes in functional connectivity in terms of long-distance neuronal coherence and oscillatory phase-synchronization (Bressler, 1995
; Fries, 2005
; Jerbi et al., 2007
; Varela et al., 2001
). However, functional connectivity analyses based on phase-synchronization need to deal with different oscillatory frequencies during motor planning in parietal and frontal regions. Therefore, we have focused on the correlation between power changes in posterior and frontal regions in the frequency range characteristic of these regions. The physiological rationale for this approach is based on the stronger drive to down-stream areas evoked by neuronal synchronization in the gamma band (Jensen and Colgin, 2007
; Salinas and Sejnowski, 2001
). Accordingly, increases in gamma synchronization in posterior regions may result in beta power decreases in frontal regions receiving the posterior synchronized input. This approach allowed us to characterize the oscillatory dynamics of cortical regions involved in motor imagery, as well as the temporal profile of their interactions.
Participants
Twelve healthy male participants (age, 25 ± 5 years, mean ± SD) participated in the experiment. None of the participants had a history of neurological or psychiatric disorders. All participants had normal or corrected-to-normal vision and were right-handed according to the Edinburgh Handedness Index (88 ± 11, mean ± SD). The study was approved by the local ethics committee, and a written informed consent was obtained from the subjects according to the Declaration of Helsinki.
Stimuli
The experimental stimuli were line drawings of left and right hands, viewed from the palm and from the back, varying in their rotation from 40° to 180° in 35° steps (see example in Figure 1
A). These stimuli were presented using a PC running Presentation software (Neurobehavioral systems, Albany, USA). They were projected onto a screen that was positioned in front of the subject. The stimuli subtended a visual angle of ∼2°.

Figure 1. Task setup and behavioral performance. (A) Task setup. After a baseline period, subjects were presented with a hand image. Subjects had to judge whether the stimulus was a left or right hand. After the response, subjects received feedback about their performance by a color change of the fixation cross. (B) Behavioral performance. Reaction times increased with increasing rotation for both left hands (LH) and right hands (RH). There were no reaction time differences between left and right hands. (C) EMG of the left arm remained flat throughout the trial, whereas the EMG of the right arm deviated sharply ±0.1 s preceding the button press. There were no EMG differences between mental rotation of LH and RH in the left or right arm.
Experimental Time Course and Procedures
The subjects’ task was to report whether the hand drawing on display represented a left or a right hand (regardless of its rotation) by pressing one of two buttons with their right hand. The stimuli were presented to the subjects in a random order. Before the start of the measurement, participants engaged in 100 training trials to get acquainted with the task.
During MEG measurement, subjects engaged in five task blocks, each block consisting of 160 trials. Each trial started with a white fixation cross, displayed for 3 s, followed by the presentation of a hand drawing. The stimulus was shown until the subject responded by pressing either the left or right button, and it was then replaced by the baseline fixation cross for 0.5 s, after which the subject received feedback by the fixation cross turning green (correct) or red (incorrect). This color change lasted 0.5 s, after which the fixation cross turned white and the next trial began (Figure 1
A). Rotation and laterality of the hand drawings was randomized from trial to trial. In total, each subject performed 800 trials (2 hands × 5 rotations × 80 replications), in a total measurement time of ∼70 min.
MEG Measurements
Ongoing brain activity was recorded (low-pass filter, 300 Hz; sampling rate, 1200 Hz) using a whole-head MEG with 151 axial gradiometers (VSM/CTF Systems, Port Coquitlam, British Columbia, Canada). Head localization was done before and after the experiment using coils that were placed at the cardinal points of the head (nasion, left and right ear canal). The magnetic fields produced by these coils were used to measure the position of the subject’s head with respect to the MEG sensor array. In addition to the MEG, the electrooculogram was recorded from the supraorbital and infraorbital ridge of the left eye for the subsequent artifact rejection. Also, EMG was recorded using 10-mm diameter Ag–AgCl surface electrodes. Electrodes were placed on the left and right forearm, in a ‘belly–tendon’ arrangement, following standard skin preparation.
Data Analysis
All data analysis was performed using the FieldTrip toolbox developed at the F.C. Donders Centre for Cognitive Neuroimaging (http://www.ru.nl/fcdonders/fieldtrip) using Matlab 7 (MathWorks, Natick, MA, USA). We excluded incorrect trials from subsequent analysis. Partial artifact rejection was performed by rejecting segments of the trials containing eyeblink, muscle, and SQUID artifacts. By this procedure, smaller segments of a trial, rather than a whole trial, can be rejected. This is advantageous when calculating time frequency representations (TFR) based on sliding time windows because fewer full length trials have to be rejected. In the subsequent averaging, the number of segments applied was taken into account. On average, the fraction of data segments rejected because of artifacts was 13.9 ± 11.2% and 13.9 ± 10.6% for motor imagery of left and right hands, respectively (mean ± SD). We analyzed the data both time-locked to the stimulus and the response. When time-locking to the stimulus, we analyzed the trials until 200 ms pre-response to avoid contamination of the motor response. Similarly, when time-locking to the response, we analyzed the trials starting from 200 ms post-stimulus onset. For the sensor level analysis, an estimate of the planar gradient was calculated (Bastiaansen and Knosche, 2000
). The horizontal and vertical components of the planar gradients were calculated for each sensor using the signals from the neighboring sensors thus approximating the signal measured by MEG systems with planar gradiometers. This approach has been successfully applied in earlier MEG studies on oscillatory brain dynamics (Bauer et al., 2006
; Osipova et al., 2006
). The planar field gradient simplifies the interpretation of the sensor-level data because the maximal signal typically is located above the source (Hämäläinen et al., 1993
). EMG signals were high-passed filter (20 Hz), rectified, and root mean square (RMS) was computed for the same time windows used as for the MEG analysis. For each time-window, the relative change in RMS with respect to a baseline window ([−0.75 −0.25] s preceding the stimulus onset) was calculated.
Time-Frequency Analysis
Time-frequency representations (TFRs) of power were calculated for each trial using a Fourier transform approach applied to short sliding time windows. Prior to applying the Fourier transforms one or more tapers were multiplied to each time window and the resulting power estimates were averaged across tapers. The power values were calculated for the horizontal and vertical component of the estimated planar gradient and then summed. The planar gradient power estimates were subsequently averaged over trials for a given condition. For the frequencies 8–30 Hz, we used one Hanning taper and applied an adaptive time window of four cycles for each frequency (ΔT = 3/f), resulting in an adaptive smoothing of Δf ∼ 1/ΔT. In the higher-frequency bands (30–120 Hz), we used a set of three orthogonal Slepian tapers, and a fixed time window of ΔT = 0.2 s, resulting in a frequency smoothing of Δf ∼ 10 Hz (Percival and Walden, 1993
). The relative change in power was calculated with respect to a baseline period [−0.75 −0.25] s before the presentation of the stimulus. The frequency boundaries of alpha (8–12 Hz), beta (16–24 Hz) and gamma (50–80 Hz) bands were based on both the EEG/MEG literature in awake behaving humans (Bauer et al., 2006
; Caetano et al., 2007
; Hoogenboom et al., 2006
; Jensen et al., 2005
; Niedermeyer, 2005
), as well as by identifying the frequency boundaries that were present in the data. The significance of the differences in power were established for the planar gradient at the sensor level, using a nonparametric cluster randomization test (Maris and Oostenveld, 2007
; Nichols and Holmes, 2002
). This test effectively controls the type I error rate in situations involving multiple comparisons (such as 151 sensors) by clustering neighboring sensor pairs that exhibit the same effect. The randomization method identified sensors whose t statistics exceeded a critical value when comparing two conditions sensor by sensor (p < 0.05, two-sided). Note that the goal of this step is to identify sensors with effects exceeding a threshold for the subsequent cluster analysis, i.e., it is not required that the power values to be tested are normally distributed. To correct for multiple comparisons, contiguous sensors that were exceeding the critical value in the sensor array (separated by <5 cm) were considered a cluster. This approach is justified by the fact that a physiological source typically produces the strongest planar gradient field in a contiguous group of sensors right above the source (Hämäläinen et al., 1993
). The cluster-level test statistic was defined from the sum of the t values of the sensors in a given cluster. The cluster with the maximum sum was used in the test statistics. The type I error rate for the complete set of 151 sensors was controlled by evaluating the cluster level test statistic under the randomization null distribution of the maximum cluster-level test statistic. This was obtained by randomizing the data between the two conditions across multiple subjects calculating t statistics for the new set of clusters. A reference distribution of cluster-level t statistics was created from 2000 randomizations. The p value was estimated according to the proportion of the randomization null distribution exceeding the observed maximum cluster-level test statistic (the so-called Monte Carlo p value).
Source Localization
A frequency-domain beam-forming approach [Dynamic Imaging of Coherent Sources (DICS)] was used to identify sources of oscillatory activity. Note that, for source reconstruction, we used the data directly from the axial sensors and not the planar gradient estimate. The DICS technique uses adaptive spatial filters to localize power in the entire brain (Gross et al., 2001
; Liljeström et al., 2005
). For the source reconstruction in the alpha, beta and gamma frequency band, the interval between [−0.5 −0.1] s pre-response was chosen, as this was a time interval in which the oscillatory power in all bands were most pronounced. A time period of equal length ([−0.6 −0.2] s before stimulus presentation) served as the baseline interval. Multisphere forward models were fitted to individual head shapes identified from the individual MRIs (Huang and Mosher, 1997
) obtained for each subject. The brain volume of each individual subject was discretized to a grid with a 0.5-cm resolution and the lead field matrix was calculated for each grid point according to the head position in the system and the forward model. Using the cross-spectral density matrices and the lead field matrix, a spatial filter was constructed for each grid point, and the power was estimated in each subject. The cross-spectral density matrix was used in the adaptive spatial filter as expressed in the following formula:
w(r, f) = (L′(r)(C(f)+λ · I)−1 L(r))−1 L′(r)(C(f) + λ · I)−1
The resultant filter at each location r and each frequency f is the pseudo-inverse of the matrix product of the leadfield matrix (as used in all dipole models) and the cross-spectral-density matrix of all sensor combinations (Gross et al., 2001
; Van Veen et al., 1997
). The filter uses the cross-spectral density matrix that is calculated separately in the pre- and post-stimulus periods of the individual trials and averaged. We calculated the ratio between post-stimulus and pre-stimulus power at each voxel, using the following formula:
p(r, f) = w(r, f)C(f)′ w*(r, f))
This method serves the same purpose as computing the neural activity index (Robinson et al., 1997
). We then calculated statistical parametric maps between activation and baseline, and between left hand and right hand. The individual subjects’ source estimates were overlaid on the corresponding anatomical MRI, and the anatomical and functional data were subsequently spatially normalized using SPM2 (Statistical Parametric Mapping; http://www.fil.ion.ucl.ac.uk/spm) to the International Consortium for Brain Mapping template [Montreal Neurological Institute (MNI), Montreal, Quebec, Canada; http://www.bic.mni.mcgill.ca/brainweb].
Single Trial Analysis of Oscillatory Power
We investigated the relationship between reaction time and the amount of oscillatory power in each trial, by sorting trials by reaction time and correlating reaction time with the amount of oscillatory power increase/decrease. This analysis could identify three different patterns: (1) effects stereotypically aligned to the stimulus onset, not showing any covariation with the response time. These effects can be interpreted as primarily visual stimulus driven effects; (2) effects stereotypically aligned to the response onset, not showing any covariation with the response time. These effects can be interpreted as involved in motor execution; (3) effects that show a covariation of response time, and as such can be interpreted as task-related. To investigate the relationship between reaction time and oscillatory power changes, we calculated for each subject and each trial the reaction time and the total power change in the alpha, beta and gamma band in left motor cortex, right motor cortex and occipito-parietal cortex. We based our channel selection of the right motor cortex on the channel showing the largest difference in beta suppression between hands, selecting the channel of maximal differential beta suppression and its four nearest neighbors. For the selection of the left motor cortex, we chose the identical contralateral sensors. Occipito-parietal sensors were chosen based on the largest increase in gamma power with respect to the baseline. We then correlated reaction times with the oscillatory power changes in the three regions. Correlation coefficients were subsequently converted to z values using Fischer’s r-to-z transform in order to obtain a normally distributed variable (Jenkins and Watts, 1968
) and the Fisher z values were Z-transformed to transform this distribution into a standard normal distribution. Significance of the correlation was then assessed at the group level with one-sample T-tests. For plotting purposes, single trials were sorted by their RT, and aligned to the onset of the stimulus, so that each line of the plot represents a single trial. Smoothing across trials was effectuated by convolving the matrix with a Hanning taper with a length of 10 trials to suppress noise and augment common signal properties.
Analysis of Cross-Frequency Amplitude Coupling
To investigate the interactions between occipito-parietal and motor regions, we calculated the cross-frequency amplitude coupling over time. Cross-frequency coupling refers to dependence between distinct frequency bands of the electrophysiological signals in the same or different regions (Jensen and Colgin, 2007
). Cross-frequency coupling can occur between the phase of signals in two different frequency bands (Palva et al., 2005
; Schack et al., 2005
), between the phase of one signal and the amplitude of the other (Canolty et al., 2006
) or between the amplitudes of two signals in different frequency bands (Bruns and Eckhorn, 2004
). We investigated the dependence between the amplitude envelope of the frontal beta rhythm and occipito-parietal gamma rhythm during different stages of the motor imagery process. For reliable estimation of the correlation we grouped the correlations between regions and frequency bands into 500 ms bins. Correlation coefficients were converted to z values using Fischer’s r-to-z transform in order to obtain a normally distributed variable (Jenkins and Watts, 1968
) and the Fisher z values were Z-transformed to transform this distribution into a standard normal distribution. Significance was assessed at the group level with one-sample T-tests.
Behavioral Results
Subjects had to judge whether the presented picture was a left or right hand, irrespective of its rotation angle or whether the palm or the back of the hand were shown (Figure 1
A). Participants were equally proficient in judging rotated images of left hands (error rate: 7.4 ± 3.5%, mean ± SD) and right hands (error rate: 7.4 ± 5.2%, mean ± SD). Reaction times increased with increasing rotation angle (F(4,8) = 7.51; p = 0.008; Figure 1
B). There was no significant difference in reaction times (RT) between motor imagery of left and right hands (mean RTleft hands = 1.45 s; mean RTright hands = 1.40 s; F(1,11) = 1.82; p = 0.21) nor an interaction between hand laterality and rotation (F(4,8) = 2.39; p = 0.14). In short, behavioral measures showed that there were no differences in difficulty between motor imagery of the left and right hand, and that reaction times increased with increasing rotation of the stimulus. EMG measurements indicated that there were no EMG differences between motor imagery of the left hand and the right hand during the task, either at the left forearm ([0 1] s after stimulus onset: F(1,11) = 0.61; p = 0.45; [−1 0] s before response: F(1,11) = 0.60; p = 0.46) or at the right forearm ([0 1] s after stimulus onset: F(1,11) = 1.42; p = 0.26; [−1 0] s before response: F(1,11) = 0.59; p = 0.46). When directly comparing the EMG traces of the left and right forearm, EMG of the left arm remained flat throughout the trial, whereas the EMG of the right arm deviated sharply ±0.1 s preceding the button press, leading to a significant EMG by time period interaction (F(1,11) = 7.62; p = 0.019; Figure 1
C).
Frontal Alpha and Beta Oscillations are Suppressed During Motor Imagery
We first looked at general differences in alpha and beta oscillations during motor imagery, irrespective of the handedness of the visual stimulus. There were highly significant power suppressions during motor imagery compared to baseline, both in the alpha band (Figure 2
A-left panel; 8–12 Hz, [0 1] s after stimulus onset: p < 0.001; [−1 0] s before response: p < 0.001) and in the beta band (Figure 3
A-left panel; 16–24 Hz, [0 1] s after stimulus onset: p < 0.001; [−1 0] s before response: p < 0.001). Source reconstructions showed that this alpha and beta suppression was widespread, and was mainly generated in occipito-parietal and motor cortex (Figures 2
B and 3
B). We selected a group of sensors over the left motor cortex (Figures 2
C and 3
C-left panel) for subsequent analysis. The onset of the sustained power suppressions over left motor cortex was ∼0.3 s after stimulus presentation (Figures 2
D,E-left panel and 3
D,E-left panel). Single-trial analysis showed that the duration of the alpha and beta suppression over left motor cortex was strongly correlated with the reaction times (alpha: mean Z = −4.29, p < 0.001, Figure 2
F-left panel; beta: mean Z = −6.14, p < 0.001; Figure 3
F-left panel). Thus, alpha and beta oscillations in left motor cortex were suppressed during the full trial duration, independently of presented left or right hands.
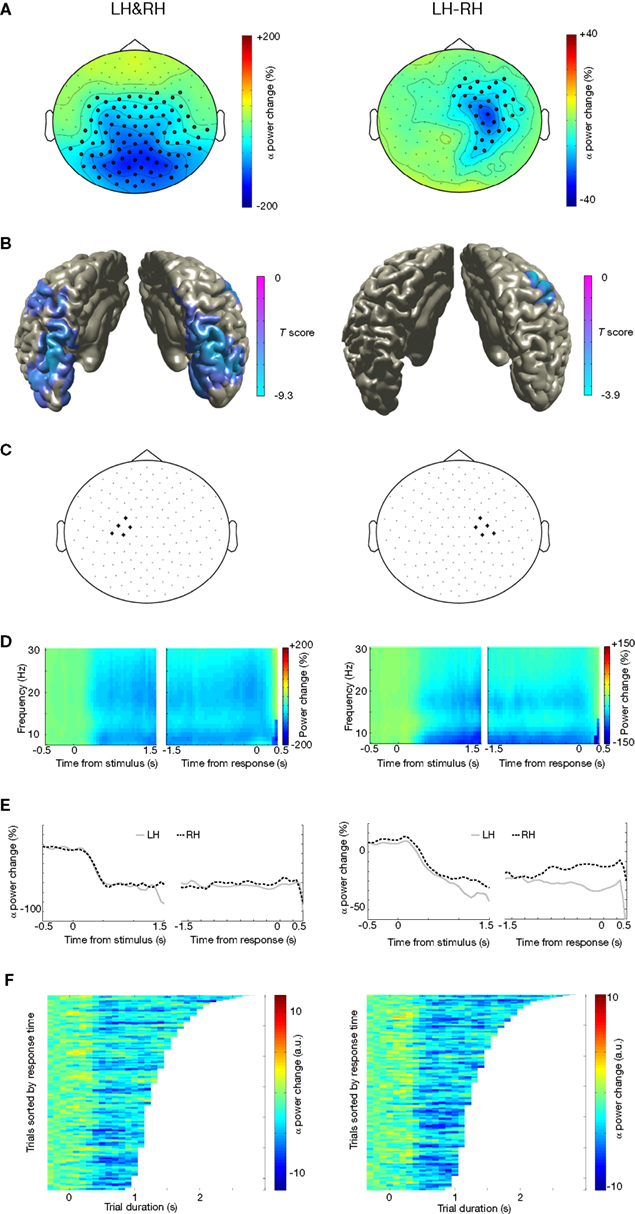
Figure 2. Alpha suppression during motor imagery of left and right hands. (A) Grand average of the topography of changes in power in the alpha band (8–12 Hz) between task and baseline (LH & RH, left panel) and between hands (LH-RH, right panel). Dots indicate clusters of significant differences (p < 0.05 corrected for multiple comparisons). (B) Source reconstruction of the changes in power in the alpha band between task and baseline (left panel) and between hands (right panel). The power of the source representation is thresholded at half-maximum. (C) Outline of a group of sensors overlying left and right motor cortex that were selected for subsequent analysis. (D) Grand-averaged time-frequency representation of power over left motor cortex (left panel) and right motor cortex (right panel). The time-frequency plots have been aligned to the presentation of the visual stimulus (time = 0, left panel) or to the button-press (time = 0, right panel). (E) Grand-averaged power in the alpha band, plotted separately for trials showing drawings of left and right hands [LH, RH, respectively; other conventions as in (D)], for the left motor cortex (left panel) and right motor cortex (right panel). (F) Relationship between trial duration and alpha suppression. Alpha-band power for single trials (sorted by reaction time, time = 0 corresponds to visual stimulus presentation) is plotted against trial duration, for one representative subject and for the sensor selections as outlined in (C). Power values were smoothed over 10 trials windows.
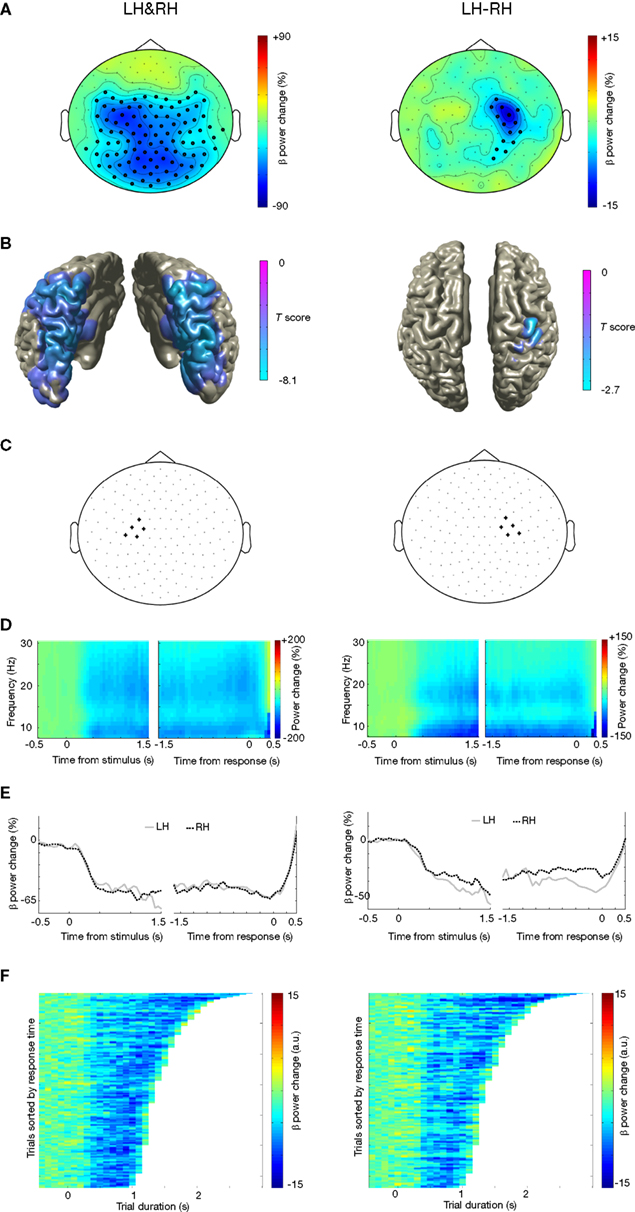
Figure 3. Beta suppression during motor imagery of left and right hands. (A) Grand average of the topography of changes in power in the beta band (16–24 Hz) between task and baseline (LH & RH, left panel) and between hands (LH-RH, right panel). Dots indicate clusters of significant differences (p < 0.05 corrected for multiple comparisons). (B) Source reconstruction of the changes in power in the beta band between task and baseline (left panel) and between hands (right panel). The power of the source representation is thresholded at half-maximum. (C) Outline of a group of sensors overlying left and right motor cortex that were selected for subsequent analysis. (D) Grand-averaged time-frequency representation of power over left motor cortex (left panel) and right motor cortex (right panel). The time-frequency plots have been aligned to the presentation of the visual stimulus (time = 0, left panel) or to the button-press (time = 0, right panel). (E) Grand-averaged power in the beta band, plotted separately for trials showing drawings of left and right hands [LH, RH, respectively; other conventions as in (D)], for the left motor cortex (left panel) and right motor cortex (right panel). (F) Relationship between trial duration and beta suppression. Beta band power for single trials (sorted by reaction time, time = 0 corresponds to visual stimulus presentation) is plotted against trial duration, for one representative subject and for the sensor selections as outlined in (C). Power values were smoothed over 10 trials windows.
When directly comparing motor imagery of left and right hands, there was a significantly stronger alpha and beta suppression over the right motor cortex for left hands than for right hands (alpha: Figure 2
A-right panel; 8–12 Hz, [−1 0] s before response: p = 0.008; beta: Figure 3
A-right panel; 50–80 Hz, [−1 0] s before response: p = 0.025). Source reconstructions showed that this difference was localized in the superior precentral gyrus (Figures 2
B and 3
B-right panel), showing good correspondence with the effect observed at the sensor level. We selected a group of sensors over the right motor cortex (Figures 2
C and 3
C-right panel) for subsequent analysis. The onset of the suppression over the right motor cortex was similar to that observed over the left motor cortex (Figure 3
D, E), but stronger alpha and beta suppression over right motor cortex during motor imagery of left hands was visible as much as 1 s preceding the subject’s response. The duration of the alpha and beta suppression over right motor cortex was strongly correlated with the reaction times (alpha: mean Z = −3.64, p < 0.001, Figure 2
F-right panel; beta: mean Z = −5.08, p < 0.001; Figure 3
F-right panel). In summary, there was significant alpha and beta suppression during motor imagery, which was stronger over the right motor cortex for motor imagery of left hands. The duration of these power suppressions was proportional to the duration of motor imagery.
Posterior Gamma Oscillations are Sustained During Motor Imagery
There was a large increase in gamma-band power during imagined actions of left and right hands (Figure 4
A; [0 1] s after stimulus onset: p < 0.001; [−1 0] s before response: p < 0.001; sensors in significant cluster indicated by dots). The gamma-band increase was present over occipito-parietal cortex and over the left motor cortex (Figure 4
A). Source reconstructions confirmed the involvement of occipito-parietal and left motor cortex (Figure 4
B). We selected a group of sensors over occipito-parietal cortex (Figure 4
C, posterior sensors) and over the left motor cortex (Figure 4
C, left central sensors) for subsequent analysis. The power of both the occipito-parietal and left motor cortex concentrated around 50–80 Hz (Figure 4
D), but their time course differed markedly. The occipito-parietal gamma cluster showed a steep increase in gamma-band activity following stimulus onset, which was sustained until the subject provided his response (Figure 4
D,E-left panel). Conversely, the left motor gamma cluster showed a transient increase in gamma-band activity that peaked around the time the subject responded with a right hand button press (Figure 4
D, E-right panel). Single-trial analysis showed that the duration of the occipito-parietal gamma-band increase was correlated with the reaction time of the trial (Figure 4
F-left panel; mean Z = 1.90, p = 0.046). Conversely, the duration of the left motor gamma response was independent of the duration of the trial (Figure 4
F-right panel; mean Z = −0.87, p = 0.166). There were no significant differences in gamma-band power between the left and right hand (p > 0.10). In summary, there were increases in gamma power in occipito-parietal and left motor cortex. The duration of occipito-parietal gamma was sustained and proportional to the duration of the motor imagery process, while the duration of left motor cortex gamma was transient and related to the button press at the end of the trial.
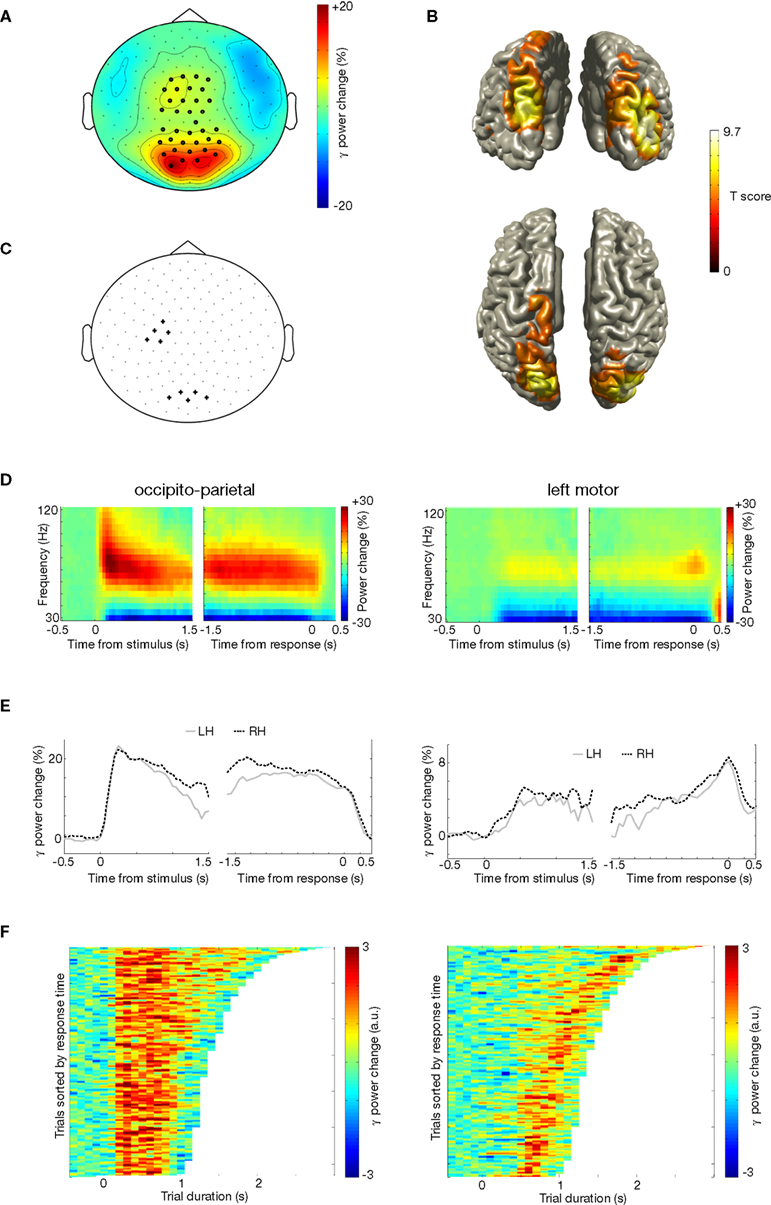
Figure 4. Gamma activity during motor imagery. (A) Grand average of the topography of gamma power (50–80 Hz), showing the relative comparison of task and baseline. Dots indicate clusters of significant differences (p < 0.05 corrected for multiple comparisons). (B) Source reconstruction of gamma power increase. Upper panel shows a posterior view, and lower panel shows a view from the top. Power of the source representations is thresholded at half-maximum. (C) Outline of a group of sensors overlying left motor cortex and occipito-parietal cortex that were selected for subsequent analysis. (D) Grand-averaged time-frequency representation of power of sensors overlying occipito-parietal cortex (left panel), and of a group of sensors overlying the left motor cortex (right panel). Both groups of sensors showed a significant gamma power increase during the task, but with different temporal profile. Sensor selection is outlined in (C). (E) Grand-averaged gamma power, averaged over 50–80 Hz, for the same sensor selection as in (D) (occipito-parietal sensors: left panel; left motor sensors: right panel), plotted for left and right hands separately. (F) Relationship between trial duration and gamma increase. Gamma-band power, averaged over 50–80 Hz, for single trials (sorted by reaction time) is plotted against trial duration, for one representative subject and for the sensor selection as outlined in (C) (occipito-parietal sensors: left panel; left motor sensors: right panel). Power values were smoothed over 10 trial windows.
Functional Coupling Between Motor Cortical Alpha/Beta and Occipito-Parietal Gamma Power
In order to assess the interactions between occipito-parietal and precentral regions, we calculated the cross-frequency amplitude correlation between the oscillations of these regions over time. Specifically, we calculated the dependence between the amplitude envelope of the central alpha/beta rhythm and the posterior gamma rhythm during motor imagery. When we chose sensors over left and right motor cortex (see Figure 2
C) as the reference regions, and calculated the correlation with gamma amplitude in all other sensors (see Figure 4
A, C), this revealed an isolated region of negative correlations over occipito-parietal regions. The clear spatial segregation suggests that the anti-correlation is constituted by distinct regions. Beta-gamma coupling was significant between the left motor cortex and occipito-parietal cortex at [1 1.5] s post-stimulus, as well as [−1.5 −0.5] s pre-response (Figure 5
B), and between the right motor cortex and occipito-parietal cortex at [1 1.5] s post-stimulus, as well as [−1.5 −1] s pre-response (Figure 5
D). During baseline and the first second of the trial, as well as during the last 500 ms preceding response and after the response the cross-frequency coupling between posterior gamma and central beta was not significant (all p > 0.10). There was no significant coupling alpha-gamma coupling time-locked to the onset of the visual stimulus (all p > 0.10). When time-locking to the response, there was alpha-gamma coupling between right motor cortex and occipito-parietal cortex in the interval [−1.5 −1.0] s pre-response (p = 0.01), and a trend of alpha-gamma coupling between left motor cortex and occipito-parietal cortex (p = 0.08) in the same interval, while all the other intervals showed no significant alpha-gamma coupling (all p > 0.10). Surprisingly, there was no beta-gamma or alpha-gamma amplitude coupling within left or right motor cortex or between left and right motor cortex. Local alpha-gamma and beta-gamma coupling was observed within the occipito-parietal cortex. In summary, there was an amplitude coupling between motor beta and occipito-parietal gamma oscillations, which occurred at a specific time interval during motor imagery.
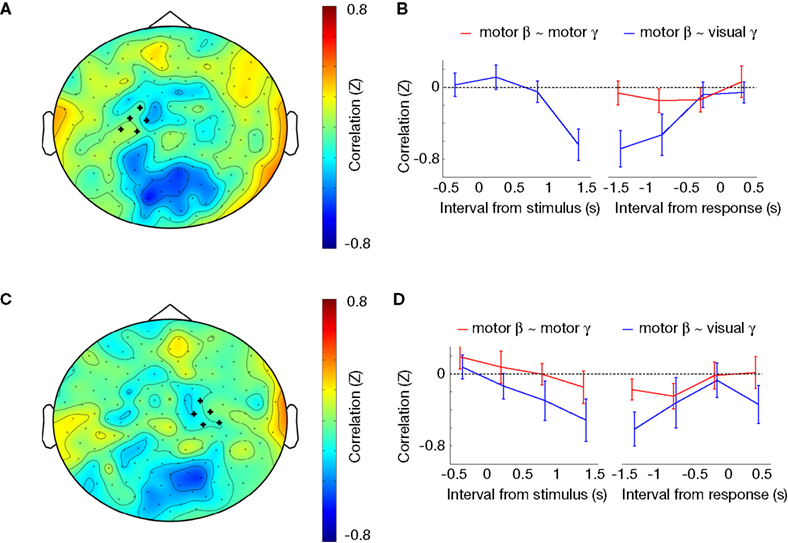
Figure 5. Cross-frequency amplitude coupling. (A) Topographical distribution of Z-transformed correlation between beta power over left motor sensors (marked with ‘+’) and gamma power for each individual sensor, in the interval between −1.5 and −0.5 s preceding the subject’s response. (B) Time course of Z-transformed correlation between beta power over left motor sensors (see Figure 2
C-left panel for sensor selection) and gamma power over occipito-parietal sensors (see Figure 4
C for sensor selection) is plotted in blue, and between beta power over left motor sensors and gamma power over left motor sensors is plotted in red. (C) Topographical distribution of Z-transformed correlation between beta power over right motor sensors (marked with ‘+’) and gamma power for each individual sensor, between −1.5 and −0.5 s preceding the subject’s response. (D) Time course of Z-transformed correlation between beta power over right motor sensors (see Figure 2
C-right panel for sensor selection) and gamma power over occipito-parietal sensors (see Figure 4
C for sensor selection) is plotted in blue, and between beta power over right motor sensors and gamma power over right motor sensors is plotted in red.
In this study we have investigated the neural dynamics of imagined hand actions using MEG, focusing on timing, localization, and inter-regional coupling of oscillatory activities. Imagined hand actions were characterized by a marked alpha and beta suppression over occipito-parietal and precentral cortex, with stronger alpha and beta suppression over the right precentral cortex for motor imagery of left compared to right hands. We also observed a large sustained increase in gamma-band power during imagined actions of both left and right hands in occipito-parietal cortex. During a specific stage of the imagined action, the precentral beta suppression was functionally coupled to enhanced gamma oscillations in the occipito-parietal cortex. These results illustrate that, during motor imagery, there are dynamic functional interactions between occipito-parietal and precentral cortex, which suggest cooperation between posterior and frontal areas during the formation of an action plan.
Increases in Reaction Times with Rotation are Similar for Left and Right Hands
All subjects engaged in the motor imagery task, with low error rates (<10%). Reaction times increased with increasing stimulus rotation (Figure 1
B), in line with earlier studies (Parsons, 1987
; Sekiyama, 1982
). There were no differences in reaction time between motor imagery of left and right hands. This result excludes that differences between neural activity evoked during motor imagery of the two hands could be related to differences in task complexity.
Suppression of Fronto-Central Alpha/Beta Oscillations is Sustained Throughout Motor Imagery
We found strong alpha and beta suppression during motor imagery, in line with the observation that suppression of alpha and beta power reflects engagement of the motor system, whereas increase in alpha and beta power reflects inhibition (Hari and Salmelin, 1997
; Jensen et al., 2005
). The effect was strongest in dorsal frontal areas, but it extended posteriorly towards parietal and occipital areas (Figures 2
A,B and 3
A,B). These findings are in accord with a series of reports showing alpha/beta power reductions during motor execution, motor preparation, and motor imagery (Neuper et al., 2006
). In addition, here we could show that the duration of the alpha/beta suppression increased as a function of the motoric complexity of the imagined actions, on a trial-by-trial basis (Figures 2
F and 3
F). Given the known temporal correspondence between actual and imagined movements (Jeannerod, 1994
; Parsons, 1994
), it appears that motor imagery unfolds in time as the actual movement would have done, and the alpha/beta suppression represents an index of this internally executed motor program. This temporally extended mechanism supporting motor imagery can be contrasted with the response-related burst of gamma power observed over the left precentral gyrus just before the subject flexed a finger of their right hand (Figure 4
F-right panel). This finding fits with the hypothesis that gamma oscillations might constitute a mechanism for efficient cortico-spinal communication (Brown et al., 1998
; Schoffelen et al., 2005
), emphasizing that transient surges of synchronous activity in the gamma band might be particularly relevant when individual stimulus-response mappings need to be selected and executed. Accordingly, the laterality and timing of the frontal gamma burst confirms the contribution of the primary motor cortex in motor execution, but not in motor imagery per se (de Lange et al., 2005
; Sauner et al., 2006
). It remains to be seen whether the disparity between beta and gamma responses in frontal areas is related to different control modes for imagined and executed movements. For instance, it is conceivable that actual movements might require the establishment of a temporally short processing window for precise delivery of motor commands and fast sampling of somatosensory feedback along cortico-spinal-cortical circuits (compatible with gamma oscillations), whereas imagined movements might impinge more heavily on slower fronto-parieto-frontal loops for the evaluation of the expected sensory consequences of a planned movement (Desmurget and Grafton, 2000
; Johnson et al., 2002
).
Suppression of Fronto-Central Alpha/Beta Oscillations Depends on the Laterality of the Imagined Hand Movement
We observed stronger alpha and beta power suppression over the right precentral gyrus when subjects were presented with drawings of left hands compared to right hands (Figures 2 and 3
-right panel). In contrast, the left precentral gyrus showed an equal alpha and beta power suppression for motor imagery of left and right hands (Figures 2 and 3
-left panel). In principle, the latter observation could be related to the fact that subjects prepared a button-press response with their right hand on each trial, and subtle differential imagery-related effects in the beta band may have been obscured by stronger response-related effects, leading to a saturation of power suppression. However, suppression saturation is not the only, and may not be the most likely explanation of the lack of differences over the left motor cortex. Namely, previous studies have shown that the left parietal and premotor cortex is equally involved in imagined movements of left and right hands, while the right parietal and premotor cortex is preferentially involved in imagined movements of the contralateral left hand (de Lange et al., 2006
; Parsons et al., 1998
; Stinear et al., 2006
). Also, the selection and preparation of actual motor responses exhibits the same assymetrical left-hemispheric dominance (Schluter et al., 1998
, 2001
; Verstynen et al., 2005
). In addition to these studies, here we could show that the stronger contribution of the right precentral gyrus to motor imagery of left hands is visible already 500 ms after the stimulus is presented (Figure 3
E), and as much as 1000 ms before the subject’s response. The difference in beta power suppression remained robust until the response was provided. This finding indicates that, in the right motor cortex, there was information discriminating between the visual presentation of a left or right hand already 1 s before the subject’s explicit reports. This observation provides empirical evidence for the – perhaps counter-intuitive – suggestion that the motor simulation evoked by the hand laterality judgment task is a confirmatory process, following an ‘educated guess’ by means of an initial implicit perceptual analysis (Parsons, 1994
). By the same token, one might wonder whether neural responses evoked by action observation, which are usually framed as an automatic resonance between perception and action (Rizzolatti and Craighero, 2004
), might be a different manifestation of this same implicit process, relying on the same oscillatory dynamics as motor imagery.
Occipito-Parietal Oscillatory Gamma Activity is Sustained During Motor Imagery
Following stimulus presentation, bilateral occipito-parietal cortex showed a robust power increase in the gamma band (Figure 4
). This modulation of cortical oscillatory activity peaked 100 ms after stimulus onset and was sustained throughout the trial, closely matching imagery times on a trial-by-trial basis (Figure 4
F-left panel). The strongest sources of the sustained gamma activity were identified around parieto-occipital sulcus. While there are several reports on transiently induced gamma responses, there are only a few other studies in humans reporting sustained gamma activity (Hoogenboom et al., 2006
). The anatomical location of the gamma response fits with the haemodynamic responses found in occipito-parietal cortex during motor imagery of hands (de Lange et al., 2005
; Johnson et al., 2002
), and it can be contrasted with the transient, response-locked left fronto-central increase in gamma power discussed above (Figure 4
F-right panel). The initial stimulus-locked burst of gamma power is likely driven by the stimulus presentation, and it falls in a frequency range consistent with earlier reports on gamma activity in humans (Adjamian et al., 2004
; Hoogenboom et al., 2006
; Osipova et al., 2006
). The sustained increase in gamma power may partly be a reflection of the sustained visual processing during the trial, as the stimulus remained on the screen during the complete duration of the trial. However, the tight coupling of the gamma power increase with the fronto-central beta suppression, at a specific time window during the trial, supports the hypothesis that the occipito-parietal sustained gamma response includes components directly relevant for imagery performance, as suggested earlier by the known specific responses of the middle portion of the intraparietal sulcus to motor imagery (de Lange et al., 2005
).
Frontal Beta Oscillations and Occipito-Parietal Gamma Oscillations are Functionally Coupled During Motor Imagery
There were long-range cross-frequency cerebral interactions, revealed as anti-correlations between precentral beta suppression and occipito-parietal gamma increase, during a specific time interval in the course of the imagined action (Figure 5
). This cross-frequency coupling was spatially confined (Figure 5
-left panel), ruling out concerns about volume conduction or cross-talk. Cross-frequency coupling has been little explored in human electrophysiological data (Jensen and Colgin, 2007
), and our results emphasize the relevance of this new method for studying long-range functional connectivity in humans. Physiologically, we propose that the increase in occipito-parietal neuronal gamma synchronization results in a stronger drive to down-stream regions (Jensen et al., 2007
; Salinas and Sejnowski, 2001
). This increase serves to engage the precentral regions resulting in decreased beta activity, resulting in the trial-by-trial anti-correlation. Anatomically, this potential mechanism is supported by the direct anatomical connections linking the dorsal portions of parietal and precentral regions (Matelli et al., 1998
). Functionally, the temporally extented nature of the coupling between posterior and precentral cortex is not compatible with models based on sequential and hierarchical information processing (Nishitani and Hari, 2002
). Rather, our results support the notion that motor planning relies on multiple iterations through the recurrent architecture of the parieto-frontal system (Burnod et al., 1999
).
Our results provide novel information about the oscillatory brain activity in posterior and frontal regions, as well as their interactions, during the mental simulation of an action. The presence of a spatially, temporally, and functionally specific coupling between frontal and occipito-parietal regions during motor simulations provides support and electrophysiological constraints to computational models of action control that postulates the presence of feed-forward predictive mechanisms requiring fronto-parietal interactions (Desmurget and Grafton, 2000
).
The authors declare that the research was conducted in the absence of any commercial or financial relationships that could be construed as a potential conflict of interest.
We would like to thank Pascal Fries, Rick Helmich, Eric Maris and Robert Oostenveld for constructive comments on the experimental design and methodological issues. This work was supported by the Netherlands Organization for Scientific Research (grants 864.03.007 awarded to OJ and 452.03.339 awarded to IT).
Robinson, S. E., Weinberg, H., Cheyne, D., Vrba, J., and Jantzen, K. J. (1997). Functional imaging of cerebellar activity during a simple differential reading task by whole-head magentoencephalography. Proceedings of the Third International Conference on Functional Mapping of the Human Brain. Copenhagen, Denmark.