1
Centre de Recherche CHU Ste-Justine, University of Montreal, Montreal, Quebec, Canada
2
The Rotman Research Institute, University of Toronto, Toronto, Ontario, Canada
Brain development carries with it a large number of structural changes at the local level which impact on the functional interactions of distributed neuronal networks for perceptual processing. Such changes enhance information processing capacity, which can be indexed by estimation of neural signal complexity. Here, we show that during development, EEG signal complexity increases from one month to 5 years of age in response to auditory and visual stimulation. However, the rates of change in complexity were not equivalent for the two responses. Infants’ signal complexity for the visual condition was greater than auditory signal complexity, whereas adults showed the same level of complexity to both types of stimuli. The differential rates of complexity change may reflect a combination of innate and experiential factors on the structure and function of the two sensory systems.
Infancy is a time of enormous changes in brain structure and function. For example, glucose metabolism rises (Chugani, 1998
) and brain volume shows a 4-fold increase during the first 4 years of life (Courchesne et al., 2000
). Increases in synaptic density are followed by a declining slope within this period (Huttenlocher and Dabholkar, 1997
), whereas myelination continues well into adolescence (Paus et al., 1999
).
The functional consequence of these changes should be reflected in the increasing processing capacities of the developing child. More precisely, the changes in functional responses are thought to represent an increase in the integration within local neural ensembles together with more precise re-entrant interactions between distal ensembles (Thatcher et al., 2007
; Fair et al., 2009
). The balance between local integration and distal segregation is a characteristic architecture for a complex system that has an optimal capacity for information integration (Tononi et al., 1994
). Thus, development can be conceived of as the movement of the brain towards a complex system. Measures of complexity may be a sensitive index of maturational changes in brain function. For example, a marked increase with age in complexity of the brain’s electrical resting state activity has been shown by (Meyer-Lindenberg, 1996
) using two measures of complexity, correlation dimensions and the Lyapunov coefficient. A recent study by McIntosh et al. (2008)
showed an increase in EEG signal complexity with maturation in pre-adolescent children. Critically, they showed that this increase in complexity was strongly correlated with more stable and accurate behavioural performance.
There does appear to be a general increase in brain signal complexity with maturation. However, the maturational rates of different neural systems are not uniform. For example, rates of neuroanatomical and functional development for the visual and the auditory systems are distinct. The subcortical auditory pathways seem to mature earlier compared to the visual subcortical system. Brainstem auditory evoked potential of a few milliseconds post stimulus can be measured from birth (Jiang et al., 2001
). Conversely, at the thalamocortical level, the tendency may be reversed. The geniculocalcarine tract (visual thalamocortical pathway) shows relative maturity at 5 months of age, whereas the maturation of the thalamic projections to the auditory cortex continues until 6 years of age (Yakovlev and Lecours, 1967
; Moore and Linthicum, 2007
). In addition, myelination begins earlier in the occipital lobe than in the temporal lobe (Yakovlev and Lecours, 1967
). Synapse density shows a rapid increase in the occipital cortex until about 8 months of age that is followed by a decline (Huttenlocher and Dabholkar, 1997
), whereas the synaptic density of the auditory cortex increases until 50 months before connections are pruned (Huttenlocher and Dabholkar, 1997
). Even at later ages of childhood, the time course of grey matter thickness change differs across brain regions (Giedd et al., 2006
). The differences in prenatal exposure of the sensory system to environmental stimulation may have an impact on the functional state. Human foetuses and newborns detect sound changes in frequencies (Draganova et al., 2005
). Auditory abilities in the early post-natal months include discrimination of musical features (Leppanen and Lyytinen, 1997
; Ceponiene et al., 2002
; Morr et al., 2002
), phonemic identity (Cheour et al., 1998
), and gap detection (Trehub et al., 1995
). By 8 months of age, infants already discriminate their native language better than any other languages (Kuhl, 2000
). On the contrary, intrauterine visual competences of the infant have not been well explored. Prematurely born infants show a visual evoked potential response that is not advanced after term compared to infants born at term (Roy et al., 1995
). The development of visual capacities is rapid in the first post-natal months. By 4 months of age, infants born at term show fixation/orientation abilities, saccades, binocular vision, and the visual fields are enlarged (Speeg-Schatz, 2007
). Infants of 4–6 months of age and on can segment objects from texture orientations (Atkinson and Braddick, 1992
; Burkhalter, 1993
; Norcia et al., 2005
), resulting in visuomotor behaviours development such as reaching and grasping capacities.
The neural response to visual and auditory stimuli evolve to show distinct ERP morphologies from infancy to adulthood (Lippe et al., 2007
). The adult visual ERP is composed of the N1, P1, and N2 whereas the adult auditory ERP is composed of the P1, N1, P2, and N2 (Ellemberg et al., 2003
). The maturation of visual and auditory evoked potentials have been widely studied using a black and white reversing stimuli and a broadband noise stimuli (Rotteveel et al., 1987
; Taylor and McCulloch, 1992
; Roy et al., 1995
; Pasman et al., 1999
; Ponton et al., 2000
). Simple reversing checkerboard stimuli of low spatial resolution evokes a reliable P1 and N2 as early as 1-month old. The N1 appears within the first 4 months and latencies and amplitudes of all components vary until adulthood (Crognale, 2002
; Lippe et al., 2007
). Auditory evoked potentials triggered by broadband clicks are characterized by a large positive followed by a negative component in the first months of age (Rotteveel et al., 1987
; Pasman et al., 1999
; Ponton et al., 2000
). Depending on the study, the auditory N1 has been reported to appear between 3 and 9 years of age (Tonnquist-Uhlen, 1996
; Ceponiene et al., 1998
; Pang and Taylor, 2000
; Wunderlich and Cone-Wesson, 2006
; Sussman and Steinschneider, 2009
) and the early P1 appears thereafter (Lippe et al., 2009
).
The developmental trajectories of the visual and the auditory systems cannot be compared directly through ERP responses because of morphological differences in the waveforms. Complexity measures, in this case, multiscale entropy (MSE) (Costa et al., 2002
), do not depend on these specific features and thus could allow for direct comparison between sensory modalities. The MSE measure involves calculating sample entropy of the signal for different temporal scales. It has an advantage over other measures of complexity in that it can be applied to shorter time series (e.g 100–200 data points) than other measures of complexity that require much more data.
We measured complexity of the signal across groups of children from 1 month to 5 years of age and young adults. Furthermore, we compared, within the same individual, the complexity of the signal in response to a visual (achromatic checkerboard) and to an auditory (broad band noise) stimulation. Spectral power of the brain signal is known to evolve with age (Lippe et al., 2007
). For comparison purposes, we calculated spectral power (SP) across age groups for the visual and the auditory conditions.
First, we hypothesised that the complexity of the signal increases with maturation. Second, we hypothesized that maximum complexity will be observed in the visual system as it undergoes more intensive maturational changes after birth compared to the auditory system.
Participants
Forty infants and children aged from 27 days to 5 years 6 months. Data from five participants were excluded from the original sample because they did not succeed in attending to both the visual and auditory stimuli, or because of excessive movement artefacts. Infants were separated into four age groups [1–2 months (n = 7), 2–8 months (n = 11), 9–24 months (n = 6), 24–66 months (n = 11)]. While the results reported here are essentially the same if age was treated as continuous for children and infant, the groupings were chosen to examine carefully the first year of age, where the most rapid perceptual development occurs, and to enable the comparison of visual and auditory responses within group. Finally, 20 adults aged between 20 to 30 years of age were also tested.
Developmental information was gathered from interviews and a developmental questionnaire completed by the parents. All subjects were born at term; they had no history of psychiatric or neurological illnesses, and had normal or corrected vision. An intellectual developmental scale was administered to all children by one experimenter and one observer. All subjects 0–24 months of age scored within the normal range (within a standard deviation of 15 from 100) on the Mental Development Index of the Bayley Scale of Infant Development, II Ed (Bayley, 1993
). All subjects from 2 years to 5 years 6 months obtained a global score within the normal range (within a standard deviation of 15 from 100) on the Stanford Binet Intelligence Scale, IV Ed (Thorndike et al., 1994
). Parents and adult participants signed the consent form authorized by the ethics, administrative and scientific committees from the Ste-Justine’s Hospital research centre and the University of Montreal.
Apparatus and Stimuli
Visual evoked potentials were measured in response to a black and white checkerboard stimulus with each square subtending a visual angle of 2°. Stimuli had a luminance of 40 cd/m2. Pattern-reversals were presented binocularly for 500 ms at a distance of 70 cm from the subject’s eyes subtended 38.5 × 38.5° of visual angle and were presented at a reversal rate of 1 Hz. Auditory evoked potentials were measured in response to 50 ms broad band noise (BBNs) presented in free-field binaurally to the participants in a soundproof room. The intensity was 70 dB SPL and the resolution, 16 bits. BBNs were delivered binaurally (Optimus XTS 24) located laterally at a distance of 30 cm from each of the subject’s ears. The inter-stimulus interval for all stimuli varied randomly between 1200 and 1400 ms. All stimuli were generated by a Dell GX 150 PC using E-Prime 2000 software (from Psychology Software Tools Inc. Pittsburgh).
Young infants were seated on their parent’s lap. Their attention was drawn to the screen (plain screen for the auditory protocol) by small objects held in front of the lower middle part of the screen by the experimenter. Adults were instructed to look straight ahead for the auditory protocol and to look at the center of the screen for the visual protocol. Following a procedure widely used in developmental EEG experiments (Roy et al., 1995
), the EEG was recorded only when the children were still and their gaze was focused on the screen centre. Recording was done with the 128 electrodes Electrical Geodesics System Inc. (Eugene, OR, USA); the reference was at the vertex and the impedances were maintained below 40 KΩ, as suggested by (Tucker, 1993
). The EEG signal was amplified and analog bandpass filtered from 0.1 Hz to 100 Hz. The signal was digitized at 250 Hz in 1024 ms epochs. A G4 Macintosh computer controlled data acquisition.
Off-Line Analyses
Off-line data pre-processing was performed with EEGLAB (http://sccn.ucsd.edu/eeglab/
) (Delorme and Makeig, 2004
). Data were digitally filtered with a 0.5 to 50 Hz bandpass filter. Some electrodes were excluded from the data analysis because of excessive artefacts. 115 electrodes remained for all subjects and averaged reference was computed. The continuous EEG recording was segmented into the auditory and visual (−100 to 488 ms) stimuli events. In addition, artefact removal was performed using independent component analysis (ICA). Each component was examined using its topography, power spectrum, and activity over time and trials. ICA based artifact removal and correction consisted of the following steps: (1) trials contaminated with excessive amplitudes were removed first (2) an ICA decomposition was performed on the remaining concatenated trials and (3) components carrying residual ocular and muscle artifacts, identified based both on topography and frequency, were removed from the data set. The number of rejected ICA components was not statistically different between groups. Sixty good trials were kept for each condition and participant.
MSE was used to estimate sample entropy at different time scales. Full details of the MSE measure and its relevance for the analysis of signal complexity are given in Costa et al. (2002
). The algorithm calculates sample entropy as a measure of regularity (predictability) of the signal at different scales. It involves two procedures: (1) coarse-graining of the time series and (2) calculating sample entropy for each coarse-grained time series. For scale t, the coarse-grained time series is constructed by averaging the data points within non-overlapping windows of length t. This procedure can be viewed as a smoother version of decimation. Sample entropy of each coarse-grained time series measures its regularity by evaluating the appearance of repetitive patterns. We first calculated single trial MSE using algorithm available at www.physionet.org/physiotools/mse/
with parameter values for pattern length (m) and similarity criteria (r) set to m = 2 and r = 0.5 respectively. The length of single trial time series was 125 time points. MSE was measured for four different time scales over 500 ms time windows. Subject and channel specific MSE estimates were obtained as mean across single trial MSE measures for scales 1–4, where scale 1 would be the raw time series and scale 4 the most temporally coarse (non-overlapping window of 4 data points, in other words 16 ms). MSE measures for scales >4 were not calculated because the corresponding coarse-grained time series were too short (<50 time points) for reliable sample entropy estimation. MSE curves were then averaged across all electrodes, as there were no strong spatial differences across the scalp in the MSE changes.
Spectral power distribution (SPD) across single trials was calculated using Fast Fourier Transform (FFT). Considering the known age-related differences in global signal power, the signal was first normalized (mean = 0, standard deviation = 1) in order to calculate relative contributions of different frequency bands to the total spectral power. The EEG power was calculated at 2, 4, 6, 8, 10, 12, 14–24, 26–40 Hz, for single trials within the visual and the auditory conditions and then averaged for each condition and for each subject.
Statistical assessment of maturational trends in MSE and SPD was performed using partial least squares (PLS) (Lobaugh et al., 2001
). PLS is a multivariate technique similar to canonical correlation, except that is maximizes the covariance between two data sets rather than the correlation. PLS was performed on data matrices consisting of subject measures such that rows represented subjects within age groups. The columns of the data matrix were either the measures for MSE or SPD. The data matrices were averaged within group and grand mean centered by column across all five age groups. The mean-centered matrices were then decomposed with singular value decomposition to identify the strongest effects. From the decomposition comes three new matrices:
(1) weights for the rows, which indicate a contrast that characterizes the differences between groups and/or tasks,
(2) weights for the columns, which gives the linear combination of either MSE scale or SP distribution that maximally relates to the contrast, and
(3) the singular value, which is the covariance between the contrast and the MSE or SP weights.
The statistical significance of the effects was assessed using permutation tests for the singular values. The test involves random reassignment of subjects to age groups and conditions and then redoing the PLS with the permuted data. The probability value is then derived from the number of times out of 500 the singular value from each permuted data set is greater than or equal to that of the original data.
The reliability of SP weights was determined with bootstrap estimation of confidence intervals, using 500 bootstrap samples. The singular vector weights for each SP coefficient were divided by the bootstrap estimated standard error, giving a bootstrap ratio. This is similar to a z-score if the distribution of singular vector weights is Gaussian (McIntosh and Lobaugh, 2004
). Bootstrap estimation was not necessary for the MSE scales as there was no variation in the reliability of differences at the different temporal scales.
Developmental Changes
Figure 1
shows the ERPs and topographical maps of the group averaged VEP (Figures 1
A,B) and AEP (Figures 1
C,D). The ERPs show the expected developmental changes in morphology, amplitude, and latency previously found with typical means of filtering (e.g., ocular corrections, trial removals). From a large positive wave, the morphology of the ERPs evolves beyond 5 years of age in both modalities. Topographical maps at peak latencies show the expected location of brain activity (Lippe et al., 2007
). The latency of the group average VEP decreased of 52 ms. Similarly, the latency of the group average AEP decreased of 56 ms. The dominant AEP positive component amplitude decreases from 2 to 5 years to adulthood, showing the developmental changes reported elsewhere (Lippe et al., 2009
). VEP and AEP developmental descriptions are detailed in Lippe et al. (2007
, 2009
).
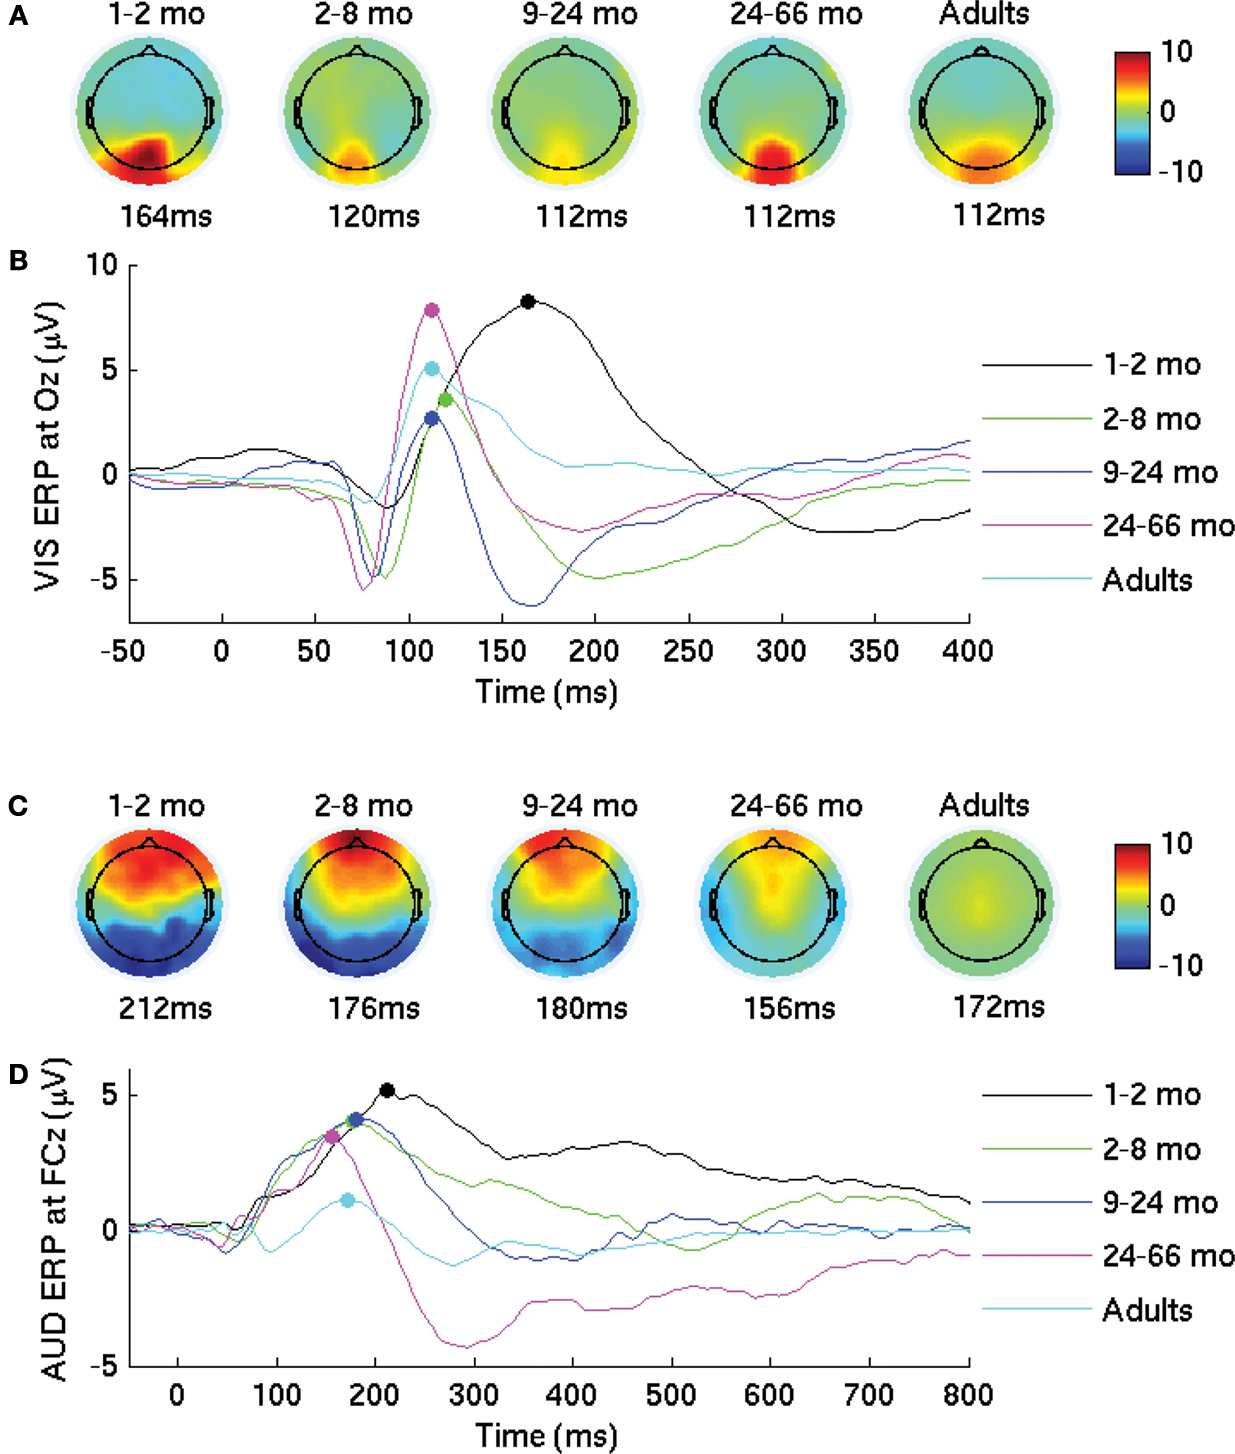
Figure 1.Visual and auditory evoked potentials. (A,B) Group average of the visual evoked potentials. (A) Topographies at the latency of the highest amplitude peak for each group. (B) Group average waveforms at electrode Oz. (C,D) Group average of the auditory evoked potentials. (C) Topographies at the latency of the highest amplitude peak for each group. (D) Group average waveforms at electrode FCz.
Complexity, as measured with MSE curves produced within each age group, are shown in Figure 2
. As expected, the MSE curves showed the greatest entropy for adults and the least for the youngest infants. Results confirmed a linear increase of MSE with age, regardless of the condition and of the temporal scale (p < 0.0001) (Figure 2
). The trend depicted in Figure 2
is also present if age is treated as a continuous measure and if the adult group is excluded from the analysis (correlations of age and MSE visual: r = 0.55, ± 0.1, 95% confidence interval; auditory, r = 0.60, ± 0.07 95% confidence interval).
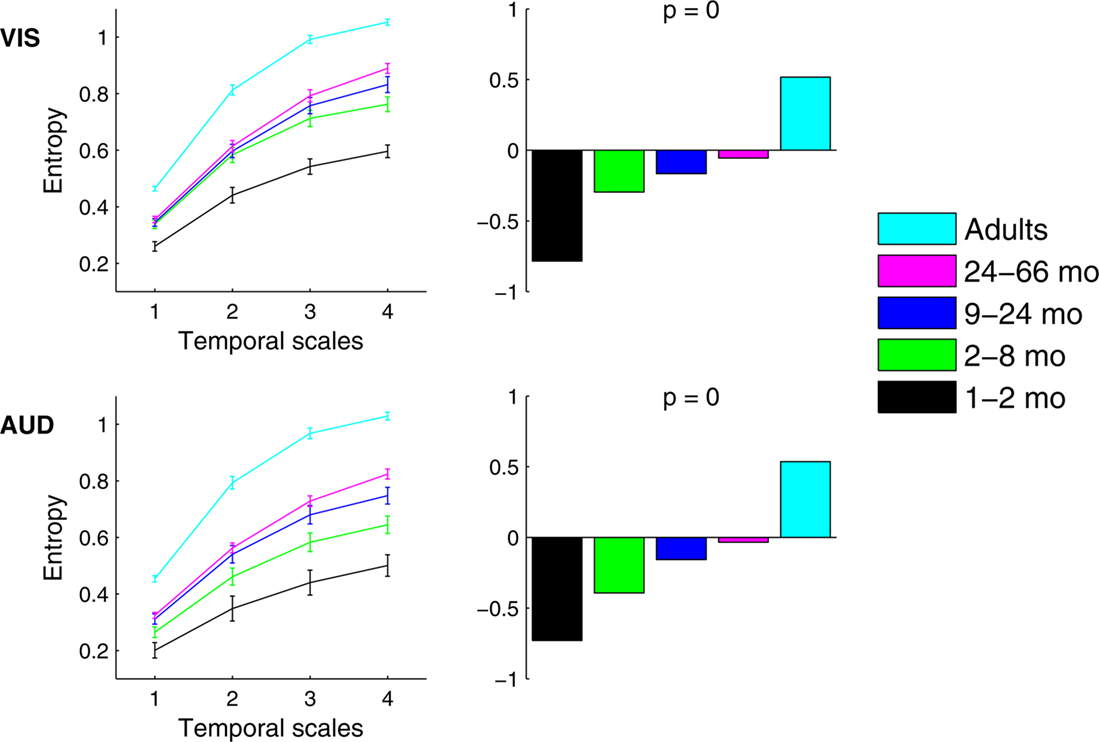
Figure 2. Age-related differences in multiscale entropy estimated separately in VIS and AUD conditions. Left panels show group mean entropy with error bars representing group standard errors. Right panels show PLS contrasts representing age-related increase in entropy. Contrasts for both conditions were significant and stably expressed across all temporal scales.
Developmental changes were also addressed by spectral power distribution (SPD). The power distribution was computed over all electrodes. The PLS results for the group differences were significant for the visual and the auditory conditions (p < 0.0001). As expected, SPD results showed similar developmental trends in the visual and the auditory conditions (Figure 3
). The bootstrap ratio figure on the right of Figure 3
shows the differences in SP between groups. The trends for auditory and visual SP were similar. Compared to all infants and children groups, adults showed reduced power at lower frequencies and increased power at higher frequencies. We also observed the maturational change of dominant spectral activity from theta to alpha and a gradual shift to the pattern of power distribution seen in adults (Marshall et al., 2002
). As with MSE, the trend for SPD is also present if age is treated as a continuous measure and if the adult group is excluded from the analysis (correlations of age and SPD visual: r = 0.82, ± 0.05, 95% confidence interval; auditory, r = 0.75, ± 0.15 95% confidence interval).
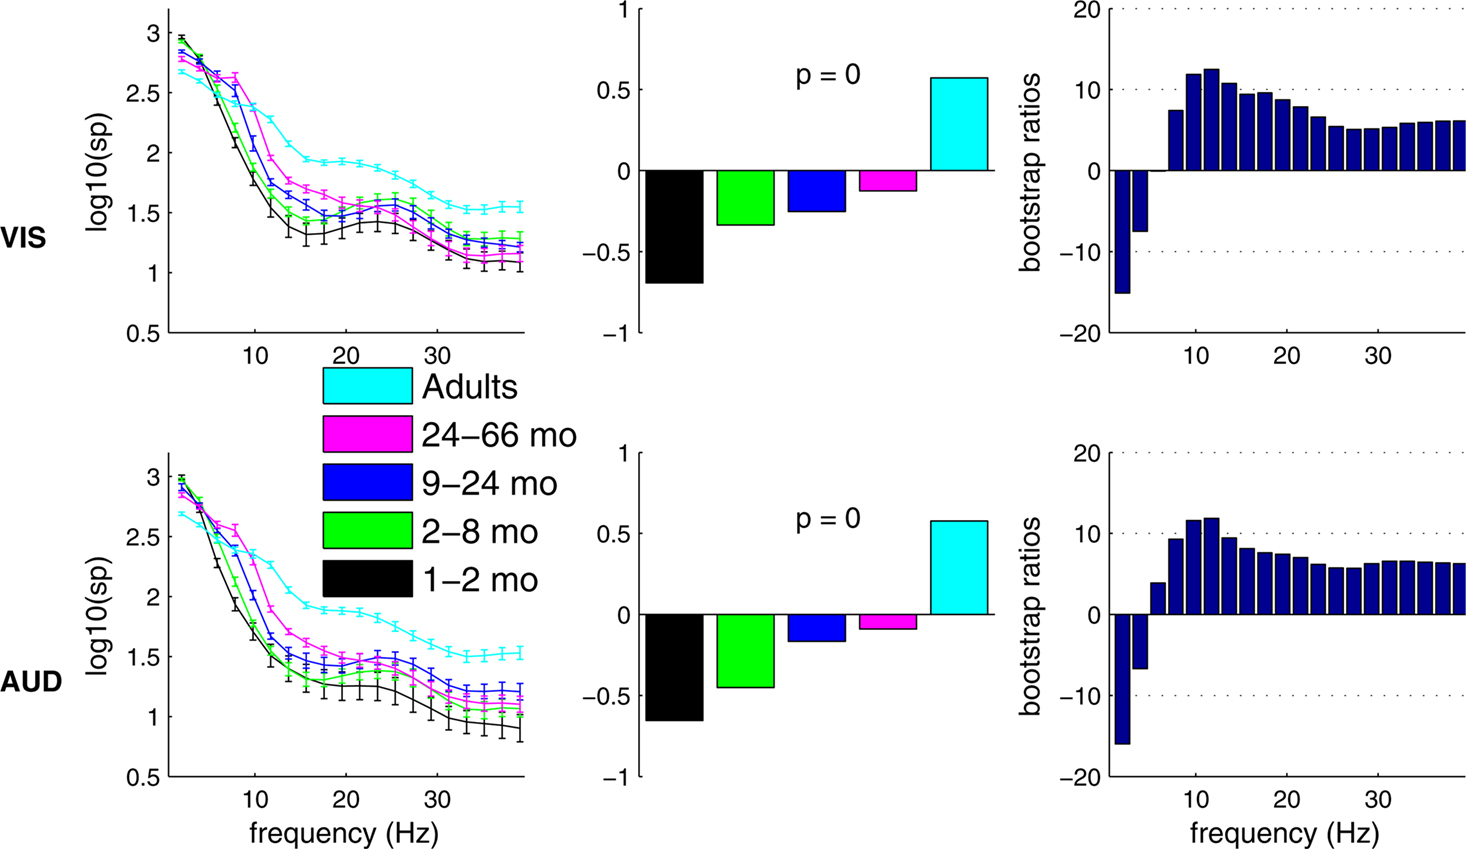
Figure 3. Age-related differences in spectral power distribution estimated separately in VIS and AUD conditions. Left panels show group mean log power with error bars representing group standard errors. Middle panels show PLS contrasts representing age-related change of spectral power distribution. Contrasts for both conditions were significant and stably expressed across most frequencies as shown in right panels. Results from both conditions replicate a known shift towards higher frequencies during maturation. Loss of stability around 6 Hz is likely due to an interaction between development-related increase in alpha rhythm frequency (Marshall et al., 2002
) and the overall redistribution of power towards higher frequencies.
Comparison of Auditory and Visual Responses
Multiscale entropy
We tested whether complexity of auditory versus visual responses changes across age groups. The PLS analysis was done both to assess the difference between auditory versus visual complexity across groups, and to evaluate the difference within each group. The overall test of the interaction of MSE across groups showed significant differences between the visual and the auditory conditions (p < 0.0001) by age. In fact, MSE was significantly higher in the visual condition across all temporal scales compared to the auditory condition between 2–66 months of age (Figure 4
). The differences between conditions were greatest at 2–8 months of age (p = 0.0005). In contrast, the complexity of auditory and visual responses could not be distinguished in adulthood (p = 0.21).
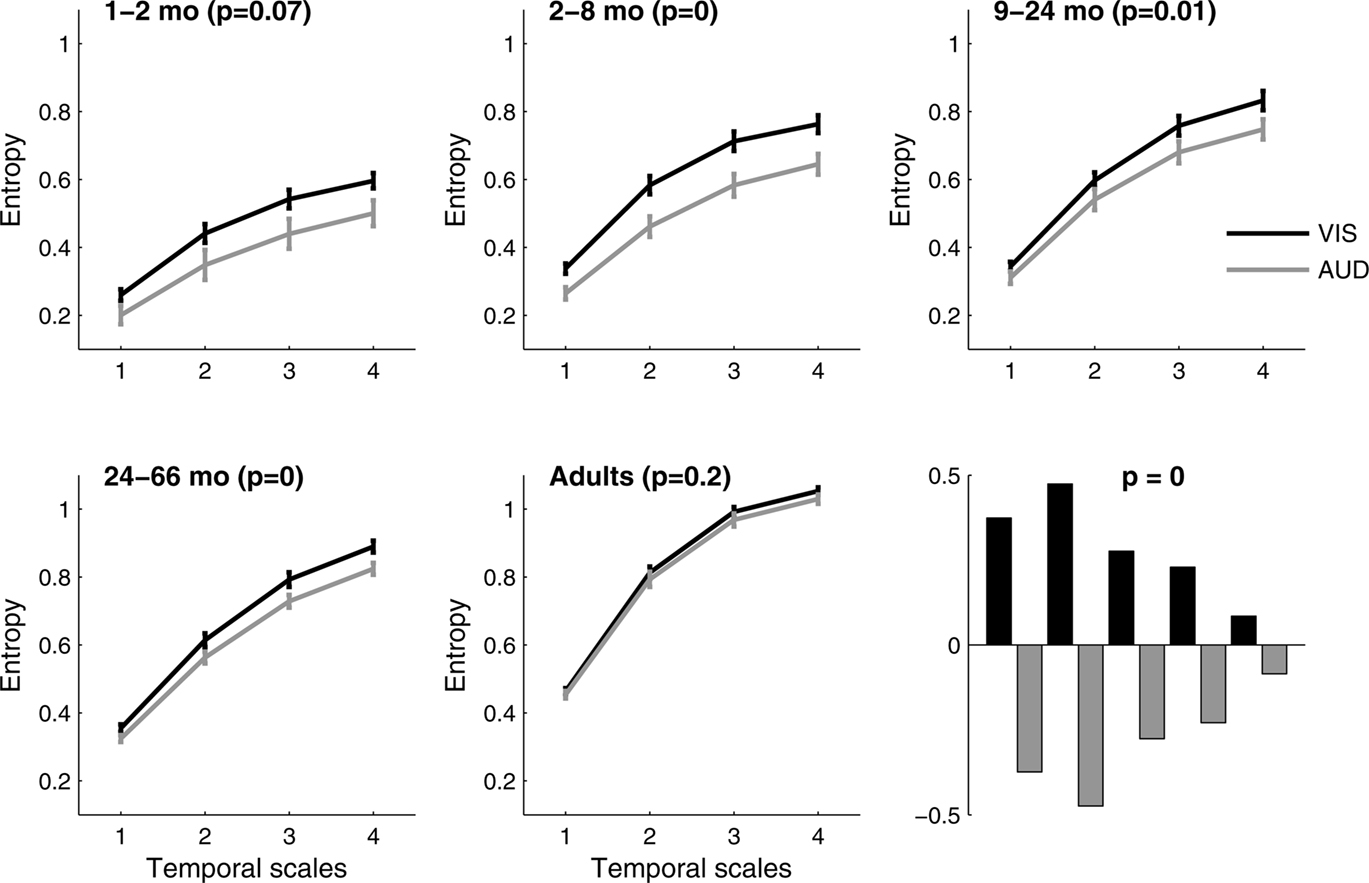
Figure 4. Multi scale entropy in VIS vs. AUD conditions across five age groups. Group mean entropy is shown for VIS and AUD conditions, together with group standard errors. The outcome of the significance testing for differences in MSE between two conditions within each group are given as p values. The adult group showed no significant differences between the two conditions. Bottom right panel shows PLS contrast between VIS and AUD conditions across all five groups simultaneously, after correcting for overall group differences. The contrast was significant and stably expressed across all four temporal scales. VIS condition exhibits higher MSE compared to AUD condition across all groups and the difference is most strongly expressed in the second group (2–8 months) in relation to other groups.
Spectral power
PLS analyses were also conducted on SP between the visual and the auditory conditions (Figure 5
). As with MSE, the interaction of group by auditory vs. visual response was significant (p < 0.0001). Differences between the visual and the auditory condition were found from 2 to 66 months, but were strongest within the 2- to 8-months group. Less low frequency SP and more high frequency SP were generally found in the visual condition. In contrast, adults did not show differences between the two conditions. Although differences were found for almost all frequencies, the 2- to 8-months group showed enhancement of the beta and the gamma bands (∼15–50 Hz) in the visual condition. From 24 to 66 months, differences were greatest for the alpha and beta band (∼10–18 Hz).
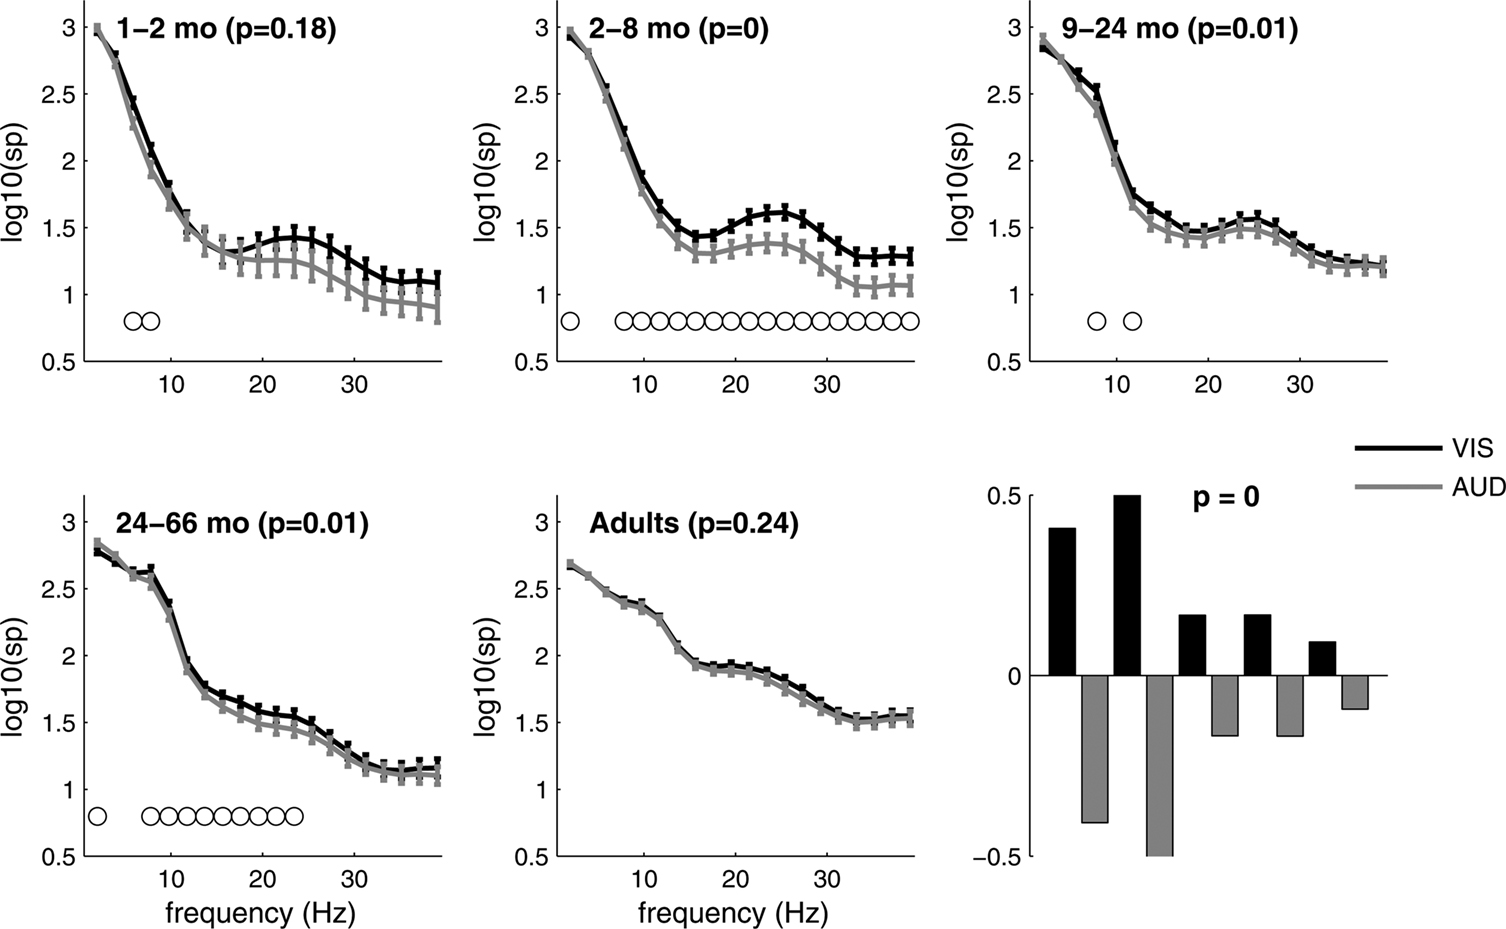
Figure 5. Spectral power distribution in VIS vs. AUD conditions across five age groups. Group mean log power in VIS and AUD conditions is displayed, together with group standard errors. The outcome of significance testing for differences in spectral power distribution between two conditions within each group are given as p-values. The circles above the frequencies indicate portions of the spectral power curve that differ between conditions based on a 99% confidence interval derived from bootstrap estimation. The adult group showed no significant differences between the two conditions. The bottom right panel shows PLS contrast between VIS and AUD conditions across all five groups simultaneously, after correcting for group differences. The contrast was significant and stably expressed across almost all frequencies. VIS condition exhibits less low and more high frequencies compared to AUD condition across all groups and the difference is most strongly expressed in the second group (2–8 months).
We also performed all the analyses excluding the adults and found that the MSE and SPD differences between ages and conditions were the same as we report above. This indicates that the statistical effects are not biased by the larger differences between adults and children.
The two hypotheses put forth in the introduction were supported. Complexity, measured with MSE, of the visual and auditory brain responses increases with maturation. This was complemented by maturational changes in spectral power distribution (SPD), where there was a reduction in low frequency and an increase in high frequency responses. We also observed that these maturation changes were not equivalent for auditory versus visual responses. While both responses showed increased complexity with maturation, visual responses showed greater complexity for infants and children, but responses were indistinguishable in adults. Our study thus confirms a distinct rate of maturation between brain sensory systems in infants and children, which are likely caused by structural and functional changes.
The global increase in complexity may be related to structural modification with development. At the local level, it may correspond to the increase arborization of dendritic trees (Moore, 2002
), and axons (Burkhalter, 1993
), enhanced connections of interneurones (Ali et al., 2007
), expression of receptors (Huang and Scheiffele, 2008
; Rula et al., 2008
) and synaptic stabilisation (Hua and Smith, 2004
). The changes in cell firing characteristics and synaptic potential durations may result in enhanced oscillatory capacities in the higher frequency range. At a distal level, the increased complexity may correspond to the myelin development (Paus et al., 1999
), brain region segregation (Gogtay et al., 2004
), and network formation, which enhance binding and integration capacities (Yu et al., 2008
).
The linear increase in complexity of the physiological signal contrasts with the nonlinear pattern of synaptic connection development. Complexity of the signal continues to increase during pruning of exuberant connections. The refinement of intra-areal connections may partly regulate the initial increases in complexity by enlarging the local repertoire. In the beta frequency band, long distance coherence has been found to diminish with age, whereas short distance coherence was found to increase (Thatcher et al., 2008
). Refined connections from selective pruning of long distance connections establishes more precise reciprocal linkages between local and distributed systems (Thatcher et al., 2007
), but also promotes local integration. In doing so, cortical development facilitates both optimized local and global computations. Gradual increases in interburst interval variation and inter neuronal synchronisation accompany the formation of long-range connections between neuronal clusters. The organisation of the networks into functionally coherent and sparsely interconnected clusters supports high levels of complexity as collective network activity forms (Fuchs et al., 2007
). Thus, both local and distal levels of development may be responsible for the increase in complexity with age.
Interestingly, differences in the complexity of the signal for the auditory and visual responses were found from 2 to 66 months only. At 1 month of age, complexity is similarly low for both the visual and the auditory conditions. One could posit that the intrauterine exposure to environmental sound and the advanced subcortical maturation of the auditory system could drive at the cortical level the full degree of complexity of neural activity, resulting in higher MSE in the first weeks of life.
From 2 to 66 months, complexity is greatest when in response to visual stimuli rather than auditory stimuli. Remarkably, this difference first increases to a maximum at 2–8 months, and then gradually seems to reduce, where in adults the complexity of response show no modality effect. The differential change in complexity across age may be related to the maturation of the network involved. From subcortical relay including the thalamus (lateral geniculate body), the visual information travels to the occipital cortex, surrounding extra striate areas, and the temporal and parietal lobes. The auditory information travels through multiple subcortical relays before it reaches the thalamus (median geniculate body), the temporal and ultimately the frontal lobe. In toddlers, functional responses to visual stimulation engage the occipital and parietal cortex, whereas non vocal auditory stimulation engage the temporal and the prefrontal cortex (Redcay et al., 2007
). Temporal and prefrontal cortices have a prolonged maturation compared to occipital and parietal cortices (Sowell et al., 2004
). Our results may thus reflect lobar maturation differences in children. The distinction in the complexity level from 2 to 66 months may result from the optic radiation myelination spurt, the higher degree of myelinated fibers in the occipital cortex, and the enhanced neuronal density. In that context, the greatest discrepancy in complexity between the visual and the auditory condition was found between 2–8 months of age. This period also corresponds to the marked beta and gamma SP increase in the visual conditions. Behaviourally, drastic improvements of visual competency such as perceptual acuity and sensitivity are also observed during this period (Maurer et al., 2007
).
Anyone who has observed infants behaviours notices their changing interests towards the environment with age. Most studies agree on the influencial role of stimulus complexity on infants’ fixation time. Infants seem to habituate faster to simple stimuli and their response to complex novel stimuli is enhanced (Kaplan and Werner, 1986
). Here, we did not address their fixation time but neural response to a stimulus. Nevertheless, one may argue that relative stimulus complexity could account for the differences in brain activity complexity between the visual and auditory systems during childhood. Indeed, stimulus complexity can modulate the evoked potential response. For example, at all ages higher spatial resolution and low contrast of visual stimuli trigger or enhance the N1, a VEP component which slowly develops during the first months (Hammarrenger et al., 2003
). To overcome the stimulus complexity issue, we used a low spatial resolution, high contrast and slow reversal rate visual stimulus, which is known to modulate mainly the P1, even in adults (Ellemberg et al., 2001
). Similarly, the auditory stimulus was not language related. Instead, the broadband noise engages all frequency representations (Riquelme et al., 2006
) at any age. In addition, the BBN was presented at a slow rate with a 200 ms random inter-stimulus interval variation to avoid habituation effect. It is thus unlikely that the increase complexity of the visual response over the auditory response found in infants and children was caused by relative differences in stimulus characteristics.
The enhanced complexity of the visual system during infancy has an important implication for the development of cognitive function. Visual information may particularly contribute to multisensory learning. For example, visual cues about speech articulation are known to enhance phoneme discrimination at 6 months of age (Teinonen et al., 2008
). Auditory contribution to multisensory learning is less clear during this period (Perone and Oakes, 2006
).
Complexity vs. Spectral Power
Changes in complexity seem to parallel SPD. As expected, the low vs. high ratio of SP diminished with age and the dominant frequency was found to shift from the theta to the alpha band. Alteration in SP can partly explain our MSE results as stronger low frequency activity signals could show relatively less variability and lower relative complexity. McIntosh et al. (2008)
increased the relative magnitude of the Fourier coefficients for low frequencies in the adult EEG data and found MSE estimates similar to children. However, jittering the phase of the Fourier coefficients while maintaining the relative magnitude changed the MSE estimates without altering the spectral density. Such results indicate that MSE captures the short-lived dependencies in neural signals that are not reflected in SP estimation. MSE and SP information are thus not redundant, but rather are complementary (Gudmundsson et al., 2007
).
Conclusion
In conclusion, the complexity of the infant brain’s signal increases in the context of structural changes such as synaptic exuberance and pruning. In addition, complexity distinguishes the maturation of auditory and visual sensory systems, which suggests such measure is sensitive to the maturational changes in infants, where behavioural responses cannot be easily recorded. Finally, the functional disparity we report between the two sensory systems may constrain the means by which cognitive developmental milestones are acquired.
The authors declare that the research was conducted in the absence of any commercial or financial relationships that could be construed as a potential conflict of interest.
Canadian Institute for Health Research (CIHR) for Sarah Lippé, and the JS McDonnell Foundation for Anthony Randal McIntosh.
Giedd, J. N., Clasen, L. S., Lenroot, R., Greenstein, D., Wallace, G. L., Ordaz, S., Molloy, E. A., Blumenthal, J. D., Tossell, J. W., Stayer, C., Samango-Sprouse, C. A., Shen, D., Davatzikos, C., Merke, D., and Chrousos, G. P. (2006). Puberty-related influences on brain development. Mol. Cell Endocrinol. 254–255, 154–162.
Gogtay, N., Giedd, J. N., Lusk, L., Hayashi, K. M., Greenstein, D., Vaituzis, A. C., Nugent, T. F. III, Herman, D. H., Clasen, L. S., Toga, A. W., Rapoport, J. L., and Thompson, P. M. (2004). Dynamic mapping of human cortical development during childhood through early adulthood. Proc. Natl. Acad. Sci. U.S.A 101, 8174–8179.