1
University of Toronto, Toronto, ON, Canada
2
Rotman Research Institute, Toronto, ON, Canada
3
University of Oregon, Eugene, OR, USA
4
University of Minnesota, St Paul, MN, USA
This study explored the neurophysiological correlates of executive function (EF) in young children from two different cultural backgrounds. Twenty European-Canadian and 17 Chinese-Canadian 5-year-olds participated in a go/no-go task, during which high-density electroencephalographic (EEG) data were recorded. No cultural group differences were observed in children’s behavioral performance on the task, but marked differences were revealed by ERP analyses, which focused on the amplitude and latency of the N2 waveform. Chinese-Canadian children showed larger (i.e., more negative) N2 amplitudes than European-Canadian children on the right side of the scalp on no-go trials, as well as on the left side of the scalp on go trials, and for all children, larger N2 amplitudes were associated with faster median reaction times. Source analyses of the N2 were consistent with the hypothesis that compared to European-Canadian children, Chinese-Canadian children showed more activation in dorsomedial, ventromedial, and (bilateral) ventrolateral prefrontal cortex. These findings reveal that EEG can provide a measure of cultural differences in neurocognitive function that is more sensitive than behavioral data alone; that Chinese-Canadian children show a pattern of hemispheric differentiation in the context of this task than that is more pronounced than that of age-matched European-Canadian children; that the asymmetrically lateralized N2 may be a reliable marker of both effortful inhibition (on the right) and effortful approach (on the left); and that the neural correlates of EF may vary across samples of healthy participants, even in children.
Executive function (EF) – the conscious control of thought and action – develops markedly during the preschool years, in parallel with maturation of prefrontal cortex (see Zelazo et al., 2008
for review). Most research on EF in children has been conducted with Western samples, but an emerging corpus of cross-cultural comparisons suggests that Asian children may perform better than Western children on measures of EF despite comparable, or worse, performance on other measures of cognitive function, such as theory of mind (e.g., Sabbagh et al., 2006
; Oh and Lewis, 2008
).
Correlations with culture are always difficult to interpret because of the numerous, often unmeasured, differences between groups, but the finding that Asian children sometimes display better EF than age-matched Western children is consistent with reports that Chinese parents expect their children to master impulse control at a relatively young age (e.g., Ho, 1994
; Wu, 1996
; Chen et al., 1998
), and that impulse control in daycare settings is more highly valued in China than it is in North America (Tobin et al., 1989
). It is also consistent with the finding that the 7-repeat allele of the dopamine D4 receptor gene (DRD4), which has been linked to behavior problems involving EF (e.g., Swanson et al., 1998
; Faraone et al., 2001
), is extremely rare in individuals from East and South Asia (Chang et al., 1996
).
The observation that children from different cultures may show differences in EF abilities raises the question of whether children’s brain function varies in systematic ways across cultures, and if so, to what extent. There is currently considerable interest in the specific neural correlates of EF (e.g., Bunge and Crone, 2009
), but as with behavioral research on this topic, nearly all of this work has been conducted with Western samples, and indeed, to date, there have been no published cross-cultural comparisons of these neural correlates. It seems plausible, however, that genetic and/or environmental influences associated with culture may be reflected not only in children’s behavior, but also in their neural function. Recent research on neural plasticity, for example, supports the suggestion that neural development is experience dependent (e.g., Neville, 1993
; Huttenlocher, 2002
), and indeed, interventions designed to promote EF have been found to produce changes in neural function related to EF (Olesen et al., 2004
; Rueda et al., 2005
).
One task that has been used to examine the neural correlates of EF in young children is the go/no-go task, in which children must respond on the majority of trials (go stimuli) but inhibit responding on certain trials (no-go stimuli) (e.g., Davis et al., 2003
). Event-related fMRI research comparing adults and school-age children on go/no-go-type tasks indicates that several regions of prefrontal cortex, including ventrolateral prefrontal cortex and anterior cingulate cortex (e.g., Bunge et al., 2002
; Durston et al., 2002a
,b
), play an important role in successful performance on this task. Electroencephalographic (EEG) recordings during performance on the task yield a well-studied ERP component, the N2, which in children is usually observed at medial-frontal sites between 250 and 500 ms following stimulus presentation (e.g., Davis et al., 2003
; Lamm et al., 2006
; Todd et al., 2008
). N2 amplitude has been found to be larger on successful no-go trials than on go trials in both adults (e.g., Eimer, 1993
; Falkenstein et al., 1999
) and children (e.g., Johnstone et al., 2005
; Lewis et al., 2006
) although this is not always the case (e.g., see Nieuwenhuis et al., 2003
for adults, and Davis et al., 2003
for children). Consistent with fMRI results, source analyses of the N2 in adults have identified cortical generators in both dorsomedial prefrontal cortex (e.g., dorsal anterior cingulate cortex Nieuwenhuis et al., 2003
) and ventral prefrontal cortex (Bokura et al., 2001
), and similar results have been obtained with children (e.g., Lamm et al., 2006
). In children, the location and activation strength of these sources appears to be related to individual differences in EF (Lamm et al., 2006
) and emotion regulation (Lewis et al., 2006
, 2008
).
An important consideration in neurocognitive research with children is hemispheric laterality. Bunge et al. (2002)
found that interference suppression was related to prefrontal activation in the opposite hemisphere in adults as in 8- to 12-year-old children. Moreover, ERP studies of the N2 component on No-go trials have revealed a right-lateralized topography in both young children (Todd et al., 2008
; see also Perez-Edgar and Fox, 2007
) and adults (Bokura et al., 2001
), although this pattern has not usually been reported in adults (e.g., Nieuwenhuis et al., 2003
).
In the present study, we used high-density (128-channel) EEG to compare the neural correlates of EF in young European-Canadian and Chinese-Canadian children as they performed a go/no-go task. We examined 5-year-old children because Western children at this age typically display considerable advances in EF and related skills (Zelazo et al., 2008
for review), and because the acquisition of these skills at this age appears to be critical for the transition to school, where demands on EF may be increased (e.g., Blair and Razza, 2007
). We focused on the N2 waveform and its estimated underlying sources, and expected to find evidence of cultural differences in neurocognitive function. As children from a Chinese background have been found to perform better on measures of EF than North American children, and may be more conscientious, we expected to find larger N2 (i.e., more negative) amplitudes for the Chinese-Canadian children than the same-age European-Canadian children. Although studies with school-age children generally report that N2 amplitude decreases with age across the school-age years and into adolescence, and that these decreases co-occur with continued improvements in EF (e.g., Lamm et al., 2006
), our prediction is based on studies showing larger N2 amplitudes to be associated with better EF within a single age group (e.g., Overtoom et al., 1998
, 2002
; Pliszka et al., 2000
; Liotti et al., 2005
). For example, Pliszka et al. (2000)
found larger N2 amplitudes for controls, as compared to children with ADHD, over right inferior frontal cortex on a go/no-go-type task. In addition, in light of evidence for the recruitment of right prefrontal cortex on the go/no-go task and other EF tasks, we expected to find a right-lateralized N2 on no-go trials, as well as right-lateralized source activation.
Participants
Participants were 37 English-speaking 5-year-olds (M age = 5.28 years, SD = 0.54, Range = 4.10–6.00), including 20 children (9 boys and 11 girls) from a European-Canadian background (M age = 5.38 years, SD = 0.41) and 17 children (5 boys and 12 girls) from a Chinese-Canadian background (M age = 5.18 years, SD = 0.65), who were recruited through a computerized database containing names of parents who have expressed interest in their child’s participation in research. Children from the two cultural groups did not differ in age, t(35) = 1.13, p > 0.26, or in the proportion of boys in the group, χ2(1, N = 37) = 0.36, p > 0.55. Chinese-Canadian children were second-generation immigrants from China and European-Canadian children were second-generation (or more) immigrants from Europe. Five of the European-Canadian parents and 15 of the Chinese-Canadian parents indicated that more than one language was spoken in the home. Most European-Canadian parents had post-secondary education (mothers 85%; fathers 65%) and were mostly employed in managerial and professional, clerical, sales, and entertainment occupations. All of the Chinese-Canadian parents had post-secondary education and were mostly employed in managerial and professional, sales, and industrial processing occupations. In addition, parents were administered an individualism–collectivism questionnaire (Triandis, 1995
), and no significant difference was found between the two cultural groups on either the individualism, F(1, 33) = 2.89, p < 0.10,  or collectivism, F(1, 33) = 0.00, p < 0.98,
  dimension. All children had normal or corrected-to-normal vision, and were free of any psychiatric diagnoses or medication. An additional 17 participants were tested but eliminated from the final analysis because (a) they refused to wear the EEG net (see below), n = 7, (b) they had fewer than 11 correct no-go trials that that were free of eye blinks or movement artifacts, n = 9, or (c) their data were not recorded due to technical difficulties, n = 1. Recruitment and all procedures were approved by the appropriate Research Ethics Board at the University of Toronto, in accord with the Canadian Tri-Council Policy Statement: Ethical Conduct for Research Involving Humans.
or collectivism, F(1, 33) = 0.00, p < 0.98, dimension. All children had normal or corrected-to-normal vision, and were free of any psychiatric diagnoses or medication. An additional 17 participants were tested but eliminated from the final analysis because (a) they refused to wear the EEG net (see below), n = 7, (b) they had fewer than 11 correct no-go trials that that were free of eye blinks or movement artifacts, n = 9, or (c) their data were not recorded due to technical difficulties, n = 1. Recruitment and all procedures were approved by the appropriate Research Ethics Board at the University of Toronto, in accord with the Canadian Tri-Council Policy Statement: Ethical Conduct for Research Involving Humans.Procedure
Children were given a brief introduction to the testing environment and the EEG system, and parental informed consent (and child assent) was obtained for all participants. The experimenter then applied a 128-channel HydroCel Geodesic Sensor Net to the child’s head, the child was seated in front of a computer monitor with the distance and alignment to the monitor controlled, and the go/no-go task was administered. This task, which was adapted from Durston et al. (2002b)
, was presented using E-Prime Version 1.2 (PST, Pittsburgh, PA, USA). On each trial, an animal stimulus (cow, horse, bear, pig, or dog) was presented at a central location on the screen. During a block of 10 practice trials (6 go, 4 no-go), the child was instructed to press a sticker-covered key on a keyboard as soon as they saw each animal (go stimuli) except for the dog (no-go stimulus). They were told not to press when they saw the dog. The practice block was repeated until children were correct on at least 9/10 trials. The task itself consisted of 144 trials divided into four blocks. In each block, 27 (75%) of the trials were go trials and 9 (25%) were no-go trials. This ratio encouraged a pre-potent tendency to respond. No-go trials were preceded by two, three, or four go trials. On each trial, a fixation point in the form of a “pokeball” appeared at a central location on the screen, along with a “ding” sound, and lasted 1500 ms. Next, an animal stimulus was presented for 1500 ms. In order to increase children’s motivation to complete the task, feedback was given following each response. Positive feedback following correct responses was provided by a bright yellow smiley face, and negative feedback following incorrect responses, omitted responses, and responses that occurred after the 1500 ms stimulus window, was provided by a red frowning face. Feedback stimuli were shown for 500 ms (see Figure 1
for trial structure). Accuracy on go and no-go trials was recorded, as was reaction time (RT) on correct go trials.
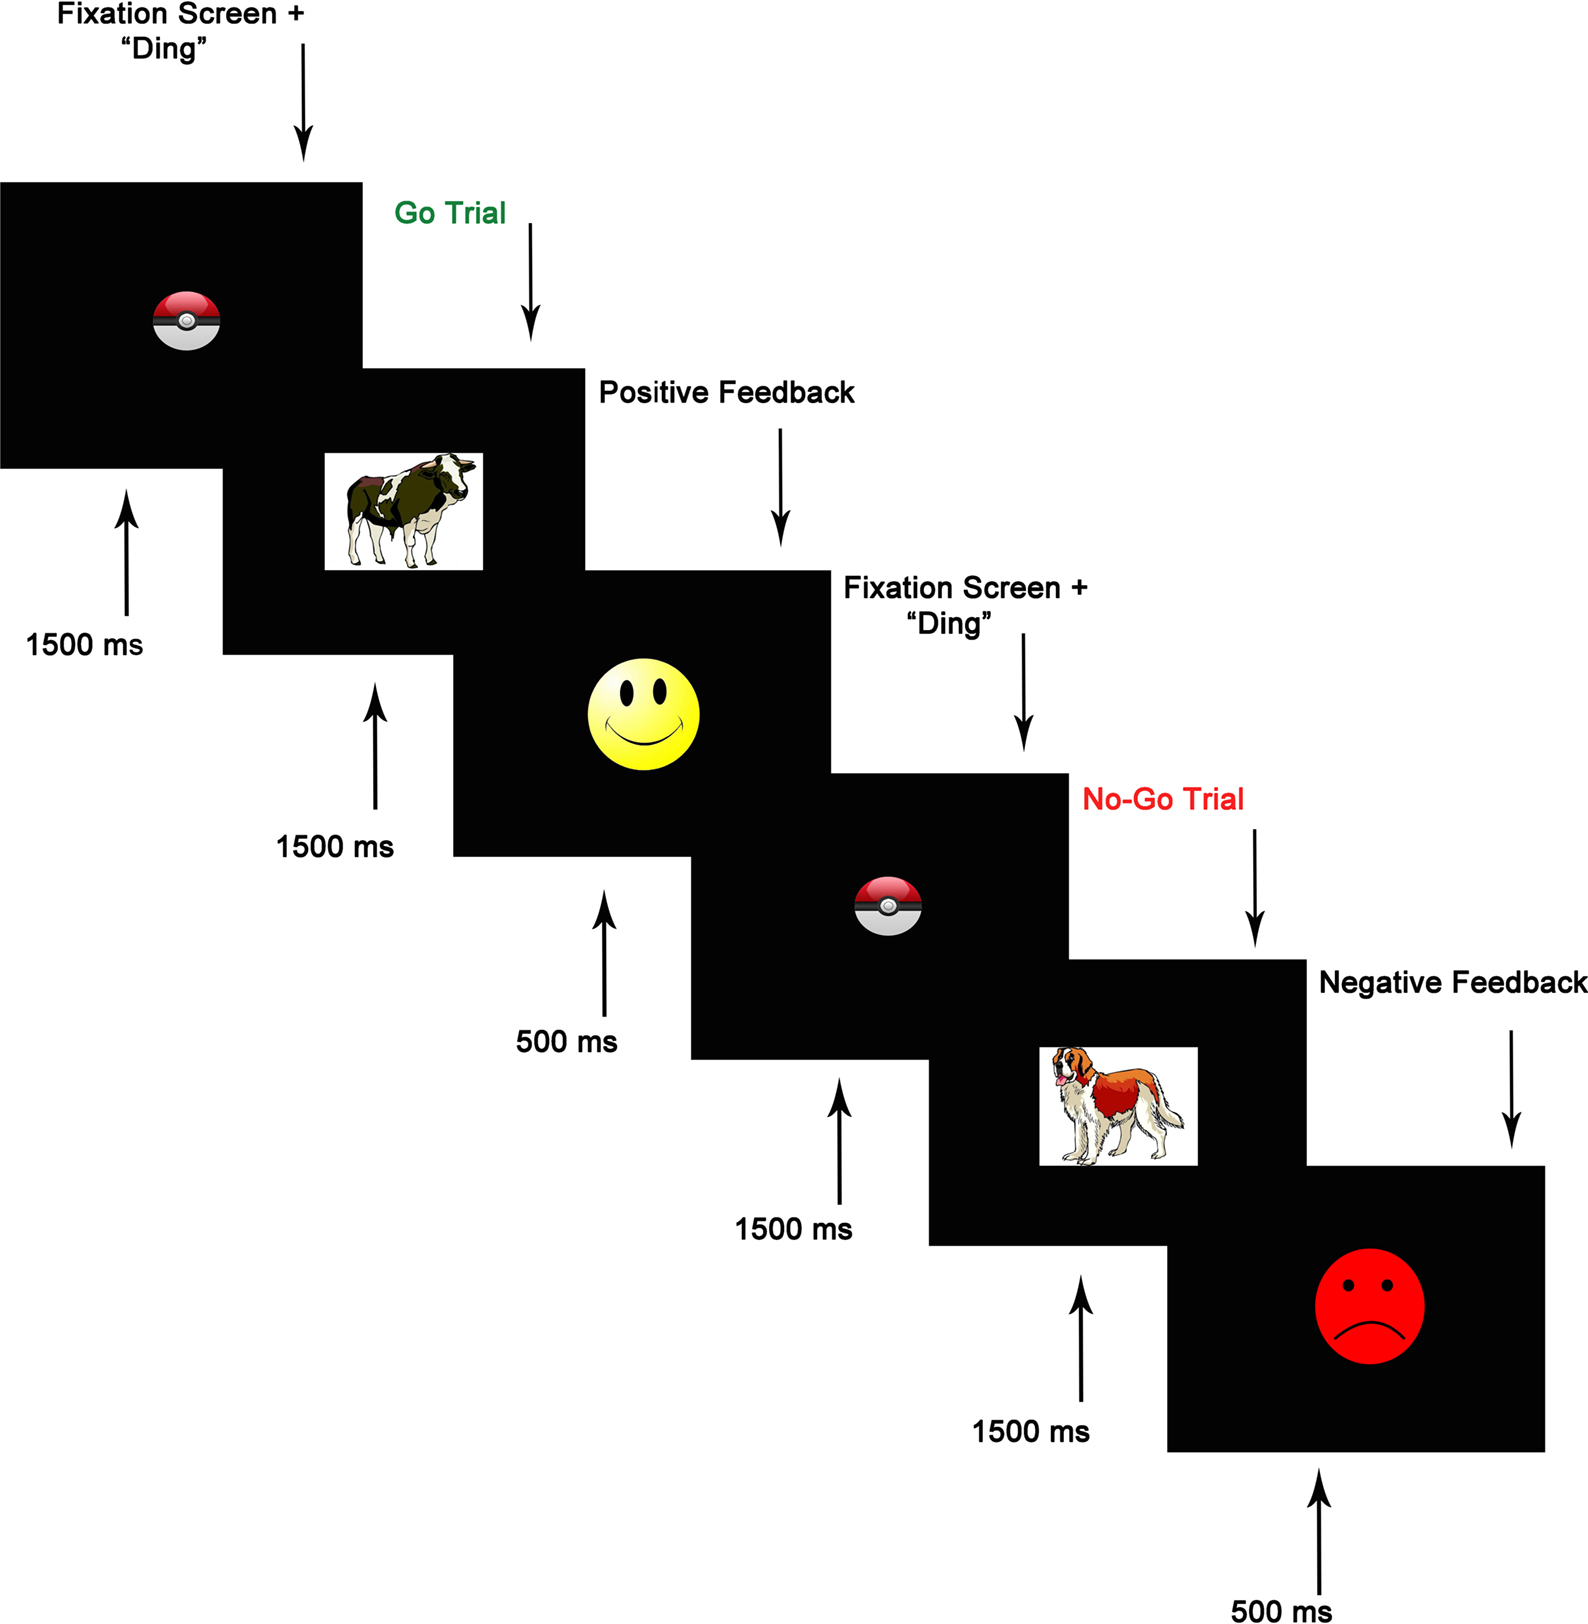
Figure 1. Go/no-go task trial structure.
During the go/no-go task, EEG data were sampled at 1000 Hz using EGI Netstation 4.1.2 software (EGI, Eugene, OR, USA), and impedances were maintained below 40 kΩ. Electrodes were referenced to Cz during recording. Editing of the EEG for eye blinks, eye movements, movement artifacts, signals exceeding 200 μV, and fast transits exceeding 100 μV was carried out offline, and all trials containing more than 20% artifacts were eliminated from analysis. During averaging, all data were re-referenced to the average reference of all 128 sites (Tucker et al., 1993
). Data were filtered using a Finite Impulse Response 1–30 Hz bandpass filter. Stimulus-locked data were segmented into epochs ranging from 200 ms prior to stimulus onset to 1000 ms after onset. ERP data from correct trials (go and no-go) were baseline corrected using the first 200 ms of each segment. The N2 was then coded as the largest negative deflection after the P1 with a fronto-central topography and a latency of 250–500 ms post-stimulus. N2 latency was recorded as the latency from stimulus onset to the peak identified in the amplitude analysis. The mean number (and SD) of trials contributing to the N2 was 70.92 (18.93) for go trials and 23.81 (5.98) for no-go trials, and there were no differences in trial count between cultural groups for either go trials, t(35) = −1.02, ns, or no-go trials, t(35) = −0.07, ns.
For all analyses reported below, the same pattern of results was obtained when gender was included as a variable, and there were no effects of (or interactions involving) gender. For all ERP analyses, including source analyses, the same pattern of results was obtained when behavioral performance (no-go accuracy cost and median RT) and trial count were included as covariates. In addition, a regression, with number of languages spoken in the home as a predictor, was conducted on the major variables of interest and no significant results were obtained (0.26 < p < 0.96).
Behavioral Results
To account for possible group and individual differences in aspects of performance not specific to EF, we created a baseline-adjusted measure of the extent to which individuals erred on no-go relative to go trials. This measure, no-go accuracy cost, was calculated as the difference between the proportion of correct go trials and the proportion of correct no-go trials, divided by the proportion of correct go trials. No-go accuracy cost provides a more pure measure of EF than does simple no-go accuracy, but the same pattern of results was obtained using no-go accuracy, except that no-go accuracy cost scores were negatively correlated with median RT (r = −0.42, p < 0.01), indicating a speed-accuracy tradeoff in this sample, whereas there was no relation between simple no-go accuracy and median RT, r = 0.12. Separate one-way ANOVAs found no cultural group differences in no-go accuracy cost scores, F(1, 35) = 0.84, ns,  (Chinese M = 0.01, SE = 0.03; European M = 0.04, SE = 0.02) or median RT, F(1, 35) = 0.16, ns,
  (Chinese M = 744.38 ms, SE = 25.47; European M = 758.20, SE = 23.48). The absence of cultural group differences in behavioral performance facilitates interpretation of any differences to emerge from ERP analyses.
(Chinese M = 0.01, SE = 0.03; European M = 0.04, SE = 0.02) or median RT, F(1, 35) = 0.16, ns, (Chinese M = 744.38 ms, SE = 25.47; European M = 758.20, SE = 23.48). The absence of cultural group differences in behavioral performance facilitates interpretation of any differences to emerge from ERP analyses.ERP Analyses
An examination of the scalp topo-maps of the grand-averaged data revealed that the N2 component was right-lateralized on no-go trials, consistent with previous studies with children and adults (e.g., Bokura et al., 2001
; Todd et al., 2008
), but also that N2 amplitudes were larger for go trials than for no-go trials over the left frontal part of the scalp. Therefore, rather than create no-go minus go difference waveforms, we compared N2 waveforms for go and no-go trials as a function of laterality. Data were averaged across a right-hemisphere fronto-central cluster of electrodes that included HydroCel electrodes 112, 111, 118, 117, and 124 (encompassing F4 in the 10–20 System), and across a left-hemisphere fronto-central cluster that included electrodes 13, 29, 20, 28, and 24 (encompassing F3); see Figure 2
.
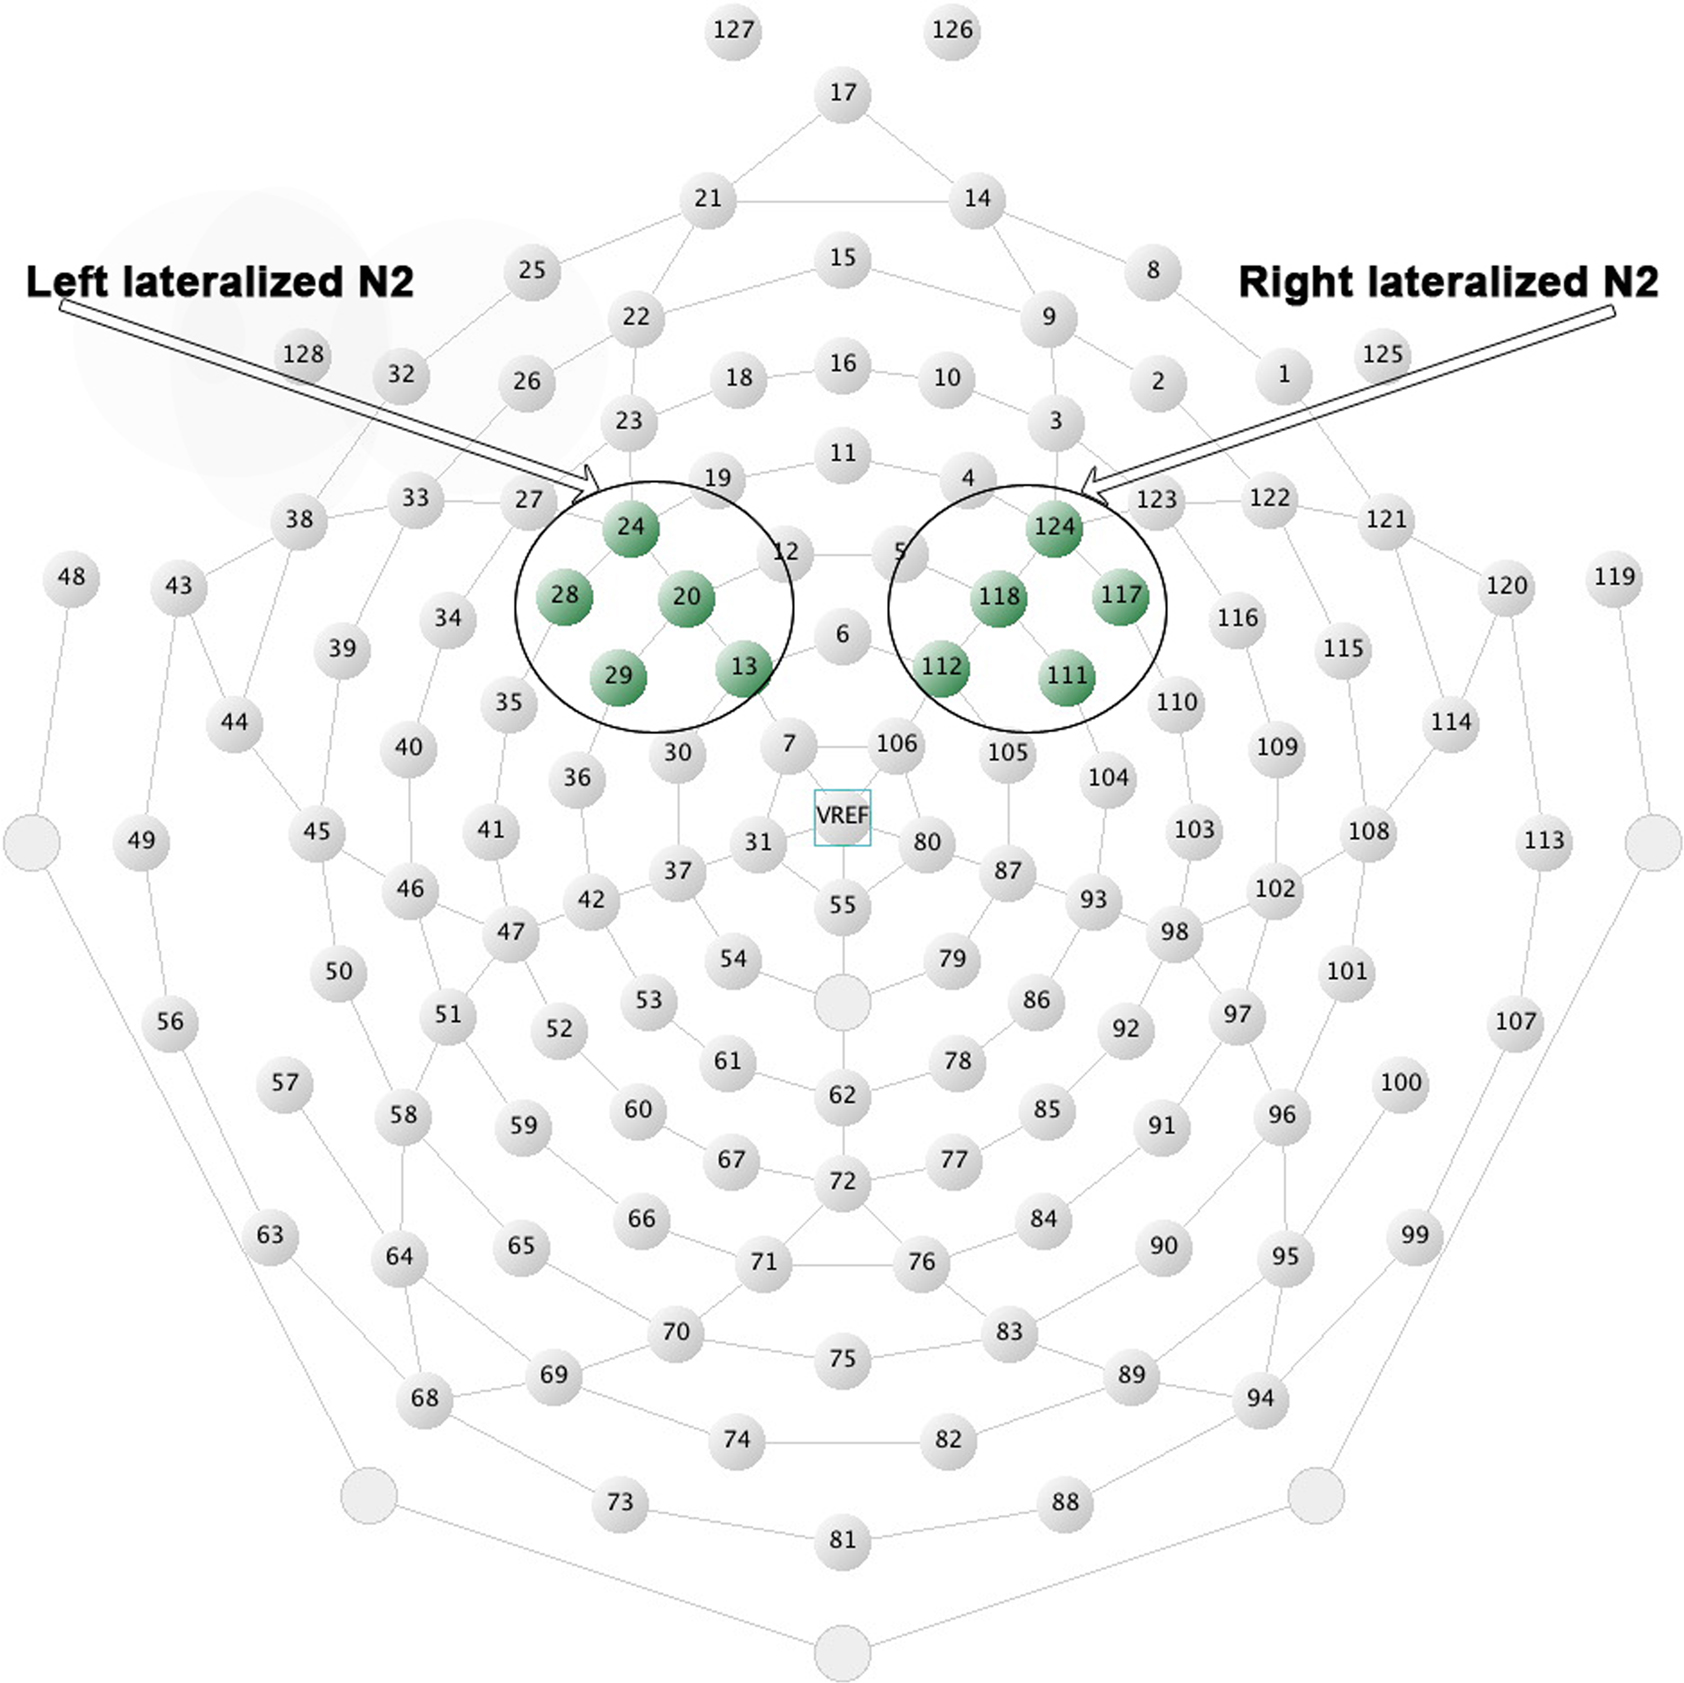
Figure 2. Hydrocel electrode sites contributing to right- and left-lateralized N2 waveforms and data.
N2 results
N2 amplitudes and latency were analyzed using an ANOVA with cultural group as a between-subjects variable and go/no-go condition (go trials, no-go trials) and laterality (right, left) as within-subjects variables. Post hoc pairwise comparisons with Bonferroni adjustments were carried out for all significant interactions. Figure 3
presents the grand-averaged waveforms of the N2 component at the corresponding pair of left-right electrode sites that best illustrate the effects reported below: electrode site 112 (on the right) for the no-go condition and electrode site 13 (on the left) for the go condition. Waveforms are also shown for all other sites in the montage.
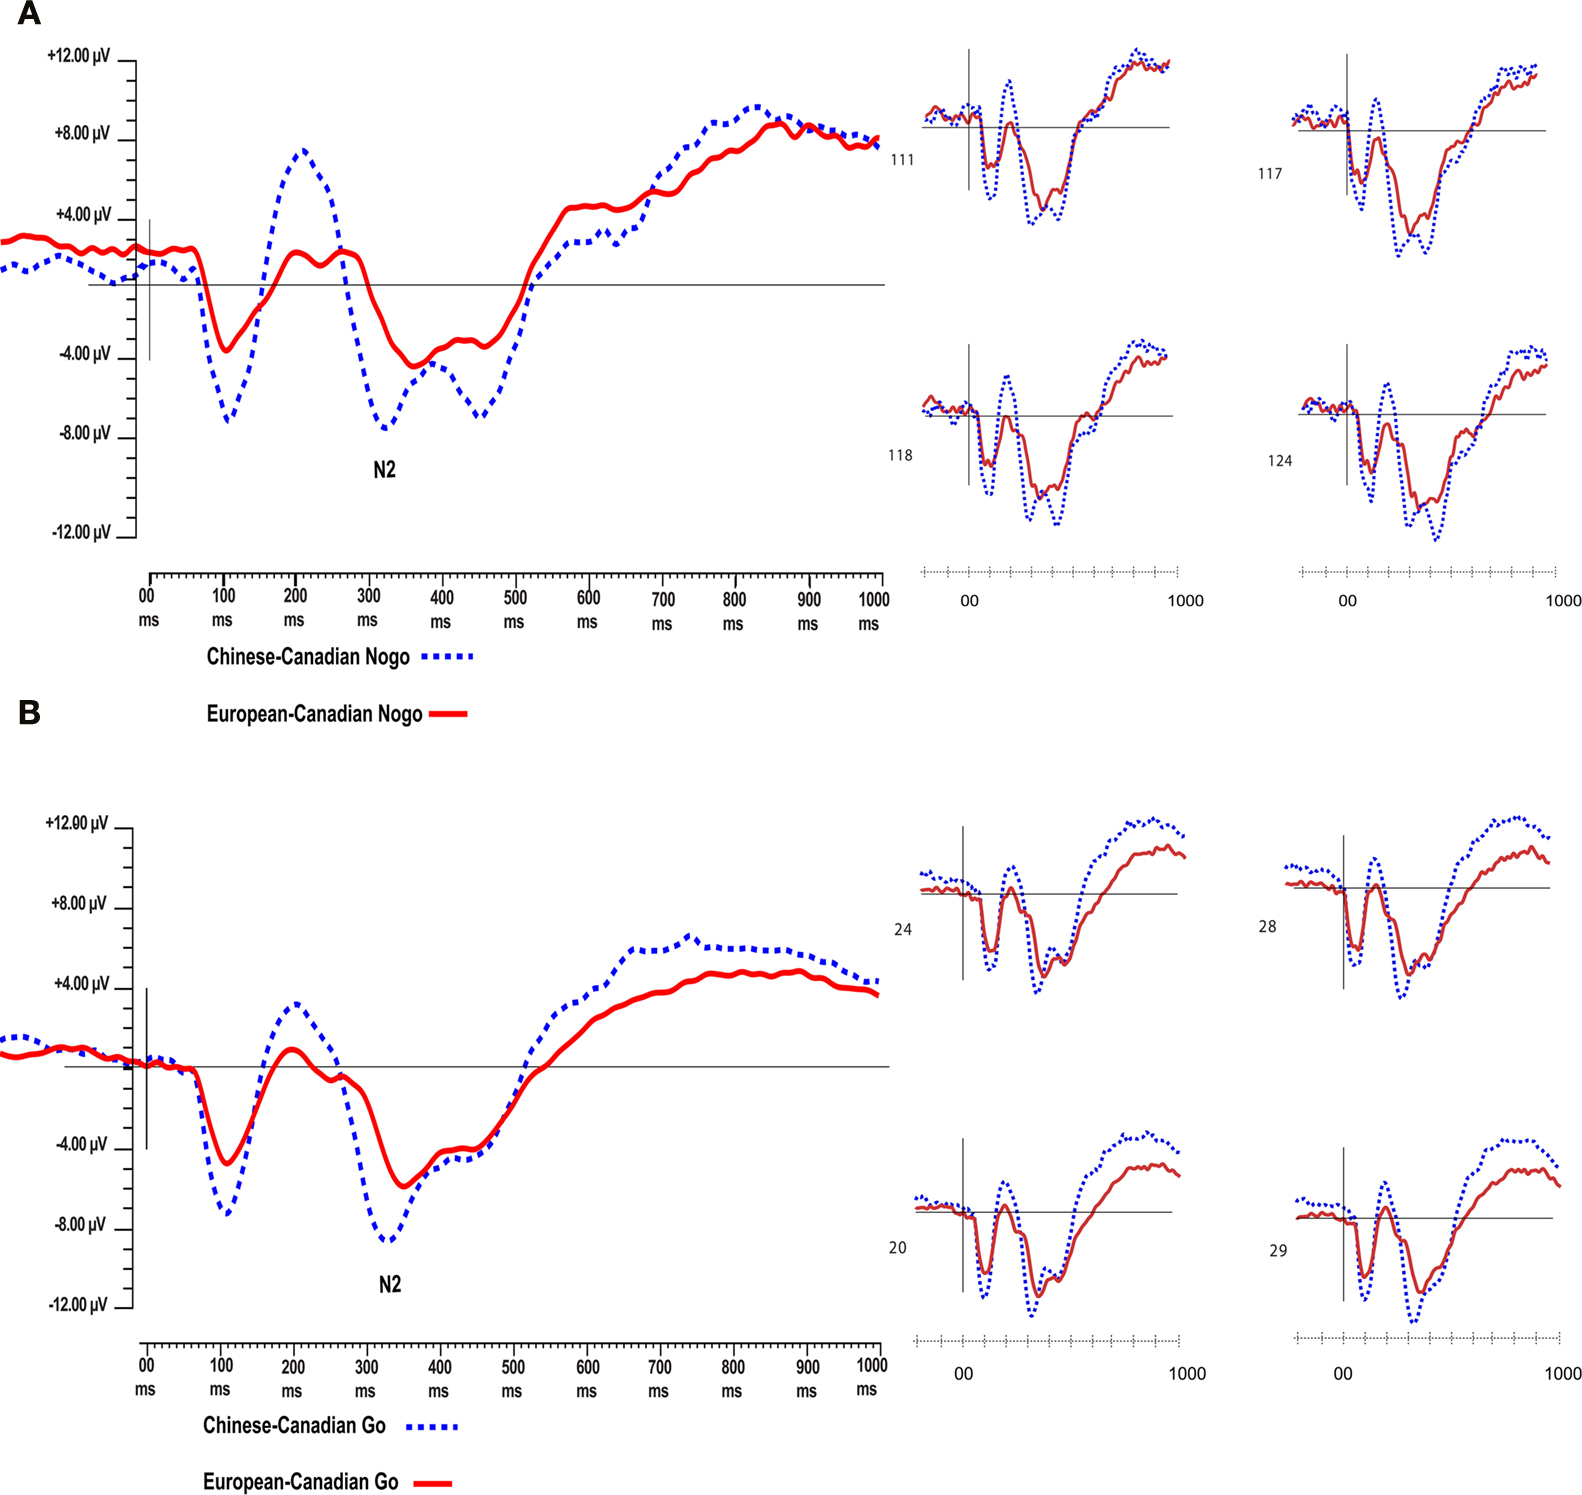
Figure 3. Stimulus-locked grand-averaged ERP waveforms for the two cultural groups. (A) Data from fronto-central electrode site 112 (right-hemisphere) for the no-go condition, accompanied by waveforms from electrode sites 111, 117, 118, 124 (right-hemisphere) for the no-go condition. (B) Data from fronto-central electrode site 13 (left-hemisphere) for the go condition, accompanied by waveforms from electrode sites 24, 28, 20, 29 (left-hemisphere) for the go condition.
No significant effects or interactions were found for N2 latencies ( in all cases). The ANOVA on N2 amplitudes revealed a marginally significant main effect for cultural group, F(1, 35) = 3.78, p < 0.06,
  (Chinese M = −6.01 μV, SE = 0.89; European M = −3.67 μV, SE = 0.82), and a significant effect of laterality, F(1, 35) = 15.05, p < 0.001,
  (Right M = −5.72 μV, SE = 0.65; Left M = −3.95 μV, SE = 0.64). These effects were qualified by a significant Go/no-go condition × Laterality interaction, F(1, 35) = 110.64, p < 0.001,
  and a significant Cultural group × Go/no-go condition × Laterality interaction, F(1, 35) = 5.40, p < 0.05,
  Post hoc tests examining the effect of cultural group revealed that Chinese-Canadian children showed larger (i.e., more negative) N2 amplitudes than European-Canadian children on no-go trials on the right side of the scalp, p < 0.05 (Chinese M = −9.13 μV, SE = 1.14; European M = −5.79 μV, SE = 1.05; Figure 4
A), as well as on go trials on the left side of the scalp, p < 0.05 (Chinese M = −7.66 μV, SE = 0.96; European M = −4.59 μV, SE = 0.89; Figure 4
B), but that there were no group differences on no-go trials on the left or on go trials on the right. The three-way interaction reflected the fact that Chinese-Canadian children showed a stronger effect of laterality on no-go trials
Post hoc tests examining the effect of cultural group revealed that Chinese-Canadian children showed larger (i.e., more negative) N2 amplitudes than European-Canadian children on no-go trials on the right side of the scalp, p < 0.05 (Chinese M = −9.13 μV, SE = 1.14; European M = −5.79 μV, SE = 1.05; Figure 4
A), as well as on go trials on the left side of the scalp, p < 0.05 (Chinese M = −7.66 μV, SE = 0.96; European M = −4.59 μV, SE = 0.89; Figure 4
B), but that there were no group differences on no-go trials on the left or on go trials on the right. The three-way interaction reflected the fact that Chinese-Canadian children showed a stronger effect of laterality on no-go trials  than did European-Canadian children on go trials
in all cases). The ANOVA on N2 amplitudes revealed a marginally significant main effect for cultural group, F(1, 35) = 3.78, p < 0.06, (Chinese M = −6.01 μV, SE = 0.89; European M = −3.67 μV, SE = 0.82), and a significant effect of laterality, F(1, 35) = 15.05, p < 0.001, (Right M = −5.72 μV, SE = 0.65; Left M = −3.95 μV, SE = 0.64). These effects were qualified by a significant Go/no-go condition × Laterality interaction, F(1, 35) = 110.64, p < 0.001, and a significant Cultural group × Go/no-go condition × Laterality interaction, F(1, 35) = 5.40, p < 0.05, Post hoc tests examining the effect of cultural group revealed that Chinese-Canadian children showed larger (i.e., more negative) N2 amplitudes than European-Canadian children on no-go trials on the right side of the scalp, p < 0.05 (Chinese M = −9.13 μV, SE = 1.14; European M = −5.79 μV, SE = 1.05; Figure 4
A), as well as on go trials on the left side of the scalp, p < 0.05 (Chinese M = −7.66 μV, SE = 0.96; European M = −4.59 μV, SE = 0.89; Figure 4
B), but that there were no group differences on no-go trials on the left or on go trials on the right. The three-way interaction reflected the fact that Chinese-Canadian children showed a stronger effect of laterality on no-go trials than did European-Canadian children on go trials 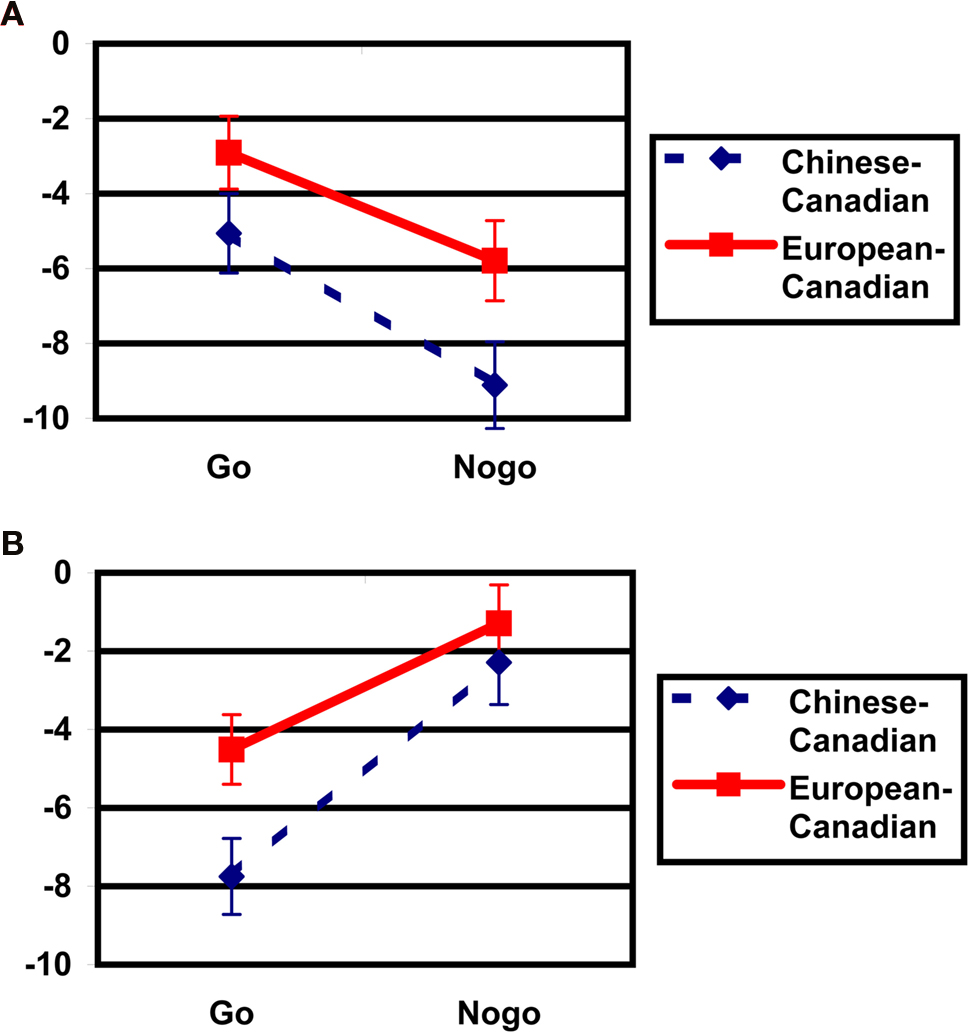
Figure 4. Cultural group differences in N2 amplitudes (μV) by go/no-go condition. (A) Mean amplitudes for the right-hemisphere fronto-central cluster of electrodes (Hydrocel electrodes 112, 111, 118, 117, and 124). (B) Mean amplitudes for the left-hemisphere fronto-central cluster of electrodes (Hydrocel electrodes 13, 29, 20, 28, and 24).
N2 amplitude lateralization scores
To assess the degree of lateralization of the N2, right-hemisphere N2 amplitudes were subtracted from left-hemisphere N2 amplitudes, and then these difference scores were analyzed using an ANOVA with cultural group as a between-subjects variable and go/no-go condition as a within-subjects variable. There was a main effect of go/no-go condition, F(1, 35) = 110.64, p < 0.001,  and a Cultural group × Go/no-go condition interaction, F(1, 35) = 5.4, p < 0.05,
  Examination of means revealed that for both cultural groups, left-minus-right difference scores were positive for no-go trials (Chinese M = 6.98, SE = 0.98; European M = 4.39, SE = 0.91), reflecting larger (i.e., more negative) amplitudes on the right, and negative for go trials (Chinese M = −2.57, SE = 0.72; European M = −1.72, SE = 0.67), reflecting larger (i.e., more negative) amplitudes on the left. Pairwise comparisons indicated that the effect of go/no-go condition was significant for both cultural groups, but that the size of this effect was larger for the Chinese-Canadian participants,
  than for the European-Canadian participants,
  These findings suggest that the N2 was more strongly lateralized (to the left for go trials and to the right for no-go trials) for the Chinese-Canadian participants.
and a Cultural group × Go/no-go condition interaction, F(1, 35) = 5.4, p < 0.05, Examination of means revealed that for both cultural groups, left-minus-right difference scores were positive for no-go trials (Chinese M = 6.98, SE = 0.98; European M = 4.39, SE = 0.91), reflecting larger (i.e., more negative) amplitudes on the right, and negative for go trials (Chinese M = −2.57, SE = 0.72; European M = −1.72, SE = 0.67), reflecting larger (i.e., more negative) amplitudes on the left. Pairwise comparisons indicated that the effect of go/no-go condition was significant for both cultural groups, but that the size of this effect was larger for the Chinese-Canadian participants, than for the European-Canadian participants, These findings suggest that the N2 was more strongly lateralized (to the left for go trials and to the right for no-go trials) for the Chinese-Canadian participants.N2 amplitudes: relations with behavioral performance
A total of eight Pearson correlations were conducted to examine relations among mean N2 amplitude for the left- and right-hemisphere electrode clusters, median RTs, and no-go accuracy cost. Significant correlations were found between median RTs on the go/no-go task and the following: right-hemisphere N2 amplitudes on no-go trials, r = 0.30, p < 0.05, left-hemisphere N2 amplitudes on go trials, r = 0.28, p < 0.05, and left-hemisphere N2 amplitude on no-go trials, r = 0.35, p < 0.05. Larger (i.e., more negative) N2 amplitudes were associated with faster responding on go trials. Correlations involving no-go accuracy cost were not significant (−0.13 < r < 0.11). These correlations indicate that larger N2 amplitudes are related to better EF performance.
Source analysis
We used a minimum norm method with the local autoregressive average (LAURA) to create a source model of the grand-averaged scalp data. Modeled source activation was then examined using GeoSource (EGI) for latencies between 250 and 500 ms post-stimulus. Given that relatively little is known about the sources underlying the N2 in young children, an underdetermined model was used (Michel et al., 2004
; Luck, 2005
). Regions of interest (ROIs) were defined functionally around the voxels of peak activation in the model, and also in light of source analyses of the N2 in studies conducted with North American children (Lamm et al., 2006
; Lewis et al., 2006
, 2008
; Todd et al., 2008
). Activation was then averaged across all voxels in each ROI for each participant in each go/no-go condition, and a single-source waveform was extracted for each ROI. This process yielded source activation waveforms for four hypothetical generators of scalp activation located generally in ventromedial prefrontal cortex, right ventrolateral prefrontal cortex, left ventrolateral prefrontal cortex, and dorsomedial prefrontal cortex. Figure 5
shows means and standard deviations of activation levels (in nA) extracted from these modeled sources for the two cultural groups for the peak N2 interval between 300 and 350 ms post-stimulus. To investigate cultural group differences in extracted activation levels for each of the four modeled sources, separate ANOVAs were carried out with cultural group as a between-subjects variable, and go/no-go condition and 50-ms interval as within-subjects variables.
For the VMPFC modeled source, there were significant main effects of cultural group, F(1, 35) = 23.79, p < 0.001,  (Chinese M = 0.45, SE = 0.027; European M = 0.28, SE = 0.025) and go/no-go condition, F(1, 35) = 48.23, p < 0.001,
  (go M = 0.28, SE = 0.015; no-go M = 0.45, SE = 0.027), with greater overall activation on no-go trials and for Chinese children. There were no interactions.
(Chinese M = 0.45, SE = 0.027; European M = 0.28, SE = 0.025) and go/no-go condition, F(1, 35) = 48.23, p < 0.001, (go M = 0.28, SE = 0.015; no-go M = 0.45, SE = 0.027), with greater overall activation on no-go trials and for Chinese children. There were no interactions.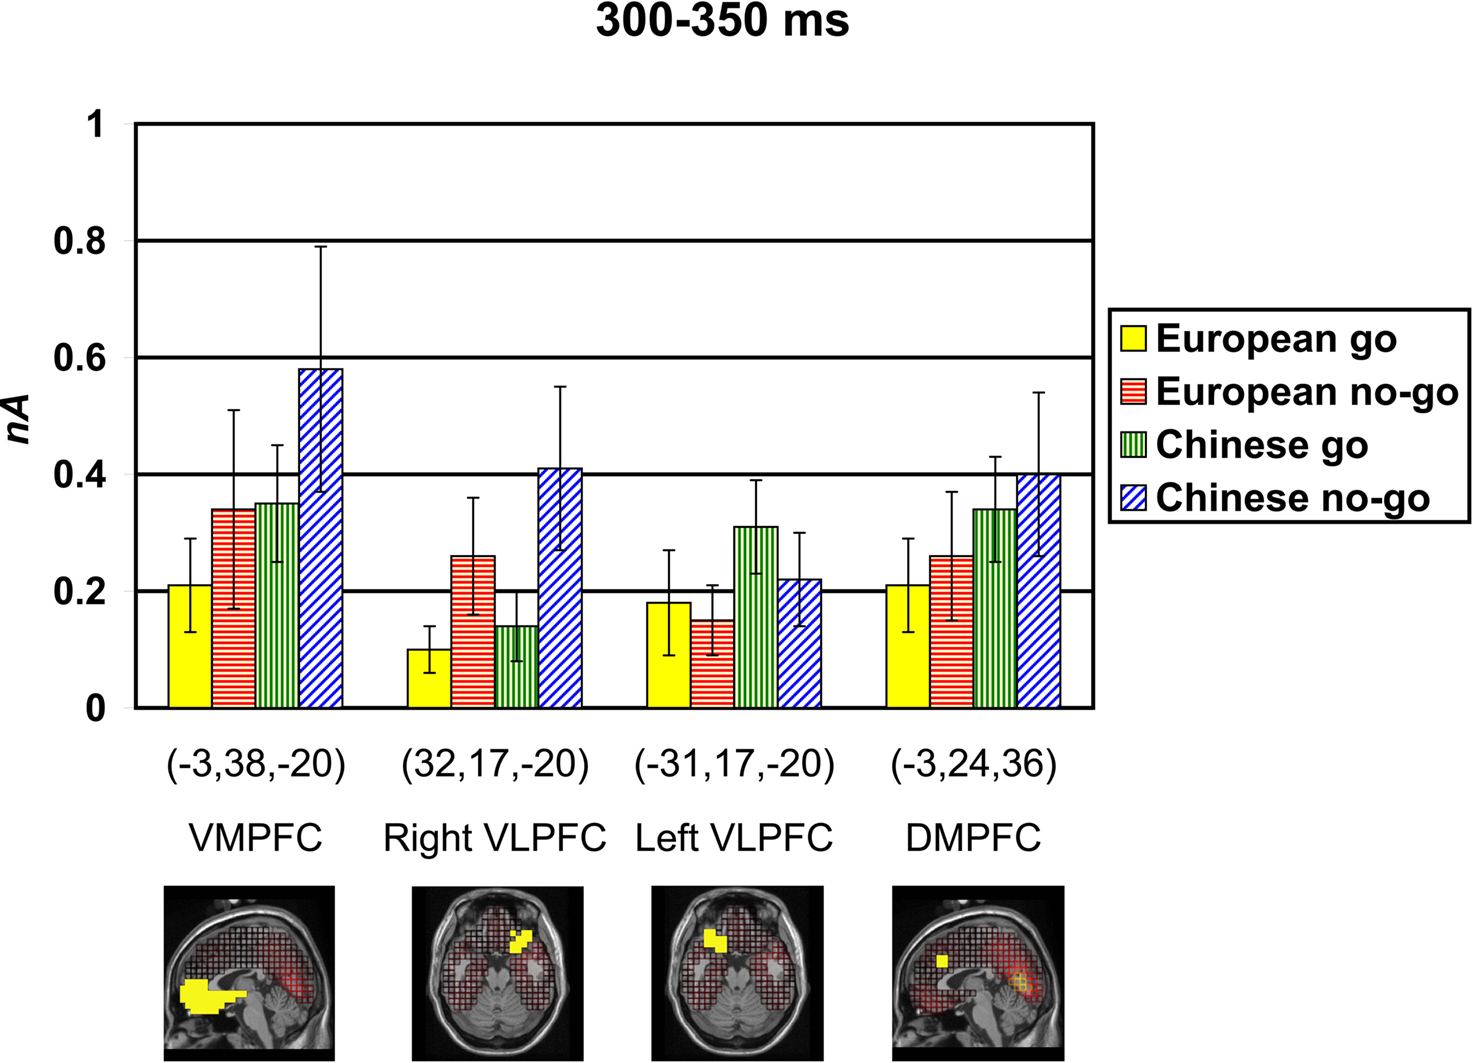
Figure 5. Modeled source activations (in nA) and ROIs displayed using the Montreal Neurological Institute (MNI) average adult MRI scan for the peak N2 interval of 300–350 ms in ventromedial prefrontal cortex (VMPFC; −3, 38, −20), right ventrolateral prefrontal cortex (VLPFC: 32, 17, −20), left VLPFC (−31, 17, −20), and dorsomedial prefrontal cortex (DMPFC: −3, 24, 36), as a function of cultural group and go/no-go condition. GeoSource voxel locations (x, y, z) in Talairach space are provided for the peak activation in each ROI.
For the right VLPFC source, there were significant main effects of cultural group, F(1, 35) = 13.96, p < 0.001,  (Chinese M = 0.27, SE = 0.016; European M = 0.19, SE = 0.014), go/no-go condition, F(1, 35) = 197.52, p < 0.001,
  (go M = 0.12, SE = 0.007; no-go M = 0.33, SE = 0.017), and interval, F(4, 140) = 21.08, p < 0.001,
  (250–300 ms M = 0.19, SE = 0.011; 300–350 ms M = 0.23, SE = 0.012; 350–400 ms M = 0.24, SE = 0.011; 400–450 ms M = 0.23, SE = 0.010; 450–500 ms M = 0.24, SE = 0.010) with greater activation for Chinese children; no-go trials; and the interval of 250–300 ms vs. all others. These main effects were qualified by a Cultural group × Go/no-go condition interaction, F(1, 35) = 6.91, p < 0.05,
  a Go/no-go condition × Interval interaction, F(4, 140) = 25.28, p < 0.001,
  and a Cultural group × Go/no-go condition × Interval interaction, F(4, 132) = 3.10, p < 0.05,
  Post hoc tests revealed that the difference between go and no-go trials (i.e., no-go > go) for this right VLPFC source was larger for Chinese-Canadian children than for European-Canadian children, that the difference between go and no-go trials was largest between 350 and 400 ms, and that the Cultural group × Go/no-go condition interaction was especially pronounced for the two intervals between 300 and 400 ms.
(Chinese M = 0.27, SE = 0.016; European M = 0.19, SE = 0.014), go/no-go condition, F(1, 35) = 197.52, p < 0.001, (go M = 0.12, SE = 0.007; no-go M = 0.33, SE = 0.017), and interval, F(4, 140) = 21.08, p < 0.001, (250–300 ms M = 0.19, SE = 0.011; 300–350 ms M = 0.23, SE = 0.012; 350–400 ms M = 0.24, SE = 0.011; 400–450 ms M = 0.23, SE = 0.010; 450–500 ms M = 0.24, SE = 0.010) with greater activation for Chinese children; no-go trials; and the interval of 250–300 ms vs. all others. These main effects were qualified by a Cultural group × Go/no-go condition interaction, F(1, 35) = 6.91, p < 0.05, a Go/no-go condition × Interval interaction, F(4, 140) = 25.28, p < 0.001, and a Cultural group × Go/no-go condition × Interval interaction, F(4, 132) = 3.10, p < 0.05, Post hoc tests revealed that the difference between go and no-go trials (i.e., no-go > go) for this right VLPFC source was larger for Chinese-Canadian children than for European-Canadian children, that the difference between go and no-go trials was largest between 350 and 400 ms, and that the Cultural group × Go/no-go condition interaction was especially pronounced for the two intervals between 300 and 400 ms.For the left VLPFC source, there were main effects of cultural group, F(1, 35) = 22.49, p < 0.001,  (Chinese M = 0.26, SE = 0.015; European M = 0.17, SE = 0.013), go/no-go condition, F(1, 35) = 22.39, p < 0.001,
  (go M = 0.24, SE = 0.012; no-go M = 0.18, SE = 0.012), and interval, F(4, 140) = 10.70, p < 0.001,
  (250–300 ms M = 0.19, SE = 0.011; 300–350 ms M = 0.21, SE = 0.011; 350–400 ms M = 0.22, SE = 0.011; 400–450 ms M = 0.22, SE = 0.010; 450–500 ms M = 0.23, SE = 0.010) with greater activation for Chinese children and for go trials, and differences between 250–300 ms vs. all other intervals, and between 400–450 ms and 450–500 ms). These were qualified by a Go/no-go condition × Interval interaction, F(4, 140) = 42.50, p < 0.001,
  and a Cultural group × Go/no-go condition × Interval interaction, F(4, 140) = 2.63, p < 0.05,
  reflecting the fact that the difference between go and no-go trials (i.e., go > no-go) for this left VLPFC source was larger for Chinese-Canadian children, and that this two-way interaction was especially pronounced for the two intervals between 300 and 400 ms.
(Chinese M = 0.26, SE = 0.015; European M = 0.17, SE = 0.013), go/no-go condition, F(1, 35) = 22.39, p < 0.001, (go M = 0.24, SE = 0.012; no-go M = 0.18, SE = 0.012), and interval, F(4, 140) = 10.70, p < 0.001, (250–300 ms M = 0.19, SE = 0.011; 300–350 ms M = 0.21, SE = 0.011; 350–400 ms M = 0.22, SE = 0.011; 400–450 ms M = 0.22, SE = 0.010; 450–500 ms M = 0.23, SE = 0.010) with greater activation for Chinese children and for go trials, and differences between 250–300 ms vs. all other intervals, and between 400–450 ms and 450–500 ms). These were qualified by a Go/no-go condition × Interval interaction, F(4, 140) = 42.50, p < 0.001, and a Cultural group × Go/no-go condition × Interval interaction, F(4, 140) = 2.63, p < 0.05, reflecting the fact that the difference between go and no-go trials (i.e., go > no-go) for this left VLPFC source was larger for Chinese-Canadian children, and that this two-way interaction was especially pronounced for the two intervals between 300 and 400 ms.Finally, for the DMPFC source, there were main effects of cultural group, F(1, 35) = 14.73, p < 0.001,  (Chinese M = 0.34, SE = 0.020; European M = 0.24, SE = 0.019), go/no-go condition, F(1, 35) = 7.72, p < 0.01,
  (go M = 0.27, SE = 0.013; no-go M = 0.31, SE = 0.019), and interval, F(4, 140) = 6.38, p < 0.001,
  (250–300 ms M = 0.27, SE = 0.014; 300–350 ms M = 0.30, SE = 0.015; 350–400 ms M = 0.30, SE = 0.016; 400–450 ms M = 0.29, SE = 0.014; 450–500 ms M = 0.28, SE = 0.014) with greater activation for Chinese children and for no-go trials, and a difference between 250–300 ms vs. both 300–350 ms, 350–400 ms. These were qualified by a Go/no-go condition × Interval interaction, F(4, 140) = 4.40, p < 0.01,
  and a Cultural group × Interval interaction, F(4, 140) = 4.87, p < 0.001,
  Post hoc tests revealed that Chinese-Canadians showed more activation than European-Canadians especially between 250 and 350 ms, and that the differences between go and no-go trials (i.e., no-go > go) for this dorsomedial prefrontal region of interest was largest between 250 and 300 ms.
(Chinese M = 0.34, SE = 0.020; European M = 0.24, SE = 0.019), go/no-go condition, F(1, 35) = 7.72, p < 0.01, (go M = 0.27, SE = 0.013; no-go M = 0.31, SE = 0.019), and interval, F(4, 140) = 6.38, p < 0.001, (250–300 ms M = 0.27, SE = 0.014; 300–350 ms M = 0.30, SE = 0.015; 350–400 ms M = 0.30, SE = 0.016; 400–450 ms M = 0.29, SE = 0.014; 450–500 ms M = 0.28, SE = 0.014) with greater activation for Chinese children and for no-go trials, and a difference between 250–300 ms vs. both 300–350 ms, 350–400 ms. These were qualified by a Go/no-go condition × Interval interaction, F(4, 140) = 4.40, p < 0.01, and a Cultural group × Interval interaction, F(4, 140) = 4.87, p < 0.001, Post hoc tests revealed that Chinese-Canadians showed more activation than European-Canadians especially between 250 and 350 ms, and that the differences between go and no-go trials (i.e., no-go > go) for this dorsomedial prefrontal region of interest was largest between 250 and 300 ms.Recent research suggests that Asian preschoolers may perform better than age-matched North American or British children on measures of EF (e.g., Sabbagh et al., 2006
; Oh and Lewis, 2008
), consistent with reported cultural differences in the emphasis placed on impulse control (e.g., Chen et al., 1998
). This study provides a first look at whether the neural correlates of EF, measured in the context of a go/no-go task, differ systematically between European-Canadian and Chinese-Canadian 5-year-olds. Although no cultural group differences were observed in children’s behavioral performance on the go/no-go task, substantial differences were revealed by ERP analyses, with Chinese-Canadian children showing larger N2 amplitudes than European-Canadian children. In studies comparing participants within a single age, N2 amplitude is often larger in groups performing better on EF (e.g., Pliszka et al., 2000
), and in the current study, larger N2 amplitudes were associated with faster RTs (i.e., better performance).
N2 amplitude is usually observed to be larger on successful no-go trials than on go trials (e.g., Eimer, 1993
; Falkenstein et al., 1999
). In the present study, N2 amplitudes were indeed larger on no-go trials than on go trials over the right frontal part of the scalp, a pattern of lateralization that has sometimes been observed in previous research with both children and adults (e.g., Todd et al., 2008
; see also Lavric et al., 2004
, who localized sources of N2 difference scores in right ventral and dorsolateral prefrontal cortex). In contrast, however, over the left frontal part of the scalp, N2 amplitudes were larger on go trials than on no-go trials. This asymmetrical pattern of scalp lateralization (to the right for no-go trials and to the left for go trials) was reflected in the results of the source analysis of the N2 in the current study, which suggested that a cortical generator in left VLPFC may contribute more to go N2s whereas a cortical generator in right VLPFC may contribute more to no-go N2s. Together, these findings are in line with a large body of research on EF tasks that show a lateralized pattern (e.g., Konishi et al., 1998
, 1999
; Garavan et al., 1999
, 2002
; Bokura et al., 2001
; Menon et al., 2001
; Bunge et al., 2002
; Rubia et al., 2003
; Aron et al., 2004
; Perez-Edgar and Fox, 2007
; Todd et al., 2008
; Madsen et al., 2009
) as well as with research revealing other lateralized ERP components implicated in emotion regulation (e.g., the late positive potential, LPP; Cunningham et al., 2005
), and research on EEG alpha power asymmetry, indicating a greater role for left PFC in approach behavior and a greater role for right PFC in withdrawal or inhibition (e.g., Davidson, 1992
; Davidson and Fox, 1989
; Harmon-Jones and Allen, 1997
). At least in young children in the context of this task, therefore, the amplitude of the N2 may provide an index not only of the inhibitory aspects of EF (over right PFC) but also of effective goal-directed approach behavior (over left PFC).
In general, the prefrontal sources modeled in the present study fit well with previous research on the regions implicated in the go/no-go task with children (e.g., Durston et al., 2002b
; Lamm et al., 2006
; Lewis et al., 2006
, 2008
). In addition, the regions modeled in the VMPFC and DMPFC are roughly consistent with studies modeling sources of the N2 that are centrally localized (e.g., Nieuwenhuis et al., 2003
), although it should be noted that these studies used different approaches to source modeling than the present study and modeled the N2 difference between no-go and go trials (i.e., the N2 effect).
The asymmetric pattern of lateralization to emerge in this study was more pronounced for Chinese-Canadian children than it was for European-Canadian children. It was not simply that Chinese-Canadian children showed more activation overall than European-Canadian children; rather, they showed a more differentiated pattern, congruent with the different task demands inherent in the go/no-go task: Chinese-Canadian children showed larger N2 amplitudes than European-Canadian children on the right side of the scalp on no-go trials, as well as on the left side of the scalp on go trials. In addition, left-minus-right difference scores, which were positive for no-go trials and negative for go trials for all children, were larger in absolute magnitude for the Chinese-Canadian children. Further work is needed to examine the origin and implications of this group difference in lateralization.
The lack of behavioral differences between the cultural groups in this study differs from previous findings that Chinese children outperformed North American children on behavioral measures of EF (e.g., Sabbagh et al., 2006
), although this earlier research focused on younger children and did not examine go/no-go performance. In addition, the Chinese-Canadians in the current study grew up in Canada, whereas previous research has examined Asian children living in Asia. In any case, it would appear that at least in some situations, EEG can provide a measure of cultural differences in neurocognitive function that is more sensitive than behavioral data alone.
Further work remains to be done to clarify the nature of the group differences in neurocognitive function observed in the current study. Neurocognitive abilities are undoubtedly influenced by both genes and environment, and both types of influence are likely to vary across cultures. For example, cultural differences in the importance that parents place on impulse control could affect children’s motivation to succeed on a task like the go/no-go task, resulting in greater PFC activation. Neither number of languages spoken in the home nor parent-reported individualism–collectivism accounted for the observed differences, but there are several possible factors that may contribute to them, including genetic differences related to EF and possible group differences in skull density, thickness, and shape (Zilles et al., 2001
; Knott et al., 2004
), as well as any number of other unmeasured variables. Regardless of the origin of the observed group differences, however, the findings underscore the fact that the neural correlates of EF may vary across samples of healthy participants, even in children. One simply cannot assume that neural function is the same in all samples of healthy children – cultural background, and whatever may be correlated with cultural background, needs to be taken into consideration.
The authors declare that the research was conducted in the absence of any commercial or financial relationships that could be construed as a potential conflict of interest.
Funding for this research was provided to PDZ by NSERC of Canada, the CFI, and the Nancy M. and John E. Lindahl Professorship at the University of Minnesota.
Madsen, K. S. Baaré, W. F. C., Gøtzsche, M. V., Skimminge, A., Ejersbo, L. R., Ramsøy, T. Z., Gerlach, C., Åkeson, P., Paulson, O. B., and Jernigan, T. L. (2009). Response inhibition is associated with white matter microstructure in children. Neuropsychologia. doi: 10.1016/j.neuropsychologia.2009.11.001.
Overtoom, C. C. E., Verbaten, M. N., Kemner, C., Kenemans, J. L., van Engeland, H., Buitelaar, J. K.,Camfferman, G., and Koelega, H. S. (1998). Associations between event related potentials and measures of attention and inhibition in the continuous performance task in children with ADHD and normal controls. J. Am. Acad. Child Adolesc. Psychiatry 37, 977–985.
Swanson, J. M., Sunohara, G. A., Kennedy, J. L., Regino, R., Fineberg, E., Wigal, T., Lerner, M., Williams, L., LaHoste, G. J., and Wigal, S. (1998). Association of the dopamine receptor D4 (DRD4) gene with a refined phenotype of attention deficit hyperactivity disorder (ADHD): a family-based approach. Mol. Psychiatry 3, 38–41.