 Muhammad Musavir Bilal
 Ajmal Thottoli3†
 Servando Lopez-Aguayo
- 1Tecnologico de Monterrey, Escuela de Ingeniería y Ciencias, Monterrey, Nuevo León, Mexico
- 2Department of Engineering and Architecture, University of Parma, Parma, Italy
- 3Department of Electrical and Information Engineering, Politecnico di Bari, Bari, Italy
In this paper, we introduce a comprehensive study, based on both numerical and experimental analyses, of side polished-single mode fibers (SP-SMF) to investigate their corresponding evanescent field interaction with air and liquid analytes such as water and isopropanol (IPA). On the one hand, the SP-SMF’s optical properties are numerically studied and analyzed by using the finite element method and the beam propagation method, and we find that the alteration of analytes at the sensing region enhances the change in the refractive index (RI) of the materials. On the other hand, we designed and built an ad-hoc experimental setup to characterize the SP-SMF when air, water, and IPA are introduced into the SP region. The sensitivity is measured as 1.207 V/RIU. The performance in terms of effective RI and transmittance are reported to show how these SP-SMFs can be efficiently used for calculating the liquid RI. The simulation and experimental results display the significant performance of the SP-SMF as a valuable sensing element.
1 Introduction
In the last few decades, optical fiber technology has accumulated significant interest across various fields, including medical, industrial engineering, and environmental monitoring (Sun et al., 2023). This versatile technology has undergone extensive scrutiny for its capacity to measure a wide range of parameters, including RI, temperature, magnetic field, stress, strain, and liquid properties. This widespread interest can be attributed to its exceptional advantages, such as high sensitivity, flexibility, immunity to electromagnetic interference, resistance to corrosion, compact size, and cost-effectiveness compared to conventional sensors (Ahme et al., 2021; Ahmed et al., 2020).
Recently, many types of optical fibers have been utilized in sensing technology, such as single-mode fiber, multimode fiber (MMF), microstructure fiber, and photonic crystal fiber (PCF) (Bilal M. et al., 2019). Mostly, PCF has been utilized for liquids or gas sensing applications as it has a flexible and controllable structure to add more than one sensing element for the simultaneous measurements of different parameters. However, combining or adding the sensing elements inside the fiber increases complexity. These sensing techniques rely basically on the Mach-Zehnder interferometer (MZI) (Bilal M. M. et al., 2019), Fabry-Perot interferometer (FPI) (Wang Q. et al., 2024), and Michelson interferometer (MI) (Dong et al., 2017). The basic concept of these interferometers is to split, recombine, and analyze interference patterns of the light waves to make precise measurements. On the other hand, another kind of optical sensor is the so-called surface plasmon resonance (SPR) sensor, which has earned substantial concern due to its real-time supervising abilities and high sensitivity. These kinds of sensors implicate a fluctuation of charge intensity that is exhibited at the boundary between the metal and dielectric layer and utilize several ultimate methods that permit the manipulation of this charge intensity oscillation. When polarized light hits this metal-dielectric interface at a specific angle, it can excite these plasmons, causing a reduction in reflected light intensity. This reduction is measured as a function of angle, providing information about molecular binding events occurring on the metal surface. However, the implementation of plasmonic materials with the side polished fiber requires a specific procedure to fabricate, which could be complicated and lengthy.
SMF structures are highly attractive to environmental parameters, particularly SP-SMF design, which has obtained extensive devotion and has been occupied in many kinds of optical sensing devices thanks to the evanescent field extended outside to the core into the SP region (Ma et al., 2022). SP-SMF fiber has been broadly utilized in various applications, containing attenuators, switches, polarizers, and evanescent optical fiber sensors due to the well-recognized of transient field on the tapered surface of the fiber. SP-SMF structure plays a crucial role in the measurements of RI through a precise relation to the intensity of analytes (Liu et al., 2021).
In this regard, two schemes of side polished arrangement can be considered: the first one is based on the filling of liquids or analytes inside the fibers, where these analytes are inserted into the core or the cladding regions of the fibers (Jiang et al., 2023). Mostly, microstructure fibers have been exploited for this method. The benefit of this scheme is related to its high S and manageability because the filled analyte inside the fiber directly impacts the dispersion of the fiber (Wang F. et al., 2024). However, the major drawback is related to the fact that filling the fiber with liquids can be very complex or difficult as related to other approaches in which the analyte is kept on the exterior part of the fiber (Ali et al., 2025). Therefore, D-shaped fibers, with sensing or tapered regions located outside the fiber, can be considered as mainstream for real-time measurements (Sharma et al., 2023).
In recent years, D-shaped fiber structures have been reported in which half of the cladding section is polished, allowing a stronger interaction between the optical mode and the target analytes (Zhang and Luan, 2023; Jin et al., 2020). Wang et al. demonstrated the temperature sensor based on helical core fiber, which is polished as a D-type fiber coated with a layer of gold (Wang et al., 2021). Studies of Ag/TiO2 plasmonic formation combined with side polish fiber have been described by Yousuf et al. to build the humidity sensor (Yusoff et al., 2018). Further, Xu et al. designed the magnetic field sensor based on the magnetic fluid and SP hollow-core optical fiber (Xu et al., 2021). A film of cholesteric liquid quartz is employed to the side polished fiber to give the capability of measurement of volatile organic compound (VOC) gases (Tang et al., 2018). A recent work report measuring the liquid level and RI by using the side polished plastic optical fiber (Teng et al., 2022). Moreover, a humidity sensor with tremendous S employs a side-polished in-fiber directional coupler coated with gelatin (Yang et al., 2020).
Therefore, for the manufacturing method, more polishing intensity indicates extra refined input development, which makes the fabrication cost of the fiber sensor more expensive. As far as S factor, sensors with numerous sensing paths are more responsive than the specific sensing channel over the same circumstances (Zhu et al., 2024). The operating wavelength range is also a significant element for the sensing devices. Hence, it is possible to achieve a higher S and wider range of detection at certain conditions with different analytes placed outside the D-type SMF sensors.
In this study, the characterization of commercially available SP-SMF associated with air and analytes has been proposed. The simulation study based on two numerical algorithms, the finite element and beam propagation technique, has been exploited to examine light propagation phenomena. On the other hand, for the practical application and corroboration of the numerical results, experimental studies have been analyzed to describe the matching results of numerical output. On the basis of the optical transmittance spectrum, air, water, and IPA have been taken into account. The characteristic of light confinement depends on the RI of the analytes, which leads to a change in optical output power. The performance of the proposed model is achieved as 1.207 V/RIU for the experimental study. This type of structure could be used as a building block in liquid sensing applications as well as RI sensing.
Moreover, the long side-polished fiber configuration offers an extended interaction path length while keeping fabrication costs low. With advancements in fiber-coupled lasers, optical fibers now demonstrate excellent compatibility with existing connectivity systems. This technology has found extensive applications in remote and wide-area sensing, including biomedical fluid sensing, chemical detection, industrial process monitoring, and environmental pollution observing, such as moisture exposure and liquid pollution testing. This article has been organized in different sections: first, we provide an introduction to SPF along with a review of existing sensing methods. The second section focuses on the geometrical design and structural aspects of SPF. The results section is divided into three subsections: numerical simulation results, experimental setup, and experimental findings. Finally, we present the achieved sensing sensitivity, comparative investigations, and potential applications as the conclusion.
2 Geometrical structure
We start by describing the geometrical structure of the side-polished single-mode fiber used in this work. The cross-section and side view of the proposed SP-SMF structure have been shown in Figures 1a,b, respectively. The commercial SP-SMF (manufactured by Phoenix Photonics Ltd.) has been taken to perform the corresponding experimental study. The geometrical parameters for the simulation study have been set up according to the commercial fiber.
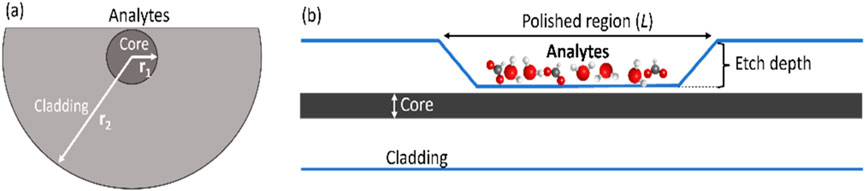
Figure 1. Geometrical structure of side polished fiber, (a) Cross sectional view and (b) side view with analytes.
The central part of the fiber consists of the core region with a diameter (2*r1) of 9.5 µm, which is surrounded by the corresponding cladding region. The cladding diameter (2*r2) of the fiber is 62.5 µm, with a polished region length (L) of 17 mm, which behaves as an active region through adding the analytes. The term “Etch depth” refers to the depth at which the cladding of an SMF is removed during the fabrication process of polishing, and the distance between the core and the tapered section is about 2 µm. The outer layer of fiber consists of a perfectly matched layer that absorbs the reflected light from different angles. Note that Figure 2 indicates the wheel-side polishing technique that is used for manufacturing the SPF (Guo et al., 2022). The coated section of SMF is held compactly over the fixed motor-driven wheel by two fiber clampers. In this method, a PC controller is associated with the polished layer to observe the remaining fiber depth until the fiber core is revealed. The connection of the light source and optical spectrum analyzer monitors the overall polishing process and attenuation of light transmission along the fiber (Zhuo et al., 2022).
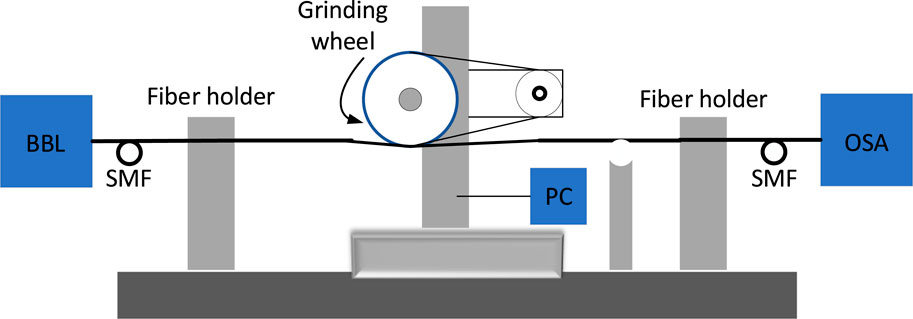
Figure 2. The schematic diagram of wheel polishing techniques for the fabrication of SP-SMF.
3 Results and discussion
3.1 Numerical results
Next, we present the numerical results obtained in this work. In the simulation analysis, two different studies have been carried out based on (i) COMSOL Multiphysics and (ii) Beam PROP implementing likewise in (a) the Finite Element Method (FEM) and (b) the finite differences beam propagation method (FD-BPM), respectively (Wang X. et al., 2024; Moutzouris et al., 2014). The FEM is a numerical technique used to approximate the behavior of physical systems. It breaks down a complex structure or system into more minor, simpler elements. These elements are interconnected at specific points known as nodes. By solving equations for each element, the method calculates the entire system’s behavior. FEM is widely used in engineering for tasks like stress analysis, heat transfer, and fluid dynamics simulations, allowing us to analyze and optimize designs before physical prototypes are built. This method has revolutionized the field of computational engineering and science, enabling precise and efficient modeling of complex structures and systems. In our work, the computation of the FEM model is developed to examine and evaluate the light transmission through the proposed SP-SMF sensor. The physics-controlled way of refined mesh analysis is studied, which consists of 1,512 domain elements and 184 boundary elements. The wavelength range is taken from 1,460 nm to 1,580 nm. Pure silica is used as a background material of the fiber with a RI of 1.445 at the wavelength of 1,500 nm.
The dispersion relation of the RI of pure silica and analytes has been calculated by using an empirical Sellmeier equation (Bilal et al., 2022). For silica, the following Equation 1 has been used (Hale and Querry, 1973).
where n is the effective RI of the pure silica glass, the values for the constant variables are A1 = 0.6961663, A2 = 0.4079426, A3 = 0.8974794, B1 = 0.0684043, B2 = 0.1162414, B3 = 98.96161 and λ is the operating wavelength in (nm).
In the FEM, the light transmission of the SP-SMF has been examined, which is employed to evaluate and calculate the propagating modes profile of the proposed structure. An external coating covers a perfectly matched layer (PML) during the simulation assessment. The RI of analytes like air, water, and IPA have been assumed at the polished region of the fiber. The different mode profiles of light spectra with respect to changes in RI have been shown in Figure 3.
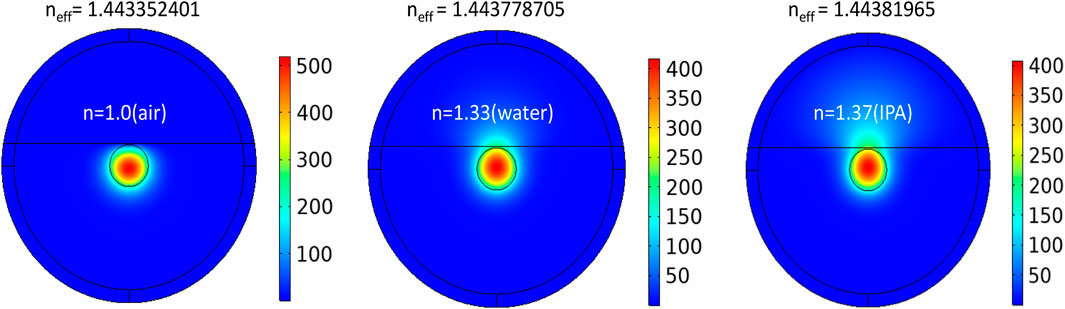
Figure 3. The computed FEM fundamental mode profile at different cladding’s RI n = 1.0, n = 1.33 and n = 1.37.
The chosen analytes have lower RI than 1.45 (silica) in which most part of the light confines to the core region. From the inspection of Figure 3, it seems that a small portion of light is gradually moving from the core to the tapered region as the analyte n’s RI. At the lower RI of analytes like (air), the light is totally confined to the core region. After changing the analytes from air to water, the light is slightly transferred from the core region to the polished section. Similarly, with the analytes of IPA light is transferred more as compared to air and water. The propagation of light totally depends on the RI of the materials. When the signals pass through the tapered region, the light spectrum moves to the polished surface due to the effect of the analytes’ RI. Thus, the transient impulse is created, and light modes travel through the section of the analyte. In this way, the impacts of the SP-SMF arrangements converted the digital signals into physical parameters involving the silica RI.
Similarly, a simulation study based on the BPM is carried out to analyze the mode distribution when the RI of the analyte is changing. In particular, the FD- BPM is a numerical technique widely used in optics and photonics to model the propagation of electromagnetic waves through waveguides, fibers, or other optical devices. It discretizes the spatial domain into small grid points and employs FD approximations to solve the wave equation. This method is particularly useful for simulating light propagation in complex optical systems, allowing engineers and scientists to analyze how light behaves as it interacts with different components. FD-BPM is versatile and can handle a wide range of optical configurations, making it a valuable tool in the design and optimization of optical devices. It's computationally efficient, providing rapid insights into the performance of various optical setups. Despite being an approximation based on its numerical nature, FD-BPM yields accurate results and is widely employed in optical research and engineering.
The mode profile in the tapered region with the analytes of (air, water, and IPA) is depicted in Figure 4. The BPM shows the electric field distribution on the transmitting mode varies with the change of analytes. It seems that there is a little conversion of light mode to the tapered region as the RI increases from 1.0 to 1.37. When it reaches up to 1.45 (silica), the confinement of light fully transferred from the core region to the tapered region due to the higher RI of analytes.
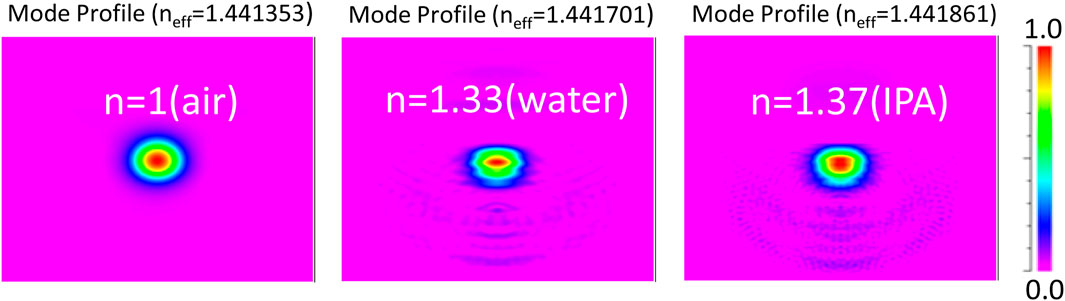
Figure 4. The computed FD-BPM fundamental mode profile at different cladding’s RI n = 1.0, n = 1.33 and n = 1.37.
The transmitted signals of the SP-SMF composition have been simulated, which can be determined by using the following Equation 2 (Wang et al., 2020):
where
Moreover, the transmittance when air, water, and IPA are set in the polished region has been studied by using the FEM and FD-BPM as shown in Figures 5a,b, respectively. The plot in Figure 5a, shows that, at the wavelength of 1,530 nm, the transmittance of IPA (T = 0.869) is higher than water (T = 0.859) and air (T = 0.842), respectively. The transmittance also depends on the wavelength, increasing as the wavelength rises.
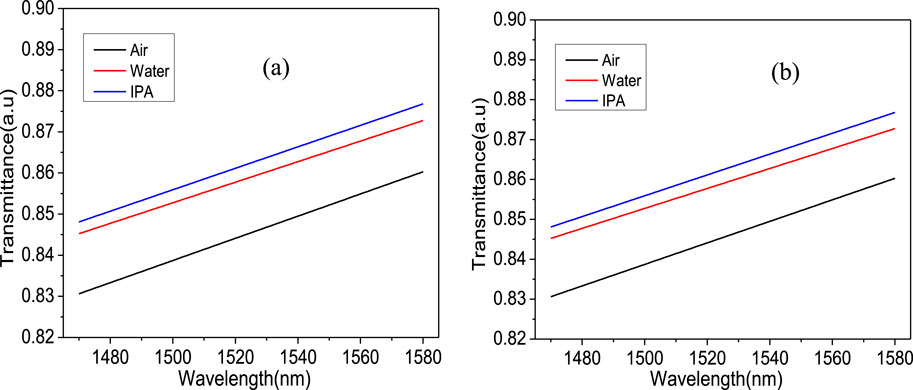
Figure 5. The transmittance for a range of wavelength excited to the SPF for varying cladding RI using (a) FEM and (b) FD-BPM.
Similarly, the same trend has been obtained in the case of the FD-BPM method, leading to a good agreement between these two methods. It seems that IPA has the maximum transmittance spectrum as compared to air and water due to the higher RI analytes. The transmittance of light is going to increase as the wavelength is increasing.
3.2 Experimental setup
Next, we proceed to report our experimental results. The experimental setup was designed to validate the simulation results using a SP-SMF-28 (from Phoenix Photonics Ltd.). The overall experimental schematic diagram is shown in Figure 6, which comprises the necessary instruments for the optical characterization. A tunable laser (TL) with a tunable wavelength range of 1,460 nm–1,580 nm has been used as a source and connected to the fiber. The output signal was sent to a photodetector (New Focus-2033, United States) that was connected to an oscilloscope to detect the transmitted signal. Both ends of sensing structure have been connected between the input (light source) and output (photodetector). The entire experiment was conducted at room temperature (25°C), which was continuously monitored throughout temperature controller (TC).
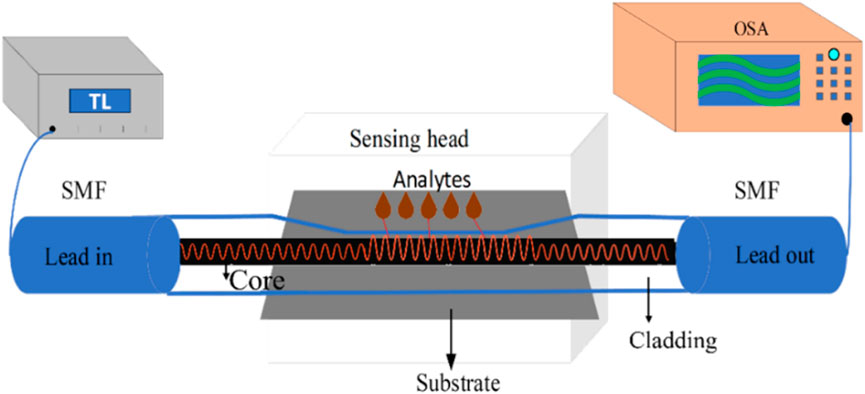
Figure 6. The schematic diagram of experimental setup for SP-SMF sensing structure.
The microscopic view of the tapered or polished region has been shown in Figure 7a. Here, the sensing and polished section of the SP fiber is shown along with the tapered regions (on the left and right sides). Both ends of the SP fiber are connected by FC/PC connectors to lead in (light source) and out (photodetector) the light. A substrate was designed on COMSOL Multiphysics; after that, it was fabricated by using the 3D printer (Photon Mono Se Anycubic). A valuable attribute of a sensor is its stability. Stability is allocated with the degree to which the sensor’s abilities stay stable over time. Alterations in stability are due to elements aging, a decline in the sensitivity (S) of components, or a change in the signal-to-noise ratio. To achieve stability and minimize the signal noise, SP fiber has been kept inside a 3D printed reservoir, which is fixed with an optical table to avoid any movement. The shape of the reservoir is shallow, deep in the middle, where the analytes or liquids have been filled at the upper part of the tapered region. Figure 7b highlights the installed experimental setup with lead in SP-SMF to lead out SP-SMF.
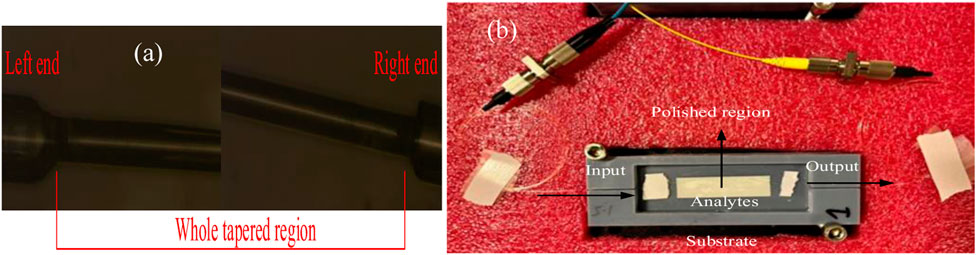
Figure 7. (a) Microscopic view of the left and right end of the SP region, and (b) The sensing setup with the SP region inside 3D printed reservoir.
3.3 Experimental results
Next, we discuss the experimental results of this work. In particular, in the wavelength range of interest (1,460 nm–1,580 nm), the photodetector S was set to low, and the input power was set to 4 mW. Figure 8a indicates the experimental results with respect to wavelength and voltage by analyzing the analytes air, water, and IPA, respectively. This graph illustrates that IPA (blue curve) shows a higher voltage as it has a higher RI than air and water. The black and red curve shows the voltage value of air and water, respectively. The maximum voltage curve is achieved at the wavelength of 1,530 nm. After that, there is a decline in the voltage with the increase of wavelength, this is due to the nature of broadband laser source. Here, the effect of some natural noise can also be seen, which depends on the optical setup and instruments (photodetector and oscilloscope). Furthermore, the plotted graph indicates the highest voltage at the wavelength of 1,530 nm, at which the maximum voltages of air, water, and IPA are 4.350 V, 4.708 V, and 4.797 V, respectively. The voltage differences between air, water, and IPA are 0.44 V, 0.35 V, and 0.089 V, as the RI of air, water, and IPA are 1.0, 1.33, and 1.37, respectively. The voltage of IPA is higher than that for water and air. However, we did not find much difference in voltage between the isopropanol and water due to the close RI.
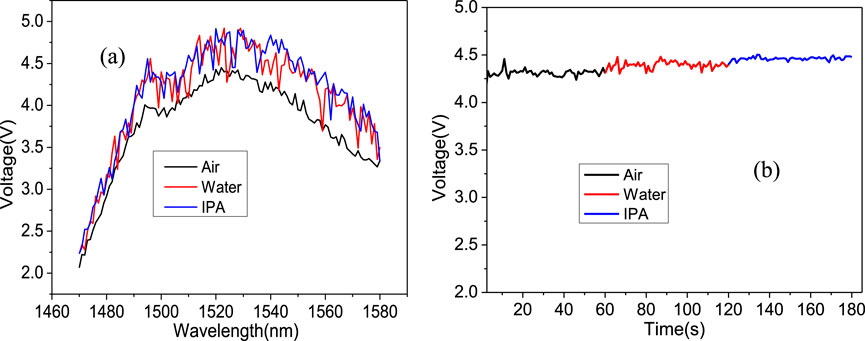
Figure 8. Experimental results of different analytes with respect to (a) voltage as a function of wavelength (b) voltage as a function of time.
Moreover, repeatability indicates the reliability of a sensor. It can be utilized to demonstrate the capability of a sensor to present the same result under the same circumstances repeatedly. The proposed sensor’s effective optical parameters have been tuned several times to observe the results. The transmittance and voltage outcomes indicate the sensor gives good responses, ensuring stability and repeatability with same results of the proposed sensor. The assessment of temperature effect was performed to evaluate the stability of the device. The fiber was positioned on a Peltier device, with the temperature controlled by adjusting the voltage between 1 V and 6 V, resulting in a temperature range of 20°C–65°C. The response to the temperature change remained flat.
On the other hand, the analysis of air, water, and IPA has been explored with respect to time variation. The wavelength has been fixed at 1,530 nm, where the maximum power is achieved. The same parameters as the input power equal to 4 mW and low S were used for the photodetector. The overall time duration was set to 0–180 s, equally distributed for the whole analytes (air, water, IPA). Each analyte has been investigated for the 60 s. The experimental graph with respect to voltage and time variation has been outlined in Figure 8b. This graph indicates the evaluation of air, water, and IPA with real-time measurement. It has been seen that with the variation of time and change in the analytes, the voltage is changing accordingly, and the average voltage for each liquid is relatively constant. IPA gained the maximum voltage due to the higher RI rather than air and water. This accounts for the repeatability and validation of the SP-SMF fiber effect with various liquids and air. Hence, from our experimental results, it is observed that the voltage with respect to wavelength and time variations of analytes (air, water, and IPA) have the same qualitative behavior.
Furthermore, to shed light on the comparison with the simulation study, the experimental results are normalized and fitted for air, water, and IPA as surrounding media. Notably, Figure 9a, shows a discernible difference in transmittance, revealing a relative change of 6% between air and water and 2% between water and IPA at the wavelength of 1,530 nm where the maximum curve is achieved. In order to check the performance of the proposed SP-SMF model, the S has been calculated, which is the variation of the RI that occurs with the change of analytes and the voltage. The S of the proposed model with respect to wavelength and voltage has been measured by using the following Equation 3 (Mollah et al., 2021):
where
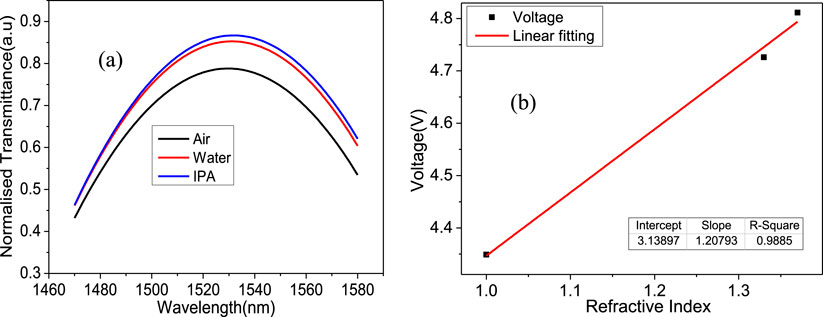
Figure 9. (a) The normalized transmittance with respect to wavelength for the analytes as a surrounding media, and (b) Linear fitting curve as a function of RI with respect to voltage.
Correspondingly, Figure 9b shows the linear fitting curve of the experimental study by relating the voltage with the change of RI of considered analytes. The S of the analytes is achieved as 1.207 V/RIU with the adjacent R2 is 0.988. Note that this means that the linear model proposed does a very good job of accurately predicting the outcomes of the dependent variable (Voltage) based on the independent variable (RI). This suggests that the model’s predictions align closely with the actual observed data points. By comparing the simulations and experimental work, the results are in good agreement since the same behavior has been achieved.
The simulation results for transmittance variation with changes in RI indicate a transmittance change of 0.05 for every 0.1 unit increment in RI. Similarly, the experimental findings show a voltage difference of 0.33 for every 0.1 unit change in RI. Notably, RI exceeding the core of the SPF result in the formation of non-guided modes.
In fact, the main objective of this study was to analyze the performance of SPF for different analytes by comparing the simulation and experimental results. As there was no wavelength shift found in this study, therefore the S was calculated in the unit of V/RIU. Moreover, Table 1 highlights the previous work of SPF with different structures and RI of analytes.
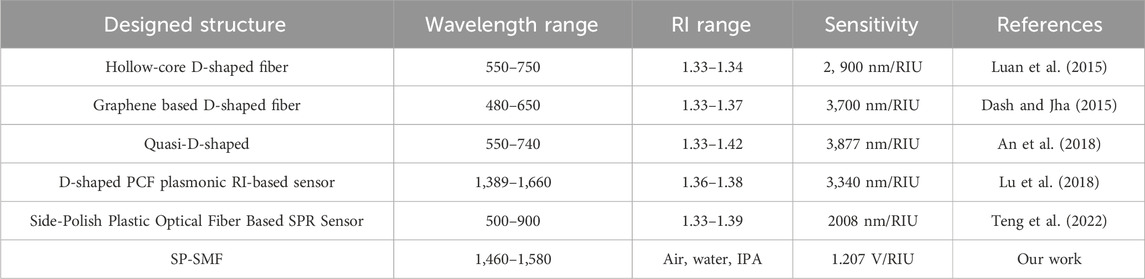
Table 1. Previous study of SPF with different structures and RI of analytes.
4 Conclusion
In conclusion, numerical and experimental studies have investigated the SP-SMF structure for assessing the RI of different analytes, including air, water, and IPA. Based on FEM and FD-BPM, two different numerical tools have been explored to verify the proposed geometry and calculate the effective RI and transmittance. Moreover, an experimental setup has been realized to compare the experimental results with the numerical findings when the tapered region of the SPF structure is filled with different analytes. The obtained S of the analytes is received as 1.207 V/RIU with the adjacent R2 is 0.988. This model and experimental setup could serve as a foundation for developing sensing applications. Furthermore, future investigations could focus on fine-tuning parameters such as core region size, tapered layer dimensions, and sensing region specifications to further enhance the sensing capabilities of novel SP-SMF configurations. The combined simulation and experimental outcomes unequivocally demonstrate the remarkable performance of the SP-SMF sensor, positioning it as a valuable measurement tool for upcoming research endeavors in this field.
Data availability statement
The raw data supporting the conclusions of this article will be made available by the authors, without undue reservation.
Author contributions
MB: Methodology, Software, Writing – original draft, Writing – review and editing. AT: Data curation, Formal Analysis, Visualization, Writing – review and editing. MG: Conceptualization, Methodology, Supervision, Writing – review and editing. SL-A: Conceptualization, Supervision, Writing – review and editing.
Funding
The author(s) declare that financial support was received for the research and/or publication of this article. This research is funded by Instituto Tecnologico y de Estudios Superiores de Monterrey, Mexico.
Acknowledgments
We are thankful by the support and help of Conacyt Organization, Mexico. We also acknowledge the fruitful discussion with Liam O′ Faolain, Tyndall National Institute, T12 PX46 Cork, Ireland.
Conflict of interest
The authors declare that the research was conducted in the absence of any commercial or financial relationships that could be construed as a potential conflict of interest.
Generative AI statement
The author(s) declare that no Generative AI was used in the creation of this manuscript.
Publisher’s note
All claims expressed in this article are solely those of the authors and do not necessarily represent those of their affiliated organizations, or those of the publisher, the editors and the reviewers. Any product that may be evaluated in this article, or claim that may be made by its manufacturer, is not guaranteed or endorsed by the publisher.
References
Ahmed, K., Jabin, M. A., and Paul, B. K. (2020). Surface plasmon resonance-based gold-coated biosensor for the detection of fuel adulteration. J. Comput. Electron 19 (1), 321–332. doi:10.1007/s10825-019-01434-z
Ahmed, K., Paul, B. K., Ahmed, F., Jabin, M. A., and Uddin, M. S. (2021). Numerical demonstration of triangular shaped photonic crystal fibre-based biosensor in the Terahertz range. IET Optoelectron. 15 (1), 1–7. doi:10.1049/ote2.12006
Ali, T., Illahi, A., Asma, , Hussain, A., and Hussain, A. (2025). Exploring the potential of double perovskite oxide Ca2TiFeO6 coated D-shaped optical fiber SPR sensor: a theoretical analysis. J. Opt. 27 (6), 065001. doi:10.1088/2040-8986/add355
An, G., Li, S., Wang, H., Zhang, X., and Yan, X. (2018). Quasi-D-shaped optical fiber plasmonic refractive index sensor. J. Opt. 20 (3), 035403. doi:10.1088/2040-8986/aaaa42
Bilal, M., Bi, W., Jaleel, F., Luwen, Y., Sohail, M. N., Irshad, M., et al. (2019a). Magnetic fluid-based photonic crystal fiber for temperature sensing. Opt. Eng. 58 (7), 1. doi:10.1117/1.oe.58.7.072008
Bilal, M. M., Bi, W., Liu, X., Yang, L., Wa, J., and Madni, H. A. (2019b). Magnetic field sensor based on the magnetic fluid infiltration into the cladding air holes of the solid-core photonic crystal fiber. Opt. Eng. 58 (09), 1. doi:10.1117/1.oe.58.9.096107
Bilal, M. M., López-Aguayo, S., Szczerska, M., and Madni, H. A. (2022). Multi-functional sensor based on photonic crystal fiber using plasmonic material and magnetic fluid. Appl. Opt. 61 (35), 10400–10407. doi:10.1364/ao.456519
Dash, J. N., and Jha, R. (2015). On the performance of graphene-based D-shaped photonic crystal fibre biosensor using surface plasmon resonance. Plasmonics 10 (5), 1123–1131. doi:10.1007/s11468-015-9912-7
Dong, Y., Xiao, S., Xiao, H., Liu, J., Sun, C., and Jian, S. (2017). An optical liquid-level sensor based on D-shape fiber modal interferometer. IEEE Photonics Technol. Lett. 29 (13), 1067–1070. doi:10.1109/lpt.2017.2700623
Guo, K., He, J., Li, H., Xu, X., Du, B., Liu, S., et al. (2022). Polarimetric fiber laser for relative humidity sensing based on graphene oxide-coated D-shaped fiber and beat frequency demodulation. Opt. Express 30 (10), 15998–16008. doi:10.1364/oe.457297
Hale, G., and Querry, M. R. (1973). Optical constants of water in the 200-nm to 200-μm wavelength region. Appl. Opt. 12 (3), 555–563. doi:10.1364/ao.12.000555
Jiang, H., Shen, T., Feng, Y., Liu, C., Liu, X., Han, J., et al. (2023). Characterization of incompletely coated D-shaped PCF-SPR refractive index sensors. Phys. Scr. 98 (10), 105520. doi:10.1088/1402-4896/acf797
Jin, W., Li, X., Wu, S., Fu, X., Fu, G., Bilal, M. M., et al. (2020). Highly sensitive temperature sensing probes based on liquid cladding elliptical micro/nanofibers. Opt. Express 28 (14), 20062–20073. doi:10.1364/oe.393491
Liu, L., Liu, Z., Zhang, Y., and Liu, S. (2021). Side-polished D-type fiber SPR sensor for RI sensing with temperature compensation. IEEE Sensors J. 21 (15), 16621–16628. doi:10.1109/jsen.2021.3080290
Lu, J., Li, Y., Han, Y., Liu, Y., and Gao, J. (2018). D-shaped photonic crystal fiber plasmonic refractive index sensor based on gold grating. Appl. Opt. 57 (19), 5268–5272. doi:10.1364/ao.57.005268
Luan, N., Wang, R., Lv, W., Yao, J., Schmidt, M. A., Prill Sempere, L. N., et al. (2015). Surface plasmon resonance sensor based on D-shaped microstructured optical fiber with hollow core. Opt. Express 23 (7), 8576–8582. doi:10.1364/oe.23.008576
Madni, H. A., Koziel, S., Bilal, M. M., Afzal, M., Jaleel, F., Sohaib, A., et al. (2022). Shrinking-shifting and amplifying-shifting device using transformation optics. Opt. Quantum Electron. 54 (7), 399. doi:10.1007/s11082-022-03787-5
Mollah, M. A., Sarker, H., Ahsan, M., Elahi, M. T., Based, M. A., Haider, J., et al. (2021). Designing highly sensitive surface plasmon resonance sensor with dual analyte channels. IEEE Access 9, 139293–139302. doi:10.1109/access.2021.3118927
Moutzouris, K., Papamichael, M., Betsis, S. C., Stavrakas, I., Hloupis, G., and Triantis, D. (2014). Refractive, dispersive and thermo-optic properties of twelve organic solvents in the visible and near-infrared. Appl. Phys. B 116 (3), 617–622. doi:10.1007/s00340-013-5744-3
Sharma, V., Kumar, A., Saharan, S., and Semwal, S. (2023). Graphene/Au/MIP-Coated D-shaped optical fiber–based SPR sensor for ethanol detection. Plasmonics 18 (5), 1639–1649. doi:10.1007/s11468-023-01920-y
Sun, M., Wu, H., Song, Y., and Wang, Q. (2023). Surface plasmon resonance alcohol sensor with Ni(OH)2 nanoflowers/Au structure. Measurement 210, 112564. doi:10.1016/j.measurement.2023.112564
Tang, J., Fang, J., Liang, Y., Zhang, B., Luo, Y., Liu, X., et al. (2018). All-fiber-optic VOC gas sensor based on side-polished fiber wavelength selectively coupled with cholesteric liquid crystal film. Sensors Actuators B Chem. 273, 1816–1826. doi:10.1016/j.snb.2018.06.105
Teng, C., Ying, S., Min, R., Deng, S., Deng, H., Chen, M., et al. (2022). Side-polish plastic optical fiber based SPR sensor for refractive index and liquid-level sensing. Sensors 22 (16), 6241. doi:10.3390/s22166241
Wang, F., Wei, Y., and Han, Y. (2024b). High-sensitivity refractive index sensor with dual-channel based on surface plasmon resonance photonic crystal fiber. Sensors 24 (15), 5050. doi:10.3390/s24155050
Wang, Q., Jing, J., Wang, X., Niu, L. Y., and Zhao, W. M. (2020). A D-shaped fiber long-range surface plasmon resonance sensor with high Q-factor and temperature self-compensation. IEEE Trans. Instrum. Meas. 69 (5), 2218–2224. doi:10.1109/tim.2019.2920187
Wang, Q., Zhang, D., Qian, Y., Yin, X., Wang, L., Zhang, S., et al. (2024a). Research on fiber optic surface plasmon resonance biosensors: a review. Photonic Sensors 14 (2), 240201–240230. doi:10.1007/s13320-024-0703-7
Wang, X., Deng, H., Yuan, L., and Yuan, L. (2021). Ultra-high sensitivity SPR temperature sensor based on a helical-core fiber. Opt. Express 29 (14), 22417–22426. doi:10.1364/oe.428199
Wang, X., Zhang, Z., Shan, S., Wildgruber, M., Liu, N., Cheng, Q., et al. (2024c). Sparse sampling photoacoustic reconstruction with a graph regularization group sparse dictionary. Appl. Opt. 63 (20), 5292. doi:10.1364/ao.527424
Xu, R., Niu, G., Xue, Y., Ke, C., Deng, H., Deng, S., et al. (2021). An all-optical vector magnetic field sensor based on magnetic fluid and side-polished hollow-core optical fiber. IEEE Sensors J. 21 (19), 21410–21416. doi:10.1109/jsen.2021.3092216
Yang, J., Guan, C., Yu, Z., Yang, M., Shi, J., Wang, P., et al. (2020). High sensitivity humidity sensor based on gelatin coated side-polished in-fiber directional coupler. Sensors Actuators B Chem. 305, 127555. doi:10.1016/j.snb.2019.127555
Yusoff, S., Lim, C., Azzuhri, S., Ahmad, H., and Zakaria, R. (2018). Studies of Ag/TiO2 plasmonics structures integrated in side polished optical fiber used as humidity sensor. Results Phys. 10, 308–316. doi:10.1016/j.rinp.2018.06.008
Zhang, W., and Luan, N. (2023). Cross-sensitivity immune SPR sensor based on fan-shaped microstructured optical fiber for temperature and refractive index sensing. Opt. Express 31 (17), 27161–27170. doi:10.1364/oe.493786
Zhu, S., Sun, G., and Zhang, C. (2024). D-type photonic crystal fiber sensor with a single-center hole based on surface plasmon resonance. Plasmonics 20 (6), 3693–3698. doi:10.1007/s11468-024-02587-9
Keywords: SP-SMF, refractive index, analytes, optical sensor, optical fiber
Citation: Bilal MM, Thottoli A, Grande M and Lopez-Aguayo S (2025) Numerical and experimental analysis of a side -polished single-mode fiber for refractive index sensing. Adv. Opt. Technol. 14:1560454. doi: 10.3389/aot.2025.1560454
Received: 14 January 2025; Accepted: 30 June 2025;
Published: 10 October 2025.
Edited by:
Sreeramulu Valligatla, Q.ANT GmbH, GermanyReviewed by:
Saikiran Vadavalli, Gandhi Institute of Technology and Management (GITAM), IndiaSomia Abd El-Mottaleb, Alexandria Higher Institute of Engineering and Technology, Egypt
Adarsh Ananthachar, Scantinel Photonics GmbH, Germany
Copyright © 2025 Bilal, Thottoli, Grande and Lopez-Aguayo. This is an open-access article distributed under the terms of the Creative Commons Attribution License (CC BY). The use, distribution or reproduction in other forums is permitted, provided the original author(s) and the copyright owner(s) are credited and that the original publication in this journal is cited, in accordance with accepted academic practice. No use, distribution or reproduction is permitted which does not comply with these terms.
*Correspondence: Servando Lopez-Aguayo, c2VydmFuZG9AdGVjLm14
†These authors contributed equally to this work.
‡Deceased