 Eleonóra Bassi
 Michael Lustenberger
 Srebrenka Letina
- 1Institute for Organizational Viability, School of Management and Law, ZHAW Zurich University of Applied Sciences, Winterthur, Switzerland
- 2Department of Psychology, University of Limerick, Limerick, Ireland
This research examines the structure of blockchain-based voluntary carbon market (VCM) and the factors shaping their formation. Conducted as part of the 2023–2025 Innosuisse project 104.664 IP-EE, it aims to provide insights to support participants in strategic positioning within the network. To our knowledge, this is one of the first empirical attempts to map the blockchain-enabled VCM ecosystem with social-network analysis, thereby extending digital-transition research into the climate-finance domain. Specifically, the study focuses on three exploratory aims: identifying the network position of key participants, evaluating the influence of blockchain platform affiliation on collaboration, and analyzing the relationship between standardization methods and network positioning. Using network analysis, the study categorizes participants like project owners, certification bodies, blockchain platforms, and carbon credit marketplace into distinct roles such as key hubs, strategic bridges, local connectors, and peripheral nodes. Participants using the same blockchain platform exhibit a moderate clustering tendency, suggesting shared infrastructure plays a role in fostering partnerships. Additionally, the choice of standardization methods for carbon credits correlates with specific network positions. These findings offer a structure-based view of how technical design choices may redistribute influence across the market–an issue of growing interest as regulators and standards bodies debate digital registry architectures. By uncovering these dynamics, the study emphasizes the importance of strategic positioning within blockchain-based VCMs. Native tokenization strategies are shown to simplify supply chains, while the decentralized ecosystem fosters diverse approaches to collaboration. The conceptual framework may be transferable to other emerging green-finance networks, providing a springboard for comparative and longitudinal analyses.
1 Introduction
The convergence of blockchain technology with environmental initiatives has given rise to innovative mechanisms for managing carbon emissions (Hua et al., 2020; Schletz et al., 2020; Woo et al., 2021; Zhu et al., 2024). This convergence is particularly evident in the voluntary carbon market (VCM), a marketplace where companies and other organizations can voluntarily purchase carbon credits to offset their greenhouse gas (GHG) emissions (Bayon et al., 2009). Unlike compliance markets regulated by governmental and international bodies, the VCM operates on a voluntary basis, allowing participants to proactively reduce their carbon footprint beyond regulatory requirements. However, the VCM is only a subset of the broader, highly fragmented carbon market, characterized by its complex regulatory framework and the coexistence of various submarkets (Hickey et al., 2023; Kreibich and Hermwille, 2021). The VCM’s self-organized, bottom-up regulation contrasts with the top-down governance of compliance markets, where national governments and international organizations set the rules. In the VCM, companies define the regulations and the traded units to fulfill their individual commitments rather than mandatory quotas (Betz et al., 2022). The VCM is a part of the “baseline-and-credit” system, which aims to reduce or mitigate GHG emissions, complementing the “cap-and-trade” system that regulates emission allowances.
The Paris Agreement’s ambitious goals to limit global temperature rise have intensified the focus on reducing GHG emissions, with companies setting net-zero targets that often exceed legal requirements. Consequently, companies frequently combine compliance and voluntary carbon markets to meet both mandatory and voluntary commitments (Blaufelder et al., 2021). Despite economic fluctuations and reputational challenges, future expectations point towards significant growth in the VCM, driven by pressing climate conditions and consumer pressure on companies. Current market statistics and corporate net-zero targets indicate a substantial increase in demand for carbon credits. In 2020, the voluntary demand for carbon credits was 0.1 gigatons per year, with projections estimating a 15-fold increase by 2030 (Blaufelder et al., 2021). Investment in the VCM has also surged, with $18 billion committed between 2021 and mid-2023, primarily in nature-based solutions (Trove Research, 2023). These investments have been geographically concentrated, with significant sums directed to East Asia, the Pacific region, and North America. However, the capital investment in the VCM far exceeds the actual market size, highlighting the market’s potential and the substantial financial interest in carbon credits.
The academic conversation around the VCM is divided. Critics point out that inconsistent methodologies and weak monitoring have repeatedly under-delivered genuine mitigation, prompting doubts about whether the mechanism should remain the tool for climate action (West et al., 2020; Badgley et al., 2021; Haya et al., 2020). VCM also faces challenges in efficiency and transparency, which have historically led to reputational losses and market inefficiencies (Ahonen et al., 2022; Chen et al., 2021). Kreibich and Hermwille (2021) not only echo the same concern, also arguing that “credibility and feasibility” are caught in a mutually destructive loop, as soon as offset quality is questioned, buyers retreat and the revenues needed to improve standards evaporate. Yet even critical scholars acknowledge that global climate action still lags behind both stated ambitions and the emission cuts science deems necessary. VCMs have been put forward to close that gap, yet they draw equal measures of praise and criticism - faulted for opacity and flaws, valued for their capacity to unlock private finance (Miltenberger et al., 2021). Policy works from the LSE’s Grantham Institute and (LSE, 2023) also notes that, in the absence of a universal carbon tax, voluntary purchases of VCM credits are channeling hundreds of millions of dollars a year into valuable projects that would otherwise struggle for capital, especially in the Global South. The emerging consensus, therefore, is not that the VCM is fundamentally useless but that its governance architecture must be overhauled (Betz et al., 2022; Kreibich, 2024; Ahonen et al., 2022).
Blockchain technology initially sought to address the VCM issues by simplifying and shortening the VCM supply chain, ensuring access and transparency through public chains (Siman et al., 2021; Rawat et al., 2022). Blockchain projects in the VCM include tokenization of carbon credits, which can enhance accessibility, and liquidity. These projects range from native tokenization, where companies issue tokens representing their self-issued carbon credits, to “bridging” solutions that tokenize credits issued by standards like Verra or Gold Standard, facilitating easier trading and transparency (Sorensen, 2023). Early engineering studies showed, in principle, how a permissioned blockchain could replace bilateral over-the-counter trades with peer-to-peer matching, embed tax logic and eliminate credit serial-number reuse (Pan et al., 2019; Mandaroux et al., 2021; Kotsialou et al., 2022). Because the technology landscape is evolving almost monthly, the scholarly literature is, in effect, chasing a moving target. A technology-readiness survey of 39 projects finds that most blockchain initiatives for carbon markets still sit at proof-of-concept level, and concludes that the principal obstacles are fragmented registries, inconsistent measurement, reporting, and verification (MRV) data, and unresolved legal recognition–not any intrinsic limitation of the ledger itself (Sipthorpe et al., 2022). Since the first conceptual ideas several pilot projects have developed further, such as the blockchain-based Singapore AirCarbon Exchange, which delivers greater price transparency while also cutting intermediation costs (Swinkels, 2024). The growing carbon credit hubs in Asia also include tokenization projects, for example, the “Project Ensemble” by the Hong Kong Monetary Authority (HKMA, 2024).
Experiments are pushing the application of blockchain further upstream into the validation process. Studies that couple satellite imagery with hashed data streams for nature-based projects show that real-time deforestation alerts can be anchored immutably to the blockchain, yet the accuracy of those alerts still hinges on sensor resolution and ground-truthing protocols. In short, blockchain can hard-code provenance, it cannot, by itself, guarantee that the underlying measurements are sound (Haryono, 2025; Raja Segaran et al., 2025). Finally, the very efficiency gains that tokenization delivers are beginning to re-wire market infrastructure. Banks and exchanges are building shared settlement layers, whereby Carbonplace’s 2022 (UBS, 2022) pilot is a case in point, and the World Bank’s “Climate Warehouse” prototype envisages standards bodies minting native digital credits that flow seamlessly into either voluntary or compliance. Such developments could reduce the grip of incumbent registries, but they also create new dependencies on networks and cross-chain bridges. Whether those networks enhance competition or simply shift gatekeeping power from registries to ledgers will depend less on cryptographic ingenuity than on the governance rules.
Despite the promising developments, and frequently observed collaboration efforts in blockchain based ecosystems - even between direct competitors, (Faisal et al., 2024; Holm and Goduscheit, 2023), a significant research gap persists in understanding the structure and operational dynamics of the blockchain-based VCM. Currently, little is known about how this emerging ecosystem is organized in terms of its network structure. Addressing this gap is crucial, as understanding certain network characteristics can offer valuable insights into the underlying social processes within the system, providing current market participants and potential new entrants with actionable knowledge. Moreover, these insights into network principles can help identify strategic positions and opportunities.
Our research, conducted as part of the 2023–2025 Innosuisse project 104.664 IP-EE, seeks to explore how blockchain-based solutions in the VCM are organized into networks, how the characteristics of these networks influence the roles of various participants, and how these participants can make strategic decisions to optimize their positioning within the network. By investigating the underlying network principles in this specific ecosystem, the study aims to provide actionable insights for participants navigating in the blockchain-based VCM. Accordingly, the overarching aim of this paper is to analyze the network of participants in the blockchain-based VCM and identify strategic actions they can undertake to change their positioning in the network. We will be guided by three research aims of an exploratory nature:
First, the network of participants in the blockchain-based VCM comprises various types of nodes, such as project owners and developers, certification bodies, blockchain platforms, and carbon credit marketplaces. These nodes differ in their network positions, such as central hubs, connectors, or peripheral participants. Identifying these roles provides insights into the functional dynamics of the network and the influence of specific nodes on market activities.
Second, a critical aspect of the analysis is to explore whether companies using the same blockchain platform are more likely to form partnerships within the network. This involves examining the clustering tendencies of companies based on their blockchain affiliation and evaluating whether shared technology choices correlate with collaborative links or strategic alliances.
Third, participants in the blockchain-based VCM employ different standardization methods for their carbon credits. This study investigates whether the choice of a specific standard is associated with a distinct network position, such as increased centrality or connectivity. Furthermore, it examines whether companies that adopt similar standardization methods show a higher likelihood of forming partnerships, indicating a tendency for homophily based on standardization practices.
By addressing these objectives, the research will reveal how network structure is associated with collaborations and strategic positioning within the blockchain-based VCM. These findings will further contribute to a deeper understanding of the blockchain-based VCM ecosystem and inform the strategic considerations for current market participants as well as potential new entrants. The remainder of this article is organized as follows: Section 1 provides the theoretical and methodological foundation for our study, focusing on the social network analysis of blockchain-based ecosystems. Section 2 details the methods employed for data collection and analysis. Section 3 presents the study’s results, while Section 4 offers a comprehensive discussion of these findings, highlighting their practical and theoretical implications. Finally, Section 5 concludes by summarizing the key insights and offering an outlook for future research.
2 Theoretical and methodological foundation
2.1 Blockchain and networks
Network analysis, or social network analysis (SNA) when nodes in the network are social entities, is a powerful tool for understanding the complex relationships and structures within ecosystems (Borgatti and Li, 2009; Borgatti and Halgin, 2011). As described by Marin and Wellman (2011), SNA is not merely a theory or methodology but a perspective or paradigm that offers flexibility in its application. However, when we look at the applications of network analysis in blockchain ecosystems, we observe that they can be broadly categorized into two research approaches: bibliometric network analysis and transactional network analysis. The first approach involves using network analysis techniques on bibliometric data and academic publications to identify key contributors and themes within the literature about blockchain ecosystems. For instance, Moosavi et al. (2021) systematically reviewed blockchain’s role in supply chain management by applying bibliometric and network analysis to identify key authors, studies, collaboration patterns, and the impact of emerging technologies like IoT and smart contracts. Similarly, Elbashbishy et al. (2022) employed social network analysis to examine factors affecting blockchain implementation in construction, revealing imbalances in the investigation of factors and knowledge gaps that may hinder blockchain adoption in the industry. Yue et al. (2021) also applied network analysis on bibliometric data to highlight that while computer science and interdisciplinary fields focus on the technological impacts of cryptocurrencies, economic literature emphasizes their direct economic outcomes.
The second approach emphasizes the network analysis of blockchain transactions involving cryptocurrencies, such as Bitcoin, Ether, ERC20 tokens, and NFTs, to identify specific network properties and understand the evolution of these networks over time. Jiang and Liu (2021) analyzed transaction data from CryptoKitties to construct a temporal ownership transfer network, providing insights into the dynamics of interactions among players. Tao et al. (2021) investigated Bitcoin transactions, revealing key structural characteristics and behavioral patterns. Somin et al. (2018) employed network theory to analyze 2 months of transaction data on the Ethereum platform ERC20, focusing on emergent patterns of user behavior and token adoption, while Zhang et al. (2023) further conducted a network analysis on transaction data from prominent decentralized finance (DeFi) platforms to assess their decentralization levels and their links to more centralized service providers like Coinbase or Binance.
In summary, network analysis serves mainly as a powerful methodology to explore both the bibliometric landscape and transactional dynamics within the blockchain ecosystem, providing valuable insights into the structure, behavior, and evolution of these networks. The use of the network approach in this paper is closer to the second approach. However, to the best of our knowledge, it has never been applied to analyze the different projects, initiatives, applications, and entities in a specific blockchain-based solution ecosystem for a specific market. Thereby it has been already recognized that network analysis is a valuable methodological approach to systematically studying the structure and mechanism of business ecosystems (Battistella et al., 2013).
2.2 Markets and networks
In the blockchain literature, the term ecosystem is commonly used to describe projects that utilize the same blockchain infrastructure. The term “business ecosystem” has thereby been coined by Moore (1993) and later gained prominence through the research of Iansiti and Levien (2004a), (2004b). They compared business ecosystems to biological ecosystems, emphasizing that both consist of large, loosely connected networks of entities. In this context, companies interact in complex ways, and their health and performance depend on the health of the entire ecosystem. Thus, both companies and species are influenced not only by their internal capabilities but also by their interactions within the ecosystem. To understand the complex dynamics of a business ecosystem or to enter a new one, an organization must therefore analyze its structure and power dynamics and monitor how these elements evolve over time (Iansiti and Levien, 2004a). Iansiti and Levien (2004b) provide a useful summary of the dependencies within ecosystems and the importance of the position held within them. The authors highlight the interpretation of keystone and niche roles and illustrate with corporate examples the potential impact of decisions made by companies in these positions on the overall functioning of the network. Despite the extensive use of network analysis in blockchain ecosystems, its application to analyze specific blockchain-based solution ecosystems for distinct markets remains unexplored. This may be related to a characteristic of ecosystem theory, namely, that the effects of broadly interpreted relational (social) networks are particularly difficult to operationalize empirically.
However, the issue examined in this study can also be analyzed through the lens of supply chain theory. This approach is particularly relevant because the network of business partners under investigation more closely resembles a supply chain network than a traditional social network. As Borgatti and Li (2009) highlighted, the logic of optimal information flow in supply chains differs notably from that in social networks, making this perspective valuable for understanding the dynamics of the analyzed network. The authors reframed the supply chain as a flow network, a patterned set of dyadic ties along which materials, information, money and social influence travel. In standard supply chain management theory, those flows are usually modelled as linear, stage-by-stage processes governed by transaction-cost or resource-based considerations. Network theory, by contrast, directs attention to structure, the configuration of ties (who links to whom), the positions actors occupy within that configuration, and the way structural features might shape behavior and performance.
Borgatti and Li (2009) proposed a much looser relational network compared to traditional network analysis-based studies of supply chains, emphasizing non-hierarchical relationships between connected companies. Nevertheless, from a network perspective, supply chain management research traditionally focuses mainly on the ego-network of a single focal company, examining its direct relationships with suppliers and customers. However, we adopt a broader view by conceptualizing the supply chain network as an expansive ecosystem within a specific environment, such as the blockchain-based VCM. This approach enables us to analyze the entire network within a defined context (“bounded” network), demonstrating that an ecosystem extends beyond the scope of a traditional supply chain network, which in empirical research is often limited to the focal company’s immediate connections.
The network examined in this article consists of entities engaged in issuing and trading nature-based CO2 emission certificates on blockchain platforms. Adopting a relational perspective, we emphasize entities that contribute to creating and delivering value within this network. The network’s boundaries are defined by participants utilizing blockchain technology and operating within the carbon market. Our analysis specifically centers on organizations offering technological solutions for nature-based credits, deliberately excluding those employing alternative methodologies or targeting different market segments. Building on Borgatti and Li’s (2009) interpretive framework and its application by Kim et al. (2011), we will therefore first examine the network’s structure, identifying potential groups and actors occupying central or distinctive positions. Network theory suggests that the structure of a network significantly influences the performance and success of individual actors and vice versa (Borgatti and Halgin, 2011). It is important to note that the scope of the present study does not extend to analyzing the impact of the structure on companies’ success. Such an analysis would require a different research design incorporating firm-level performance data, which lies beyond the focus of this structural network study. Accordingly, we do not evaluate whether the observed network configurations lead to superior performance or effectiveness, nor do we make normative claims about the success of blockchain-based VCMs compared to non-blockchain alternatives. Our aim is to describe and analyze the structural characteristics of the ecosystem as it currently exists, not to assess its outcomes. Understanding the network structure enables new entrants to form strategic connections and avoid risks such as becoming locked-in or falling into network traps (Gargiulo and Benassi, 2000). Key structural features, such as network density, centralization, and clustering, play critical roles in determining vulnerability to breakdowns, stability, and opportunities for participants.
3 Materials and methods
3.1 Data collection
Entities within the network include project owners, project developers, and other stakeholders integral to issuing and trading nature-based CO2 emission certificates. Rather than pre-grouping these entities, we identified them based on their roles within the network. Relationships, or edges, are defined as instances where one entity relies on another to issue or trade nature-based CO2 emission certificates on blockchain platforms. This was operationalized as a one-mode network with undirected, binary and unweighted ties. The primary data source for this analysis is the ECOTA database, which catalogues organizations developing blockchain-based carbon tokenization solutions (Roesgen et al., 2023).
From this database, we extracted a subset focusing specifically on nature-based credits, excluding organizations unrelated to the carbon market, however including organizations that provide technological solutions related to nature-based credits. Organizations whose activities do not align with the traditional carbon market were not included in the analysis. Specifically, we excluded those that do not utilize CO2-based accounting or rely on donations rather than market mechanisms for funding. Additionally, companies employing technology-driven reduction methods were omitted due to their substantial differences from nature-based solutions. Likewise, we excluded initiatives focused solely on the aviation industry, given its unique regulatory framework and limited integration with the VCM, as well as firms specializing in insetting solutions, which target emission reductions within their own supply chains.
The list of companies included in the database was expanded with additional entries following verification of each project if they met the specified requirements. (The number of companies ranges between 77 and 117 depending on the network analyzed, see number of nodes in Table 1). The data collection period took place between January and July 2024. Additionally, we followed research-based imputation, and we considered projects referenced in the available academic literature. In the case of selected organizations, we focused on two aspects: the type of blockchain and the named partners. The selection of the companies was necessitated for both conceptual and methodological reasons. Conceptually, the market is underpinned by the principle of carbon-based accounting. While this approach is frequently a subject of debate, it currently serves as an institutionalized prerequisite for market entry in its extant form, thus mandating our adherence to this norm. Methodologically, the analysis becomes problematic when dealing with networks whose boundaries are not adequately defined. In this context, we regarded the utilization of blockchain technology and the participation in (or association with) the carbon market as defining parameters for these boundaries.
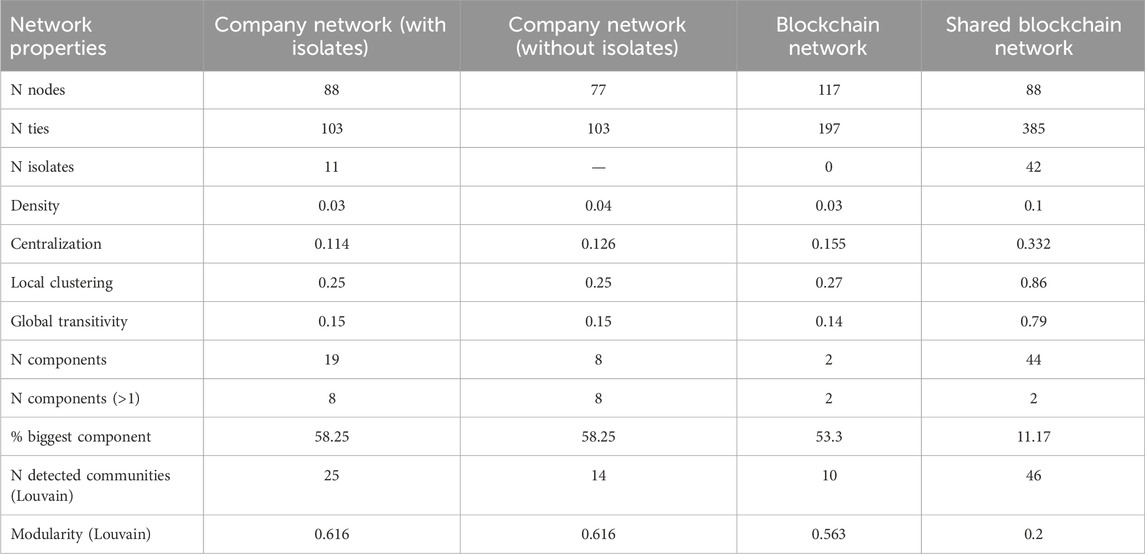
Table 1. Basic, descriptive network properties.
The validation of the data used for network analysis was conducted in multiple stages. The available data were verified through online accessible sources (such as company websites and social media pages). Additionally, for those companies where contact information was available, we reached out to request personal validation of the data regarding the used blockchain and partners. As with any data collection process, it is important to acknowledge the potential limitations of the database. Projects in very early stages, those associated with non-blockchain-based companies, or those with non-English websites were more likely to be excluded from the database. However, organizations omitted due to limited disclosure of their blockchain infrastructure–often resulting from these characteristics–would likely appear in the network as isolates or very low-degree nodes. Including such peripheral actors might extend the tail of the degree distribution and slightly reduce the average network density, but it would leave the identity and relative ranking of the highly connected hubs unchanged. Conversely, the likelihood of having missed a genuinely central player is small. Firms that already maintain many ties have strong incentives to be visible on the market. In other words, the most probable omissions sit at the margins of the graph and are unlikely to alter the structural patterns on which our conclusions rest.
3.2 Data analysis
This study employs both descriptive and inferential methods specifically designed for network data, addressing the inherent interdependence of network data. Descriptive methods include quantifying network properties and describing node positions using some commonly applied whole network and node-based metrics. These computations were performed using the igraph R package (Csardi and Nepusz, 2006). To assess the importance of specific ties in the network, we calculated the edge-betweenness measure for each type of tie. Inferential methods were employed to make statistically valid comparisons while accounting for the non-independence of network data. Group comparisons of node properties (e.g., degree centrality) and edge properties (e.g., edge-betweenness) were conducted using permutation tests implemented in the rcompanion R package (Mangiafico and Mangiafico, 2017).
Permutation tests are necessary in network analysis as traditional parametric tests assume independence among observations, an assumption violated in network data where relationships among nodes are interdependent. To explore the overlap between different types of ties within the same network, we used the Jaccard index, which ranges from 0 (no overlap) to 1 (complete overlap). The statistical significance of the overlap, described in terms of correlation of the presence or absence of ties between two sets of ties on the same set of actors, was assessed using the quadratic assignment procedure (QAP). QAP is particularly suited for network data as it preserves the structure of the network during hypothesis testing (Borgatti et al., 2022). Finally, we employed multiple regression quadratic assignment procedure (MRQAP) for binary outcomes (presence or absence of a tie) to investigate specific research questions in greater detail. MRQAP-based methods, implemented in the sna R package (Butts, 2008), do not model the network structure explicitly as exponential random graph models, but are appropriate for our research questions as they allow the testing of multiple mechanisms within the network while preserving its structural properties. For visualization, we used Python version 3.12.7 along with the following packages: pandas, numpy, networkx, and matplotlib.
4 Results
4.1 Networks
Defining the network required careful consideration of whether blockchains should be included as part of its structure. While their exclusion was supported by the argument that blockchains do not clearly meet the characteristics typically associated with companies and are difficult to conceptualize as traditional partners due to their decentralized, open-use nature, their inclusion was supported by the assumption that their role in ecosystem organization and the formation of the network structure is significant. Importantly, their inclusion in the network analysis is based on their observable embeddedness in relational patterns among companies, rather than on any normative assumptions about their value, success, or performance. However, to address this dual perspective, we analyzed two networks in parallel–one including blockchains and one excluding them. Furthermore, we developed a third, alternative network that does not reflect formal partnerships but instead derives connections from the shared use of a blockchain. This alternative network served exclusively to explore the structure of blockchain-driven relationships, showing the structure of the company network if it was entirely based on shared blockchain usage. The basic network properties are shown in Table 1.
The analysis involved examining the following networks:
1. “Company network”: A network of companies that does not consider the blockchains connected to these companies as partners. (It was constructed by taking out the nodes that are blockchains from the network N = 29).
2. “Blockchain network”: A network of companies where the associated blockchains are included as partners.
3. “Shared blockchain network”: A network of companies that is not based on existing partnerships but assumes latent connections between companies using the same blockchains.
The descriptive result reveals that the company network and the blockchain network have a similarly low density (around 0.03), indicating sparse connections relative to the number of possible ties. This is in contrast when the network of shared blockchain is considered, where 10% of possible ties exist. In the company network and the blockchain network, centralization, local and global clustering are low in absolute values, suggesting that there are no great variation in the number of ties that actors have in the network and the low tendency for triadic closure - the tendency of two nodes to be connected if they both have ties to the same third node, respectively. This reflects a sparse and decentralized network structure, where companies do not form tightly knit groups or extremely well-connected actors. Those structural characteristics are rather different for the network of shared blockchain, that is more centralized and highly transitive. The blockchain network has two connected components, while the company network has eight components. The largest component is slightly bigger in the company network, covering 58.3% of nodes, compared to 53.3% in the blockchain network, while in the shared blockchain network it includes only 11.7% of nodes.
This indicates that while the company and the blockchain networks have overall low connectivity, there is a core group of companies maintaining a significant portion of the network’s connectedness, while the opposite is the case for the shared blockchain network. The Louvain community detection algorithm detected more communities in the company network than in the blockchain network, with modularity scores indicating a clearer community structure in the company network. This implies that despite low transitivity (triadic closure) networks - especially company networks - display some community structure. That is not the case for the shared blockchain network that, based on modularity score, has no clear community structure. Further analyses were done for the network of companies without isolates (nodes that have at least one connection).
4.1.1 Centralization and transitivity in comparison to random networks
For most social networks, regardless of the type of ties, it is expected that they do not show a random structure (Newman and Park, 2003) due to their self-organizing nature. Centralization reflects an uneven distribution of ties, where some companies play a relatively more central role in the network. Transitivity reveals that companies are more likely to form connections through mutual partners than would occur randomly. The centralization and transitivity of the company network were significantly higher than those observed in 10,000 random networks with the same number of nodes and ties. The 95% confidence intervals for the distribution of centralization and transitivity in the random networks were 0.03–0.07 and 0.00–0.06, respectively. This indicates that the network exhibits a stronger tendency for ties to be unevenly distributed across nodes (centralization) and for two companies connected to the same third company to also be connected to each other (transitivity) compared to what would be expected in a random graph (see Figure 1).
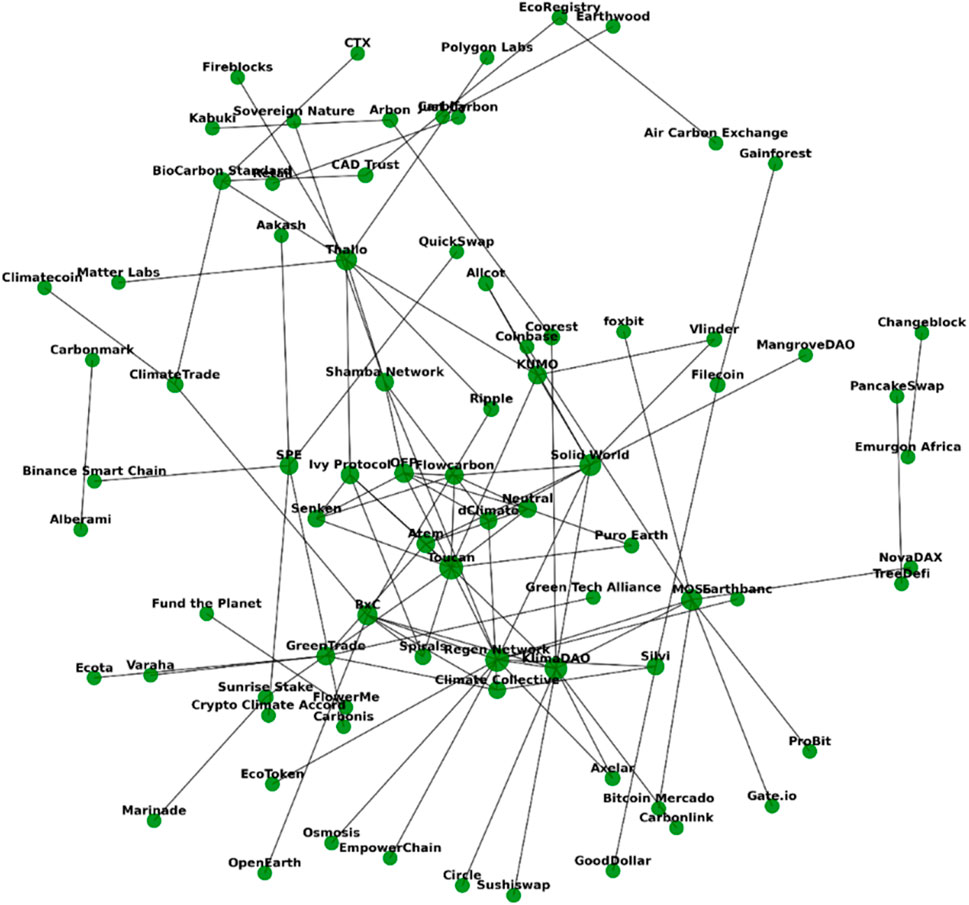
Figure 1. Network of companies without isolates.
Overall, the findings suggest that the structure of blockchain-based VCM is not random, but rather that there is an organizing principle according to which companies establish relationships with each other.
4.1.2 Comparing edge-betweenness of blockchain and non-blockchain ties
We examined whether ties involving blockchains (see Figure 2 – blue nodes) were more important for network connectivity than other ties by calculating the edge betweenness of each edge in the network - as an indicator of ties’ importance for maintaining network connectivity. We then compared the average edge betweenness of ties connected to blockchains with that of other ties. Higher edge betweenness indicates that a larger number of shortest paths between any two nodes pass through a given tie. On average, ties connected to blockchains had higher edge betweenness than ties between companies (103 vs 85.3, respectively), suggesting that blockchain ties are more central to the network’s connectivity. To assess whether this difference could have occurred by chance, we conducted 1,000 permutations and found that the observed difference was not statistically significant (p = 0.092). In other words, while blockchains may have a greater integrative role, the effect is not strong enough to conclude a definitive structural advantage.
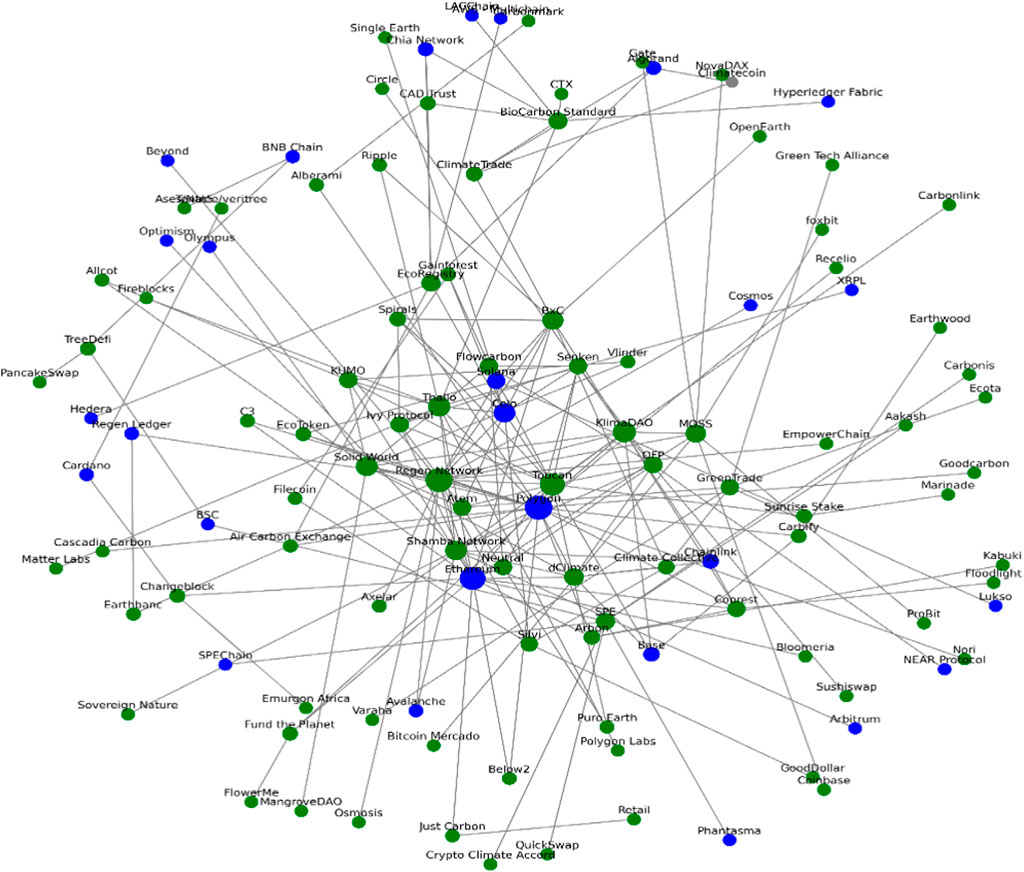
Figure 2. Blockchain based network (blue nodes - blockchains, green nodes - companies).
4.2 Node classification
4.2.1 Correlations between centralities measures
From the perspective of network formation, the most central nodes can fulfil different functions (or roles) within the structure. For example, the node with the most connections is not necessarily the same one that ensures connectivity between different parts of the network. Nevertheless, in the case of the network we examined, these functions were strongly correlated.
Table 2 shows that four centrality measures (betweenness, closeness, clustering, and eigenvector) correlate moderately to highly with the simplest measure of centrality: degree centrality (the number of ties a node has). To classify nodes into different groups based on their centrality, we chose to use degree centrality and eigenvector centrality. While degree centrality reflects the number of a node’s direct connections, eigenvector centrality accounts for both the number of connections and the importance of the nodes to which it is connected. Nodes connected to other highly central nodes have higher eigenvector centrality scores. We combined these two measures by calculating their average to construct a contingency table with four quadrants, representing four types of nodes in the network (see Figure 3):
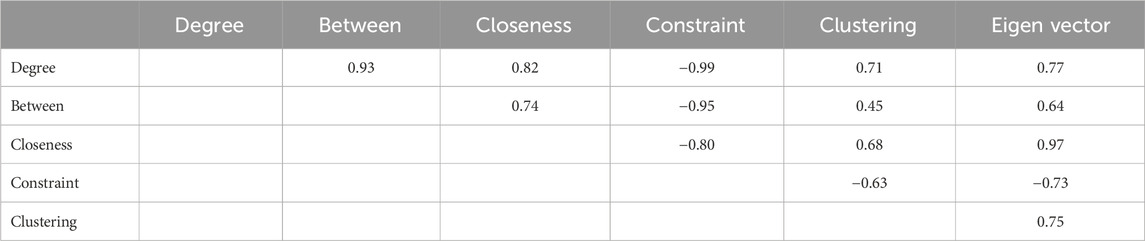
Table 2. Spearman’s correlations between centralities measures in the companies network.
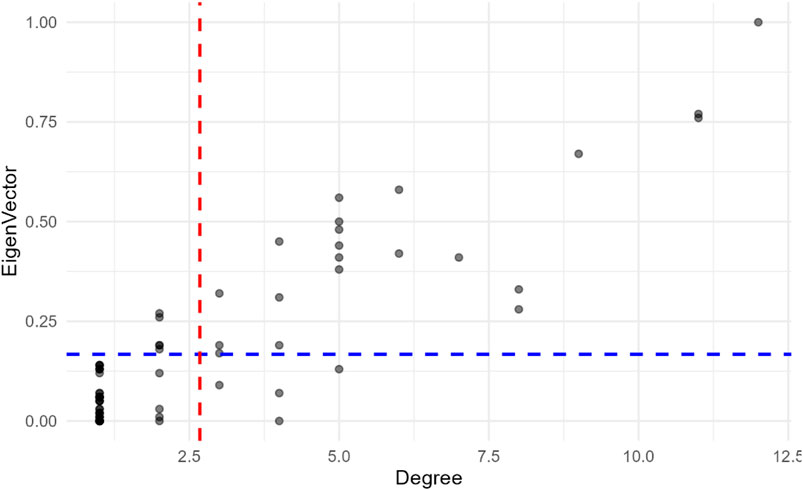
Figure 3. Scatterplot of degree and eigenvector centralities for companies showing four quadrants based on mean values.
4.2.1.1 Quadrant 1: “Peripheral nodes” (low degree and low eigenvector)
Companies in this quadrant have limited direct connections and are not well-connected to influential nodes. They occupy peripheral positions in the blockchain-based network, which may limit their access to information and opportunities. Although we refer to them as peripherals from a network structure perspective, more than half of the analyzed companies belonged to this group. These may include new entrants, smaller participants, or actors for whom the significance of blockchain technology remains peripheral within their network strategy. A great example of the latest group is EcoRegistry, an established market participant and a multi-chain platform operating since 2018. Additional examples include Carbify or Alberami, based on the information received during the validation process, the companies primarily focus on environmental rather than technological aspects when seeking partnerships.
4.2.1.2 Quadrant 2: “Local connectors” (high degree and low eigenvector)
Participants in this category have many direct connections but are not well-linked to influential nodes. They serve as local connectors, maintaining strong activity and visibility within specific clusters or subgroups. While their influence on the broader network may be limited, they are critical for fostering collaboration and supporting information flows within their immediate surroundings. In terms of structural role, these companies are considered unique, with only four of them present in the sample. They may also provide redundancy and resilience to the network by connecting fewer central nodes. In this group, a good example is Biocarbon Standard, which has been operating since 2019 and was among the first to issue tokenization guidelines for carbon credits. Their network is extensive, however, in terms of their role in the blockchain-based carbon market, they primarily function as a classic standard-setting entity. They connect companies, which use their standards. Rather than focusing on technological solutions, their mission is to establish and maintain market integrity.
4.2.1.3 Quadrant 3: “Strategic bridges” (low degree and high eigenvector)
These companies have fewer direct connections but are linked to highly influential nodes. Their position suggests they act as strategic bridges, indirectly accessing key resources and information through their connections to central players. They are the second smallest group in the sample with five companies. Despite their relatively low direct connectivity, they can exert influence by leveraging their proximity to influential actors, making them valuable intermediaries or brokers in the network. As a good example, Vlinder can be mentioned, which is engaged in the development of high-quality nature-based credits and has been referenced as a partner by several centrally positioned blockchain projects.
4.2.1.4 Quadrant 4: “Key hubs” (high degree and high eigenvector)
These companies are the most influential nodes in the blockchain-based network. They not only have a large number of direct connections (high degree) but are also connected to other influential nodes (high eigenvector centrality). As key hubs, they play a central role in maintaining network cohesion, facilitating the flow of information, and acting as gatekeepers for resources or opportunities. Their position allows them to exercise significant strategic influence over the network. A common characteristic among them is their primary focus on supporting innovation in the carbon market through technological advancements. This includes credit tokenization (e.g., Toucan, Moss), supply chain innovation (e.g., Regen Network), decentralized data solutions (e.g., dClimate), and the development of new types of marketplaces for carbon credits (e.g., Senken, Thallo) and related financial vehicles (Solid World, KlimaDAO). The five companies with the highest degree and eigenvector centralities are shown in Tables 3.
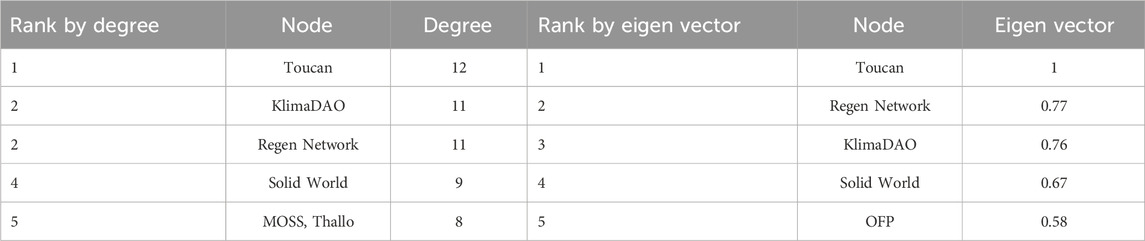
Table 3. Top five ranked companies with the highest degree and eigenvector centralities.
4.2.2 Network of shared blockchains and its overlap with partnership networks
A key question of our research was whether the network of relationships among companies present in the market is “blockchain-dependent” - that is, whether companies using the same infrastructure are more likely to establish partnerships with each other. We constructed the “latent network” of companies such that a tie was assigned between two companies if they shared the same blockchain, otherwise, no tie was assigned. This resulted in a network with 384 ties. The networks of shared blockchains (latent network) and partnerships (company network) had 30 overlapping ties, with a Jaccard index of 0.065. Since the Jaccard index only considers present ties when estimating similarity, we also used a quadratic assignment procedure (QAP)-based correlation to assess similarity, accounting for both present and absent ties. Based on 20,000 permutations, the QAP correlation coefficient was 0.11 (p < 0.0001), indicating a small but significant association between the presence or absence of partnership ties and the sharing or non-sharing of the same blockchain. In other words, the small but significant QAP correlation suggests a weak association between shared blockchain usage and partnership ties.
Additionally, we examined whether the 30 overlapping ties were more important for network connectivity in the partnership network than the non-overlapping ties. While overlapping ties had a higher average edge betweenness (61 vs 59.5), the difference was not statistically significant (p = 0.881, based on 1,000 permutations). Based on the results, companies deployed on the same blockchain are more likely to collaborate, but in a sparse network that does not translate to many overlapping blockchain and collaboration ties, and they do not play a significant role in the overall structure and connectivity of the network. In other words, the underlying blockchain infrastructure is not the only mechanism creating the network structure. Other factors, such as shared principles, geographical proximity, or alignment in target markets, may also drive the formation and evolution of network connections.
4.2.3 Predicting partnership ties between companies
The database contained a limited number of variables that could explain the structure of relationship formation besides common blockchain infrastructure. As a derived variable, we examined the methods companies use for tokenization. The “legacy” attribute of a company refers to the tokenization of credits issued under classic standards, while “native” attribute refers to companies that use the individual issuance of credits. We run five progressively more complex MRQAP models to predict the likelihood of two companies to be partners. The results are shown in Table 4.
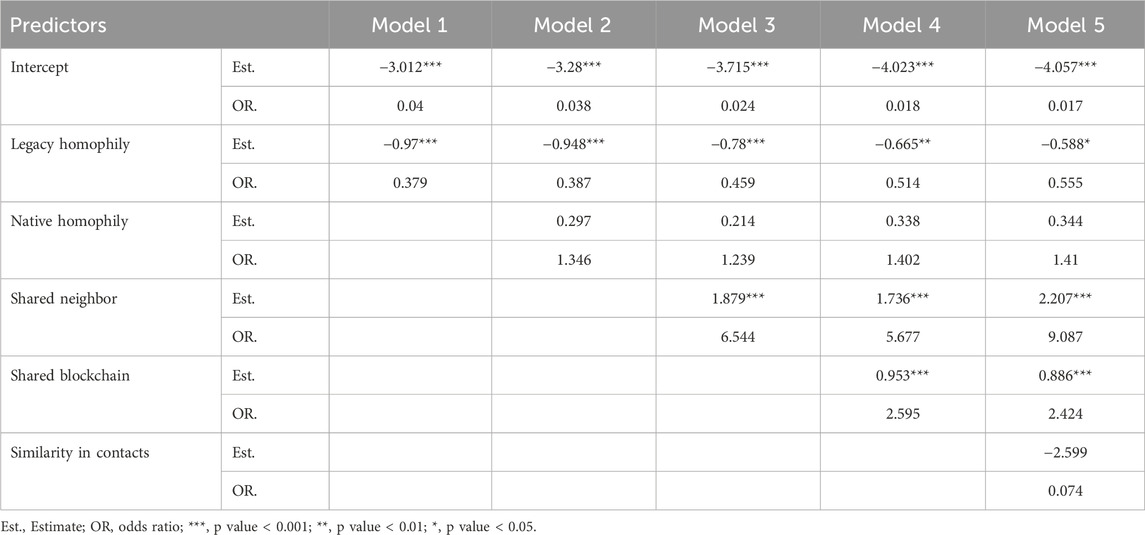
Table 4. MRQAP results of five models. Dependent variable: having a partnership tie in the network of companies.
The intercept is consistently negative across all models and statistically significant (p < 0.001). This indicates that in the absence of other predictors, the baseline likelihood of a tie existing is very low, as reflected by the small odds ratios close to 0. The “legacy homophily” predictor refers to the pair of nodes where both use the same standardization method (legacy), and it has a consistently negative and significant effect on tie formation across all models. This suggests that two companies with this standardization method have a reduced likelihood of forming a partnership tie with each other. While the effect weakens slightly across the models, the consistent significance implies that homophily in legacy as a standardization method has a robust inhibitory effect on tie formation. The “native homophily” predictor refers to pairs of firms that have native standardization method and is included starting in Model 2. However, it is not statistically significant in any model (p > 0.05), suggesting that two companies that use the native method are not more or less likely to form a tie. This finding is consistent across all models. However, it is important to note, that the number of companies employing native tokenization was low in the network, which limits the possibility of detecting less strong tendencies.
The shared neighbor parameter indicates whether two companies have one or more companies with which both have a partnership. The parameter is added in Model 3 and is significant in Models 3 to 5 (p < 0.001). Its strong positive estimates (e.g., in Model 3 and Model 5) indicate that having a shared neighbor substantially increases the likelihood of a tie. The shared blockchain parameter is introduced in Model 4 and signifies a pair of companies that have the same blockchain. This parameter is also significant (p < 0.001) and the positive estimates and odds ratios indicate that sharing blockchain information promotes tie formation, though the effect size is smaller than for the shared neighbor parameter. The similarity in contacts is measured with Jaccard similarity of contacts for each pair of companies, where a higher value indicates a higher similarity of contacts. This predictor appears only in Model 5, and it is not statistically significant (p = 0.081). Although the estimate is negative, there is no evidence that similarity in contacts affects tie formation.
As a conclusion we can state that shared neighbors have the strongest effect, highlighting the importance of indirect connections in facilitating partnerships. Shared blockchains also significantly increase the likelihood of partnerships, though the effect is smaller. Conversely, the legacy standardization method has a robust negative effect, suggesting that companies using this method are less likely to form ties with each other. Neither the homophily in native standardization method nor similarity in contacts were significantly associated with the existence of a partnership tie, suggesting their limited role in shaping network connections.
4.2.4 Association between sharing a blockchain and having similar contacts in the network
Additionally, the QAP correlation (based on 20,000 permutations) showed no significant association between sharing a blockchain and having similar contacts in the network (p = 0.37). This implies that two companies using the same blockchain are not more likely to have the same partners. This result aligns with our previous finding regarding low overlap between shared blockchain network and partnership network.
4.2.5 Comparison of centrality of companies with different standardization procedures
To explore how differences in standardization methods relate to variations in network positions, we examine the average degrees of companies categorized as using legacy, native, mixed, or unclassified approaches. The highest average degree was observed in the Mixed group (6.00), followed by the Legacy group (5.0), a group with missing information labeled “None” (1.65), and the Native group, which had the smallest average degree (1.50). A one-way ANOVA, based on 1,000 permutations, revealed significant differences in average degree among companies with different standardization procedures (χ2 = 25.3, p < 0.001). This finding aligns with the earlier observation that legacy companies are less likely to form partnerships, contributing to their relatively lower connectivity in the network. A detailed comparison between the groups is presented in Table 5.
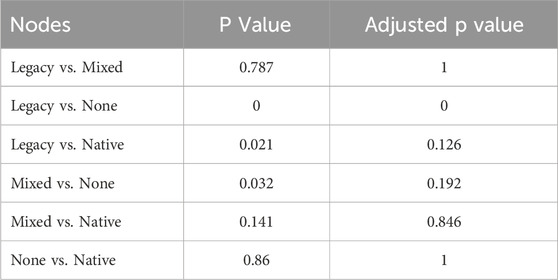
Table 5. Pairwise permutations test between each group.
5 Discussion
5.1 Choices of blockchain infrastructure and tokenization approach
One of the primary challenges for market participants is the selection of blockchain infrastructure for protocol deployment. The blockchain ecosystem is still in its early stages, marked by fragmentation and the coexistence of numerous platforms. This diversity forces participants to make strategic decisions concerning interoperability and alignment with specific ecosystems. While interoperability solutions, such as blockchain “bridges,” can facilitate interactions between different infrastructures, they introduce added costs, dependencies, and risks (Zhang et al., 2024). Thus, decisions regarding blockchain infrastructure go beyond technical considerations, influencing how participants connect and collaborate within the broader network. Our study shows that these infrastructural choices affect the formation and dynamics of relationships in blockchain-based VCMs, embedding them within broader network structures. Nevertheless, our findings challenge the notion that blockchain inherently unifies market participants. Based on our analysis, the blockchain-based VCM ecosystem exhibits low network density, and no single blockchain infrastructure dominates. Instead, the network emerges as a decentralized and diverse ecosystem where technological tools serve as enablers rather than drivers of connectivity.
Although platforms like Polygon, Ethereum, and Celo are among the most frequently used, the absence of a dominant blockchain hub underscores the decentralized nature of the market. Notably, the network structure does not support treating any blockchain platform as central; their presence shows only a weak association with partnership patterns and limited impact on interconnectivity. Emphasizing individual platforms as structurally distinct or dominant may therefore misrepresent the decentralized, relationship-driven nature of the ecosystem. This decentralization is further evidenced by the low overlap between partnership networks and shared blockchain affiliations, suggesting that collaborative relationships, rather than technological alignment, are the primary drivers of connectivity. However, when absent ties are considered using QAP analysis, our finding suggests that there is still a statistically significant, albeit weak, relationship between the blockchain affiliation and companies’ partnership. The role of blockchain infrastructure in coordinating activities within the network is nuanced. Instead, market participants often connect through shared partners rather than aligning around a single blockchain. The limited impact of blockchains is presumably influenced by the fact that most companies strive for a multi-chain infrastructure, which places bridge-providers in a central role.
In addition to the choice of blockchain infrastructure, an equally critical consideration is how carbon credits are tokenized. Two dominant approaches have emerged: “legacy tokenization,” which digitizes credits issued under established standards (e.g., Verra, Gold Standard), and “native tokenization,” which leverages blockchain-native processes for issuance. These approaches have distinct implications for network configuration. Legacy tokenization, while benefiting from the credibility of traditional standards, is constrained by regulated frameworks, as illustrated by Verra’s prohibition on tokenizing its credits (Verra, 2022). In contrast, native tokenization bypasses traditional frameworks, offering transparency and efficiency but facing trust deficits among buyers due to its departure from established procedures. Interestingly, projects utilizing native tokenization tend to have shorter supply chains, as they often consolidate multiple functions within a single entity, reducing the number of partnerships required. In contrast, legacy tokenization projects integrate into existing systems and may even add layers of complexity. These differences are reflected in the nature of partnerships, legacy projects often engage in competitive relationships with one another, whereas native projects lean toward cooperative connections. The difference demonstrates that companies adopting different tokenization methods might follow distinct relationship-building strategies. In short, while legacy tokenization benefits from established market trust and regulatory recognition, it is constrained by existing frameworks that may hinder innovation. Conversely, native tokenization offers greater transparency and efficiency through blockchain’s inherent features but faces challenges related to buyer trust and regulatory uncertainty. These trade-offs present distinct risks, and how the market will evaluate these contrasting advantages and disadvantages over time remains unclear, as the VCM ecosystem is still evolving and not yet settled.
5.2 Roles within the network
Applying principles of social network analysis to blockchain-based carbon markets reveals key insights into the interplay between tokenization strategies and network structures. Marketplaces, and bridge providers naturally exhibit high connectivity due to their central roles in facilitating interactions and enabling interoperability. However, clear distinctions emerge between legacy and native tokenization projects. Legacy tokenization initiatives typically form a larger number of connections but maintain a cautious distance from competitors to preserve market share. This approach reflects their strategic positioning as new entrants seeking to establish a foothold in a competitive landscape. Conversely, native tokenization projects often have fewer connections but maintain ties with core network players, reflecting a streamlined approach that consolidates multiple functions. These projects appear to capitalize on their independence from traditional frameworks. At the same time, their positioning may reflect broader market trends, including resistance from established players in traditional carbon markets.
Overall, participants in blockchain-based VCM networks can be categorized into four “roles” based on their connectivity and influence, each offering strategic opportunities for network positioning. Key Hubs are the most connected and influential actors, shaping network cohesion and resource flows. To maintain their dominance, they must carefully manage their centrality to avoid becoming bottlenecks while fostering broad collaboration. Strategic Bridges, despite having fewer direct connections, leverage their links to highly influential nodes to act as intermediaries, mediating relationships and facilitating collaboration, which adds significant value to the network. Local Connectors, active within specific clusters, play a critical role in fostering local collaboration and information flow, but strengthening ties with Key Hubs can amplify their influence beyond their immediate network. Finally, Peripheral Nodes, often smaller actors or new entrants with limited connections, can improve their integration by forming strategic partnerships with central players, allowing them to access resources and opportunities. Or they remain in a peripheral role in the blockchain-based market and primarily considers other factors - such as environmental aspects - in its connectivity strategy. These roles provide actionable insights for participants seeking to navigate and optimize their positions in the blockchain-based VCM ecosystem.
5.3 Implications and recommendations
In light of network theory, our findings on the structure of the blockchain-based VCM lead to several strategic considerations. We propose these considerations as practical implications and recommendations for market stakeholders. First, market participants should prioritize collaboration over technological alignment because our findings show that shared blockchain infrastructure alone has only a weak influence on partnership formation. Instead, connectivity within the ecosystem is more strongly shaped by relational factors and strategic alliances. To strengthen resilience and operational efficiency, actors could invest in relationship-building mechanisms such as shared governance frameworks, industry consortia, and data interoperability protocols that encourage cooperation across organizational and technological boundaries. Furthermore, due to the continued existence of a fragmented, multi-chain landscape, organizations are advised to adopt flexible, multi-chain strategies and engage with interoperability providers not only for technical integration but also as central coordination nodes that can facilitate wider ecosystem connectivity.
Second, the tokenization strategy plays an important role in shaping organizational behavior and market dynamics. The choice between legacy and native tokenization strategies should be made with a clear understanding of how these models influence compliance, credibility, supply chain design, partnership scope, and trust-building. Companies pursuing native tokenization could proactively address buyer skepticism through third-party audits, transparency standards, and open data initiatives to close the trust gap and drive adoption. Conversely, legacy tokenization projects could consider ways to increase operational efficiency and avoid overreliance on restrictive institutional frameworks that possibility impede innovation. Policymakers and standard-setting bodies could further evaluate the risks and benefits of these models and provide clearer guidance on acceptable practices, especially regarding the intersection of on-chain and off-chain verification and ensuring data integrity across frameworks.
Third, stakeholders should recognize the importance of their strategic positioning within the network. Our role-based network analysis shows that actors can adopt different positions, such as Key Hubs, Strategic Bridges, Local Connectors, or Peripheral Nodes, depending on their objectives and capabilities. Rather than aspiring to centrality for its own sake, organizations should tailor their approach. For example, smaller or emerging actors can improve their integration and visibility by forming targeted alliances with key hubs or acting as bridges between sub-networks. At the same time, central actors must avoid becoming bottlenecks by encouraging open standards and inclusive governance. However, continuous monitoring of evolving network structures and market dynamics will be essential for all participants seeking to adapt and thrive in this fast evolving and changing ecosystem. Ultimately, strategic decisions regarding blockchain infrastructure, tokenization, and network role must be made in coordination, not in isolation, to unlock the full potential of blockchain-based carbon markets.
Finally, the role-based distinctions made in this study have more than just practical value. They also contribute to theory by extending social network theory to the under-explored context of blockchain-based environmental markets. Previous studies on blockchain in carbon markets have focused on technical capabilities or policy integration, rather than how actor positions are shaped by–and shape–technological and institutional arrangements. By mapping structural roles in a decentralized, multi-chain setting, our findings advance the theoretical understanding of how coordination, power, and innovation diffuse in digitally mediated environmental governance.
6 Conclusion
The rapid evolution of blockchain-based voluntary carbon markets (VCMs), particularly for nature-based CO2 emission certificates, raises critical questions about how ecosystem participants and market entrants navigate the complexities of infrastructure and procedural decision-making. These questions lie at the heart of our research, which explores how blockchain infrastructure choices and tokenization methods influence the network structure of this emerging market. Blockchain technology is often touted for its transformative potential in addressing persistent inefficiencies in traditional market structures. Our research did not extend to examining whether the innovations often promised by blockchain technology - such as transparency, efficiency, and pricing - have been realized in the analyzed projects. However, an analysis of the market structure suggests that for companies offering native tokenization, the consolidation of functions has led to shorter supply chains. In the long term, the trust shown in these solutions and the strengthening of their market position may serve as evidence that the innovations they provide are not only viable but also valuable for the carbon market. However, until now buyer-side readiness for such innovations remains uncertain, as trust - historically anchored in the reputation of certifying bodies - must now be cultivated through the perceived integrity of decentralized systems. This shift represents a significant educational challenge with no assured outcome. Conversely, when standardized credits are tokenized, the supply chain may become more transparent without necessarily being simplified, reflecting the complexities of adapting blockchain solutions to established frameworks.
The blockchain-based VCM ecosystem comprises a range of participants - including project owners, certification bodies, blockchain platforms, and carbon credit marketplaces - each occupying distinct roles within the network. Whether as Key Hubs, Strategic Bridges, Local Connectors, or Peripheral Nodes, these roles influence the capacity of participants to shape market activities and collaborate effectively. Entities such as standards, registries, and bridge providers benefit from extensive connections, enabling collaboration and interoperability, which confer a competitive edge. In contrast, “closed system” protocols derive strength from their independence, minimizing reliance on external actors and mitigating vulnerabilities. These differing strategies underscore the diversity of approaches within the ecosystem, shaped by organizational goals and specific market contexts.
From a methodological perspective, our study demonstrates the value of network analysis as a tool for understanding the structural dynamics of blockchain-based VCMs. This approach provides a detailed overview of market configurations, shedding light on the strategic roles of different entities and the factors shaping their relationships. By adopting a network perspective, this study offers valuable insights for academics and practitioners aiming to navigate this rapidly evolving field. Nonetheless, our research has several limitations that future studies should address. First, it does not examine the end-user perspective on carbon credits, nor does it incorporate economic performance metrics, firm-level data, or market share data. Therefore, it cannot make claims about the success or efficiency of the (blockchain-based) VCM. Second, the dynamic nature of blockchain-based VCM partnerships - characterized by continuous formation, reconfiguration, and dissolution - poses a challenge, requiring ongoing monitoring of network structures to ensure the relevance and applicability of insights. Additionally, this study focuses solely on the blockchain-based segment of the broader carbon market. This necessarily excludes entities operating outside the blockchain ecosystem, including numerous buyers. However, this limited scope should not be interpreted as an evaluative judgment of the entire VCM landscape. Future research could adopt longitudinal approaches to better capture the evolution of these networks over time and should potentially include other relevant attributes of the actors (e.g., performance data, token transfer flow, age of the company, location, etc.) in the analysis. Furthermore, comparative analyses between blockchain-based and traditional carbon markets could help clarify whether distinct governance or network structures are associated with measurable differences in outcomes such as liquidity, transparency, or transaction efficiency. Investigating buyer-side attitudes toward blockchain-based VCMs, particularly regarding trust and transparency, could provide critical insights for market practitioners. Finally, exploring how blockchain technology can integrate more seamlessly with existing standards and regulatory frameworks would help bridge the gap between innovation and market readiness, fostering broader adoption and trust in these systems.
Data availability statement
The raw data supporting the conclusions of this article will be made available by the authors on request, without undue reservation.
Author contributions
EB: Conceptualization, Data curation, Formal Analysis, Investigation, Methodology, Project administration, Supervision, Validation, Visualization, Writing – original draft, Writing – review and editing. ML: Conceptualization, Data curation, Formal Analysis, Funding acquisition, Investigation, Validation, Writing – original draft, Writing – review and editing. SL: Data curation, Formal Analysis, Investigation, Methodology, Software, Validation, Visualization, Writing – original draft, Writing – review and editing.
Funding
The author(s) declare that financial support was received for the research and/or publication of this article. Open access funding by Zurich University of Applied Sciences (ZHAW).
Conflict of interest
The authors declare that the research was conducted in the absence of any commercial or financial relationships that could be construed as a potential conflict of interest.
Generative AI statement
The author(s) declare that Generative AI was used in the creation of this manuscript. The generative AI tool ChatGPT 4.0 was used solely for language refinement and writing assistance. No AI-generated content contributed to the conceptual development, data analysis, or substantive findings of this study.
Publisher’s note
All claims expressed in this article are solely those of the authors and do not necessarily represent those of their affiliated organizations, or those of the publisher, the editors and the reviewers. Any product that may be evaluated in this article, or claim that may be made by its manufacturer, is not guaranteed or endorsed by the publisher.
References
Ahonen, H.-M., Kessler, J., Michaelowa, A., Espelage, A., and Hoch, S. (2022). Governance of fragmented compliance and voluntary carbon markets under the Paris Agreement. Polit. Gov. 10 (1), 235–245. doi:10.17645/pag.v10i1.4759
Badgley, G., Freeman, J., Hamman, J. J., Haya, B. K., Trugman, A. T., Anderegg, W. R., et al. (2021). Systematic over-crediting in California’s forest carbon offsets program. Glob. Change Biol. 28, 1433–1445. doi:10.1111/gcb.15943
Battistella, C., Colucci, K., De Toni, A. F., and Nonino, F. (2013). Methodology of business ecosystems network analysis: a case study in Telecom Italia Future Centre. Technol. Forecast. Soc. Change 80 (6), 1194–1210. doi:10.1016/j.techfore.2012.11.002
Bayon, R., Hawn, A., and Hamilton, K. (2009). Voluntary carbon markets: an international business guide to what they are and how they work. 2nd ed. London: Routledge. doi:10.4324/9781849773737
Betz, R., Michaelowa, A., Castro, P., Kotsch, R., Mehling, M., Michaelowa, K., et al. (2022). The carbon market challenge: preventing abuse through effective governance. 1st ed. Cambridge: Cambridge University Press. doi:10.1017/9781009216500
Blaufelder, C., Levy, C., Mannion, P., and Pinner, D. (2021). A blueprint for scaling voluntary carbon markets to meet the climate challenge. McKinsey Rep. Available online at: https://www.mckinsey.com/capabilities/sustainability/our-insights/a-blueprint-for-scaling-voluntary-carbon-markets-to-meet-the-climate-challenge#/.
Borgatti, S. P., Everett, M. G., Johnson, J. C., and Agneessens, F. (2022). Analyzing social networks using R. Thousand Oaks: Sage.
Borgatti, S. P., and Halgin, D. S. (2011). On network theory. Organ. Sci. 22 (5), 1168–1181. doi:10.1287/orsc.1100.0641
Borgatti, S. P., and Li, X. (2009). On social network analysis in a supply chain context. J. Supply Chain Manag. 45 (2), 5–22. doi:10.1111/j.1745-493x.2009.03166.x
Butts, C. T. (2008). Social network analysis with sna. J. Stat. Softw. 24, 1–51. doi:10.18637/jss.v024.i06
Chen, H., Letmathe, P., and Soderstrom, N. (2021). Reporting bias and monitoring in clean development mechanism projects. Contemp. Account. Res. 38 (1), 7–31. doi:10.1111/1911-3846.12609
Csardi, G., and Nepusz, T. (2006). The Igraph Software Package for complex network research. InterJournal Complex SystComplex Sy.
Elbashbishy, T. S., Ali, G. G., and El-adaway, I. H. (2022). Blockchain technology in the construction industry: mapping current research trends using social network analysis and clustering. Constr. Manag. Econ. 40 (5), 406–427. doi:10.1080/01446193.2022.2056216
Faisal, M. N., Sabir, L. B., AlNaimi, M. S., Sharif, K. J., and Uddin, S. F. (2024). Critical role of coopetition among supply chains for blockchain adoption: review of reviews and mixed-method analysis. Glob. J. Flexible Syst. Manag. 25, 117–136. doi:10.1007/s40171-023-00369-6
Gargiulo, M., and Benassi, M. (2000). Trapped in your own net? Network cohesion, structural holes, and the adaptations of social capital. Organ. Sci. 11 (2), 183–196. doi:10.1287/orsc.11.2.183.12514
Haryono, H. (2025). Digital transformation in carbon trading: combination of satellite and blockchain technology in REDD+ schemes. West Sci. Agro 3 (1), 69–75. doi:10.58812/wsa.v3i01.1727
Haya, B., Cullenward, D., Strong, A. L., Grubert, E., Heilmayr, R., Sivas, D. A., et al. (2020). Managing uncertainty in carbon offsets: insights from California’s standardized approach. Clim. Policy 20 (9), 1112–1126. doi:10.1080/14693062.2020.1781035
Hickey, C., Fankhauser, S., Smith, S. M., and Allen, M. (2023). A review of commercialisation mechanisms for carbon dioxide removal. Front. Clim. 4, 1101525. doi:10.3389/fclim.2022.1101525
HKMA (2024). HKMA unveils Project Ensemble to support the development of the Hong Kong tokenisation market. Available online at: https://www.hkma.gov.hk/eng/news-and-media/press-releases/2024/03/20240307-5/ (Accessed June 12, 2025).
Holm, K., and Goduscheit, R. C. (2023). Exploring the opportunities of blockchain-enabled coopetition: learnings from the wind turbine industry. Int. J. Technol. Manag. 93 (3/4), 295–315. doi:10.1504/IJTM.2023.133927
Hua, W., Jiang, J., Sun, H., and Wu, J. (2020). A blockchain based peer-to-peer trading framework integrating energy and carbon markets. Appl. Energy 279, 115539. doi:10.1016/j.apenergy.2020.115539
Iansiti, M., and Levien, R. (2004a). Keynotes and dominators: framing operating and technology strategy in a business ecosystem. Harvard Business School Working Paper, No. 03–061.
Jiang, X. J., and Liu, X. F. (2021). Cryptokitties transaction network analysis: the rise and fall of the first blockchain game mania. Front. Phys. 9, 631665. doi:10.3389/fphy.2021.631665
Kim, Y., Choi, T. Y., Yan, T., and Dooley, K. (2011). Structural investigation of supply networks: a social network analysis approach. J. Operations Manag. 29 (3), 194–211. doi:10.1016/j.jom.2010.11.001
Kotsialou, G., Kuralbayeva, K., and Laing, T. (2022). Blockchain’s potential in forest offsets, the voluntary carbon markets and REDD+. Environ. Conserv. 49 (3), 137–145. doi:10.1017/s0376892922000157
Kreibich, N. (2024). Toward global net zero: the voluntary carbon market on its quest to find its place in the post-Paris climate regime. Wiley Interdiscip. Rev. Clim. Change 15 (5), e892. doi:10.1002/wcc.892
Kreibich, N., and Hermwille, L. (2021). Caught in between: credibility and feasibility of the voluntary carbon market post-2020. Clim. Policy 21 (7), 939–957. doi:10.1080/14693062.2021.1948384
LSE (2023). The voluntary carbon market and sustainable development. Available online at: https://www.lse.ac.uk/granthaminstitute/publication/the-voluntary-carbon-market-and-sustainable-development/?utm_source=chatgpt.com (Accessed June 12, 2025).
Mandaroux, R., Dong, C., and Li, G. (2021). A European Emissions Trading System powered by distributed-ledger technology: an evaluation framework. Sustainability 13 (4), 2106. doi:10.3390/su13042106
Mangiafico, S., and Mangiafico, M. S. (2017). Package ‘rcompanion’. CRAN Repos. 20, 1–71. doi:10.32614/CRAN.package.rcompanion
Marin, A., and Wellman, B. (2011). “Social network analysis: an introduction,” in The SAGE handbook of social network analysis. Editors J. Scott, and P. J. Carrington (London: SAGE Publications), 11–25.
Miltenberger, O., Jospe, C., and Pittman, J. (2021). The good is never perfect: why the current flaws of voluntary carbon markets are services, not barriers to successful climate change action. Front. Clim. 3, 686516. doi:10.3389/fclim.2021.686516
Moore, J. F. (1993). Predators and prey: a new ecology of competition. Harv. Bus. Rev. 71 (3), 75–86.
Moosavi, J., Naeni, L. M., Fathollahi-Fard, A. M., and Fiore, U. (2021). Blockchain in supply chain management: a review, bibliometric, and network analysis. Environ. Sci. Pollut. Res. 1–15. doi:10.1007/s11356-021-13094-3
Newman, M. E., and Park, J. (2003). Why social networks are different from other types of networks. Phys. Rev. E 68 (3), 036122. doi:10.1103/physreve.68.036122
Pan, Y., Zhang, X., Wang, Y., Yan, J., Zhou, S., Li, G., et al. (2019). Application of blockchain in carbon trading. Energy Procedia 158, 4286–4291. doi:10.1016/j.egypro.2019.01.509
Raja Segaran, B., Mohd Rum, S. N., Hafez Ninggal, M. I., and Mohd Aris, T. N. (2025). Efficient ML technique in blockchain-based solution in carbon credit for mitigating greenwashing. Discov. Sustain 6, 281. doi:10.1007/s43621-025-01044-9
Rawat, V., Dahiya, N., Rai, S., and Arora, A. (2022). “A blockchain-based decentralized framework for carbon accounting, trading and governance,” in 2022 8th international conference on computer technology applications, New York, NY, USA: Association for Computing Machinery, 148–153. doi:10.1145/3543712.3543755
Roesgen, M. G., Zaehringer, L., Filler, A., Wilke, N., Graf, D., Linggih, N., et al. (2023). Web3 carbon database (October 2023) [Dataset]. European Carbon Offset Tokenization Association (ECOTA) and Positiveblockchain. Available online at: https://www.ecota.io/ecota-web3-carbon-database [Accessed March 10, 2025].
Schletz, M., Franke, L. A., and Salomo, S. (2020). Blockchain application for the Paris Agreement carbon market mechanism—a decision framework and architecture. Sustainability 12 (12), 5069. doi:10.3390/su12125069
Siman, K., Friess, D. A., Huxham, M., McGowan, S., Drewer, J., Koh, L. P., et al. (2021). Nature-based solutions for climate change mitigation: challenges and opportunities for the ASEAN region. COP26 Universities Network. Available online at: https://napier-repository.worktribe.com/output/2814839/nature-based-solutions-for-climate-change-mitigation-challenges-and-opportunities-for-the-asean-region (Accessed March 06, 2025).
Sipthorpe, A., Brink, S., Leeuwen, T., and Staffell, I. (2022). Blockchain solutions for carbon markets are nearing maturity One Earth 5, 779–791. doi:10.1016/j.oneear.2022.06.004
Somin, S., Gordon, G., and Altshuler, Y. (2018). “Network analysis of ERC20 tokens trading on Ethereum blockchain,” in Unifying themes in complex systems IX: proceedings of the ninth international conference on complex systems (Cham: Springer International Publishing), 439–450.
Swinkels, L. (2024). Trading carbon credit tokens on the blockchain. Int. Rev. Econ. Finance 91, 720–733. doi:10.1016/j.iref.2024.01.012
Tao, B., Dai, H. N., Wu, J., Ho, I. W. H., Zheng, Z., and Cheang, C. F. (2021). Complex network analysis of the bitcoin transaction network. IEEE Trans. Circuits Syst. II Express Briefs 69 (3), 1009–1013. doi:10.1109/tcsii.2021.3127952
Trove Research (2023). Carbon credit investment report 2023. Available online at: https://www.msci.com/www/research-report/investment-trendsand-outcomes/04638716796 (Accessed March 06, 2025).
UBS (2022). Building a voluntary carbon market. Available online at: https://www.ubs.com/global/en/investment-bank/insights-and-data/2022/carbonplace-pilot-trade.html#:∼:text=The%20carbon%20credit%20lifecycle%2C%20including%20the%20retirement%20process%2C,and%20a%20solution%20to%20many%20current%20market%20challenges (Accessed June 12, 2025).
Verra (2022). Verra addresses crypto instruments and tokens. Available online at: https://verra.org/verra-addresses-crypto-instruments-and-tokens/(Accessed March 06, 2025).
West, T. A., Börner, J., Sills, E. O., and Kontoleon, A. (2020). Overstated carbon emission reductions from voluntary REDD+ projects in the Brazilian Amazon. Proc. Natl. Acad. Sci. U. S. A. 117, 24188–24194. doi:10.1073/pnas.2004334117
Woo, J., Fatima, R., Kibert, C. J., Newman, R. E., Tian, Y., and Srinivasan, R. S. (2021). Applying blockchain technology for building energy performance measurement, reporting, and verification (MRV) and the carbon credit market: a review of the literature. Build. Environ. 205, 108199. doi:10.1016/j.buildenv.2021.108199
Yue, Y., Li, X., Zhang, D., and Wang, S. (2021). How cryptocurrency affects economy? A network analysis using bibliometric methods. Int. Rev. Financial Analysis 77, 101869. doi:10.1016/j.irfa.2021.101869
Zhang, M., Zhang, X., Zhang, Y., and Lin, Z. (2024). “Security of cross-chain bridges: attack surfaces, defenses, and open problems,” in Raid ‘24: proceedings of the 27th international symposium on research in attacks, intrusions and defenses, New York, NY, USA: Association for Computing Machinery, 298–316. doi:10.1145/3678890.3678894
Zhang, Y., Chen, Z., Sun, Y., Liu, Y., and Zhang, L. (2023). “Blockchain network analysis: a comparative study of decentralized banks,” in Science and information conference (Cham: Springer Nature Switzerland), 1022–1042.
Keywords: voluntary carbon market, blockchain, network analysis, tokenization, strategy
Citation: Bassi E, Lustenberger M and Letina S (2025) Blockchain-based voluntary carbon market: strategic insights into network structure. Front. Blockchain 8:1603695. doi: 10.3389/fbloc.2025.1603695
Received: 31 March 2025; Accepted: 09 July 2025;
Published: 21 July 2025.
Edited by:
Shishank Shishank, Birmingham City University, United KingdomReviewed by:
Larry C. Bates, Independent Researcher, United StatesOtilia Manta, Romanian Academy, Romania
Copyright © 2025 Bassi, Lustenberger and Letina. This is an open-access article distributed under the terms of the Creative Commons Attribution License (CC BY). The use, distribution or reproduction in other forums is permitted, provided the original author(s) and the copyright owner(s) are credited and that the original publication in this journal is cited, in accordance with accepted academic practice. No use, distribution or reproduction is permitted which does not comply with these terms.
*Correspondence: Michael Lustenberger, bHVzZUB6aGF3LmNo