 Rebeka Gulyás1†
 Veronika Alexandra Gál
 Zoltán Sipiczki
- 1Hungarian University of Agriculture and Life Sciences, Economic and Regional Sciences Doctoral School, Kaposvár, Hungary
- 2Hungarian University of Agriculture and Life Sciences, Institute of Rural Development and Sustainable Economy, Kaposvár, Hungary
This study explores how integrating cryptocurrencies into traditional financial portfolios can influence investment performance. Focusing on Bitcoin and Ethereum alongside key European stock indices (BUX, DAX, and FTSE), the analysis examines whether blockchain-based assets can enhance diversification and improve the balance between risk and return. Using weekly market data from 2019 to 2023, the research applies Markowitz mean–variance optimization to identify optimal asset allocations under different objectives such as maximizing the Sharpe ratio, minimizing risk, and maximizing returns. The findings reveal that cryptocurrencies show weak correlations with European stock indices, suggesting meaningful diversification potential. When included in portfolios, Bitcoin and Ethereum can significantly boost returns, though they also increase volatility. Portfolios optimized for risk reduction favored traditional indices, while those targeting higher returns relied predominantly on cryptocurrencies. Overall, combining digital and conventional assets produced a more balanced performance, with the Sharpe-ratio–maximized portfolio demonstrating the best trade-off between stability and profitability. These results indicate that cryptocurrencies can play a valuable complementary role in modern portfolio construction. They are most suitable for investors willing to accept higher risk in exchange for potentially greater rewards, while more risk-averse investors may benefit from maintaining a stronger focus on traditional equity indices. The study contributes to understanding how blockchain-driven assets can expand financial opportunities and supports a broader view of diversification in contemporary investment strategies.
1 Introduction
This study aims to investigate the advantages and difficulties of incorporating cryptocurrencies into financial portfolios. This research focusing on regional European datasets—including Hungary—through the analysis of the BUX, DAX, and FTSE indices, and by applying specific optimization methods. The paper’s motivation to examine the practical implications of integrating major blockchain-based assets into traditional investment portfolios. By analyzing their interaction of cryptocurrencies with established European stock indices, the study addresses key economic questions surrounding the diversification, risk, and return dynamics of blockchain assets in real-world financial markets. With the growing interest in cryptocurrencies, an increasing number of academics have begun to investigate the feasibility of incorporating Bitcoin and other cryptocurrencies into investment portfolios. However, the number of published studies on this topic remains limited. Particularly absent are works examining the general impact of cryptocurrencies, their correlation with other asset classes, or their volatility. Most studies have concentrated on U.S.-based assets as the starting point for analyzing portfolio diversification (Kajtazi and Moro, 2018).
Investment approaches have evolved alongside the development of financial markets. While minimizing risk has always been a priority, achieving acceptable returns has also become critical. Traditional portfolio theory concentrated on the examination of individual securities, often neglecting the interdependencies that are crucial for portfolio performance. Markowitz’s modern portfolio theory (MPT) transformed this area when it introduced a framework for optimizing the expected returns-risk combinations also. A key aspect of Markowitz’s theory was the emphasis on accounting for probability and risk when structuring portfolios, particularly by considering mean (expected return) and variance. The theory also highlighted that the risk of individual securities is less relevant than their covariance in determining portfolio risk (Lekovic, 2021). This approach transformed portfolio construction and significantly impacted financial markets and investment practices.
2 Literature review
Blockchain technology acts as a catalyst for reducing transaction costs while enabling decentralized finance platforms for expanding financial opportunities. This distributed ledger technology fosters a new model for trust thus easing financial services with novel business models that were previously inaccessible or economically unfeasible due to high cost (Mhlanga, 2023). Blockchain technologies are dynamic, and this dynamism is a challenge to customary financial dichotomies. For example, blockchain technologies challenge the distinction between formal or informal or mainstream versus alternative financial systems. Blockchain’s application is addressing itself to profitability, risk management, and to interoperability in the remittance sector specifically (Rella, 2019). Blockchain creates new pathways for financial participation. By democratizing access to financial instruments and services, it lowers the barriers to entry for a wider range of investors (Jutel, 2023).
The Blockchain technologies has brought changes to the investment landscape. Cryptocurrencies also have significant price volatility with opportunities for high returns and substantial risks. This volatility attracts investors seeking high returns and willing to accept higher risk exposure (Brynjarsson and Ágústsdóttir, 2022).
Blockchain based investment assets are relatively new field in financial literature. Nevertheless, their unique characteristics along with growing interest, have drawn significant attention from researchers, thereby expanding the body of literature in this domain. Researchers’ interest in the investment characteristics of cryptocurrencies come from two primary factors. First, cryptocurrencies are independent of traditional financial and monetary authorities and from government institutions. Secondly, these digital assets have demonstrated extremely high returns and significant volatility. These attributes have motivated academics to explore optimized portfolios with cryptocurrencies (Brynjarsson and Ágústsdóttir, 2022).
2.1 The impact of blockchain technology on portfolio performance
Briere, Oosterlinck, and Szafarz (2015) used weekly data 2010–2013 to study Bitcoin investments. According to their data, volatility and average returns were particularly high during this time. Additionally, there was little link between the price of Bitcoin and other assets. The authors concluded that Bitcoin investments provide diversification advantages after conducting a number of tests. According to their research, a modest investment in Bitcoin can raise risk-return ratio. However, they warned that as the data only shows early-stage Bitcoin price fluctuation, these conclusions should be interpreted cautiously.
The combinations of Bitcoin with conventional stock and bond benchmark portfolios were examined by Platanakis and Urquhart, (2020). To determine the prospective worth of Bitcoin, they examined eight distinct portfolio development techniques using data gathered between October 2011 and June 2018. According to their data, volatility and average returns were particularly high during this time. Additionally, there was little link between the price of Bitcoin and other assets. The authors came to the conclusion that Bitcoin investments provide diversification advantages after conducting a number of tests. Using daily data from 2012 to 2019, Kajtazi and Moro (2018) examined the performance of Bitcoin’s using a Conditional Value at Risk (CVaR) framework was compared with post hoc tests. Their results showed that the addition of Bitcoin enhances portfolio performance, increasing returns opposed to decreasing volatility. However this remarkable performance was closely linked to Bitcoin sharp price increase in 2013. Despite Bitcoin’s speculative nature, the authors conclusion that it may help diversify a portfolio.
Kajtazi and Moro (2018) aimed to assess the impact of integrating Bitcoin into portfolios using daily data from 2012 to 2019. Post-hoc tests were conducted to compare the performance of Bitcoin’s role in portfolios employing a Conditional Value at Risk (CVaR) framework. Their findings confirmed that Bitcoin’s inclusion improves portfolio performance, primarily through increased returns rather than reduced volatility. This improvement was closely linked to Bitcoin’s exceptional performance in 2013, when its price surged dramatically. The authors concluded that Blockchain based investment could contribute to portfolio diversification. Wang et al. (2024) examined Bitcoin, as an highly speculative financial instrument, but they found that Chinese green bonds are suitable for diversifying the risks of portfolios. Aggarwal and Santosh (2018) looked the adopting benefits of Bitcoin in case of Indian investors from August 2010 to December 2016. They used eight indices in several asset classes, equities, securities, and other alternative investments. Leveraging the CVaR approach for optimal asset allocation, their results indicated that Bitcoin-inclusive portfolios yielded better in case of long-only and equal-weight strategies. Eisl et al. (2015) examined how Bitcoin investments influence diversified portfolios between July 2010 and April 2015. Similar to Aggarwal and Santosh, (2018), they applied a CVaR approach. Their findings also highlighted that Bitcoin’s inclusion is crucial for achieving optimal portfolios. Wu and Pandey, (2014) focused on evaluating Bitcoin’s role not only as a currency but its utility as an investment asset. Their results suggest that while Bitcoin has limited utility as a currency, it could play a vital role in improving portfolio performance.
In his research, Abdelmalek, (2023) studied the impacts of holding different cryptocurrencies on portfolio diversification and investment decisions. During the pandemic, the study sought to determine the extent to which cryptocurrencies, singularly or in aggregate, contributed to augmenting the performance of a diversified portfolio comprising mainly of traditional assets. The author applied two portfolio optimisation methods in the analysis: the Markowitz model and maximum Sharpe ratio optimisation. For benchmark comparison, naïve diversification rules were also assessed. The results indicated that cryptocurrencies’ diversification benefits were much less evident prior to the pandemic, but became particularly pronounced during the pandemic. Additionally, the study noted that the benefits of diversification are greater when cryptocurrencies are included in a portfolio that is already diversified, as opposed to when they are managed in isolation. Demiralay and Bayraci, (2021) studied the diversification potential of cryptocurrencies within stock portfolios using correlation analysis. They noted that during crises, the correlations increase which diminishes the diversification potential. In their study, Grujic and Soja, (2022) examined the diversification benefits of Eurozone stock indices and Bitcoin. The research aimed to determine what proportion of Bitcoin is justified in the structure of a portfolio, considering the return-to-risk ratio. The analysis included daily data on the movements of selected stock indices and Bitcoin. The results suggest that including Bitcoin in the portfolio is justified, and for institutional investors, a Bitcoin share of approximately 6% is recommended. Popova and Kau, (2022) pointed out that if an asset carries significant extreme risk, mean-variance optimization may not result in an optimal portfolio, especially when asset returns do not follow a normal distribution. Authors developed a new Monte Carlo simulation method that more accurately models observed empirical return distributions and takes extreme values into account. According to their results, the combined application of stochastic optimization and the new method enables the creation of more efficient portfolios. These portfolios exhibit better return-to-risk ratios than those constructed using traditional mean-variance optimization. Furthermore, their research findings suggest that Bitcoin can contribute to portfolio diversification, especially when the optimization process considers not only the average return and standard deviation, but also all key characteristics of the return distributions.
Aliu et al. (2021a) aimed to explore diversification abilities of cryptocurrencies with stock assets from the Visegrád stock exchanges. The research conducted three independent experiments to examine the diversification benefits offered by cryptocurrencies. According to the results of the other two experiments, cryptocurrencies couse a higher risk into the portfolio but also provide higher returns. Özbek’s (2023) study examined Bitcoin’s diversification possibilities. The research analyzed the relationship between Bitcoin and the BIST 100, as well as the S&P 500 indices. The study period ran from 2 November 2020, to 19 July 2022, which was divided into four subperiods with both bull and bear market phases. Based on the findings, including Bitcoin in portfolios may result in better diversification, particularly in the case of the BIST 100 index.
The literature on portfolio optimization focused exclusively on cryptocurrencies is rapidly expanding. Platanakis and Urquhart, (2018) examined the optimal Markowitz diversification strategies in crypto currency portfolios. This study analyzed the performance of a portfolio with four popular cryptocurrencies, the dataset covered the period from February 2014, to January 2018. Their results revealed only minimal differences between naive and optimal diversification strategies. The aim of Mazanec’s (2021) research was to construct optimal cryptocurrency portfolios using the Markowitz model. Their study analyzed a sample of 16 virtual currencies, based on daily closing prices from 1 October 2017, to 13 January 2020. The results suggests, the best-performing portfolio included three cryptocurrencies: Cardano, Binance Coin, and Bitcoin. The examined currencies showed a moderately strong correlation with one another, except for Tether, which significantly differed from the rest and behaved as an atypical asset. The researcher also pointed out that high correlation can reduce the effectiveness of diversification. Bakry et al. (2021) investigated the role of Bitcoin in portfolio diversification within portfolio optimization frameworks. They analyzed the maximization of Sharpe ratio across different portfolio strategies. Their findings suggest that Bitcoin is a valuable diversifying asset. However, the study cautions that for risk-averse investors, high amount of Bitcoin could result losses during market stress periods. Henriques and Sadorsky, (2018) analyze Bitcoin’s role in portfolios by treating it as “digital gold,”. They analyzed with multivariate GARCH models—including DCC, ADCC, and GO-GARCH—they conduct analyses which demonstrate that Bitcoin can effectively reduce portfolio risk.
According to Allen’s, (2022) analysis, during the pandemic, cryptocurrencies - most notably Bitcoin and Ethereum - began to exhibit increasing comovement with the S&P 500, but their interrelationship remained stable. Utilizing both parametric and non-parametric methods, their study concludes that during crisis periods, cryptocurrencies offer limited diversification benefits.
Based on the reviewed literature, multiple studies confirm the positive impact of including Bitcoin in a diversified asset portfolio. Research by Briere et al. (2015), Platanakis and Urquhart (2020), Kajtazi and Moro (2018), Aggarwal and Santosh (2018), Eisl et al. (2015), Wu and Pandey (2014), Abdelmalek, (2023), Grujic and Soja (2022), Letho et al. (2022), Popova and Kau (2022), Aliu et al. (2021a), Özbek (2023), Bakry et al. (2021), Henriques and Sadorsky (2018) and Almeida and Goncalves, (2023) provides evidence across various optimization techniques and data periods. Nevertheless, Platanakis et al. (2018) and Braunies and Mestel, (2019) demonstrate that optimizing portfolios composed only with cryptocurrencies has not led to improved risk-adjusted performance. In these analyses they concluded that, exclusive reliance on cryptocurrencies did not better exploit the balance between expected returns and risk in portfolios. Focusing on Bitcoin Dikovitsky, (2025) explored, how can public discourse influence price dynamics within an hour of publication by analyzing the semantic content of news headlines. Using the machine learning techniques of BERT, GPT models and GloVe vector representations, his model was able to predict price movements with 79% accuracy. Vitulyova et al. (2024) proposed a new method to study the impact of space weather factors on people’s economic behavior. Based on the statistics of Ethereum and Bitcoin cryptocurrency transactions, they performed a cross-correlation analysis of the relationship between the two parameters, which resulted in a confirmed relationship. This analysis also confirms that crypto markets are highly psychology-driven markets, so a portfolio consisting solely of cryptocurrencies carries irrational risk.
2.2 Blockchain technology as hedging and safe-haven assets
In recent years, cryptocurrencies have garnered increasing attention not only as investment assets but also as potential hedging and safe-haven instruments against instability. This section reviews research on the role of cryptocurrencies, as hedging and safe-haven assets to understand their potential in portfolio protection and risk mitigation. Urquhart and Zhang, (2019) adopted a unique approach to examine the correlation between Bitcoin and global currencies, analyzing data at an hourly frequency from 1 November 2014, to 31 October 2017. Given Bitcoin’s high volatility, the hourly analysis enabled a more dynamic perspective. Using an ADCC model (asymmetric dynamic conditional correlation), they found that Bitcoin served as an intraday hedge for CHF, EUR, and GBP, while functioning as a diversification tool for AUD, CAD, and JPY. When these currencies experienced instability, Bitcoin provided a relatively stable alternative for investors.
Susilo et al. (2020) focused on how cryptocurrencies can hedge equity investments, particularly during the 2018 cryptocurrency bubble and in relation to domestic currencies. They analyzed the Bitcoin, Monero, Ripple, Ethereum, and Litecoin against Southeast Asian equity indices as well as developed market equities for the period 8 August 2015, to 2 July 2019. They revealed that no single cryptocurrency provided significant hedging against equities. While the combined performance of the five cryptocurrencies marginally hedged equities, the effect was weak. They concluded that adding cryptocurrencies to portfolios was not an effective strategy for diversification or risk reduction. Commodities were found to be a better hedging option for emerging markets in Southeast Asia. Wing et al. (2019) investigated Bitcoin’s hedging and diversification potential against major stock indices across different time periods. Using not only pairwise GARCH models but also Constant conditional correlation (CCC) data from October 2010 to October 2017, Bitcoin provided effective hedging capabilities, particularly at a monthly frequency. Additional models based on varying data frequencies revealed that Bitcoin’s returns effectively hedged indices such as S&P 500 and Euro STOXX at average frequencies and the Shanghai A-Share index at less frequent intervals.
Dyhrberg (2016) analyzed Bitcoin’s hedging capabilities against the FTSE Index and US dollar during July 2010 to May 2015. Bitcoin functioned effectively. While Bitcoin had some short-term hedging capacity against the dollar, this was primarily due to its high trading frequency. Dyhrberg concluded that Bitcoin serves as an effective hedge, such as gold and other traditional assets. Liu et al. (2024) found that in times of high inflation, Bitcoin is an excellent option for investors to diversify their investment, but it cannot serve as a hedge like gold during times of economic turmoil and high uncertainty. They came to a similar conclusion, namely, that Bitcoin does not function as a safe option during turbulent market situations (Su et al., 2022). Pourpourides (2025) examined the long-term relationship between key macroeconomic and financial variables and various cryptocurrency metrics, including prices, market capitalization and Bitcoin’s hash rates. He found that the US dollar and gold price have strong, statistically significant negative effects on Bitcoin and other crypto assets and the impact of the US dollar on Bitcoin is 21–27 times larger compared to gold. This study therefore supports the interpretation of Bitcoin as a digital store of value similar to gold. The study by Ghabri et al. (2022) examines hedging strategies during the pandemic. The authors analyzed volatility spillovers between financial markets, using the VAR spillover model developed by Diebold and Yilmaz (2014). The study investigates how gold, bitcoin, and tether performed as hedging, applying the ADCC-GARCH method (Capiello et al. 2006). The results indicate that market risks significantly increased during the pandemic, and gold proved to be the most reliable asset, while bitcoin’s role was more volatile. Chopra and Mehta’s, (2022) study investigates bitcoin’s hedging within a portfolio of stocks, bonds, and real estate assets across both developed and emerging markets, over a 10-year period including the pandemic. Based on DCC-GARCH analysis bitcoin can only be considered a weak hedging asset and does not yet fulfill the role of a stable financial asset. Nevertheless, portfolio managers should consider its future potential.
In their study, Su et al. (2021) examine the effect of Bitcoin on U.S. political shifts. The results show that bitcoin can be a safe asset during times of political uncertainty, as its price may rise with increasing political conflict. However, the bursting of a bitcoin bubble could diminish its hedging capabilities. The study by Su et al. (2022) examines how bitcoin’s price reacts to market fear, as calculated by the Volatility index (VIX). Based on the analysis when the VIX is high, bitcoin’s price may decrease, suggesting that it cannot be considered a safe financial asset. However, when the VIX is low, bitcoin’s price may rise. The research contradicts the theory that a high VIX could boost bitcoin’s price. Moreover, bitcoin’s price also affects the VIX, meaning that bitcoin’s value can reflect changes in the fear index, thus helping investors make more informed decisions.
Kayral et al. (2023) employ the DVECH-GARCH analysis to examine the hedging capabilities of Bitcoin and G7 equity indices over the period 2016–2023. Based on their findings blockchain based assets functioned effectively as diversification instruments, particularly during periods of market stress. While gold outperformed Bitcoin in terms of hedging efficiency, both assets served as safe asset during of market turbulences. In the longer term, sustainability considerations, alongside return and risk, are also key to investment decisions. Rogers, (2023) has modelled how crypto miners compete strategically over time, and examined how investments in energy-efficient technologies and R&D&I affect aggregate energy consumption and economic efficiency. In the long run, miners have an incentive to shift investments from energy-intensive proof of work hashing to more efficient transaction processing, resulting in lower fees and lower energy use per transaction. Cryptocurrencies and the issue of their sustainability are worth considering not only from the perspective of individual investment decisions, but we should also think of them as factors influencing the long-term direction of the entire banking system. Almadadha, (2025) explored the impact of blockchain technology adoption on the financial performance of three major Australian banks over the period 2016–2023. The empirical analysis reveals a significant positive relationship between blockchain adoption and both bank’s ROA and ROE. These results suggest that blockchain contributes to improved efficiency, cost reduction, and profitability in the banking sector.
3 Materials and methods
The objective of this research is to determine the optimal composition of a portfolio consisting of the BUX, DAX, FTSE indices, Bitcoin, and Ethereum, with a particular focus on how cryptocurrencies influence the performance of European stock indices. The study employs Markowitz portfolio optimization, enabling the determination of optimal asset allocation by considering the risk-return tradeoff. According to Markowitz (1952), correlations and covariances among assets are critical for minimizing portfolio risk.
Data were collected from Investing.com, covering 1 January 2019 to 31 December 2023, to analyze long-term market trends and the role of cryptocurrencies. Weekly returns were calculated from weekly price data to evaluate performance in terms of volatility and risk over the given period. A covariance and correlation matrix was then constructed to analyze inter-asset relationships.
Subsequently, the weights of assets in the portfolio were determined, and the weighted covariance, portfolio variance, and standard deviation were calculated. Portfolio optimization was performed using Excel Solver with three objective functions: maximizing the Sharpe ratio, minimizing risk, and achieving the highest return. Maximizing the Sharpe ratio was particularly emphasized as it accounts for both risk and return, making it well-suited for evaluating risky investments.
We used weekly return frequencies to mitigate the distorting effects of volatility and extreme values. Historical weekly T-bill yields, obtained from the Federal Reserve Economic Data (FRED) database, were used as risk-free alternative returns in the portfolio optimization. These yields, which are frequently updated, reflect the financial environment of each week, ensuring that the analysis accurately captures market conditions and incorporates the most current risk-free return rates.
4 Results
This section examines how blockchain financial products could increase investment options, emphasizing how they could increase the variety of assets that can be used to build a portfolio. Using the Markowitz portfolio optimization method outlined earlier, three distinct portfolios were constructed, each targeting a different objective: maximizing the Sharpe ratio, minimizing risk, and maximizing returns. The following sections provide an evaluation of the performance of these three portfolios as alternative assets on European stock indices and the overall portfolio stability.
The covariance matrix in Table 1 illustrates the relationships between the five assets, helping to determine the degree to which the assets move, which is critical for evaluating portfolio risk. The covariance value between the BUX and DAX indices is 0.00053, indicating a positive relationship, meaning the two assets tend to move together. However, the relatively low value suggests that the relationship is not very strong.

Table 1. Covariance matrix.
The relationship between the DAX and FTSE indices is somewhat closer, with a covariance value of 0.00061, though still not particularly high. The covariance between Bitcoin and Ethereum (0.00895) is the largest in the table, demonstrating a strong positive relationship between these two assets. Basod on that the two crypto currencies often move together.
In contrast, the covariances between cryptocurrencies and stock indices are lower. For instance, the covariance between the BUX index and Bitcoin is 0.00042, indicating a weaker relationship. This weaker connection is significant for portfolio diversification, as combining different types of assets can help reduce overall portfolio risk.
In addition to the covariance matrix, the correlation matrix also aids in interpreting the relationships between assets. Correlation normalizes covariance, providing values between 1 and −1 to indicate how assets move together. A value of +1 represents a perfectly positive relationship, −1 indicates a perfectly negative relationship, and 0 suggests no correlation between two assets. Table 2 presents the correlation values between the analyzed assets.

Table 2. Correlation matrix.
The correlation between the BUX and DAX indices is 0.60, which indicates a moderate positive relationship—these assets move in similar directions, but not perfectly. This allows for their combination in a portfolio to reduce risk. The correlation between the DAX and FTSE indices is 0.85, demonstrating a strong positive relationship, meaning these assets move closely together. However, this could reduce the benefits of diversification when both assets are included in the portfolio.
The correlation between Bitcoin and Ethereum is 0.79, reflecting a strong relationship and significant co-movement. In contrast, the correlations between cryptocurrencies and stock indices are weak. In case of BUX index and Bitcoin correlation is 0.15, however the FTSE and Ethereum is 0.33. This weak correlation is advantageous for diversification, as combining different types of assets can reduce portfolio risk.
Analysis of the covariance and correlation matrices indicates that the weak relationship between cryptocurrencies and stock indices supports portfolio diversification, as these two asset categories do not move closely together. The strong relationship between Bitcoin and Ethereum offers limited diversification benefits when combined, but these assets may provide high returns. European stock indices exhibit stronger interrelationships, particularly between the DAX and FTSE indices, suggesting these assets respond similarly to various economic and market influences.
The findings suggest that a combination of cryptocurrencies and European stock indices offers significant diversification benefits, reducing portfolio risk. During portfolio optimization, maximizing the Sharpe ratio led to an asset allocation that delivered the best risk-return performance. The optimal portfolio weights are displayed in Figure 1, where the BUX holds the largest weight (41%), contributing as a stabilizing factor. Bitcoin (30%) and Ethereum (23%) feature prominently, reflecting a focus on high returns, albeit with increased risk. The DAX has a smaller weight (6%), while the FTSE was excluded, indicating that the optimal portfolio relies on the dominance of cryptocurrencies and the BUX.

Figure 1. Optimal asset weights for Sharpe ratio maximization.
Figure 2 illustrates the average portfolio returns for the period 2019–2023. The chart highlights the year-to-year variability, including a notable spike in returns in 2020, driven by exceptional market conditions. However, 2022 saw a decline, attributable to market disruptions and other economic factors. Over the 5-year timeline, the portfolio achieved a cumulative return of 951%, meaning the original investment grew nearly tenfold. To analyze the optimized portfolio, the return and standard deviation were calculated based on weekly data. Weekly T-Bill yields were used as a proxy for risk-free returns. Table 3 summarizes the results of the analysis.

Figure 2. Annual average returns with Sharpe ratio maximization.

Table 3. Results of Sharpe ratio maximization.
The optimized portfolio achieved an average weekly return of 0.95%. Portfolio risk, as measured by the standard deviation of returns (volatility), was 5.77%. Risk-free weekly returns, derived from T-Bill rates sourced from the FRED (Federal Reserve Economic Data) database, dynamically reflected changes in the market environment. The significant weights of Bitcoin and Ethereum contributed to higher potential returns but also increased portfolio volatility. Meanwhile, the smaller weights of European stock indices (BUX, DAX) helped reduce portfolio risk and improve diversification.
On an annualized basis, Figure 3 demonstrates that 2023 was the best-performing year, with a Sharpe ratio (adjusted for the risk-free return) of 2.28, while 2022 was the worst year, with a negative Sharpe ratio. Over the entire period, the Sharpe ratio for the portfolio was 1.19, indicating that for each unit (percentage point) of risk, the portfolio yielded slightly more than one unit of excess return. This places the portfolio in the following Sharpe ratio categories:
- 0 to 1: Indicates that the portfolio generates less than one unit of excess return per unit of risk compared to risk-free assets.
- 1 to 2: Reflects a favorable risk-return tradeoff, where higher risk is associated with higher returns.
- 2 to 3: Represents portfolios offering at least twice the excess return for each unit of risk. (Sharpe, 1994).

Figure 3. Sharpe ratio adjusted for risk-free return under Sharpe ratio maximization.
This result underscores the importance of diversification and highlights the advantages of employing Markowitz portfolio optimization in achieving a higher risk-return ratio.
When determining the weights of the optimized portfolio, two objectives were considered: maximizing the Sharpe ratio and minimizing risk. The Excel Solver produced identical asset combinations for both objectives, reflecting the interconnectedness of these goals. Maximizing the Sharpe ratio not only aims to increase returns but also seeks to reduce risk, as lower risk positively impacts the ratio. The relationships between assets, particularly the low covariance values, further contributed to achieving identical optimal solutions for both objectives. This outcome indicates that the overall risk and return of the portfolio are optimally balanced, satisfying the requirements for both risk minimization and Sharpe ratio maximization.
The optimal asset weights for risk minimization portfolio consists exclusively of the BUX index, meaning its performance is solely based on the Hungarian stock market.
Figure 4 displays the portfolio’s annual average returns from 2019 to 2023, high-lighting year-to-year variations. In 2019, the portfolio achieved a 14% return, driven by a strong market environment. However, in 2020, returns dropped by 4% due to negative global and Hungarian market trends caused by the pandemic. The following year (2021) saw a 22% increase, fueled by economic recovery. In 2022, the portfolio experienced an 11% decline due to market uncertainties and global economic challenges. Finally, 2023 marked an exceptional year, with a 41% return, attributed to market stabilization.

Figure 4. Annual average returns under risk minimization.
At the end of the 5-year period, the cumulative return reached 68%, meaning the original investment grew by approximately 1.5 times. This moderate return was achieved with relatively low risk, as evidenced by the 2.9% standard deviation in Table 4. The low volatility suggests stable returns throughout the analyzed period. As a result, this portfolio may appeal to investors prioritizing stability and moderate risk over high returns, providing a solid foundation for longterm investments.

Table 4. Results of risk minimization (source: authors’ calculations based on Investing.com and FRED).
Figure 5 illustrates the evolution of the Sharpe ratio, adjusted for alternative returns under risk minimization.
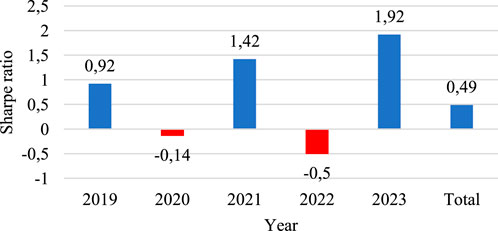
Figure 5. Sharpe ratio adjusted for alternative returns under risk minimization.
In 2020 and 2022, the Sharpe ratio turned negative, indicating that the returns did not justify the risk taken during those years. Conversely, 2021 and 2023 showed favorable Sharpe ratios, suggesting effective risk management and positive portfolio performance. The overall Sharpe ratio of 0.49 indicates that while the portfolio did not achieve outstanding returns, it successfully balanced risk and reward over the 5-year period. This moderate yet consistent performance could be particularly attractive to investors who prioritize risk-conscious investment strategies and focus on longterm growth.
The optimal weights for return maximization are illustrated in Figure 6. To maximize returns, the portfolio exclusively includes the two cryptocurrencies, Bitcoin and Ethereum, omitting European equity indices (BUX, DAX, FTSE). Ethereum dominates the portfolio with a weight of 83%, while Bitcoin accounts for 17%.

Figure 6. Optimal asset weights for return maximization.
Figure 7 presents the annual returns of the portfolio constructed for return maximization between 2019 and 2023. Exceptional returns are observed in 2020 and 2021, driven by favorable market trends. However, a significant decline occurred in 2022. In 2023, the portfolio again achieved positive returns, though the growth lagged behind the previous 2 years. Compared to the portfolio optimized for Sharpe ratio maximization, the return-maximized portfolio demonstrated substantial growth, particularly in 2021 and 2022, but also exhibited higher volatility.

Figure 7. Annual average returns under return maximization.
5 Discussion
The portfolio’s cumulative return over the 5-year period is 8,944%, indicating that the initial investment grew nearly 90-fold. However, this substantial growth comes with significant risk, as evidenced by the standard deviation of 11.3% shown in Table 5. The high volatility reflects considerable fluctuations in returns over the period. This is particularly relevant for portfolios dominated by cryptocurrencies, where extraordinary returns are accompanied by heightened risks. These findings suggest that return maximization is primarily appealing to risk-tolerant investors, while this strategy is less suitable for those seeking stability.
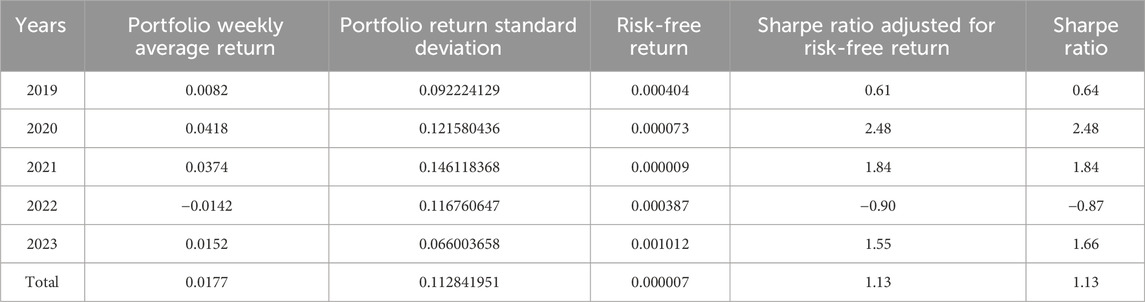
Table 5. Results of return maximization.
Figure 8 illustrates the evolution of the Sharpe ratio, adjusted for risk-free return under return maximization. The year 2020 was the most successful, with a Sharpe ratio of 2.48. This indicates that for every unit of risk, the portfolio delivered more than twice the return. Favorable Sharpe ratios were also observed in 2021 and 2023, signaling effective risk management in these years. In contrast, 2022 and 2019 saw lower Sharpe ratios, indicating that returns did not justify the associated risks.

Figure 8. Sharpe ratio adjusted for risk-free return under return maximization.
The aggregate Sharpe ratio over the 5-year period is 1.13, suggesting a moderate but positive risk-return trade-off. This indicates that while the portfolio’s performance relative to risk is satisfactory, it is not exceptional.
6 Implications
The findings of this study have significant implications for both institutional and individual investors seeking to improve portfolio performance through blockchain financial products. By demonstrating that cryptocurrencies such as Bitcoin and Ethereum, despite their volatility, can improve their risk-return profile when combined with traditional European stock indices, the study supports their inclusion in long-term investment strategies. This highlights the evolving role of blockchain-based financial assets in mainstream finance and encourages investors to consider cryptocurrencies not only as speculative tools but also as valuable components of portfolio optimization. Furthermore, policymakers and financial advisors can benefit from these insights when assessing regulatory and strategic frameworks for integrating digital assets into conventional financial systems.
7 Conclusion
According to the research findings, cryptocurrencies such as Bitcoin and Ethereum have a remarkable potential for returns, but their high volatility significantly raises the risk of a portfolio. On the other hand, because of their low correlation with other asset classes, European equity indices help to stabilize portfolios. It is possible to spread risk and maximize returns by diversifying across these asset classes. This study also looks at how blockchain financial products could increase investment options, emphasizing how they could increase the variety of assets that can be used to build a portfolio. As such, they serve as a tool for more complex diversification strategies in addition to being a source of risk. Investors who have a higher risk tolerance, seek greater returns, and are ready to handle market volatility will find portfolios built with these factors especially appealing.
Such portfolios are well suited to long-term, diversified investment programs, as they enable investors to ride out intermittent losses with the aim of harvesting long-term growth prospects. For the more risk-averse investors, however, it is advisable that portfolios with more stable assets be prioritized.
The models employed in the research have several limitations that must be taken into account when applying them to practice. Changes in portfolio structure and correlations between assets—in particular, during times of crisis—can significantly influence results. Correlations between cryptocurrencies and traditional assets are not constant. In times of market panic or economic uncertainty, they move together, thereby reducing the benefits of diversification. Moreover, the Sharpe ratio is calculated based solely on past returns and therefore does not guarantee future performance. The general principle commonly accepted that past performance is not necessarily an indicator of future results also applies to the methods used in this study. Another consideration is that we assumed the stationarity of the covariance of returns, which is one of the basic assumptions of Markowitz portfolio optimization. Although no GARCH model was applied, employing weekly returns helped to attenuate the distorting effects of volatility and outliers. Also, the primary objective of this study was to maximize portfolio risk and return, not to model volatility.
Future research needs to include separate analyses of different market conditions—e.g., crisis or expansionary periods—plus analyses with longer-term and daily data returns. All of this can be used to obtain a more accurate capture of market movement. In addition, the use of Monte Carlo simulations can be particularly useful for modeling extreme market conditions. In order to further strengthen portfolio risk measurement, it is also recommended to apply VaR and CVaR indicators, since these can be particularly useful in addressing the extreme risk profiles of cryptocurrencies. Another important future direction can also be to repeat the current study with ETF price data. Official index-level data was used in our research, as our objective was to track the aggregate performance of different markets. Yet for an investor, the use of ETFs may be more relevant because they are specific investment instruments.
8 Alignment with Sustainable Development Goals
This research contributes to Sustainable Development Goal (SDG) 8 (Decent Work and Economic Growth) by exploring innovative investment strategies that integrate cryptocurrencies and European stock indices to enhance portfolio performance. By identifying ways to achieve a more balanced risk–return profile, the study supports the development of sustainable financial practices and inclusive economic growth. In particular, the findings offer insights into how investors can optimize their portfolios in a way that fosters more stable and resilient financial markets, contributing to long-term economic development.
Furthermore, the study aligns with SDG 9 (Industry, Innovation and Infrastructure) through its focus on the innovative use of blockchain-based assets in traditional financial markets. By demonstrating how cryptocurrencies can be effectively combined with conventional stock indices, this work highlights the role of technological innovation in improving financial infrastructure. This integration encourages more efficient, transparent, and adaptive investment systems that can support future financial innovation and infrastructure development.
Data availability statement
Publicly available datasets were analyzed in this study. This data can be found here: https://fred.stlouisfed.org/categories/116 Federal Reserve Economic Data (FRED) database T-bill yields.
Author contributions
RG: Writing – original draft, Writing – review and editing. VG: Writing – original draft, Writing – review and editing. ZS: Writing – original draft, Writing – review and editing.
Funding
The author(s) declare that no financial support was received for the research and/or publication of this article.
Conflict of interest
The authors declare that the research was conducted in the absence of any commercial or financial relationships that could be construed as a potential conflict of interest.
Generative AI statement
The author(s) declare that no Generative AI was used in the creation of this manuscript.
Any alternative text (alt text) provided alongside figures in this article has been generated by Frontiers with the support of artificial intelligence and reasonable efforts have been made to ensure accuracy, including review by the authors wherever possible. If you identify any issues, please contact us.
Publisher’s note
All claims expressed in this article are solely those of the authors and do not necessarily represent those of their affiliated organizations, or those of the publisher, the editors and the reviewers. Any product that may be evaluated in this article, or claim that may be made by its manufacturer, is not guaranteed or endorsed by the publisher.
References
Abdelmalek, W. (2023). Cryptocurrencies and portfolio diversification before and during COVID-19. EuroMed J. Bus. 19 (4), 1084–1120. doi:10.1108/EMJB-10-2022-0182
Aggarwal, S., Santosh, M., and Bedi, P. (2018). Bitcoin and portfolio diversification: evidence from India. Digit. India, 99–115. doi:10.1007/978-3-319-78378-9_6
Aliu, F., Nuhiu, A., Knapkova, A., Lubishtani, E., and Tran, K. (2021a). Do cryptocurrencies offer diversification benefits for equity portfolios? Stud. Bus. Econ. 16 (2), 5–18. doi:10.2478/sbe-2021-0021
Allen, D. E. (2022). Cryptocurrencies, diversification and the COVID-19 pandemic. J. Risk Financial Manag. 15 (3), 103. doi:10.3390/jrfm15030103
Almadadha, R. (2025). Blockchain and financial performance: empirical evidence from major Australian banks. Front. Blockchain 8, 1463633. doi:10.3389/fbloc.2025.1463633
Almeida, J., and Goncalves, T. C. (2023). Portfolio diversification, hedge and safe-haven properties in cryptocurrency investments and financial economics: a systematic literature review. J. risk financ. manag. 16 (1), 3. doi:10.3390/jrfm16010003
Bakry, W., Rashid, A., Al-Mohamad, S., and El-Kanj, N. (2021). Bitcoin and portfolio diversification: a portfolio optimization approach. J. Risk Financial Manag. 14 (7), 282. doi:10.3390/jrfm14070282
Braunies, A., and Mestel, R. (2019). Cryptocurrency-portfolios in a mean-variance framework. Finance Res. Lett. 259–264. doi:10.1016/j.frl.2018.05.008
Briere, M., Oosterlinck, K., and Szafarz, A. (2015). Virtual currency, tangible return: portfolio diversification with bitcoin. J. Asset Manag. 16, 365–373. doi:10.1057/jam.2015.5
Brynjarsson, A., and Ágústsdóttir, K. (2022). Cryptocurrencies in optimized portfolios: a portfolio theory approach. The portfolio performance-enhancing capabilities of cryptocurrencies. Master’s Thesis. Cph. Bus. Sch. Available online at: https://research-api.cbs.dk/ws/portalfiles/portal/76453232/1427693_MScThesis_Final_Kristin_Arnor.pdf
Capiello, L., Engle, R. F., and Sheppard, K. (2006). Asymmetric dynamics in the correlations of global equity and bond returns. J. Financial Econ. 4 (4), 537–572. doi:10.1093/jjfinec/nbl005
Chopra, M., and Mehta, C. (2022). Is bitcoin a diversifier, hedge or safe haven for traditional and alternate asset classes? Cogent Econ. and Finance 10 (1), 2156092–21. doi:10.1080/23322039.2022.2156092
Demiralay, S., and Bayraci, S. (2021). Should stock investors include cryptocurrencies in their portfolios after all? Evidence from a conditional diversification benefits measure. Int. J. Finance Econ. 26 (4), 6188–6204. doi:10.1002/ijfe.2116
Diebold, F. X., and Yilmaz, K. (2014). On the network topology of variance decompositions: measuring the connectedness of financial firms. J. Econ. 182 (1), 119–134. doi:10.1016/j.jeconom.2014.04.012
Dikovitsky, V. (2025). Short-term cryptocurrency price forecasting based on news headline analysis. Front. Blockchain. 8. doi:10.3389/fbloc.2025.1627769
Dyhrberg, A. H. (2016). Hedging capabilities of bitcoin. Is it the virtual gold? Finance Res. Lett. 16, 139–144. doi:10.1016/j.frl.2015.10.025
Eisl, A., Gasser, S. M., and Weinmayer, K. (2015). Caveat emptor: does bitcoin improve portfolio diversification? SSRN Electron. J. doi:10.2139/ssrn.2408997
Ghabri, Y., Huynh, L. D., and Nasir, M. A. (2022). Volatility spillovers, hedging and safe-havens under pandemics: all that glitters is not gold. Int. J. Finance and Econ. 29 (2), 1318–1344. doi:10.1002/ijfe.2738
Grujic, M., and Soja, T. (2022). Portfolio diversification with bitcoin. Evidence from Institutional Investors Perspective. Econ. Mark. Commun. Rev. 12 (1), 111–125. doi:10.7251/emc2201111g
Henriques, I., and Sadorsky, P. (2018). Can bitcoin replace gold in an investment portfolio? J. Risk Financial Manag. 11 (3), 48. doi:10.3390/jrfm11030048
Jutel, O. (2023). Blockchain financialization, neo-colonialism, and binance. Front. blockchain 6. doi:10.3389/fbloc.2023.1160257
Kajtazi, A., and Moro, A. (2018). The role of bitcoin in well diversified portfolios: a comparative global study. Int. Rev. Financial Analysis 61, 143–157. doi:10.1016/j.irfa.2018.10.003
Kayral, I. E., Jeribi, A., and Loukil, S. (2023). Are bitcoin and gold a safe haven during COVID-19 and the 2022 Russia–Ukraine war? J. Risk Financial Manag. 16 (4), 222. doi:10.3390/jrfm16040222
Lekovic, M. (2021). Historical development of portfolio theory. Tehnika 76 (2), 220–227. doi:10.5937/tehnika2102220l
Letho, L., Chelwa, G., and Alhassan, A. L. (2022). Cryptocurrencies and portfolio diversification in an emerging market. China Finance Rev. Int. 12 (1), 20–50. doi:10.1108/cfri-06-2021-0123
Liu, F., Su, C. W., Qin, M., and Umar, M. (2024). Bitcoin: a ponzi scheme or an emerging inflation-fighting asset? Technol. Econ. Dev. Econ. 31, 685–705. doi:10.3846/tede.2024.19300
Mazanec, J. (2021). Portfolio optimalization on digital currency market. J. Risk Financial Manage-ment 14 (4), 160–15. doi:10.3390/jrfm14040160
Mhlanga, D. (2023). Block chain technology for digital financial inclusion in the industry 4.0, towards sustainable development? Front. Blockchain 6, 1035405. doi:10.3389/fbloc.2023.1035405
Özbek, G. B. (2023). Diversification and hedging capability of bitcoin. J. Res. Econ. Polit. and Finance 8 (3), 519–538. doi:10.30784/epfad.1333841
Platanakis, E., and Urquhart, A. (2020). Should investors include bitcoin in their portfolios? A portfolio theory approach. Br. Account. Rev. 52 (4), 100837. doi:10.1016/j.bar.2019.100837
Platanakis, E., Sutcliffe, C., and Urquhart, A. (2018). Optimal vs naive diversification in cryptocurrencies. Econ. Lett. 171, 93–96. doi:10.1016/j.econlet.2018.07.020
Popova, I., and Kau, J. K. (2022). Computing optimal portfolios of multi-assets with tail risk: the case of bitcoin. Appl. Econ. Lett. 30 (12), 1618–1626. doi:10.1080/13504851.2022.2074352
Pourpourides, P. M. (2025). Long-term nexus of macroeconomic and financial fundamentals with cryptocurrencies. Front. Blockchain, 8 8. doi:10.3389/fbloc.2025.1550720
Rella, L. (2019). Blockchain technologies and remittances: from financial inclusion to correspondent banking. Front. Blockchain 2, 14. doi:10.3389/fbloc.2019.00014
Rogers, J. R. (2023). Bitcoin equilibrium dynamics: a long term approach. Front. Blockchain, 6 6. doi:10.3389/fbloc.2023.1226892
Sharpe, W. F. (1994). The sharpe ratio. J. Portfolio Manag. 21 (1), 49–58. doi:10.3905/jpm.1994.409501
Su, C.-W., Qin, M., Zhang, X.-L., Tao, R., and Umar, M. (2021). Should bitcoin be held under the U.S. partisan conflict? Technol. Econ. Dev. Econ. 27 (3), 511–529. doi:10.3846/tede.2021.14058
Su, C.-W., Xi, Y., Tao, R., and Umar, M. (2022). Can bitcoin be a safe haven in fear sentiment? Technol. Econ. Dev. Econ. 28 (2), 268–289. doi:10.3846/tede.2022.15502
Susilo, D., Wahyudi, S., Pangestuti, I. R., Nugroho, B. A., and Robiyanto, R. (2020). Cryptocurrencies: hedging opportunities from domestic perspectives in southeast Asia emerging markets. Sage Open 10 (4). doi:10.1177/2158244020971609
Urquhart, A., and Zhang, H. (2019). Is bitcoin a hedge or safe haven for currencies? An intraday analysis. Int. Rev. Financial Analysis 63, 49–57. doi:10.1016/j.irfa.2019.02.009
Vitulyova, Y., Moldakhan, I., Grigoriev, P., and Suleimenov, I. (2024). Some regularities of transaction statistics of cryptocurrency ethereum: opportunities to study the impact of space weather on human economic behavior on a global scale. Front. Blockchain 7. doi:10.3389/fbloc.2024.1455451
Wang, K.-H., Wen, C.-P., Zhang, Z.-Z., Qin, M., and Chang, T. (2024). Bitcoin price and Chinese green bonds: evidence from the QARDL method. Technol. Econ. Dev. Econ. 30 (5), 1306–1329. doi:10.3846/tede.2024.21100
Wing, C. H., Minh, L., and Yan, W. W. (2019). Holding bitcoin longer: the dynamic hedging abilities of bitcoin. Q. Rev. Econ. Finance 71, 107–113. doi:10.1016/j.qref.2018.07.004
Wu, C., and Pandey, V. (2014). The value of bitcoin in enhancing the efficiency of an investor's portfolio. J. Financial Plan. 27, 44–52. Available online at: https://scholar.google.com/scholar_lookup?title=The%20value%20of%20bitcoin%20in%20enhancing%20the%20efficiency%20of%20an%20Investors%20portfolio&publication_year=2014&author=C.Y.%20Wu&author=V.K.%20Pandey
Keywords: Bitcoin price, Ethereum price, European stock indices, Sharpe ratio, diversification
Citation: Gulyás R, Gál VA and Sipiczki Z (2025) Unlocking blockchain-driven financial opportunities: optimizing portfolios with cryptocurrencies and European stock markets. Front. Blockchain 8:1665541. doi: 10.3389/fbloc.2025.1665541
Received: 14 July 2025; Accepted: 28 October 2025;
Published: 10 November 2025.
Edited by:
Enrico Ferro, LINKS Foundation, ItalyReviewed by:
Szabolcs Blazsek, Mercer University, United StatesGaurav Sarin, T. A. Pai Management Institute, India
Copyright © 2025 Gulyás, Gál and Sipiczki. This is an open-access article distributed under the terms of the Creative Commons Attribution License (CC BY). The use, distribution or reproduction in other forums is permitted, provided the original author(s) and the copyright owner(s) are credited and that the original publication in this journal is cited, in accordance with accepted academic practice. No use, distribution or reproduction is permitted which does not comply with these terms.
*Correspondence: Veronika Alexandra Gál, Z2FsLnZlcm9uaWthLmFsZXhhbmRyYUB1bmktbWF0ZS5odQ==
†ORCID: Rebeka Gulyás, orcid.org/0009-0007-4228-9251; Veronika Alexandra Gál, orcid.org/0009-0002-5173-9078; Zoltán Sipiczki, orcid.org/0000-0003-3541-4628