 Zia ul Haq
 Zaid Altaf
 Mehak Manzoor
- Department of Management Studies, Central University of Kashmir, Ganderbal, India
Introduction: The study explores blockchain technology as a disruptive innovation in digital advertising, emphasizing its role in enhancing transparency, minimizing advertising clutter, and improving return on investment among Indian firms.
Methods: Primary data were collected through a structured questionnaire from 220 technology-oriented firms in Jammu and Kashmir. The study employed exploratory factor analysis (EFA) and canonical correlation analysis to examine relationships among incremental innovation, decision aid, technology trust, perceived disruptive value, and technology adoption.
Results: Findings reveal that incremental innovation, decision aid, and technology trust significantly influence perceived disruptive value, which in turn correlates positively with technology adoption. Minimizing advertising clutter and improving control and transparency emerged as key adoption factors.
Discussion: The results highlight blockchain’s potential to reduce inefficiencies and enhance credibility in online advertising. The study contributes to early empirical understanding of blockchain adoption and its disruptive potential in digital marketing.
Introduction
Internet penetration has changed the businesses and shopping experiences of people across the globe. As internet penetration deepens, new technologies like artificial intelligence, behavioral tracking, stronger data encryption, payment gateways, cryptocurrencies, machine learning, and blockchain technology have been developed. This study will examine the role of one of the emerging technologies, blockchain, from a marketing perspective, taking into account businesses’ perceptions about the technology. In particular, the research examines firms’ perception of blockchain in making advertising more effective, measurable, transparent for the company in general, and pleasing for the customers by minimizing advertising clutter and repeat exposure after the purchase. The framework for the study includes incremental innovation, decision aid, and technology trust as independent variables and perceived disruptive value as dependent variables for studying the concept of blockchain. The study examines blockchain’s disruptive value and business technology adoption. Christense (1997) suggested that the resistance of organizations to embrace disruptive technologies can lead to loss of competitive advantage and dominance, if not the total disappearance from the market.
Context
India is emerging as one of the fastest-growing economies in the world in terms of digitalization and fintech. Technological companies have received a significant push from successive governments to incentivize them to go digital. Digital India is a flagship program of the Government of India with a vision to transform India into a digitally empowered society and knowledge economy. By many measures, India is well on its way to becoming a digitally advanced country. Propelled by the falling cost and rising availability of smartphones and high-speed connectivity, India is already home to one of the world’s largest and fastest-growing bases of digital consumers. It is digitizing faster than many mature and emerging economies. India is on track to develop into an advanced economy in terms of digital technology.
With the decreasing costs of owning a smartphone and the high-speed internet availability, India is home to a customer base of 1.2 billion people as of June 2021(Shangliao Sun, 2021). Indians download more apps—12.3 billion in 2018—than any country except China and spend more time on social media—an average of 17 h a week—than social media users in China and the United States. The share of Indian adults with at least one digital financial account has more than doubled since 2011, to 80%, mainly due to the government’s mass financial inclusion program, Jan-Dhan Yojana (McKinsey Global Institute, 2019). McKinsey’s 2019 report suggests that companies that innovate and digitize rapidly will be better placed to take advantage of India’s large, connected market, which could include up to 700 million smartphone users and 840 million internet users by 2023. In the context of rapidly improving technology and falling data costs, technology-enabled business models could become pervasive over the next decade. That will likely create significant economic value. Considering India’s more substantial investment and government support for digitalization, the study is one of a kind to allow organizations and broader stakeholders to understand the firms’ perception of blockchain digital technology adoption. The study is of immense importance, keeping in view the initial adoption phase of the technology and the study being an early attempt to dig deeper into the research problem.
Research framework
The research will primarily study two variables: perceived disruptive value as an independent variable and technology adoption. It is theorized that a significant relationship exists between the two variables among Indian firms. Figure 1 presents the conceptual model for the study in detail.
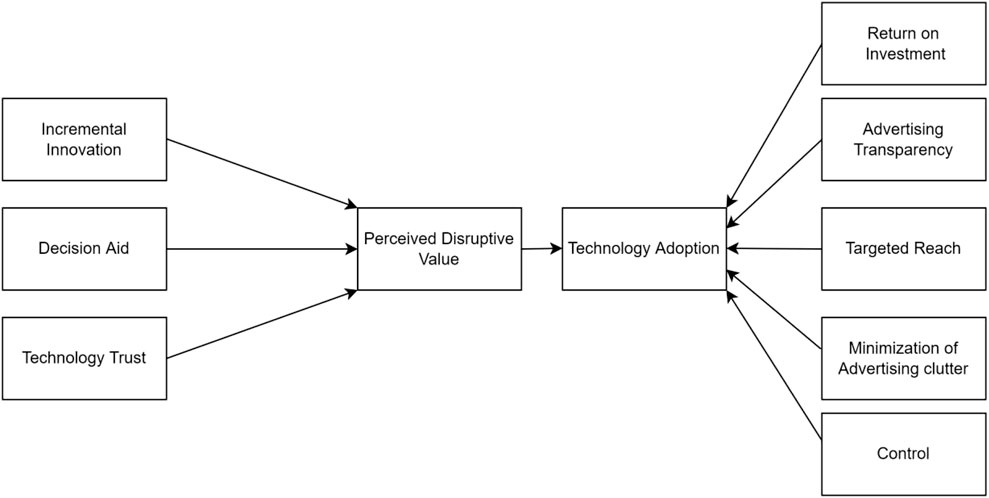
Figure 1. Conceptual framework.
Perceived disruptive value
For the study, incremental innovation is characterized by considerable changes to existing technologies (Hage, 1980; Ettlie et al., 1984; Dewar and Dutton, 1986; Song and Montoya-Weiss, 1998) and decision aids, characterized by the readily available technologies and their increased use in the organizations to make informed decisions based on more profound knowledge and objectivity (Citoren, 2009: Power, 2002). Disruptive technology has been studied by various researchers. Chen et al. (2017) suggested that disruptive innovation can be divided into high-end and low-end categories, which could be regarded as disruptive innovation and incremental innovation to some extent, and studied the factors influencing innovation in Chinese small-to-medium-sized enterprises. The common opinion was that incremental innovation and disruptive innovation were not separate, and there was a possibility of interaction when some conditions were met (Hacklin, Raurich, and Marxt, 2004; Karlsson and Tavassoli, 2016).
The use of technology has led to a change in conventional decision making in organizations, characterized by evidence-based, objective decision making obtained from data and information supplied by technology-based decision support systems (Pfeffer and Sutton, 2006; Tort-Martorell et al., 2011). Technology trust has been studied by researchers in earlier studies (McKnight et al., 2002; Jarvenpaa and Leidner, 1999), and some recent studies exploring the relationship between technology trust and highly elaborated technology approaches to decision making. The trustworthiness of organizational members disseminating the information is a significant factor in influencing analytics utilization (Kowalczyk and Gerlach, 2015) and facilitates the acceptance of new practices (Österreich and Teuteberg, 2019).
Technology Adoption
Dehning and Richardson (2001) suggested a growing link and need for the study of technology and return on investment. This study included a variable as many other researchers have also suggested that the return on investment could be one of the factors that motivate firms to invest in new technology (Constantine, 2019). Given the increasingly invasive methods the marketers have developed, consumers find themselves defenseless against the advertising clutter that is spamming their online browsing experience while creating no good experiences for the users (Kim et al., 2019; Haq, 2009). As both users and law enforcement agencies have demanded more transparency about advertising, companies are also keen to know the effectiveness of their hefty advertising spends.
An outcomes study would attempt to explore advertising transparency as one of the variables that determine the use of blockchain in helping organizations track actual advertising spending without having to pay for repeated clicks. One of the earlier attempts by Justin (2013), while studying targeted advertising and advertising avoidance, concluded that marketers may have found technological leverage in understanding consumer behavior more accurately and invasive methods of reaching consumers by breaching the walls of privacy. This has indeed benefited the marketers but not the consumers. In their study, Jiang and Wu (2022) concluded that the firms competing with mass advertising would not be at an advantage compared to the ones using targeting advertising as one strategy. Thus, the inclusion of this variable in the model is backed by the extant literature (Ben Elhadj-Ben Brahim et al., 2011). Jung and Heo (2021) suggested that while targeted advertising is effective in promoting products, the advertising clutter must be studied further to understand its impact on the ineffectiveness. This study would take the blockchain’s tendency to minimize advertising clutter as one of the features in adopting the technology by the firms for better reach and less clutter. Nam Young Kim (2018) found that in an era of advertising exposure competition among marketers, consumers are finding themselves bombarded with promotional messages. Giving the e-consumers greater control over advertising content, like what to view and what to escape/avoid, could be a positive content management strategy. The blockchain would give advertising firms a greater understanding of the e-consumer’s acceptance and avoidance behavior, thus helping them generate more acceptable content and, at the same time, putting them in control of the content.
Methodology
The data were collected using a structured questionnaire from 220 firms that used technology and advertised their products on any digital platform. Firms that did not use digital technology to promote their products/services were not included in the survey. The data were collected between January 2022 and May 2022 in the union territory (UT) of Jammu and Kashmir in India. The questionnaire was pretested, and a pilot study was conducted to validate the instrument. The data were collected from the organizations’ managerial staff having direct knowledge about the organizational functioning and a role in the firm’s decision making. Section 1 collected the data about the demographic attributes of the employees of the firm they work for and the sector to which the firm belonged. It also included some basic questions regarding advertising. Section 2 of the questionnaire had the items about the perceived disruptive value of the blockchain technology in terms of it being an incremental advancement to existing technology used by the organization. It also included items regarding blockchain technology’s importance as a managerial decision aid and a trusted technology in terms of transparency. The items were curated to capture the firm’s response in terms of it being an advertising disruption on the three variables: incremental innovation, decision aid, and transparency. The rationale for using the three variables can be traced in the literature, which points to the three being the most important factors when an organization embraces new technology. If organizations fail to see any incremental value in an emerging technology, they infer no decision making value, find it devoid of trust, and see the technology as having no disruptive value.
According to Hair et al. (2010), the sample size should be more than 100 for factor analysis. Originally, 250 questionnaires were distributed among the firms. Dropping the faulty and incomplete instruments reduced the adequate sample size to 220, a response rate of 88%. The factor analysis was conducted keeping in view the Hair et al. (2010) guidelines, suggesting that the considerable inter-item correlations exceeding 0.3 and partial correlations exceeding 0.7 are problematic. For being statistically significant, the KMO–Bartlett test of sphericity, the overall sample adequacy should be a minimum of 0.5, including the individual sample adequacy measurement.
The data of the research fully satisfied the above guidelines of sample adequacy. Therefore, principal component analysis was followed to maximize the extracted variance for identification and estimation of the proposed constructs, namely, Perceived Disruptive Value and Technology Adoption, suggested by Grandon and Pearson (2004). This was followed by Varimax rotation to ensure that the factors were not correlated, and the factor loadings were maximized, as suggested by Hatcher (1994). As indicated by Kaiser (1970), as a rule of thumb, an eigenvalue of greater than one was followed for determining which factors to retain. The derived factors were subject to determination of convergent and discriminant validity. Cronbach’s alpha was used to evaluate the construct validity using the minimum acceptable value of 0.7, as suggested by Nunnally (1978). Canonical correlations were used to assess the relationship between the two scales used to represent the variables (Perceived Disruptive Value and Technology Adoption). As the study aimed at finding the correlation between two canonical or latent variables (one independent and the other dependent), unlike regression analysis, the researcher can find a relationship between many dependent and independent variables (Hotelling, 1935). The p-values ≤ 0.05 were considered to be statistically significant. Hair et al. (2010) suggested that the correlations found to be substantial, the canonical value magnitude and correlations, and the redundancy value between two datasets for the percentage of the variance accounted for should be tested.
Results
SPSS-2021 was used to analyze the data. Table 1 depicts the general information about the study sample, the demographic information about the managers from whom the data were collected, and their qualifications and fundamental questions about advertising.
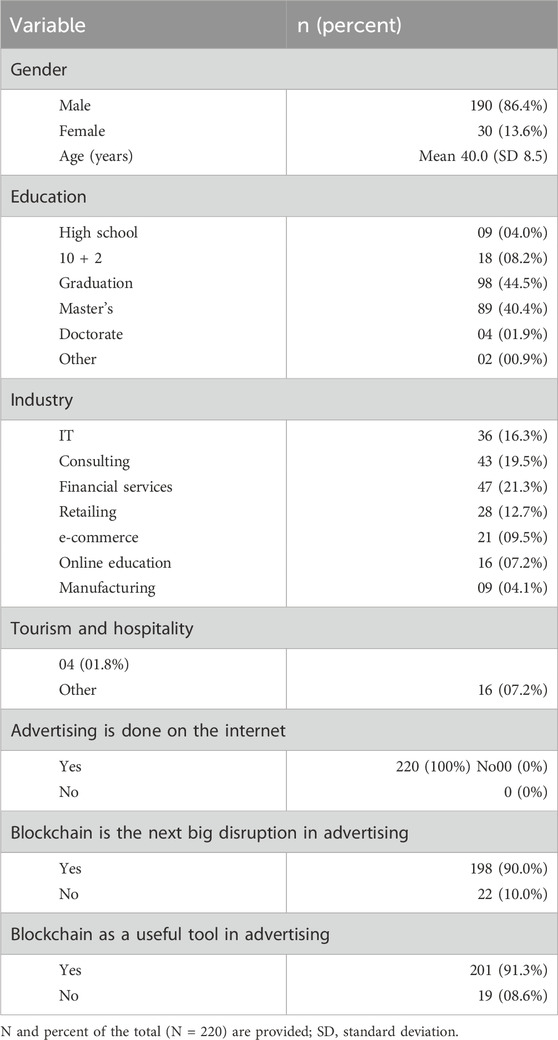
Table 1. Demographic and descriptive statistics of respondents (percent).
Common method bias (CMB)
As the data collected are cross-sectional, there is a possibility of the presence of common method bias (CMB). Therefore, the current study deploys Harman’s single-factor test to statistically test the presence of potential CMB. When a single extracted factor explains 50% or more variance, it means that the data suffer from CMB. The result test finds that the single extracted factor explains 29.8% of the total variance, indicating that the data do not suffer from CMB (Iverson and Maguire, 2000).
Exploratory factor analysis (EFA)
Questions regarding knowledge about blockchain were also assessed using part one of the questionnaires. Most of the managers were found to know about blockchain technology, and the firms studied used digital media for advertising. The dataset for the perceived disruptive value of blockchain technology was suitable for factor analysis. More than 95% of correlations were greater than 0.3, and no partial correlations were greater than 0.7. The largest partial correlation was 0.609, well below the threshold of 0.7. The KMO–Bartlett test of sphericity was also found to be significant, with the KMO measure of sample adequacy being 0.939, considered well within the statistical merits.
The initial factor analysis results are shown in Table 2. The results indicate that three incremental innovation items (InI3, InI4, and InI5) have cross-loadings with the three factors with eigenvalues greater than 1. Three incremental innovation items showing cross-loadings above the acceptable threshold were removed to improve construct clarity and achieve a clean factor structure, consistent with Hair et al. (2010). The refined factor structure highlighting the final set of retained items and loadings presented in Table 3.
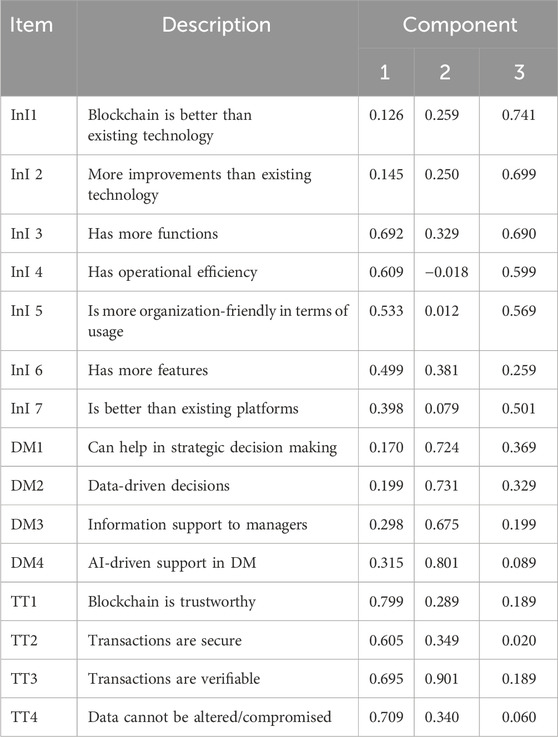
Table 2. Rotated component matrix: perceived strategic importance of blockchain technology (incremental innovation, decision aid to managers, technology trust).
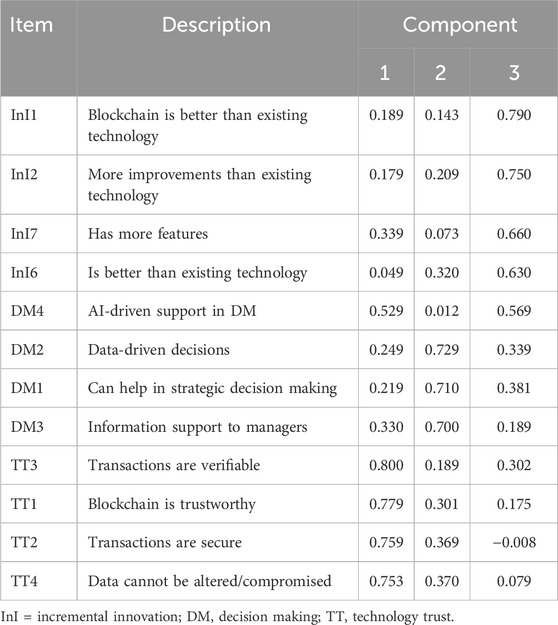
Table 3. Rotated component matrix: refined perceived strategic importance of blockchain technology.
For the Technology Adoption variable, the dataset was suitable, as 97% of the cross-loadings were found to be in the range of >0.30, with the KMO measure of sample adequacy being 0.879, considered well within the statistical merits Costello and Osborne (2005). The rotated component matrix for Technology Adoption, shown in Table 4, revealed that none of the items cross-loaded, and a total explained variance of 71.3% was achieved. Construct reliability for both factors found α values ranging between 0.729 and 0.949. While some items still exhibit cross-loadings in EFA, the examination of these items by researchers, the advice of three experts, and content analysis reveal that these items are relevant to the underlying constructs as validated by prior studies. Therefore, based on this triangulation of opinion, examination, and prior statistical evidence, the researchers decided to retain such items.
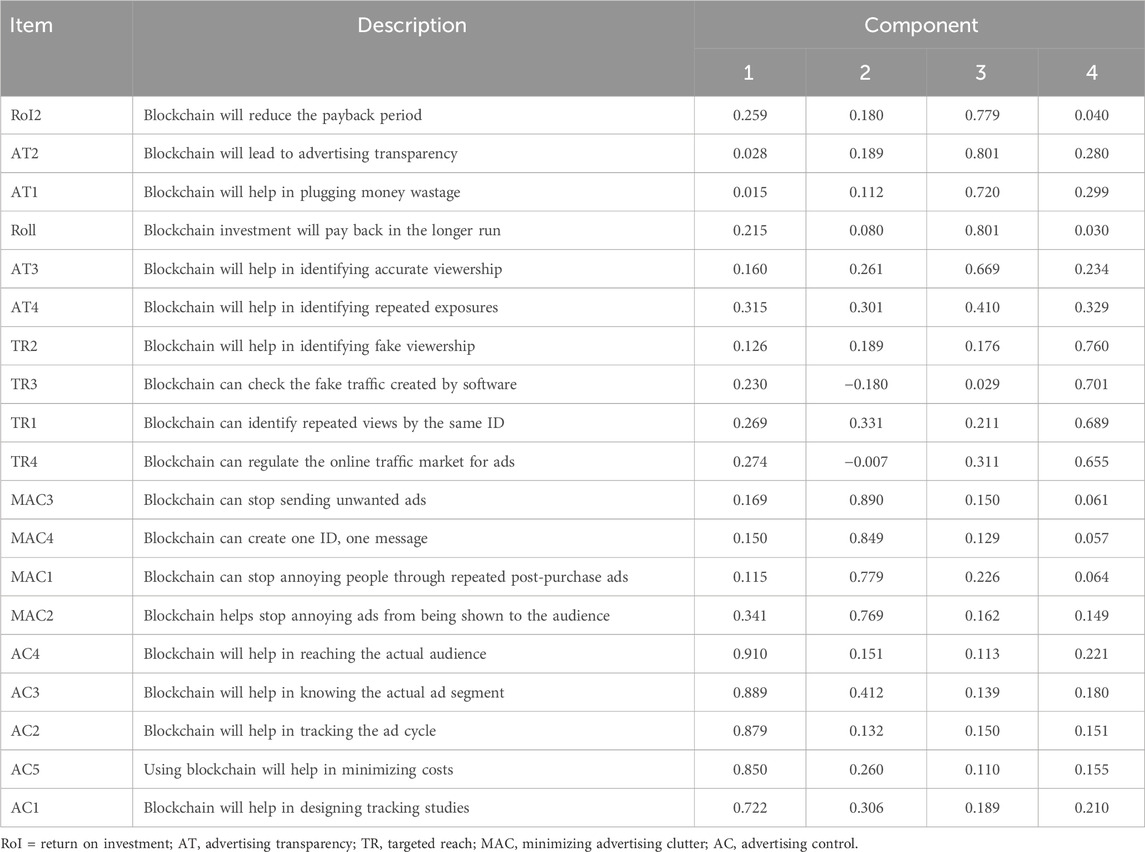
Table 4. Rotated component matrix: technology adoption.
Canonical correlation analysis was employed as it allows simultaneous examination of multiple dependent and independent variables, making it suitable for exploratory studies linking perception-based constructs with adoption outcomes. The results of the canonical correlation are given in Table 5, which suggests the three significant functions. The first canonical function explains 39.4% of the variance, which is moderate; the findings should be interpreted with caution and seen as an initial exploration of blockchain’s perceived disruptive value rather than a fully predictive model. Moreover, the consecutive tests shown in Table 6 indicate that the three functions are jointly substantial. The canonical R2 values from Table 5 show that the first canonical function (Perceived Disruptive Value) explains 39.4% of the variance. The second and third canonical functions explain 8.2% and 1.2%, respectively.
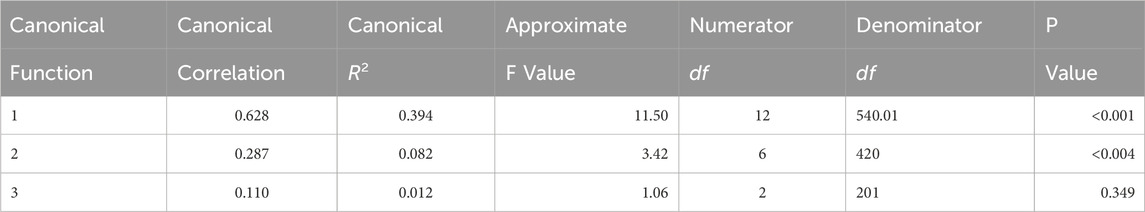
Table 5. Measures of overall model fit for canonical variate analysis.
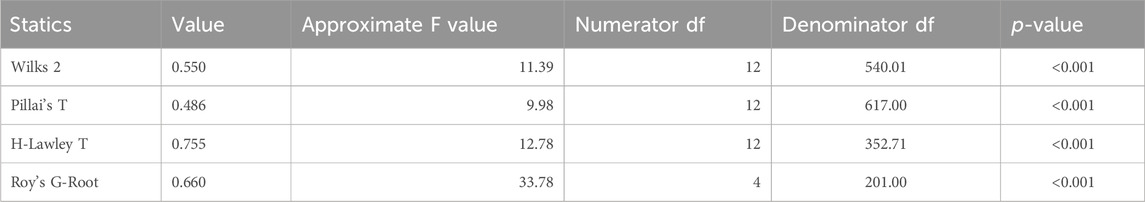
Table 6. Measures of overall model fit for canonical variate analysis.
The two remaining were retained for redundancy. The redundancy values of Perceived Disruptive Value and Technology Adoption are found to be low at 0.290 and 0.209, respectively (see Table 7). This can be ascribed to the low value of canonical R2. The total of two canonical functions is 0.520. The first canonical function is considered for the interpretation because it explains approximately 97% of the variance, against 3% by the second canonical function.
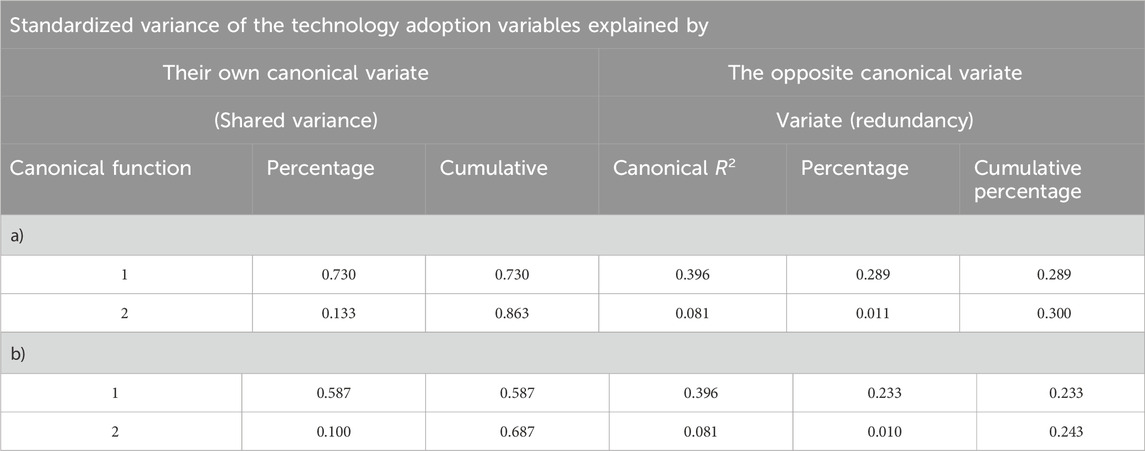
Table 7. Redundancy analysis of perceived disruptive value and technology adoption standardized variance of the program data vector (PDV) variables explained by a) own canonical variate and b) opposite canonical variate.
Table 8 depicts the loadings and the cross-loadings for the first two functions. The most extensive cross-loading, as seen in the table, is 0.140. The first canonical loading shows a minimum loading of 0.669, and the rest are higher; the highest value for the first canonical loading is 0.899. The cross-loadings for the first canonical values range between 0.321 and 0.569 and are found to be above the significant cut-off value of 0.40. All the variables of the perceived incremental value have a high correlation with technological adoption. The sensitivity analysis conducted supported the validity of the first canonical function.
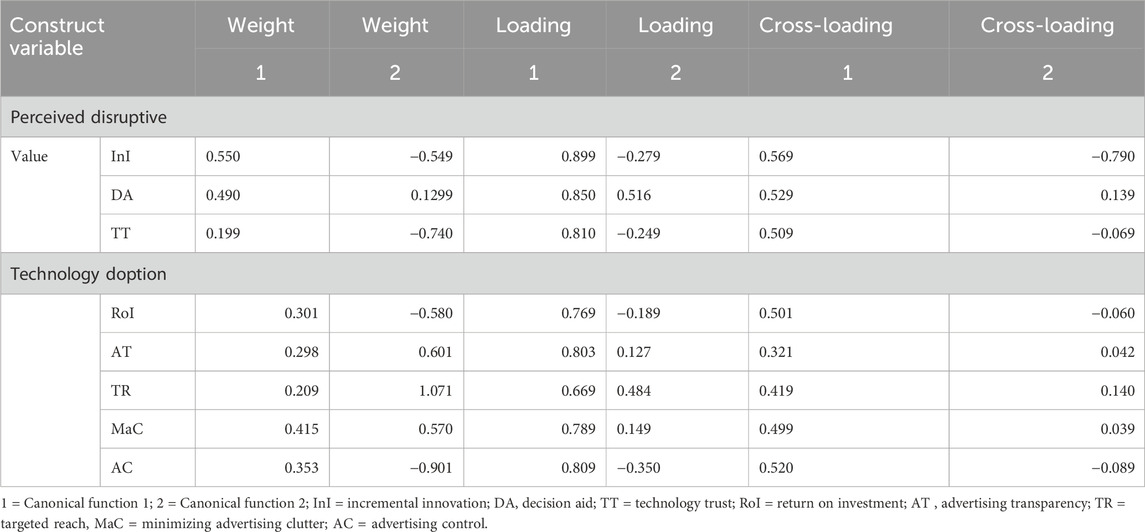
Table 8. Standardized canonical coefficients and canonical loadings.
Discussion
The study’s findings suggest that the blockchain’s perceived disruptive value in advertising has a significant positive correlation with technology adoption. The perceived disruptive value of blockchain in advertising was hypothesized using three factors: incremental innovation, decision aid, and technology trust. Incremental innovation has the strongest association with perceived disruptive value in blockchain technology, followed by decision aid and trust in technology. In the Technology Adoption construct, Minimizing Advertising Clutter was found to have the strongest association with technology adoption in blockchain technology, followed by Advertising Control and Return on Investment. The other two factors, Advertising Transparency and Targeted Reach, were weaker predictors of the technology adoption construct in blockchain technology adoption among the firms. While incremental innovation and ad clutter reduction emerged as important predictors, the moderate explained variance suggests these results should inform exploratory understanding rather than prescriptive managerial action at this stage.
Limitations and future research
This study offers an early empirical view of blockchain’s perceived disruptive value in reducing online advertising clutter and promoting adoption among Indian firms. While the findings enhance understanding of how incremental innovation, decision aid, and technology trust shape adoption, several limitations remain.
First, the data were collected from firms in the union territory of Jammu and Kashmir. Although this region provides a useful early-adoption context, it limits the generalizability of results. Future research should test the model across different regions and industries to strengthen external validity. Second, the study relied on managerial self-reports. Collecting data from a single respondent group may introduce single-source bias and common method bias (CMB). A Harman’s single-factor test showed that no single factor accounted for the majority of variance, indicating CMB was not a serious concern. Nevertheless, self-report data can contain bias; future studies should combine managerial perceptions with objective advertising metrics, consumer surveys, or multi-informant data. Third, the cross-sectional design restricts causal inference between perceived disruptive value and adoption. Longitudinal or experimental studies could better trace how perceptions evolve and test causality. Fourth, although canonical correlation results were statistically significant, the explanatory power was moderate (R2 = 0.394), and redundancy values were low (0.29 and 0.21), indicating limited shared variance. Future work may enhance the model by including factors such as digital maturity, regulatory readiness, or consumer trust. Finally, blockchain’s technical discussion was largely conceptual. Future research could adopt mixed methods: qualitative interviews with ad-tech practitioners and quantitative testing of blockchain-enabled platforms to clarify real-world integration with demand- and supply-side advertising systems. Addressing these limitations can lead to more generalizable, methodologically rigorous studies of blockchain adoption and its role in transforming digital advertising.
Data availability statement
The raw data supporting the conclusions of this article will be made available by the authors, without undue reservation.
Ethics statement
Ethical review and approval was not required for the study on human participants in accordance with the local legislation and institutional requirements. Written informed consent from the participants was not required to participate in this study in accordance with the national legislation and the institutional requirements.
Author contributions
ZH: Methodology, Writing - original draft, Conceptualization, Investigation, Software, Supervision. ZA: Data curation, Formal Analysis, Project administration, Validation, Writing - review and editing. MM: Methodology, Funding acquisition, Resources, Visualization, Writing - review and editing.
Funding
The author(s) declare that no financial support was received for the research and/or publication of this article.
Conflict of interest
The authors declare that the research was conducted in the absence of any commercial or financial relationships that could be construed as a potential conflict of interest.
Generative AI statement
The author(s) declare that no Generative AI was used in the creation of this manuscript.
Any alternative text (alt text) provided alongside figures in this article has been generated by Frontiers with the support of artificial intelligence and reasonable efforts have been made to ensure accuracy, including review by the authors wherever possible. If you identify any issues, please contact us.
Publisher’s note
All claims expressed in this article are solely those of the authors and do not necessarily represent those of their affiliated organizations, or those of the publisher, the editors and the reviewers. Any product that may be evaluated in this article, or claim that may be made by its manufacturer, is not guaranteed or endorsed by the publisher.
References
Ben Elhadj-Ben Brahim, N., Lahmandi-Ayed, R., and Laussel, D. (2011). Is targeted advertising always beneficial? Int. J. Industrial Organ. 29 (6), 678–689. doi:10.1016/j.ijindorg.2011.03.002
Brad, A. (2021). Agencies agree; 2021 was A record year for Ad spending, with more growth expected in 2022. Forbes. Available online at: https://www.forbes.com/sites/bradadgate/2021/12/08/agencies-agree-2021-was-a-record-year-Was-a-record-year-for-ad-spending-with-more-growth-expected-in-2022/?sh=23cb929c7bc6.
Chen, J., Zhu, Z., and Zhang, Y. (2017). A study of factors influencing disruptive innovation in Chinese SMEs. Asian J. Technol. Innovation 5, 140–157. doi:10.1080/19761597.2017.1302552
Christense, C. M. (1997). The innovator’s dilemma: when new technologies cause significant firms to fail. Boston: Harvard Business Press.
Citroen, C. L. (2009). Strategic decision-making processes: the role of information. PhD Thesis. University of Twente.
Constantine, B. (2019). Exploring information technology return on investment reports for planning, budgeting, and implementation, walden dissertations and doctoral studies, college of management and technology. Minneapolis, MN: Walden University Press.
Costello, A. B., and Osborne, J. (2005) “Best practices in exploratory factor analysis: four recommendations for getting the most from your analysis”, Practical Assessment, Research, and Evaluation 10 (1): 7. doi:10.7275/jyj1-4868
Daniela, C. (2022). E-commerce worldwide. Hamburg, Germany: Statista GmbH. Available online at: https://www.statista.com/topics/871/online-shopping/.
Dehning, B., and Richardson, V. J. (2001). Returns on investments in information Technology: a Research synthesis (december 2001). doi:10.2139/ssrn.302139
Dewar, R. D., and Dutton, J. E. (1986). The adoption of radical and incremental innovations: an empirical analysis. Manag. Sci. 32, 1422–1433. doi:10.1287/mnsc.32.11.1422
Ettlie, J. E., Bridges, W. P., and O’Keefe, R. D. (1984). Organization strategy and structural differences for radical versus incremental innovation. Manag. Sci. 30, 682–695 (June. doi:10.1287/mnsc.30.6.682
Grandon, E. E., and Pearson, J. M. (2004). Electronic commerce adoption: an empirical study of small and medium US businesses. Inf. and Manag. 42 (1), 197–216. doi:10.1016/j.im.2003.12.010
Hacklin, F., Raurich, V., and Marxt, C. (2004). How incremental innovation becomes disruptive: the case of technology convergence. IEEE Int. Eng. Manag. Conf. 1 (18), 32–36. doi:10.1109/iemc.2004.1407070
Hage, J. (1980). Theories of organisations: form, process, and transformation. New York: John Wiley and Sons, Inc.
Hair, J. F., Black, W. C., Babin, B. J., and Anderson, R. E. (2010). Multivariate data analysis. Seventh Edition. Upper Saddle River, New Jersey: Prentice Hall.
Haq, Z. (2009). E-mail advertising: a study of consumer attitude toward e-mail advertising among Indian users. J. Retail Leis. Prop. 8, 207–223. doi:10.1057/rlp.2009.10
Hatcher, L. (1994). A step-by-step approach to using the SAS system for factor analysis and structural equation modelling. Cary, NC: SAS Institute Inc.
Hotelling, H. (1935). The Most predictable criterion. J. Educ. Psychol. 26 (2), 139–142. doi:10.1037/h0058165
Iverson, R. D., and Maguire, C. (2000). The relationship between job and life satisfaction: evidence from a remote mining community. Hum. Relat. 53 (6), 807–839. doi:10.1177/0018726700536003
Jarvenpaa, S. L., and Leidner, D. E. (1999). Communication and trust in global virtual teams. Organ. Sci. 10 (6), 791–815. doi:10.1287/orsc.10.6.791
Jiang, Z., and Wu, D. (2022). Targeting precision in imperfect targeted advertising: implications for the regulation of market structure and efficiency. SAGE Open 12 (1), 21582440221082132. doi:10.1177/21582440221082132
Jung, A.-R., and Heo, J. (2021). Does cluttered social media environment hurt advertising effectiveness? The moderation of ad types and personalisation. J. Res. Interact. Mark. 15 (4), 592–606. doi:10.1108/JRIM-11-2020-0238
Johnson, J. P. (2013). Targeted advertising and advertising avoidance. R and J. Econ. 44 (1), 128–144.
Kaiser, H. F. (1970). A second-generation little jiffy. Psychometrika 35 (4), 401–415. doi:10.1007/bf02291817
Karlsson, C., and Tavassoli, S. (2016). Innovation strategies of firms: what strategies and why? J. Technol. Transf. 41, 1483–1506. doi:10.1007/s10961-015-9453-4
Kim, N. Y. (2018). The effect of ad customization and ad variation on internet users’perceptions of forced multiple advertising exposures and attitudes. J. Interact. Advert. 18 (1), 15–27.
Kim, T., Barasz, K., and John, L. K. (2019). Why am I seeing this ad? The effect of Ad transparency on Ad effectiveness. J. Consumer Res. 45 (5), 906–932. doi:10.1093/jcr/ucy039
Kowalczyk, M., and Gerlach, J. (2015). Business intelligence and analytics and decision quality— insights on analytics specialisation and information processing modes. ECIS 2015 Complet. Res. Pap. doi:10.18151/7217398
McKnight, D. H., Choudhury, V., and Kacmar, C. (2002). Developing and validating trust measures for e-commerce: an integrative typology. Inf. Syst. Res. 13 (3), 334–359. doi:10.1287/.isre.13.3.334.81
Österreich, T. D., and Teuteberg, F. (2019). The role of business analytics in the controllers and management accountants’ competence profiles: an exploratory study on individual-level data. J. Account. and Organ. Change 15 (2), 330–356. doi:10.1108/JAOC-10-2018-0097
Pfeffer, J., and Sutton, R. I. (2006). Evidence-based management. Harv. Bus. Rev. 84, 63–74. Available online at: https://cebma.org/assets/Uploads/Pfeffer-Sutton-Evidence-Based-Management-v2.pdf.
Power, D. J. (2002). Decision Support Systems: Concepts and Resources for Managers. Quorum Books Westport.
Shangliao, S. (2021). Number of internet subscribers in India as of June 2021, by region. Available online at: https://www.statista.com/statistics/638548/internet-subscribers-by-region-india/(Accessed October 05, 2022).
Sinal, A. (2021). What digital advertising gets wrong. Harv. Bus. Rev. Available online at: https://hbr.org/2021/02/what-digital-advertising-gets-wrong.
Song, X. M., and Montoya-Weiss, M. M. (1998). Critical development activities for really new versus incremental products. J. Prod. Innovation Manag. 15, 124–135 (March. doi:10.1111/1540-5885.1520124
Keywords: blockchain, disruption, advertising, incremental innovation, advertising clutter
Citation: Haq Zu, Altaf Z and Manzoor M (2025) Perceived online advertising disruption: Examining the role of blockchain technology among Indian firms. Front. Blockchain 8:1706830. doi: 10.3389/fbloc.2025.1706830
Received: 16 September 2025; Accepted: 13 October 2025;
Published: 20 November 2025.
Edited by:
Pei Xiao, University of Surrey, United KingdomReviewed by:
WenPing Liang, Doctor, ChinaJiacheng Dong, Tecnologico Nacional de México/Instituto Tecnologico de Chiná, Mexico
Copyright © 2025 Haq, Altaf and Manzoor. This is an open-access article distributed under the terms of the Creative Commons Attribution License (CC BY). The use, distribution or reproduction in other forums is permitted, provided the original author(s) and the copyright owner(s) are credited and that the original publication in this journal is cited, in accordance with accepted academic practice. No use, distribution or reproduction is permitted which does not comply with these terms.
*Correspondence: Zia ul Haq, emlhQGN1a2FzaG1pci5hYy5pbg==