 Joan R. Casas*
 John James Moughty
- Department of Civil and Environmental Engineering, Technical University of Catalonia, BarcelonaTech, Barcelona, Spain
Overtime, bridge condition declines due to a number of degradation processes such as creep, corrosion, and cyclic loading, among others. Traditionally, vibration-based damage detection techniques in bridges have focused on monitoring changes to modal parameters. These techniques can often suffer to their sensitivity to changes in environmental and operational conditions, mistaking them as structural damage. Recent research has seen the emergence of more advanced computational techniques that not only allow the assessment of noisier and more complex data but also allow research to veer away from monitoring changes in modal parameters alone. This paper presents a review of the current state-of-the-art developments in vibration-based damage detection in small to medium span bridges with particular focus on the utilization of advanced computational methods that avoid traditional damage detection pitfalls. A case study based on the S101 bridge is also presented to test the damage sensitivity to a chosen methodology.
Introduction
The identification of structural damage in bridges is a research topic that has generated significant attention over the years. The primary reason for its surge in popularity is an aging road and rail infrastructure, which is subjected to traffic loading conditions that far surpass original design criteria. This unprecedented increase in loading accelerates structural fatigue, which in turn reduces service life. In addition, as bridge infrastructure continues to age and deteriorate, the frequency of inspection must increase to counteract the reduction in safety of these structures. This task is made more difficult due to its sheer enormity, as Europe’s highway bridge count is circa one million, and of Europe’s half a million rail bridges, 35% are over 100 years old (Mainline, 2013). This has led to a considerable surge of research in how to efficiently manage their maintenance and upkeep (Casas, 2010). Most proliferous, however, is the study of vibration-based damage detection and identification techniques.
This paper presents well-established vibration-based techniques for bridge damage detection and some of the recent methods under research, mainly based on the analysis of raw vibration data with the objective to remove environmental and operational influences from the recorded vibrations and also to provide online tools for damage detection.
Modal-Based Damage Detection Techniques
Traditional modal-based damage detection techniques have been the most deeply researched in the past decades (Hart and Yao, 1977; Kozin and Natke, 1986; Agbabian et al., 1991; Yao and Natke, 1994; Doebling et al., 1996; Sohn et al., 2003; Farrar and Worden, 2007; Nayeri et al., 2009; Takewaki et al., 2011). The idea of using measured vibrations to discern damage in structures has been employed for some time. Various modal parameters such as natural frequency shifts and other modal properties such as mode shapes, damping ratios, and modal curvatures have been traditionally used to detect damage (Casas and Aparicio, 1994). These properties should be dynamically obtained from a bridge before its initial opening, if possible with ambient and forced vibration, as Conte et al. (2008) and He et al. (2009) conducted with the Alfred Zampa Memorial Bridge.
Mode shapes are particularly advantageous as they are less influenced by environmental effects than natural frequencies and also contain both local and global information, which can aid damage localization. Numerous mode shape monitoring techniques have been developed over the years, such as the modal assurance criterion (MAC) (Allemang and Brown, 1982), which measures mode shape changes over the entire structure by taking advantage of eigenvector orthogonality. Kim et al. (1992) later advanced MAC to develop the coordinate modal assurance criterion (COMAC), which monitors modal node displacement to detect and locate damage. Equation 1 shows how COMAC can be applied to a node i, by measuring the normalized difference of mode shape vectors of the undamaged and damaged conditions. Application of MAC and COMAC in bridge structures found that the methods could not only detect most structural changes and locations but also indentified spurious damage (Salawu and Williams, 1995).
Pandey et al. (1991) expanded COMAC’s theory further to focus on the monitoring of mode shape curvatures (mode shapes’ second derivative) in a technique known as the modal curvature method (MCM). Its hypothesis is based on the relationship between modal curvature and flexural stiffness, as presented in Eq. 2, where modal curvature (φ″) is a function of cross-sectional bending moment (M) and cross-sectional flexural stiffness (EI). The premise of the MCM is that by using this relationship, one can monitor stiffness variations and detect damage, as cracks will reduce cross-sectional stiffness, resulting in a larger curvature value. Equation 3 shows that the MCM simply uses the absolute difference between the damaged curvature and undamaged curvature values to detect damage. This can be conducted for single mode or for cumulative multimode, depending on application. This methodology demonstrated a high level of damage sensitivity and produced good results when tested (Abdel Wahab and De Roeck, 1999). However, the MCM has some drawbakcs as its results are dependent on the number of modes considered (Farrar and Worden, 2013). Also, inherent errors in curvature calculation from vibration data, usually through the central difference method, reduce the MCM’s robustness. Furthermore, the MCM also requires a large quantity of sensors to ensure sufficient accuracy, particularly for higher modes, which thus reduces its practicality for mass application.
Modal curvatures have formed part of numerous damage detection methodologies since introduced. Most notable is the damage index method (DIM) (Stubbs et al., 1992), which uses modal curvatures to calculate and monitor the modal strain energy between two adjacent nodes (Eq. 4), where βi,j indicates a damage feature value for the ith mode at location j; and are the curvatures of the undamaged and damaged mode shapes, respectively; L is the element length; and a and b are the limits of the evaluated element. As the DIM is based on modal curvatures, it therefore suffers from the same drawbacks as the MCM. This is particularly emphasized during the differentiation process, which amplifies high-frequency noise and can thus increase the variance of the subsequently extracted damage features.
A comparative study of many of the aforementioned traditional, modal-based damage detection techniques was conducted by Talebinejad et al. (2011). The study found that only high-intensity damages were detectable through the application of these methods and that they were quite sensitive to noise contamination and that they identified numerous false damage events. Overall, modal-based damage indicators are supported by a well-established theoretical base, but their application to detect damage from measured vibration data has proven difficult. Easily extracted, lower-frequency modes attain poor damage sensitivity and are most influenced by environmental and operational conditions, while the more damage-sensitive, higher modes have large SDs when extracted and thus attain a lower reliability to accurately detect structural changes. In addition, modal-based damage indicators require considerable data normalization to improve their sensitivity to actual damage events.
Environmental and Operational Variability
A common challenge for many damage detection methodologies is insuring that detected damage events are truly damage and not benign system variations. Bridges are monitored over long periods of time and are subjected to large temperature fluctuations, harsh storms, and numerous traffic scenarios. These varying conditions affect changes to a bridge’s stiffness and mass in a non-linear manner, which in turn alters the bridge’s modal properties. This is evident in Peeters and De Roeck’s (2001) assessment of the Z-24 Bridge in Switzerland, where significant variation in the bridge’s natural frequency was observed when the ambient temperature dropped below freezing point (see Figure 1A). The cause of this bilinear behavior was attributable to the newly solidified ice in the bridge deck contributing to its stiffness.
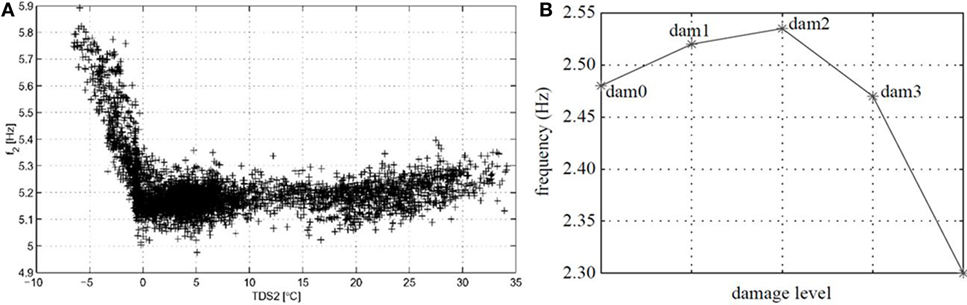
Figure 1. (A) Z-24 Bridge—frequency Vs. temperature (Peeters and De Roeck, 2001). (B) Frequency Vs. damage (Farrar et al., 1994).
Small changes in natural frequency due to temperature variation can be often mistaken for structural damage and, in some cases, can also hide actual damage events, as Farrar et al. (1994) discovered when investigating the suitability of frequency variation for structural damage detection in bridges by incrementally introducing damage to a bridge girder. The expected results were that the induced damage would reduce the girder’s stiffness and thus reduce its natural frequency; instead, the girder’s natural frequency rose for the first two damage scenarios before falling, as can be seen in Figure 1B. It was subsequently revealed that the ambient temperature caused the initial increase in the girder’s frequency.
Environmental and operational variations have considerable influence on a bridge’s dynamic behavior, which may be mistaken for damage and is the subject of much research (Teughels and De Roeck, 2004; Yan et al., 2005a,b; Moser and Moaveni, 2011). Data normalization techniques help determine a bridge’s baseline response under a range of normal environmental and operational conditions Generally, for data normalization to be achieved, additional information is required relating to traffic and environmental conditions, usually temperature and wind speed. The process of data normalization can be a challenging in itself due to the non-linear, multivariate nature of a bridge’s behavior and due to the quantity of data required.
Response modeling aims at separating the variations imposed by “normal” environmental/operational actions from those caused by damage. It relies on training statistical learning algorithms so that they can accurately estimate the “normal” structural response. The most reported statistical modeling algorithms found in SHM literature consist of multilayer perceptron neural networks, support vector regressions, linear regressions, principal component analysis (PCA), and autoassociative neural networks (Santos et al., 2016a).
Dervilis et al. (2015) conducted a study on the Tamar and Z24 Bridge to test a novel regression-based methodology for damage detection in changing environment and operational conditions. The algorithms used for the initial regression analysis and subsequent outlier detection in the vibration data were the least trimmed squares (LTS) regression algorithm and the minimum covariance determinant (MCD) estimator. The LTS regression algorithm is an adaptation on the popular least squares method of regression that minimizes the sum of squared residual errors; however, instead of being applied to a full data set, it is applied to subsets or clusters. This allows it to create a more robust fit to the data as it has a lower sensitivity overall to outliers when compared to many other regression techniques.
The MCD estimation method is applied to the LTS residual data. It is a multiple outlier detection method, which expands on the classic Mahalanobis Squared Distance (MSD) method for outlier detection (Mahalanobis, 1936), where outliers are measured from the center of a baseline data cluster, relative to the cluster size. The traditional MSD method has the disadvantage of potentially masking outliers, as the training data used to calculate the baseline cluster center may already contain damage and erroneous data, resulting in an inaccurate baseline center point. This would subsequently compromise the method’s effectiveness for detecting future outliers. However, the advantage of the MCD estimation method is that it actively searches for and removes the inherent masking effect by identifying outliers in the training phase and ignoring them when calculating the cluster center. This allows subsequent outlier detections to be unaffected by the presence of erroneous data in the trained algorithm. It achieves this by finding the subset of data points (must be over half of total number) whose covariance matrix has the lowest possible determinant to that of the whole set. This process takes multiple iterations to be completed. The MCD baseline center point is then computed from the final minimum covariance subset only.
Dervilis et al.’s main objective of the study is to explain that different forms of outliers give distinct and different characteristics with respect to environmental and operational variations and damage. This is achieved by plotting the LTS residuals against the MCD index and superimposing thresholds that define the change point in outlier characteristics.
The Z24 Bridge vibration data were used to test the methodology’s robustness in differentiating outlier differences. An example result plot of LTS residuals for temperature and first natural frequency Vs. MCD distance is presented in Figure 2. As can be seen, all six regions contain some data points. Region 3 contains normal behavior data, whereas vertical regions 1 and 5 contain temperature-induced outliers. Horizontal regions that cross the MCD threshold contain damage outliers. In the example presented, the methodology was successfully able to discern the data points 1,201–1,500 as temperature-induced variations and data points 2,496–3,932 as damage.
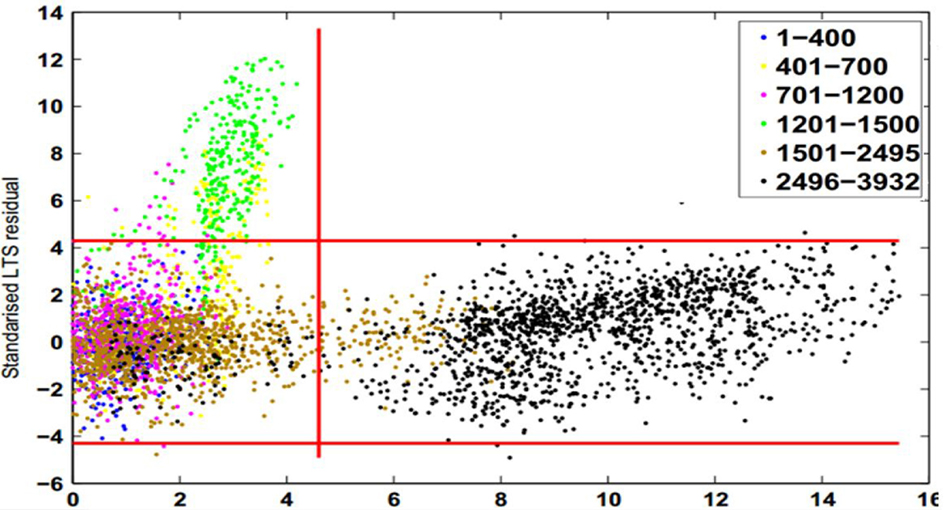
Figure 2. Least trimmed squares residual Vs. minimum covariance determinant distance (Dervilis et al., 2015).
The benefit of employing this technique is that it clearly differentiates environmental-induced variability from actual damage events.
Chatzi and Spiridonakos (2015) proposed time-series-based damage detection model that also attempts to infer a functional dependence between vibration data and environmental data through incorporation of a full numerical model of the structure in question. The method employed to achieve this is known as Polynomial Chaos Non-linear AutoRegressive with eXogenous input (PC-NARX), as originally proposed in the study by Spiridonakos and Chatzi (2015).
The PC-NARX model requires vibration data and temperature data as inputs so that the NARX portion of the methodology can fit a non-linear relationship between the two in a training phase, which subsequently allows natural frequencies to be produced as an output. The polynomial chaos expansion allows parameters to be characterized as random variables, for example; acceleration time histories are represented by their PDF parameters so that measured vibration data can be handled as a set of random variables. This speeds up subsequent runtimes considerably, as large acceleration data sets can be reduced to a few representative values. The ability of the PC-NARX methodology to accurately predict the dynamic response of a structure under varying environmental conditions implies that it should also be able to discern damage events by monitoring the magnitude of its prediction errors, as these are assumed to be normally distributed.
The efficiency of the introduced method is demonstrated on field data from the well-known Z-24 bridge (Spiridonakos et al., 2016). The methodology demonstrated great promise as it combines deterministic and probabilistic processes to produce an accurate and efficient tool for detecting abnormal changes in structural behavior. However, the outputs can only be as precise as the inputs, so it is essential that the training phase includes a full seasonal cycle of environmental variables to allow the model to learn the structure’s full spectrum of normal behavior. This implies that the application should be reserved for long-term monitoring purposes only.
Santos et al. (2016b) used neural networks to extract environmental and operational effects also in the data coming from the Z-24 bridge. The frequencies of vibration from the Z-24 bridge were used as modal parameters for the damage detection. In the case of the International Guadiana Bridge, a cable-stayed bridge with a main span of 324 m, the neural network technique was used to avoid the environmental/operational effects (Santos et al., 2016a). On the other hand, they used PCA in the same bridge for data normalization because it implicitly allows considering the effects of different actions without the need to measure them (Santos et al., 2015).
Non-Modal-Based Approaches to Damage Detection
As discussed, modal-based damage detection techniques contain a number of inherent drawbacks when applied to bridges. These drawbacks have led many researchers to investigate alternative procedures that circumvent the need for modal parameters and are grouped under the generic name of non-modal techniques.
Dilena et al. (2015) tested one such non-modal-based technique, known as the interpolation damage detection method (IDDM), on a single-span reinforced concrete bridge. The IDDM does not require a numerical model either; instead it defines a damage index (DI) in terms of deformed shapes to track changes in bridge condition. Reference deformed shapes are calculated from frequency response functions (FRFs) of the undamaged structure and are used as a baseline condition for subsequent deformed shapes that are calculated during the testing and monitoring phase. By using deformed shapes as a damage indicator, one can take advantage of concentrated vibration amplitude irregularities to detect and locate damage (Zhang et al., 2013). The detected abnormalities are denoted in IDDM by an interpolation error, which is simply the difference between the recorded and interpolated FRF profiles. Figure 3 presents a graphical explanation of the interpolation procedure conducted at a point Zl along a beam axis Z. The term E(zl) denotes the interpolation error, calculated as the distance between the recorded signal [Hg(z)] and the spline interpolation value [Hs(z)].
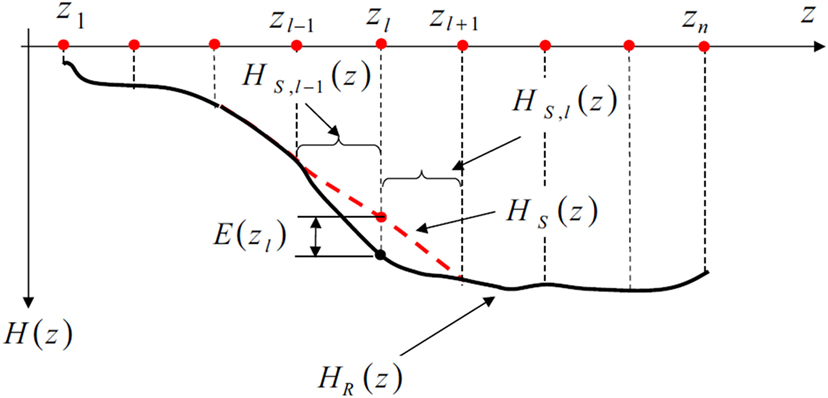
Figure 3. Spline interpolation of frequency response functions (Dilena et al., 2015).
Higher interpolation errors signify a higher likelihood of damage. In this way, the IDDM is a probabilistic method of damage detection whereby only interpolation errors that are greater than a predetermined threshold value are deemed as probable damage events. This decision criterion means that there will be a certain amount of false damage and missed damage events due to some interpolation errors falling on the incorrect side of the threshold value. For this reason, the threshold value should be determined though an optimization or cost/benefit analysis to minimize false and missed detections.
It should be noted that accurate and detailed data are required for the undamaged state so that damage events can be confidently detected during the monitoring phase. However, if no undamaged data are available, then a proposed variation on the original method will allow unsupervised damage detection to be conducted. First, it assumes that, for an undamaged state, all sources of vibration will equally cause all locations to produce the same interpolation error variation. Conversely, if some locations produce significantly higher interpolation errors, then damage is confirmed at these locations. Again, to be deemed as damage, the interpolation error must surpass a predetermined threshold value. As the interpolation errors are assumed to be normally distributed for undamaged behavior, the threshold value is thus calculated in terms of the average (μΔE) and variance (σΔE) of the damage parameter ΔE(zl). Dilena et al. tested the performance of the IDDM on a single-span RC bridge under forced harmonic vibration. Numerous damage events were introduced to the bridge in different locations during testing. The results of the IDDM were compared to those of the MCM, which was also tested. The results showed that the IDDM is capable of detecting and locating damage consistently; however, its performance is dependent on the threshold value chosen and on the geometry of sensors. The experiment also showed that IDDM is capable of tracking the evolution of damage, which was tested by incrementally increasing the severity of the manually induced damage events. Damage localization did not improve by increasing the number of vibration modes in the FRF range. When compared to the MCM results, the IDDM fairs quite well. The MCM demonstrated good sensitivity to damage for the first two vibration modes, but became less accurate thereafter. This is most probably due to the requirement of a denser array of sensors for accurate modal curvatures at higher modes. The IDDM requires fewer sensors than the MCM and, overall, has shown that the IDDM can reliably detect and locate damage without modal parameters as a damage indicator. A disadvantage of the IDDM is that its assumption that for an undamaged state, all sources of vibration will equally cause all locations to produce the same variation in interpolation error will not be suitable to all bridge applications.
Santos et al. (2017) implemented a novel methodology to detect structural damage without the use of modal parameters. They proposed a data-driven technique that possesses real-time capabilities. It is based on cluster analysis to achieve baseline independence, and it introduces the concept of symbolic data analysis to reduce raw vibration data into much smaller representative sets of statistical quantities such as interquartile intervals or histograms. This process reduces data volume and increases processing speed considerably, with low loss of information. They applied the technique to the Samora Machel Bridge. The assessment observed that symbolic objects based on the interquartile intervals attain damage-sensitive information that can be utilized in classification algorithms as shown in the study by Alves et al. (2015a). In the case of the study by Santos et al. (2017), the dynamic cloud clustering algorithm was utilized, which is an adaptation of the popular k-means approach that converges to a solution quickly. This fast solution can cause issues however, as dynamic cloud clustering can converge to local minima. For this reason, cluster validation is conducted to enhance the methods robustness and is important for baseline free applications. It consists of computing a set of indices for all clusters. Each validity index describes each cluster’s compactness and separation. The most accurate number of clusters identified is then compared to the indices obtained from each of the evaluated partitions to define the most truthful number of clusters. Additional information on the dynamic cloud clustering algorithm and other novelty detection techniques is detailed in the study by Alves et al. (2015b).
Finally, the novelty index is prepared by assessing the geometric weights of each cluster against each other. The objective of this phase is to create an automatic response index that can identify various magnitudes of damage in real time. Figure 4 presents a comparison of two structural changes observed in the assessment of the Samora Machel Bridge. The index value is taken as the average squared distance between cluster centroids. It is evident that Figure 4 (a) has a larger distance between centroids and thus indicates a greater structural change.
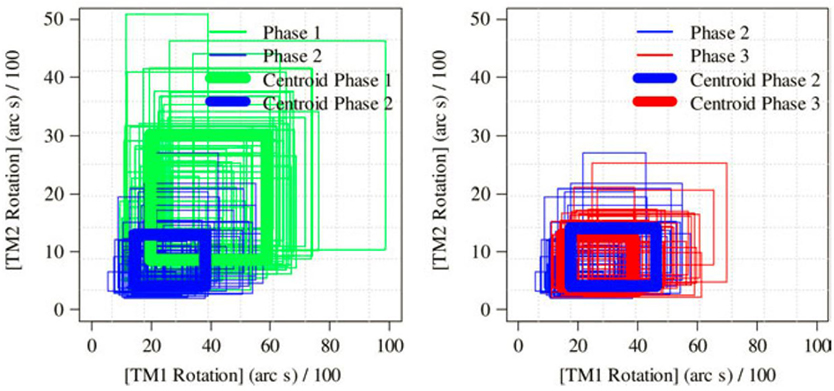
Figure 4. Comparison of cluster centroids defined for various level of damage (Santos et al., 2017).
Due to its fast computation and low data storage requirements, Santos et al.’s symbolic data-based approach offers opportunity for real-time damage detect capability in bridges, provided that environmental and operational effects are also considered. A similar methodology is applied in the damage detection study carried out in the international cable-stayed bridge over the Guadiana river where they use pattern recognition and data fusion methods. In this case, the raw data coming from the sensors are not due to vibration of the bridge but comes from the acquisition of continuous streams of information. Pressure cells and magnetostrictive transducers were used for measuring deck and joint displacements. Biaxial inclinometers were installed on the top of the pylons. Data acquisition was carried out every hour in all sensors. It was observed that under the noise levels measured on site, the proposed methodology is able to automatically detect damage as small as 1% of stiffness reduction in a single stay cable (Santos et al., 2015).
Other preliminary works to introduce non-destructive testing in bridges have looked at the possibility of assessing the bridge condition based on vibration responses of vehicles when crossing a bridge (Miyamoto and Yabe, 2011).
In the study by Meixedo et al. (2016) damage indicators are defined and tested based on the deck accelerations of the bridge under action of Alfa Pendular train defined as a set of moving loads. The proposed methodology for identifying damage was tested based on a two-dimensional numerical finite element model of a railway bridge including railway track. A parametric study was carried out allowing the selection of the most promising statistical features: (1) maximum peak amplitude, (2) minimum peak amplitude, (3) SD, and (4) sum of squared differences between the baseline acceleration and the acceleration resulting from the damage scenario. The features selected were based on signal statistics and resulted in two damage indicators: one clusters the minimum peak amplitude, the maximum peak amplitude, and the SD of the acceleration response of the bridge (ID1) and the other is given by the sum of the squared differences between a reference response and a numerical response (ID2). The results allowed evaluating the efficiency and reliability of the methodology and the damage indicators that, in most situations, showed potential in the detection, location, and quantification of the severity of the damage, especially in the case of damage indicator ID1.
Kaloop and Hu (2015) assessed some effective damage detection and localization algorithms based on the pattern recognition methodologies to detect structural changes using vibration data collected from the Yonghe Bridge. Among other damage indicators, they assessed frequency response spectrums as a means to detect and locate damage. They discovered that acceleration amplitude was quite responsive to damage. Moreover, it was concluded that this method had the potential for online damage detection due to its ease of application.
Damage Sensitivity of Vibration Parameters
Koch (1953) originally assessed vibration intensity in terms of damage in buildings by utilizing the fact that acceleration’s squared mean varies with frequency and that as vibration frequency increases, its damage potential decreases. Therefore, it is logical that inertial induced damage is proportional to acceleration’s squared mean over frequency {a2(f)/f = I(f)}. In a simple harmonic example, where amplitude of acceleration is a0, the term a02/f is known as vibration intensity (I), whose SI units are mm2/s3. In addition, vibration intensity can be portrayed in dBs by using the following expression: 10log10(I/Is), where Is is taken as 10 mm2/s3 and the resulting values are defined as vibrars.
Both Koch (1953) and Steffens (1974) used vibration intensity to evaluate the magnitude of damage in buildings based on the collected databases. The observed correlation of damage and vibration intensity was developed into DIs and is compared in Table 1.
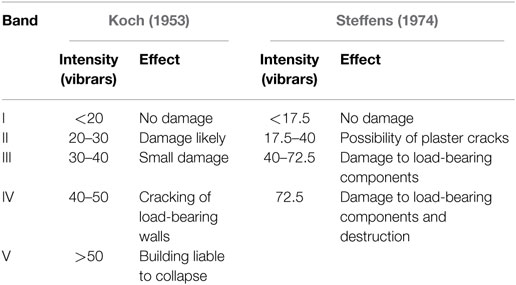
Table 1. Vibration intensity damage index for buildings.
Vibration intensity has previously been included in codes to evaluate damage level in buildings, such as in ISO Standard ISO/TC108/SC/Wg3-9 and, more recently, the Brazilian Code for non-destructive testing ABNT-NBR-15307 (Associação Brasileira De Normas Técnicas – ABNT, 2005), which references Koch’s DI, but extends its original use to all structure types, including bridges (Table 2).
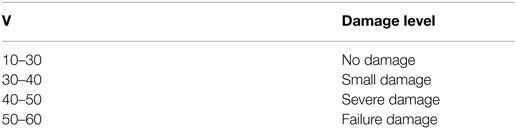
Table 2. Damage level and vibration level according to Associação Brasileira De Normas Técnicas – ABNT (2005).
To assess the proposed use of vibration intensity to discern damage in bridge structures, the current study applies an assessment to a group of existing bridges in Brazil (Rodrigues et al., 2013; Casas and Rodrigues, 2015) with the aim of evaluating ABNT criteria. A set of 12 bridges present in the Brazilian network were selected as measured acceleration induced on bridge decks during monitoring were available as well as the DI defined as:
where DI = the damage index at structure level; fcur = the current first bending natural frequency determined on dynamic tests; and fref = the first bending natural frequency calculated measured when the bridge was in a good state.
Because the natural frequency when the bridge was in a good condition was not available, it was estimated based on FEM of the bridges. However, the material properties and bearing conditions were not available too, and therefore, the calculation of fref could not be made with good accuracy, resulting in negative values of the DI, which is unfeasible. However, this issue was solved thanks to the condition state of the bridges obtained by visual inspections (see Figure 5). In fact, it was observed that bridges without any damage and in good condition state presented a negative value of the DI, whereas the ones in damaged condition showed values of the DI higher than zero (see Figure 5). It’s assumed that those bridges whose DI value is negative can be taken instead as 0 to indicate no damage (as verified by the visual inspection); however, in the results presented herein, the negative values are considered regardless.
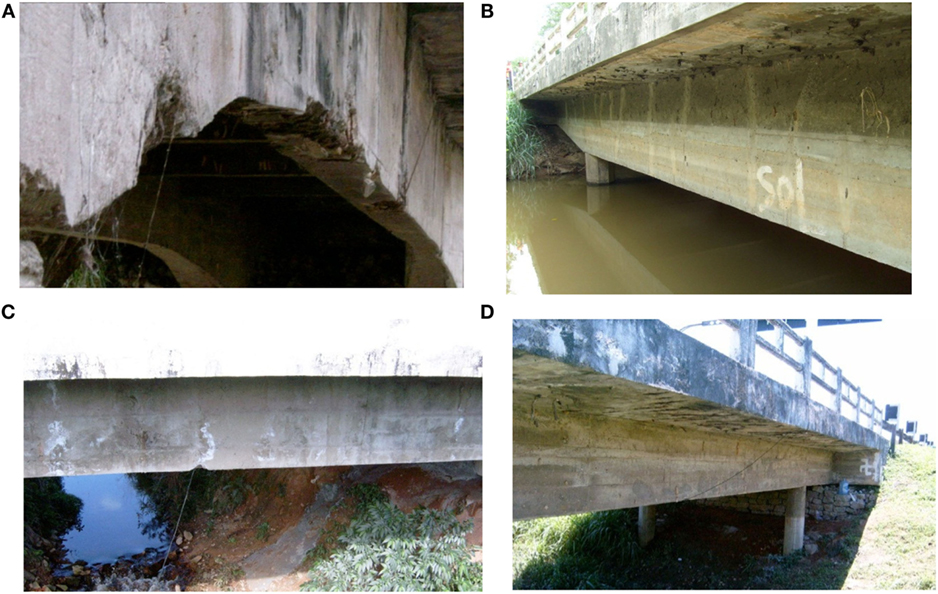
Figure 5. Damages observed in bridges with different damage indexes. (A) DI = 0.15 (Roncador). (B) DI = 0.19 (Boa Esperança). (C) DI = −4.29 (Escuro). (D) DI = −6.82 (Iriri).
Vibration intensity was obtained and measured in vibrars from acceleration time-series from the bridges’ mid-span during passages of a 450-kN truck of various velocities and also under normal traffic. Values of vibration intensity were obtained as presented in Table 3. The maximum peak-to-peak acceleration was also calculated and is also shown in Table 3.
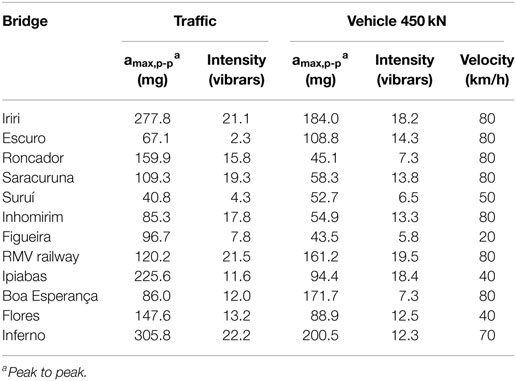
Table 3. Vibration intensity and maximum acceleration measured at mid-span section of bridges.
To assess the correlation between damage magnitude in bridges and vibration intensity, the DI values obtained were plotted against vibration intensity for the passage of a 450-kN vehicle and for normal traffic conditions in Figures 6A,B, respectively, whereas Figure 7 presents the bridge’s DI against max peak-to-peak acceleration.
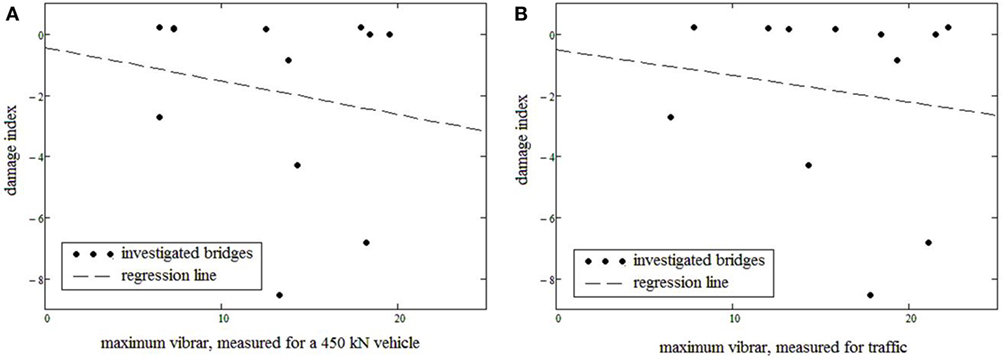
Figure 6. Plot of vibration intensity (vibrars) Vs. damage index for the 450-kN vehicle (A) and normal traffic (B).
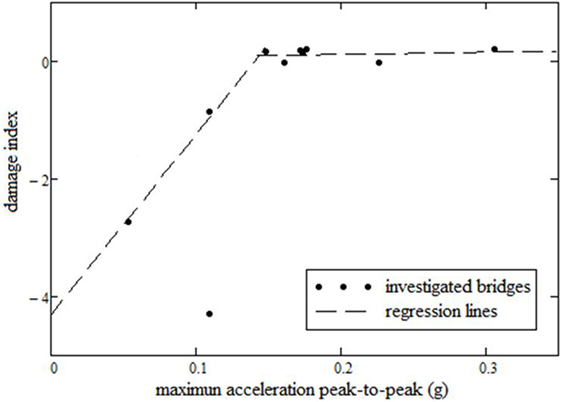
Figure 7. Plot of the max peak-to-peak acceleration Vs. damage index.
Correlation between bridge damage and vibration intensity (in vibrars) in Figures 6A,B is very low (maximum correlation obtained was 17% in the case of the 450-kN vehicle). Conversely, Figure 7 shows a much better level of correlation between maximum peak-to-peak acceleration and bridge damage.
In addition to poor correlation being observed in the case of vibrars, the resulting trend of DI values decreases with increasing vibration intensity, which is not a reasonable relationship given the original proposal by Koch (1953). However, on further inspection, the backward trend is predominantly caused by the inclusion of the aforementioned negative DI values. As mentioned earlier, these negative values should be taken instead as 0 to indicate no damage (as verified by the visual inspection). If such a correction was done, then the trend is corrected to its logical progression.
On inspection of the results from Figure 7 where max peak-to-peak acceleration is assessed against damage level, one can observe a limit around 0.15 g, where values below have a negative DI value, indicating a healthy bridge, whereas values above 0.15 g are positively increasing, indicating increased damage. The limit indicates a change in the rate of damage when measured in max peak-to-peak acceleration. The regression lines calculated with DIs lower and higher than 0.15 g are presented in the following equations:
Correlation in Eq. 7 is 96%, which demonstrates a good reliability in terms of the relationship between damage and max peak-to-peak acceleration and is further confirmed by comparisons with data from visual inspection.
The reliability index to fatigue in the reinforcing steel was also calculated for the set of 12 bridges (Rodrigues et al., 2013; Casas and Rodrigues, 2015). From the obtained results, it can be noticed that maximum measured acceleration peak to peak is also better related to fatigue safety than vibration intensity measured in vibrars units. The safety to fatigue decreases with increasing maximum acceleration peak to peak. In addition to that, bridges with reliability indexes under 6.0 (defined as target reliability index for reinforced concrete bridges) show a maximum measured peak-to-peak acceleration over 0.17 g. In this way, with the aim of guarantee safety to fatigue, the value of 0.17 g for maximum peak-to-peak acceleration could be considered as a limit in the design to fatigue of bridge decks. Again, as in the case of the condition index, it seems that there is a clear threshold value (around 0.17 g in this case) for the peak-to-peak acceleration between safe and unsafe bridges.
In summary, the results demonstrate that a correlation exists between the level of damage and fatigue safety when bridge vibration is measured in max peak-to-peak acceleration. In terms of the results of this study, it can be concluded that max peak-to-peak acceleration is a better damage indicator than vibration intensity measured in vibrars. This would indicate that certain codes, such as NBR-15307 (2005), may require a review on the topic. Results of the maximum peak-to-peak acceleration indicated a high probability of fatigue occurrence over a 0.17 g value and a high probability of damage occurrence over a 0.15 g. Considering the fatigue and damage assessments have such different approaches and that both observed limits are very close to each other (0.17 g and 0.15 g), even though more experimental data are needed to confirm this criterion, it is proposed that the value 0.15 g be used as a limit of maximum peak-to-peak acceleration during bridge design to guarantee their durability and safety.
Case Study on the S101 Bridge
From the review of the above methodologies, it can be determined that non-modal-based, output only techniques based on the use of acceleration records offer robustness in varying conditions, ease of application, and a high level of damage sensitivity. To further analyze this fact, the S101 Bridge acceleration data were used in an ARMA model for system identification, and the Mahalanobis Distance outlier detection algorithm was then employed for damage detection based on the AR coefficient variation. The assessment considered an undamaged stage to train the algorithm and two damaged states that consisted of successive pier settlement stages (pier lowered by 1 cm and pier lowered by 2 cm). A confidence interval of 95% was chosen as the damage threshold in the Mahalanobis Distance algorithm. The appropriate AR model order was determined through the partial autocorrelation function algorithm before the damage detection phase.
The flyover S101 was a posttensioned three-span bridge in Austria that was constructed in the early 1960s. The main span had a length of 32 m, and the two side spans were 12 m long. The cross-section was 7.2 m wide and was designed as a double-webbed t-beam, whose webs had a width of 0.6 m. The height of the beam varied from 0.9 m in the mid-span to 1.7 m over the piers (see Figures 8 and 9) (Vienna Consulting Engineers (VCE), 2009). It was decided to replace it due to insufficient carrying capacity and its maintenance condition. In addition, the bridge did not meet the current requirements, as the structure did not fit into the overall traffic and infrastructure concept anymore.
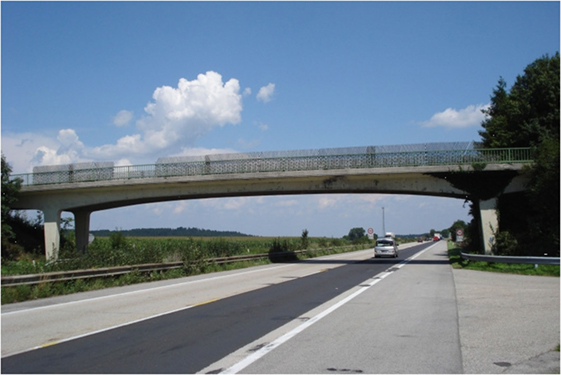
Figure 8. S101 Bridge [Vienna Consulting Engineers (VCE), 2009].

Figure 9. S101 Bridge longitudinal section [Vienna Consulting Engineers (VCE), 2009].
A progressive damage test was conducted on the S101 Bridge in 2008. The stages of the progressive damage test are presented in Table 4. The damage was applied in two main stages, with the first comprising a simulated pier foundation settlement and the second comprising a stiffness reduction through the severing of four tendons. Vibration data were recorded by numerous accelerometers located on the bridge deck, with a sample rate of 500 Hz. The bridge was closed to traffic during the progressive damage test, so ambient vibration due to environmental excitations are prominent; however, one traffic lane beneath the bridge was open throughout the test, which resulted in vibrations transmitted through the foundations. It is worth noting that before the undamaged vibration data being collected, the deck at the location of the pier chosen of damage was supported by a temporary supporting pier, which was hydraulically loaded to the original pier’s supporting force of 120 t.
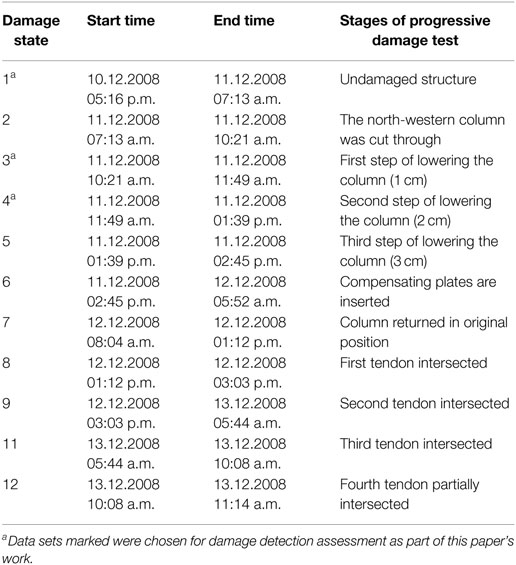
Table 4. List of measurements recorded during the S101 Bridge progressive damage test.
Figure 10 presents the damage detection results based on the ARMA and Mahalanobis Distance algorithms. As can be seen, the damaged data set surpasses the damage threshold for all damage cases. Moreover, it is clear that the ARMA-based system identification is sensitive enough to distinguish between the two damage states.
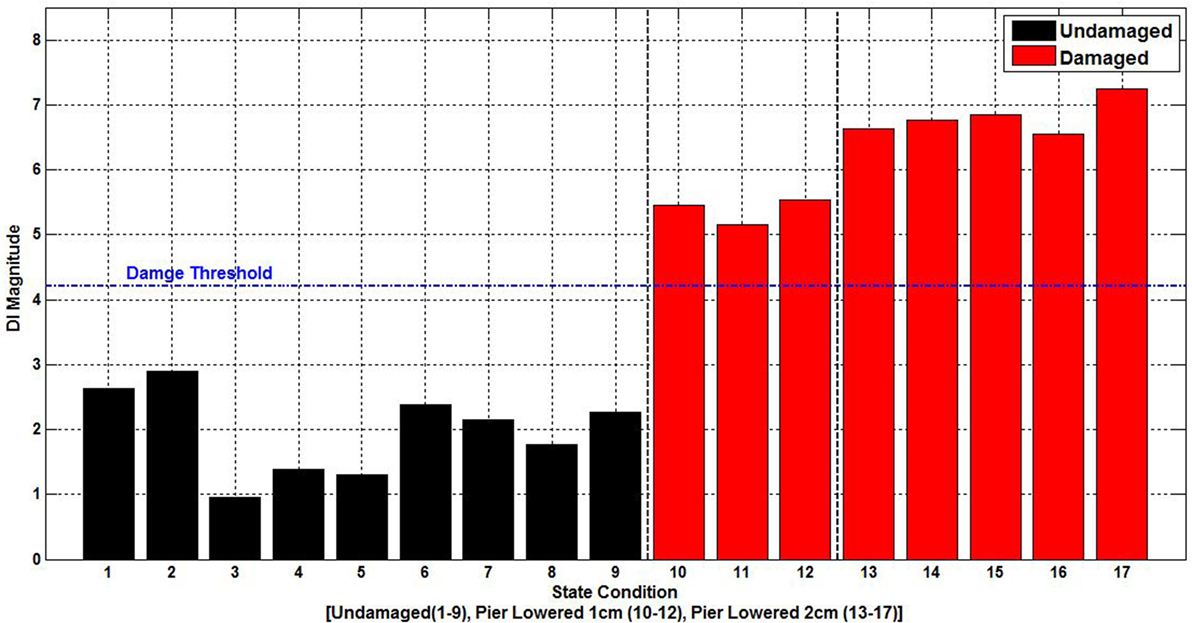
Figure 10. S101 damage detection results (ARMA and Mahalanobis Distance).
Conclusion
The paper has presented modal and non-modal vibration techniques aimed to derive performance indicators to assess structural damage in existing bridges.
Overall, it can be concluded that there is no outright consensus among researchers regarding which vibration-based damage indicator or damage detection method is most suited to bridge structures. In many cases, modal-based damage features have proven difficult to be applied to bridges in real scenarios. A primary drawback surrounds the poor extraction rate of modal properties under ambient excitation. Large amplitude vibrations required to extract an accurate and full modal response are generally applied in the form of impact tests on a closed bridge that creates a disturbance to traffic that should be avoided. Non-modal-based, output only techniques offer robustness in varying conditions, ease of application, and a high level of damage sensitivity. For this reason, it is advantageous to investigate new damage features and vibration-based non-modal performance indicators, such as the vibration intensities measured as maximum peak-to peak amplitudes of acceleration records, which have already shown some promise as presented in the paper and appear as viable for damage detection, but also others like specific energy density, sustained maximum acceleration (Nuttli et al., 1979), and Arias Intensity (Arias, 1970).
Author Contributions
Both authors have contributed equally to the paper.
Conflict of Interest Statement
The authors declare that the research was conducted in the absence of any commercial or financial relationships that could be construed as a potential conflict of interest.
Funding
Part of the results provided in this project has received funding from the European Union’s Horizon 2020 research and innovation program under the Marie Skłodowska-Curie grant agreement No. 642453.
References
Abdel Wahab, M. M., and De Roeck, G. (1999). Damage detection in bridges using modal curvatures: application to a real damage scenario. J. Sound Vib. 226, 217–235. doi: 10.1006/jsvi.1999.2295
Agbabian, M. S., Masri, S. F., Miller, R. K., and Caughey, T. K. (1991). System identification approach to detection of structural changes. J. Eng. Mech. 117, 370–390. doi:10.1061/(ASCE)0733-9399(1991)117:2(370)
Allemang, R. J., and Brown, D. L. (1982). “A correlation coefficient for modal vector analysis,” in Proceedings of the 1st SEM International Modal Analysis Conference, Orlando, FL.
Alves, V., Cury, A., Roitman, N., Magluta, C., and Cremona, C. (2015a). Structural modification assessment using supervised learning methods applied to vibration data. Eng. Struct. 99, 2015. doi:10.1016/j.engstruct.2015.05.003
Alves, V., Cury, A., Roitman, N., Magluta, C., and Cremona, C. (2015b). Novelty detection for SHM using raw acceleration measurements. Struct. Control Health Monit. 22, 1193–1207. doi:10.1002/stc.1741
Arias, A. (1970). “A measure of earthquake intensity,” in Seismic Design for Nuclear Power Plants, ed. R. J. Hansen (Cambridge, MA: MIT Press), 438–483.
Associação Brasileira De Normas Técnicas – ABNT. (2005). Ensaios não destrutivos – Provas de cargas dinâmicas em grandes estruturas – Procedimento. NBR 15307. Rio de Janeiro.
Casas, J. R. (2010). “Assessment and monitoring of existing bridges to avoid unnecessary strengthening or replacement,” in International IABMAS Conference on Bridge Maintenance, Safety and Management, Vol. 2010 (Philadelphia: CRC Press), 2261–2269.
Casas, J. R., and Aparicio, A. C. (1994). Structural damage identification from dynamic test data. J. Struct. Eng. 120, 2437–2450. doi:10.1061/(ASCE)0733-9445(1994)120:8(2437)
Casas, J. R., and Rodrigues, F. (2015). “Bridge condition and safety based on measured vibration level,” in International Association for Bridge and Structural Engineering. Proceedings Workshop, February 11–12, 2015, Helsinki.
Chatzi, E. N., and Spiridonakos, M. D. (2015). “Dealing with uncertainty in the monitoring of dynamically evolving systems,” in Proceeding of the 7th International Conference on Structural Health Monitoring of Intelligent Infrastructure (SHMII), Torino, Italy.
Conte, J. P., He, X., Moaveni, B., Masri, S. F., Caffrey, J. P., Wahbeh, M., et al. (2008). Dynamic testing of Alfred Zampa Memorial Bridge. J. Struct. Eng. 134, 1006–1015. doi:10.1061/(ASCE)0733-9445(2008)134:6(1006)
Dervilis, N., Worden, K., and Cross, E. J. (2015). On robust regression analysis as a means of exploring environmental and operational conditions for SHM data. J. Sound Vib. 347, 279–296. doi:10.1016/j.jsv.2015.02.039
Dilena, M., Limongelli, M. P., and Morassi, A. (2015). Damage localization in bridges via the FRF interpolation method. Mech. Syst. Signal Process. 5, 162–180. doi:10.1016/j.ymssp.2014.08.014
Doebling, S. W., Farrar, C. R., Prime, M. B., and Shevitz, D. W. (1996). Damage Identification and Health Monitoring of Structural and Mechanical Systems from Changes in Their Vibration Characteristics: A Literature Review. Technical Report LA-13070-MS. Los Alamos, NM: Los Alamos National Laboratory.
Farrar, C. R., Baker, W. E., Bell, T. M., Cone, K. M., Darling, T. W., Duffey, T. A., et al. (1994). Dynamic Characterization and Damage Detection in the I-40 Bridge Over the Rio Grande. Technical Report LA-12767-MS. Los Alamos, NM: Los Alamos National Laboratory.
Farrar, C. R., and Worden, K. (2007). An introduction to structural health monitoring. Philos. Trans. R. Soc. A 365, 303305. doi:10.1098/rsta.2006.1928
Farrar, C. R., and Worden, K. (2013). Structural Health Monitoring – A Machine Learning Perspective, 1st Edn. Chichester, West Sussex: John Wiley & Sons, Ltd.
Hart, G. C., and Yao, J. T. P. (1977). System identification in structural dynamics. J. Eng. Mech. Div. 103, 1089–1104.
He, X., Moaveni, B., Conte, J. P., Elgamal, A., and Masri, S. F. (2009). System identification of Alfred Zampa Memorial Bridge using dynamic field test data. J. Struct. Eng. 135, 54–66. doi:10.1061/(ASCE)0733-9445(2009)135:1(54)
Kaloop, M. R., and Hu, J. W. (2015). Stayed-cable bridge damage detection and localization based on accelerometer health monitoring measurements. Shock Vib. 2015, 102682. doi:10.1155/2015/102680
Kim, J. H., Jeon, H. S., and Lee, C. W. (1992). “Application of the modal assurance criteria for detecting and locating structural faults,” in Proceedings of the 10th International Modal Analysis Conference, San Diego, CA, 536–540.
Kozin, F., and Natke, H. G. (1986). System identifi cation techniques. Struct. Safety 3, 269–316. doi:10.1016/0167-4730(86)90006-8
Mahalanobis, P. C. (1936). On the generalized distance in statistics. Proc. Nat. Inst. Sci. India 2, 49–55.
Mainline. (2013). “Maintenance, renewal and improvement of rail transport infrastructure to reduce economic and environmental impacts,” in Deliverable D1.1: Benchmark of New Technologies to Extend the Life of Elderly Rail Infrastructure European Project (Luleå, Sweden: 7th Framework Programme. European Commission).
Meixedo, A., Calçada, R., Alves, V., Ribeiro, D., and Cury, A. (2016). “Damage identification of a railway bridge based on genetic algorithms,” in Proceedings of IABMAS-2016, Foz do Iguaçu, Brazil.
Miyamoto, A., and Yabe, A. (2011). Bridge condition assessment based on vibration responses of passenger vehicle. J. Phys. Conf. Soc. 305:012103.
Moser, P., and Moaveni, B. (2011). Environmental effects on the identified natural frequencies of the Dowling Hall footbridge. Mech. Syst. Signal Process. 25, 2336–2357. doi:10.1016/j.ymssp.2011.03.005
Nayeri, R. D., Tasbihgoo, F., Wahbeh, M., Caffrey, J. P., Masri, S. F., Conte, J. P., et al. (2009). A study of time-domain techniques for modal parameter identification of a long suspension bridge with dense sensor arrays. J. Eng. Mech. 135, 669–683. doi:10.1061/(ASCE)0733-9399(2009)135:7(669)
Nuttli, O. W., Saint, L. U., and Mitchell, B. J. (1979). Research in Seismology. Semi-Annual Technical Report No. 1, 1 October, 1978–31 March, 1980. Saint Louis: Department of Earth and Atmospheric Sciences, Saint Louis University.
Pandey, A. K., Biswas, M., and Samman, M. (1991). Damage detection from changes in curvature mode shapes. J. Sound Vib. 145, 321–332. doi:10.1016/0022-460X(91)90595-B
Peeters, B., and De Roeck, G. (2001). One-year monitoring of the Z24-Bridge: environmental effects versus damage events. Earthq. Eng. Struct. Dyn. 30, 149–171. doi:10.1002/1096-9845(200102)30:2<149::AID-EQE1>3.0.CO;2-Z
Rodrigues, F., Casas, J. R., and Almeida, P. (2013). Fatigue-safety assessment of RC bridges. Application to the Brazilian highway network. Struct. Infrastruct. Eng. 9, 601–616. doi:10.1080/15732479.2011.598939
Salawu, O. S., and Williams, C. (1995). Bridge assessment using forced-vibration testing. J. Struct. Eng. 121, 161–173. doi:10.1061/(ASCE)0733-9445(1995)121:2(161)
Santos, J. P., Cremona, C., Calado, L., Silveira, P., and Orcesi, A. D. (2016a). On-line unsupervised detection of early damage. Struct. Control Health Monit. 23, 1047–1069. doi:10.1002/stc.1825
Santos, J., Silveira, P., Calado, L., and Cremona, C. (2016b). Damage identification based on numerical and artificial intelligence methods. Portuguese. J. Struct. Eng. (Vol III) 1, 81–89.
Santos, J., Orcesi, A. D., Crèmona, C., and Silveira, P. (2015). Baseline-free real-time assessment of structural changes. Struct. Infrastructure. Eng. Maint. Manage. 11, 145–161.
Santos, J., Cremona, C., Orcesi, D., Silverira, P., and Calado, L. (2017). Early damage detection based on pattern recognition and data fusion, J. Struct. Eng. 143.
Sohn, H., Farrar, C., Hunter, N., and Worden, K. (2003). A Review of Structural Health Monitoring Literature: 1996-2001. Technical Report LA-13070-MS. Los Alamos: Los Alamos National Laboratory.
Spiridonakos, M., Chatzi, E., and Sudret, B. (2016). Polynomial chaos expansion models for the monitoring of strutures under operational variability. ASCE-ASME J. Risk Uncertainty Eng. Syst. A Civil Eng. 2, B4016003. doi:10.1061/AJRUA6.0000872
Spiridonakos, M. D., and Chatzi, E. N. (2015). Metamodeling of nonlinear structural systems with parametric uncertainty subject to stochastic dynamic excitation. Earthquakes Struct. Int. J. 8, 915–934.
Stubbs, N., Kim, J. T., and Topole, K. (1992). “An efficient and robust algorithm for damage localization in offshore platforms,” in Proceedings ASCE 10th Structures Congress (San Antonio, TX), 543–546.
Takewaki, I., Nakamura, M., and Yoshitomi, S. (2011). System Identification for Structural Health Monitoring. Southampton, UK: WIT Press.
Talebinejad, I., Fischer, C., and Ansari, F. (2011). Numerical evaluation of vibration-based methods for damage assessment of cable-stayed bridges. Comput. Aided Civil Infrastruct. Eng. 26, 239–251. doi:10.1111/j.1467-8667.2010.00684.x
Teughels, A., and De Roeck, G. (2004). Structural damage identification of the highway bridge Z24 by FE model updating. J Sound Vib. 278, 589–610. doi:10.1016/j.jsv.2003.10.041
Vienna Consulting Engineers (VCE). (2009). Progressive Damage Test S101 Flyover Reibersdorf Report No. 08/2308. Vienna, Austria.
Yan, A., Kerschen, G., De Boe, P., and Golinval, J. (2005a). Structural damage diagnosis under varying environmental conditions part I: a linear analysis. Mech. Syst. Signal Process. 19, 847–864. doi:10.1016/j.ymssp.2004.12.002
Yan, A., Kerschen, G., De Boe, P., and Golinval, J. (2005b). Structural damage diagnosis under varying environmental conditions part II: local PCA for non-linear cases. Mech. Syst. Signal Process. 19, 865–880. doi:10.1016/j.ymssp.2004.12.003
Yao, J. T. O., and Natke, H. G. (1994). Damage detection and reliability evaluation of existing structures. Struct. Safety 15, 3–16. doi:10.1016/0167-4730(94)90049-3
Keywords: structural health monitoring, damage detection, vibration, modal parameters, bridges
Citation: Casas JR and Moughty JJ (2017) Bridge Damage Detection Based on Vibration Data: Past and New Developments. Front. Built Environ. 3:4. doi: 10.3389/fbuil.2017.00004
Received: 30 September 2016; Accepted: 12 January 2017;
Published: 03 February 2017
Edited by:
Christian Cremona, Bouygues Construction, FranceReviewed by:
Alexandre Cury, Universidade Federal de Juiz de Fora, BrazilIzuru Takewaki, Kyoto University, Japan
Copyright: © 2017 Casas and Moughty. This is an open-access article distributed under the terms of the Creative Commons Attribution License (CC BY). The use, distribution or reproduction in other forums is permitted, provided the original author(s) or licensor are credited and that the original publication in this journal is cited, in accordance with accepted academic practice. No use, distribution or reproduction is permitted which does not comply with these terms.
*Correspondence: Joan R. Casas, am9hbi5yYW1vbi5jYXNhc0B1cGMuZWR1