- 1Department of Civil Engineering, Architecture and Georesources, CERIS, Instituto Superior Técnico, Universidade de Lisboa, Lisbon, Portugal
- 2Department of Civil, Chemical and Environmental Engineering, University of Genoa, Genoa, Italy
The fact that linear analysis is still the most used procedure in the design engineering offices, studies which addresses issues associated to the estimation of the structural behavior factor values are relevant. In this study, the behavior factor of a particular type of mixed masonry-reinforced concrete buildings in Lisbon is estimated. The typology chosen in this study represents 30% of building stock in Lisbon; these buildings were built between 1930 and 1960 and thus were designed without considering the seismic-design requirements proposed in current codes. The evaluation of the behavior factors was based on the use of nonlinear static analyses, performed in the form of the sensitivity analysis and following the criteria proposed in the current seismic codes and literature. In the scope of the sensitivity analysis, aleatory and epistemic uncertainties have been considered in terms of the mechanical parameters and structural details, respectively with the aim to take into account different characteristics of the structures. In order to derive the most reliable values of the behavior factor for this typology, extensive research in terms of the historical information, structural characterization and definition of the mechanical parameters has been performed. The study indicates that the final values of behavior factor are low and depend most on the type of connections between structural walls. Although the obtained values of the behavior factor for this typology match well with the ones proposed in most recent seismic codes, it is recommended that the assessment of such factor of a specific class for a particular structural type building should always be careful evaluated.
Introduction
The proliferation in Lisbon of the use of reinforced concrete (RC) in the construction, particularly in apartment buildings, was developed throughout the first half of the twentieth century (approximately between 1930 and 1960). In this period, the mixed masonry-RC buildings firstly appeared as transition from masonry/timber to proper design RC buildings: they are commonly known by contractors and real estate dealers as “placa” buildings. Whole structures of RC were only widely adopted in apartment buildings from 1950s onwards. Until this decade, the partial use of RC structural elements within specific areas and periods of time was mainly influenced by the following two issues: (i) the codes which introduced the requirement of the use of RC elements in specific parts in residential buildings and (ii) the construction of new neighborhoods to fill gaps in already urbanized or in expansion areas of the city.
In this study focus is given to the “Alvalade” area, an exceptional case study for both Architects and Engineers, as it was designed as a global project from city scale to construction detail. As Lisbon is in high seismic hazard area, and these buildings were typically designed without strictly considering the current seismic-design requirements, the seismic evaluation of these existing buildings is crucial for safety reasons and to preserve our built heritage. For an adequate seismic evaluation, it is relevant to: (i) compile and analysis the important historical data for generic characterization of the construction, as it is also referred in ISO 13822 (2010) and ICOMOS/ISCARSAH Committee (2003); (ii) characterize the main structural elements; (iii) model numerically the buildings, being aware of the aleatory and epistemic uncertainties, as they crucial role in performance-based earthquake engineering; and (iv) perform reliable global seismic analyses. For the global analysis of the structural system, attention will be given, in this work, to nonlinear static and to linear procedures, which are the ones most used in common practice. Despite the significant progress in nonlinear methods of analyses of old building structures in the last decades, there is still considerable resistance to use nonlinear procedures in practical engineering offices. Thus, it would be important to define values for the behavior factor (q for European practice and R for US practice) to be used in the seismic assessment of mixed masonry-RC buildings typology existent in Lisbon.
In this study, q-factor values are defined based on the nonlinear static sensitivity analysis (Cattari et al., 2015a), following the different methods proposed in CEN Eurocode 8 (2004) and in the related research (Tomaževič et al., 2004; Thomos and Trezos, 2005; Magenes and Menon, 2009; Senaldi et al., 2014). For the sensitivity analysis, both types of uncertainties are considered, epistemic and aleatory. In this way, q-factor is defined in a more adequately way, because it is counted for certain number of uncertainties; this is always quite important, due to the huge variety of the materials and structural elements in old masonry-RC buildings. After obtaining the values of the q-factor for each direction (X and Y), for two load patterns (uniform and triangular) and for all considered models (see section Modeling and Definition of Uncertainties), values are compiled and the final ones for the q-factor for the typology under study are proposed. Even the obtained values are matching well with the values proposed in CEN Eurocode 8 (2004) and NTC Italian Code for Structural Design (2008), it is recommended to evaluate the q-factor for each construction typology according to the specific characteristic of certain typology. In this way, seismic analysis will be more reliable and accurate. In fact, the numerical definition of the behavior factor of existent buildings is certainly a subject of research in order to make their seismic structural performance more predictable from the engineering point of view.
The Mixed Masonry-RC Buildings
Historical Background
The growing importance of RC in Lisbon's construction of the twentieth century is directly proportional to the decline of timber construction. The construction of buildings using only timber structures is no longer possible after 1930, followed by appearance of the Regulation for the Urban Construction for the City of Lisbon (GRUC, 1930). In fact, after 1930, the use of RC became more common, particularly in kitchens and bathrooms. Throughout the decade of 1930s this material was increasingly being used in more elements of the construction: on the separation of commercial/ground floors and the floors above, on balconies and terraces and finally on most of the floors.
Meanwhile, in 1935, a new RC Regulation (RRCS, 1935) is approved, and the popularization of this “new” material was certainly enhanced by the national production which, since 1894, took place near Lisbon with a consequent drop in prices. The major architectonic advantage of the new technology was used by modernist Architects and Engineers in the design of the main façades. The full potential of RC was used to build cantilevers which usually constitute the balance of concrete floors, creating suspended, horizontal volumetric balconies or bow-windows (in a process similar to that of the overhanging stories in medieval buildings) and that states the image of buildings from the second half of the 1930s. From a conceptual point of view, in this decade the RC floors progressively replace the old timber floors. Nevertheless, until 1938, from a morphologic point of view, buildings remain identical, regardless the adopted solution–timber or concrete floors.
In 1938, began a much stricter control from the municipal services over the image but also the structure of the buildings. On new expanding areas of Lisbon city, and especially on the main streets and squares, the licensing services of Lisbon's city hall imposed a “stylized nationalist” (Fernandez, 1943) language which did not consent the concrete balconies and consoles used in the previous years. The municipal services required specific deployment perimeter which will originate the so-called “cod-tail” (“rabo de bacalhau”) buildings. These buildings with an inverted “T” plan, which consists in general of two rectangles where the smallest one characterizes the open space in the rear wing (Figures 1C,D), appeared yet in the end of the 1930s, but their spread throughout Lisbon occurred in the following 10 years. In (Figure 1), the evolution of the buildings in terms of plan configuration is presented, as well as the layout of the rooms inside the buildings.
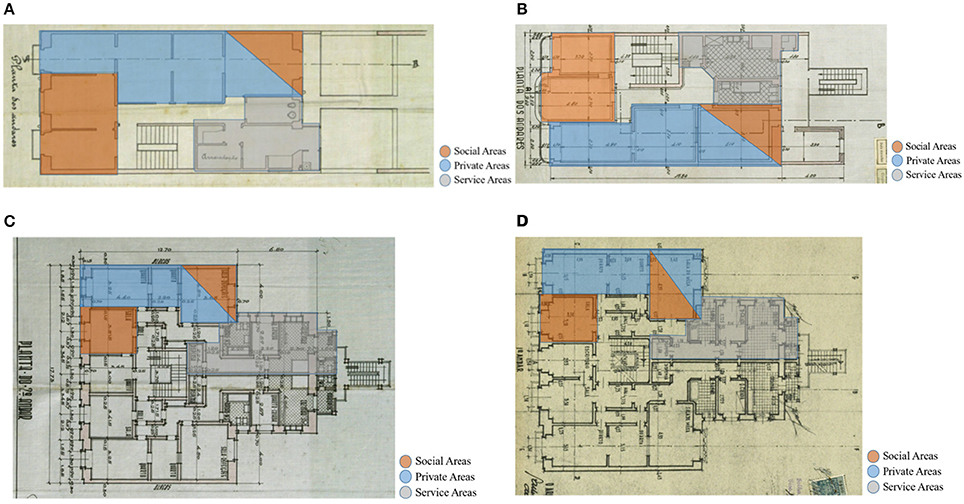
Figure 1. An evolution of the shape of the buildings plan through the years. (A) Building plan with masonry/timber structure (1907). (B) Building with similar plan but with masonry RC structure (1937). (C) Building plan “rabo de bacalhau” with masonry/timber RC concrete (1944). (D) Building with similar plan “rabo de bacalhau” but with masonry RC (1944).
Thus, the mixed masonry-RC buildings are characterized by two main types in the plan: rectangular and “Rabo de Bacalhau” plan.
The use of RC slabs for buildings' floors, which seemed an irreversible trend by the end of the 1930s, has been detained in the early 1940s due to the Second World War and the consequent lack of iron.
One can say RC was used in a casuistic manner, following a cost-benefit balance differing from building to building. In fact, the slow and irregular introduction of RC in the structural elements in the average/common residential buildings in Lisbon, namely in the so-called “income buildings,” that has been generically summarized in the mixed system of bearing masonry walls and RC slabs, has after all, a more complex and diverse history of which the most common solutions are:
a) Until 1930, buildings with an occasional use of concrete or RC in foundations, terraces, interior floors or rooftops;
b) From 1930 buildings use RC on floors of wet areas and in peripheral belts, remaining the floors in timber structure;
c) From 1935 onwards buildings with all interior and exterior floors, peripheral belts (eventually balconies and consoles on the main façade) in RC;
d) From the late 1930s on, buildings with every interior and exterior floor and some vertical and horizontal structures (walls or frames) in RC;
e) During the 40 s there is a set of buildings, which become relevant during World War II due to the iron scarcity, where both timber and RC floors coexist. During this period, it is common to find buildings in which only the wet areas, or the service stairs, or all the floors in the rear volumes, or the floors of the first floor or terrace are built with RC, the remaining being of wood.
Geographic Distribution of the Mixed Masonry-RC Buildings in Lisbon and Plan Urbanization of “Bairro de Alvalade”
Apartment buildings with mixed structure of masonry and RC exist all over the city of Lisbon, although they are predominant in streets or areas urbanized during the 30 and 40 s. Particularly, two types can be distinguished: (i) the one urbanized by private promoters or following partial plans and (ii) the one with a greater official intervention by the state or the City Hall and already partially following the “De Groër Plan,” that represents the first major urban plan for the whole Lisbon, developed from 1938 to 1948 (França, 1997).
In Figure 2A the areas of Lisbon are identified, with the apartment mixed buildings from the two types of groups. In the areas matching the first group (private promotion areas), there is many “deco” or “modernist” buildings (Figure 2B) whereas in the areas matching the second group (public promotion areas) prevail the buildings with a “nationalist” or “soft” modernist image (Figure 2C).
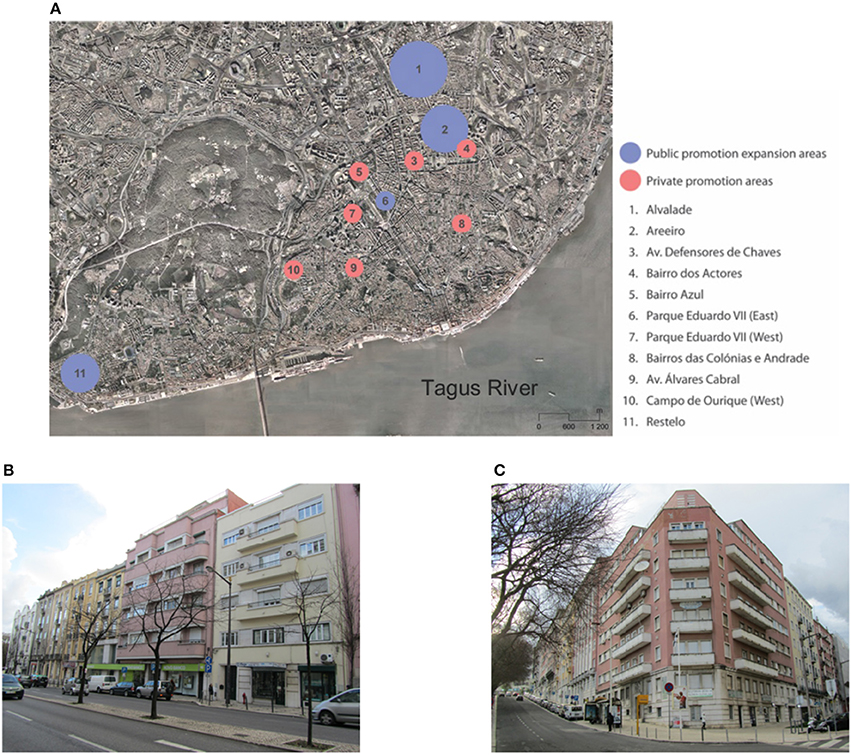
Figure 2. Some of the mixed masonry RC apartment buildings and their insertion areas. (A) Location of the buildings. (B) “Déco” and modernist buildings and (C) “Nationalist” or “soft” modern image buildings.
It should be mentioned that the area of “Alvalade” represents a major diversity of these types of buildings. Thus, in the following the focus will be given on this area.
Namely, the “Alvalade” neighborhood is a substantial central urban area in Lisbon, with relevant modern/neoclassic/art deco set of buildings, which deserve to be preserved. Moreover, this area corresponds to the first large-scale urban operation planned to expand Lisbon by public initiative prepared at the beginning of the 1940s (Alegre and Heitor, 2004).
The Urbanization Plan of “Alvalade” approved by the Portuguese government in 1945, was initiated in 1938. With an area of 230ha, “Alvalade” was designed as a “total” project–from city scale to construction detail. In that way, it is the only twentieth century Lisbon neighborhood where urban and building design was thought as one, totally coherent. Its significant extension within the city fabric and its social, design and construction concerns turn this Lisbon area an exceptional case study for both Architects and Engineers. It was only possible because the City Hall totally changed its current methodology for city planning.
This area was programed to integrate social and low rental housing, supported in equipment: school, market, civic center and small industry. In “Alvalade,” opposite to major parts of the city, a high percentage of apartment buildings were not meant to be “income” buildings (which were private promoted as a financial product) as they belonged to public entities for social purposes.
The project of “Alvalade” is based on a rectangular hierarchical grid, divided by a net of main axes defining eight cells - cell I to VIII (Figure 3A). This approach allows the creation of “neighborhood units” with a strong concern in applying the principles of zoning, and assigning each cell to specific functions (Alegre and Heitor, 2004). The “neighborhood units” were designed around a central element, the primary school, not exceeding the distance of 500 m from house to schools (Figure 3E). Pedestrian circulation is enabled by paths that cross the backyards of housing blocks. Other public facilities, particularly the market and the civic center, are distributed to be easily accessible by the dwellers of each cell. Public parks and gardens were designed as large common outdoor spaces for the enjoyment of residents (Alegre and Heitor, 2004).
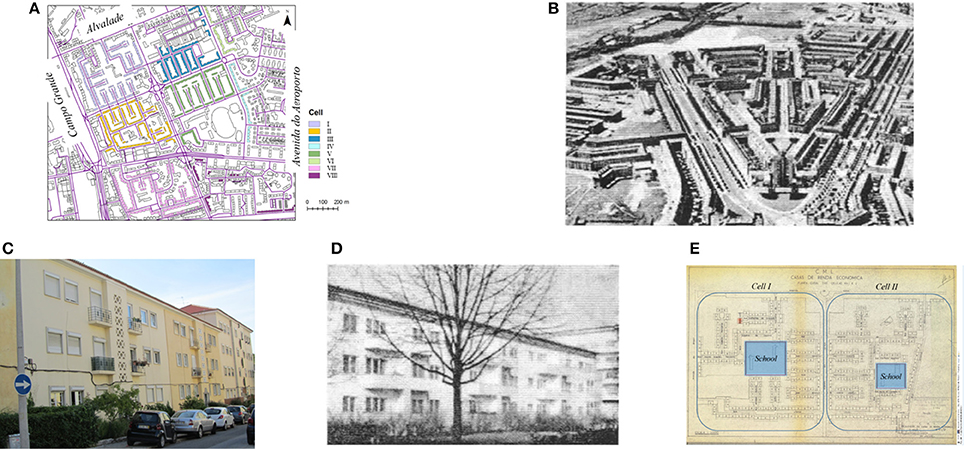
Figure 3. Comparison between “Bairro de Alvalade” in Lisbon and other cities. Areas in (A) “Bairro de Alvalade” and (B) Amsterdam (Costa, 2005). Buildings in (C) “Bairro de Alvalade” and (D) Berlin (Costa, 2005). (E) Primary school as a central element (City Hall)1.
The organization of “Bairro de Alvalade” (Figure 3C) resembles some Amsterdam areas (Figure 3B) and some proposals developed in Berlin (Figure 3D) for economic construction in the 1920–1930 decades (Costa, 2005). This is surely related with the international academic education of the Portuguese urban planner but also with research that was made by the city hall technicians, as presented in contemporary papers and reports edited by LNEC (the Civil Engineer National Laboratory).
Firstly, the main characteristics of the buildings that belong to the area of “Alvalade” are analyzed in this work, whereas the detailed information regarding the constructive details and material used in these buildings is presented in Milosevic et al. (2018a). Initially, a database was prepared in a Geographic Information System (GIS) with the ArcGIS® program (ESRI, 2014; Figure 3A).
“Alvalade” area consists of a total of 1975 buildings and most of this stock, about 72%, represent the mixed masonry-RC cases, while “just” RC constitute 17%, and the remaining 11% belong to stone masonry buildings.
The urbanization of “Alvalade” began with the construction of houses which belong to the program of low rental housing located in cells I and II (between 1947 and 1950, Figure 4A) including the construction of 302 buildings (2,066 apartments) with three or four floors (two apartments per floor) without elevator. The construction of those two cells was divided in four constructed groups. The buildings in the first three groups were built with rubble stone masonry with hydraulic mortar for the exterior walls and brick masonry for the interior walls. In the last group, walls were built with hollow or massive concrete blocks masonry because of effective cost control. Floor and roof structures were made by timber beams, excepting for kitchen, bathrooms and stairs, where RC slabs were used.
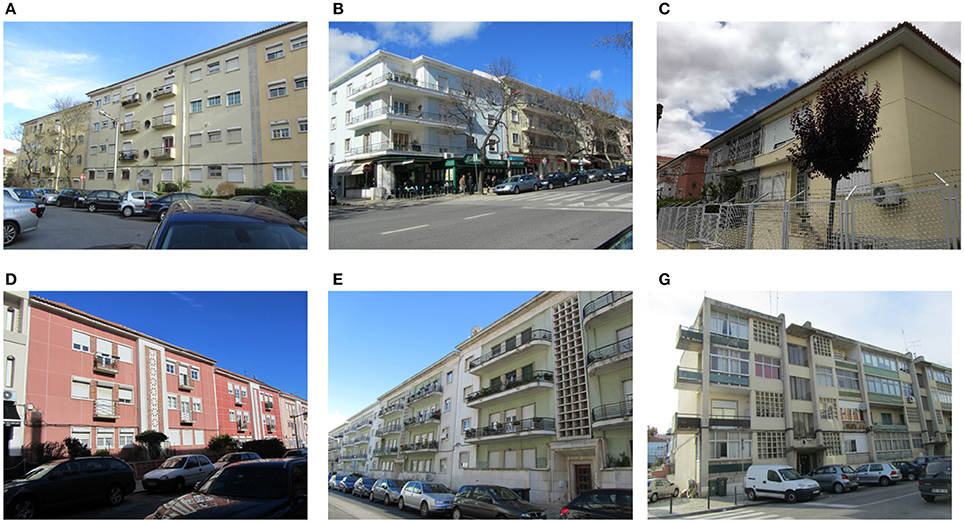
Figure 4. Buildings from different cells. (A) Buildings in Cells I and II. (B) Buildings in Cell III. (C) Buildings in Cell IV. (D) Buildings in Cell V and VI. (E) Buildings in Cell VII. (F) Buildings in Cell VIII.
Cell III from “Alvalade,” was planned to be the commercial area of the neighborhood (Figure 4B). Cell IV is a predominantly area of single family houses in “Bairro de Alvalade,” and their planning was conducted between 1948 and 1950, according to the indications of the urban plan (Figure 4C).
The construction of economic rent houses on cells V and VI was developed between 1949 and 1956. Cell V (Figure 4D) comprises about 108 buildings and the urbanization of this housing project was finalized in 1954. Furthermore, in the same year, the construction of 62 more buildings was planned for the cell VI (Figure 4D). It should be mentioned that, by then, the construction of Economic rent houses in “Bairro de Alvalade” started to decline, and only 42 buildings were built, representing about the 2/3 of the planned program. This period marks the end of the Economic rent houses in “Bairro de Alvalade.”
Cell VII was developed between 1949 and 1951 and corresponding to a very fine quality architecture developed in “Alvalade” (Figure 4E). The design of the buildings is like the design of the Economic Rent Houses; however, these buildings are slightly larger, allowing for more spacious rooms, and have larger balconies. In cell VIII the project for mixed masonry RC apartment buildings was developed between 1949 and 1952 (Figure 4F). This project starts to integrate the architecture developed in “Alvalade” with an image closer to Modern European architecture. In those buildings, RC columns and slabs have important visual impact on the façades.
Structural Characterization of Buildings
The detailed structural characterization as well as the data need for the study of their structural seismic behavior of these buildings, from the “Bairro de Alvalade,” are available in Milosevic et al. (2018a). The information given in this section would provide only the principal structural characteristics of the typology under examination.
Foundations
The typical foundation system was made with very stiff stone masonry and with hydraulic mortar. The foundation works as a thick continuous wall, which was enlarged in its base with a minimum depth which varies from 0.3 to 0.5 m, for the hard rock or for other type of terrain, respectively.
Further, in this period, the first RC foundations appear in some buildings, where the reinforced concrete was used: (i) isolated foundation; (ii) foundation below the side walls; or (iii) foundation slab.
Masonry Walls
Existing exterior, interior and partition walls are constituted by a diversity of materials: rubble stone masonry (Figure 5A), solid or hollow brick (Figure 5B) and concrete block (Figure 5C) with hydraulic or cement mortar.
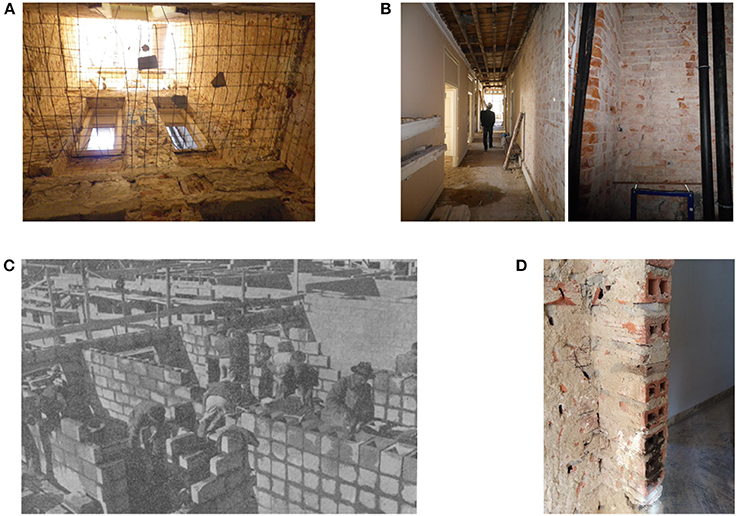
Figure 5. Masonry walls with different type of materials. (A) Rubble stone, (B) Brick, (C) Concrete block, (D) Connection between walls.
Typically, façade walls are rubble stone or brick masonry, as well as mixed rubble stone and brick with two types of mortar: hydraulic or cement. In some rare cases, concrete block masonry can also be found as a material for the façade walls. In general, these walls are characterized with reduction of the thickness in height of the buildings.
As concern the side walls, the same materials and analogous changes of the thickness in height as for the façade walls were used. The use of concrete blocks with cement mortar (cement:sand = 1:2) in the side walls started likewise to be used in this type of buildings.
For the buildings under study, together with the variation of the thickness of the walls, the type of materials may also vary in height. Namely, in case of the interior structural walls, solid brick was used for the lower floors, particularly for the first floor and basement, together with the staircases; on the other side, hollow brick was implemented in the upper floors. Still, exception appears in area of “Alvalade,” mainly in Cell I and II, where the solid brick was used only for the walls around services stairs in the ground floor, which give the access from the back façade.
In the transition period, the wood as a material for the partition walls practically was eliminated, except in the case of attics or mansard or in the case of the certain conditions which do not permit the use of more durable material.
It should be mentioned that material used in the case of the basement' walls, when in the contact with the soil, was rubble stone and hydraulic mortar; in the parts which were placed below the ground level impermeable and resistant coating was used as covering on one side.
It should be mentioned that only in exceptional cases these buildings are not placed into the blocks. Thus, aggregate condition should be considered for the seismic assessment of an individual building that compose the block. Moreover, cases when the buildings share the side walls or not, should be also analyzed in detail, since that both situations can appear in these structures.
Finally, the connections between walls (interior/exterior; exterior/exterior) are probably one of the main weakness of these buildings when subjected to seismic actions. Namely, connection between the exterior and interior walls cannot be considered as appropriate, since that such walls were built with different materials; thus, vulnerability of this connection is increasing due to the difficulties of interlocking the different masonry units (e.g., rubble stone and brick). Moreover, even if the materials between exterior walls were the same, the connection cannot be considered completely reliable due to the bad quality of masonry at corners (Figure 5D), that can be associated to construction of connected walls at different times. In any case, additional in-situ inspections and experimental tests are recommended to confirm this issue.
RC Beams and Columns
The characteristics of RC structural elements, as well as their location, depends on the number of floors in the building. For example, in case of the buildings from Cell I and II (Economic Income Houses, with a rectangular plan configuration), in general, only RC beams at the height of the window, i.e., lintels, are used. These elements avoid, for this typology, the out-plane behavior of the masonry walls, i.e., the activation of local mechanisms.
In the buildings from 3 to 5 floors, slender RC frame structures started to appear at the ground floor when larger spans and open spaces were needed to be used for commercial occupation. Then the concrete frame structure was extended to the exterior structure: on the corners of the building making the connection between the perimetral walls; only on the façade walls structure (front and back); or only on the back façade walls. For example, on “Rabo de Bacalhau” typology the prominent shape of the building was made with a RC frame structure and concrete slabs.
The reinforcement of the RC structural elements was used in a casuistic manner. There is an evident absence of specific design features in terms of the amount and detailing of the reinforcement to ensure the structural safety and ductility of the system. The concrete used has a low to moderate resistance (varying between C16/20 and C20/25) and was slightly compact, whereas the steel corresponds to the class A235.
Floors, Roof, and Stairs
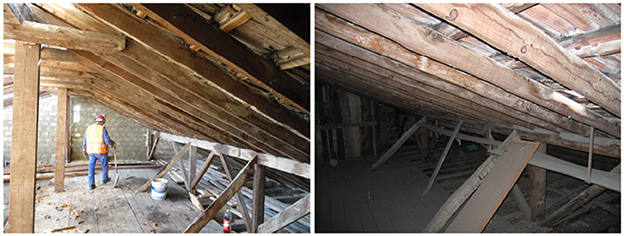
There are mainly two types of floors: timber floors and RC slabs. The timber floors (Figure 6) are commonly constituted by parallel timber beams, made of Pinus pinaster Ait, spaced about 40 to 60 cm and with sections of 0.08 × 0.16 m2 or 0.08 × 0.18 m2. The floorboards are placed perpendicular to the timber beams and both elements are traditionally connected by wire nails. The timber floors are presented mainly at the front, in the social and private areas. These constructions represent the last examples of the use of timber floors and they started to be strengthened by peripheral RC beams supported on the exterior masonry walls.

Figure 6. Masonry walls with different type of materials: (A) Rubble stone, (B) Brick, and (C) Concrete block.
The RC slabs started to be introduced in services areas located on the back of the buildings (kitchens, bathrooms, and balconies). These RC slabs were barely reinforced by steel rods and generally, with only one layer of reinforcement for positive moments; there is no guarantee on the continuity of the reinforcement between spans, thus, the slabs do not work as a continuous floor. RC slabs reinforced in two directions with the 0.10 m thickness were found in situ, too. As referred, the type of concrete used varies between C16/20 and C20/25, whereas most steel corresponds to the class A235.
The most common types of roof are still the timber framed of Pinus pinaster Ait. Figure 7, as in the case of timber floors. The configuration of the timber frames consists of main beams (rafters), mainly disposed parallel to the façade and supported by vertical or diagonals timber elements (Figure 7), loading the main internal and side walls. A range of perpendicular beams, distancing from 0.40 to 0.60 m, was placed on top of the main beams to support the Portuguese roof tiles (“Telha Lusa” or “Marseille”). In these buildings started to appear RC roofs: flat roof and alongside the traditional solutions of sloping roof.
The main stairs were made with the concrete or wooden materials and are usually located in the middle of the building. Though, buildings with more than three floors have stairs preferably constructed in RC and with the capacity to install an elevator. On the other side, the buildings with more than four floors, next to the main stairs, have a service staircase with access from the street and built in RC or iron.
Seismic Behavior of Lisbon Mixed Masonry-RC Buildings
For the global seismic behavior of buildings four main methods of structural analysis are proposed in more recent codes (e.g., EC8-3): linear static, linear dynamic response spectrum, nonlinear static (pushover) and nonlinear dynamic. Despite one can say that linear dynamic method and nonlinear static methods, are the ones that can be used in common practice, the former is still the most common in engineering offices. For the former, and according the EC8-3 classification, a q-factor approach is followed which request the use of a q-factor value.
In this section values of q-factors are defined for most representative type of mixed masonry-RC buildings. Thus, the case-study corresponds to buildings with rectangular shape, characterized by the similar type of material and similar structural elements (i.e., more standardized when compared with “Rabo de Bacalhau” type) and located mainly in Cell I and Cell II of “Alvalade” area.
The values of q-factors are defined from the pushover curves considering different sources of uncertainties that influence the global seismic behavior.
Case Study
The case study consists of three floors, constant in the height, with two flats per floor. They are with rectangular shape with overall dimensions 17.50 m by 6.40 m. Figure 8 illustrates some original archive drawings of the cut section and plan view of the building, together with the front and back façades. Façade walls thickness is 0.50 m on the ground floor, while they are thinner at the upper levels (walls thickness on the last floor is 0.40 m); side walls are with the thickness of 0.50 m without openings, constant in height. Rubble stone masonry and hydraulic mortar characterize the exterior walls (façades and side walls), whereas the interior walls were built mainly with hollow bricks and cement mortar. Only walls around the services stairs in the ground floor and intermediate walls of the stairs below the first floor were built with solid bricks.
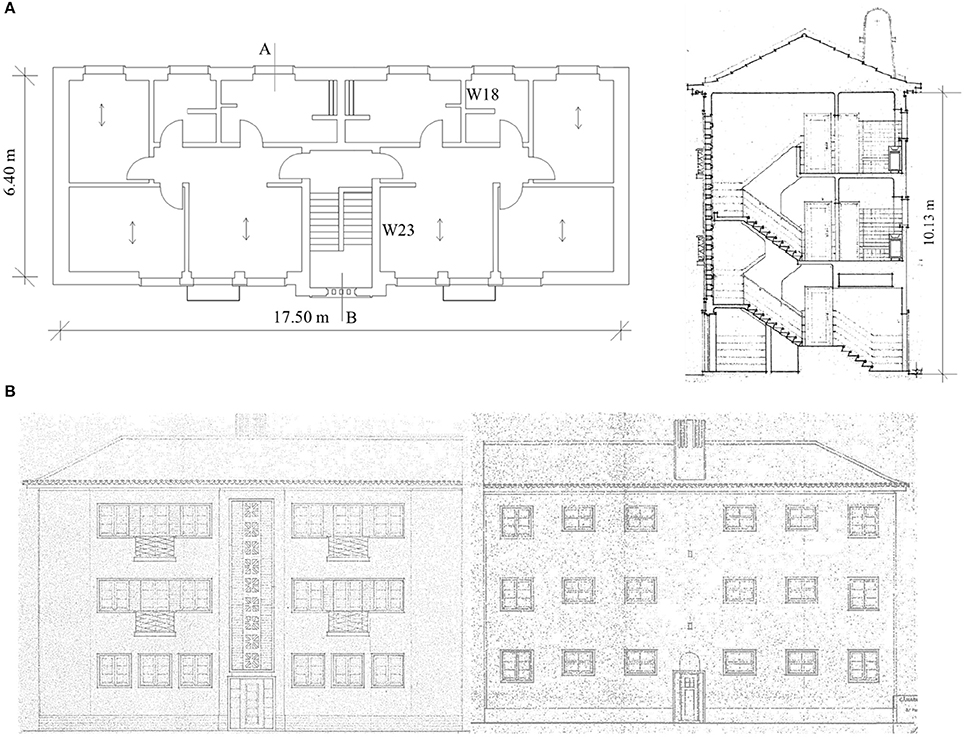
Figure 8. Drawing of the case study. (A) plan and cut section “AB” (right) of the building. (B) front (left) and back (right) fascades.
The part on the façades below the window in each floor was constructed with hollow brick with 0.15 m thickness. RC elements are placed on the external walls, which are strengthened (belted) on all floors by RC beams at the height of the window lintels with the thickness of the wall and 0.20 m in height; small RC lintels were found of each doorway. There are two types of floor construction used in these buildings: timber floors in the rooms and concrete floors in the services areas. On the ground floor, below the part where the timber floor exists, there is the “ventilation box” in order to provide the air circulation and to avoid accumulation of moisture below the floor.
Modeling and Definition of Uncertainties
For case study, only the global seismic response is considered, whereas the local flexural behavior of floors and the out-of-plane walls' response are not explicitly computed as, according to the authors opinion it is not relevant. This is due to the presence of RC ring beams which reduce the vulnerability to the out-of-plane failure modes of masonry walls.
The global response of the buildings is examined through the equivalent frame modeling approach, using 3Muri Tremuri program (3Muri2; Lagomarsino et al., 2013) and by performing nonlinear static analysis. The nonlinear response of masonry panels, concentered at walls divided into piers and spandrels, is described through nonlinear beams characterized by piecewise-linear law (Cattari and Lagomarsino, 2013a). For the definition of the backbone curve, the elastic response is described regarding to the beam theory by defining the initial Young (E) and Shear (G) modulus of masonry. Afterwards, the progressive degradation is approximated using a secant stiffness. The elastic values are defined by multiplying the secant stiffness by a coefficient (kel), which values are defined in Table 1. The progression of nonlinear response is associated with increasing levels of damage, by assigning progressive strength drops (βEi) at predetermined drift levels (θEi), associated with the achievement of reference damage levels (DL) (from 1 to 5, i.e., DL1–slight; DL2–moderate; DL3–extensive; DL4–near collapse; DL5–collapse).
The maximum shear and bending strength are defined assuming the criteria proposed in codes and literature by considering the occurrence of different failure modes: shear, flexural and mixed.
For the diagonal shear cracking, the criterion proposed by Turnšek and Sheppard (1980) is adopted, while for the flexural behavior, the one proposed in Lagomarsino et al. (2013) is considered, combining both, the compressive and bending failure. Reinforced concrete elements are modeled as nonlinear beams by assuming elasto-perfectly plastic hinges concentrated at the end sections (Cattari and Lagomarsino, 2013b). Diaphragms are modeled as an equivalent membrane with an equivalent thickness of 0.022 m and characterized by normal stiffness represented by Young Modulus in the main warping direction E1,eq (29 GPa), and E2,eq in the perpendicular direction (12 GPa) and in-plane shear stiffness related to the shear modulus Geq (0.00988 GPa). For the RC slabs, the values adopted in the modeling are Eeq = 29 GPa, equal in both directions and Geq = 12 GPa.
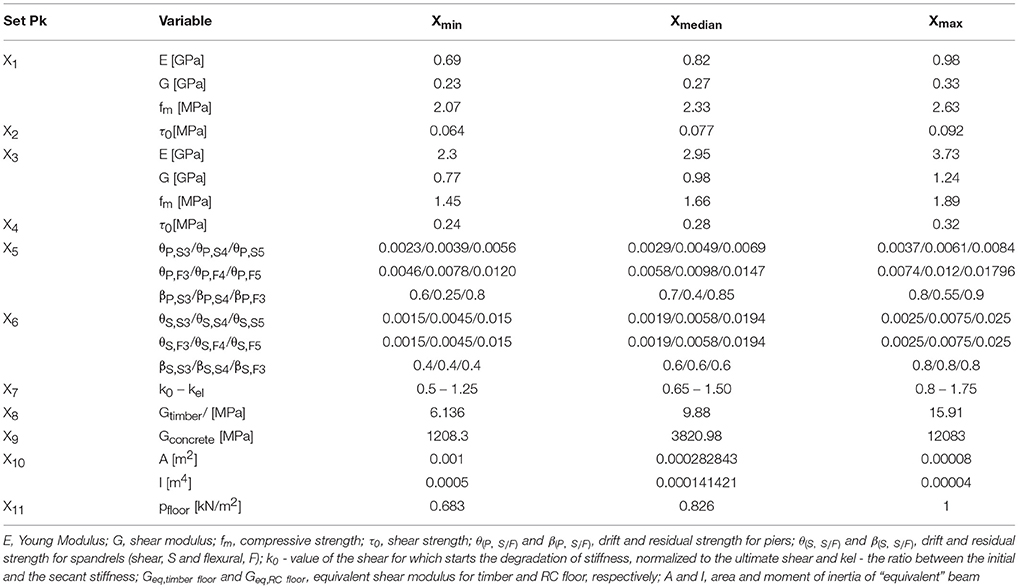
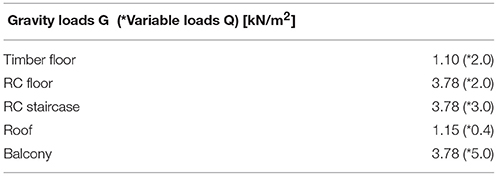
Concerning the uncertainties, two types are considered: aleatory (related to the mechanical parameters) and epistemic (related to the structural details). In terms of aleatory uncertainties, eleven variables are considered for the execution of the sensitivity analyses (2N+1, N corresponds to the number of variables or group of variables, defined in the following). These variables include mechanical properties in terms of Young modulus, shear modulus and compressive strength of rubble stone and hollow brick masonry (X1 and X3, respectively) and shear strength of rubble stone and hollow brick masonry (X2 and X4), then the parameters which control the drift and strength decay of piers and spandrels, respectively (X5 and X6), the parameters which control the degradation for the initial elastic stiffness (X7), the parameters connected to the stiffness of the timber and RC floor, respectively (X8 and X9), the parameters which control the connection between external walls (X10) and the parameters which control the different thickness of the reinforced concrete slab (X11). To each variable, it is defined a plausible range of variation - a minimum value (Xlow), a median one (Xmean) and maximum value (Xup) - used for the proceeding of the sensitivity analysis. The mechanical properties were defined based on the values from Italian standard and on the values obtained from experimental tests performed on the buildings, similar as the one under the examination. Detailed explanation about the procedure how the parameters were defined can be found in Milosevic et al. (2018a). Table 1 represents the aleatory variables considered as the most relevant and included in the sensitivity analyses. Table 2 includes the gravity and live loads adopted for the examined building. The values related to drift limit and strength degradation are adopted from the experimental tests available in the literature.
As referred in the previous section, one of the main problem for buildings from these typology is the connection between exterior/exterior and exterior/interior walls, as well as between walls and floors. Thus, epistemic uncertainties considered in this study are related on the connections between exterior/interior walls. Due to this, two models have been adopted: (i) model with bad connections between exterior/interior walls and intermediate connections between exterior/exterior walls (model A) and (ii) model with good connections between walls (model B). In order to simulate bad connections between exterior/interior walls, the automatic mesh generated by 3Muri2, was modified by introducing equivalent elastic beams connecting nodes at intersections. On the other hand, to model good connections between the walls, the equivalent beams assume values resembling a rigid link. It worth to mention that connection between exterior/exterior walls and between walls and floors, were considered as aleatory uncertainties, i.e., X10 and X8/X9, respectively. Detail description about the calibration of the effectiveness of the wall to wall connections could be found in Milosevic et al. (2018a,b). The model A is considered as more representative and realistic; nevertheless, the q-factor is provided for both models (see section Structural Behavior Factor).
Pushover Curves
Nonlinear static (pushover) analyses were performed by considering each main direction (X and Y) in both senses (positive and negative) and two load patterns distributions (uniform, proportional to the mass, and triangular, proportional to the product between mass and height), as recommended in EC8 and NTC. The load distribution was adopted regarding the conclusions presented in the previous study performed on similar types of buildings (Cattari et al., 2015b). However, regarding the results obtained from nonlinear dynamic analyses, which is out of scope of this paper, the more comprehensible load patterns for buildings under study was defined for each direction, i.e., in case of the X direction the more appropriate load pattern is the triangular, whereas in the case of Y direction, uniform load pattern has better correspondence with nonlinear dynamic analyses. For detailed results see Milosevic et al. (2018b). Control node was selected at the top level in the wall that first collapses, as recommended in Lagomarsino and Cattari (2015).
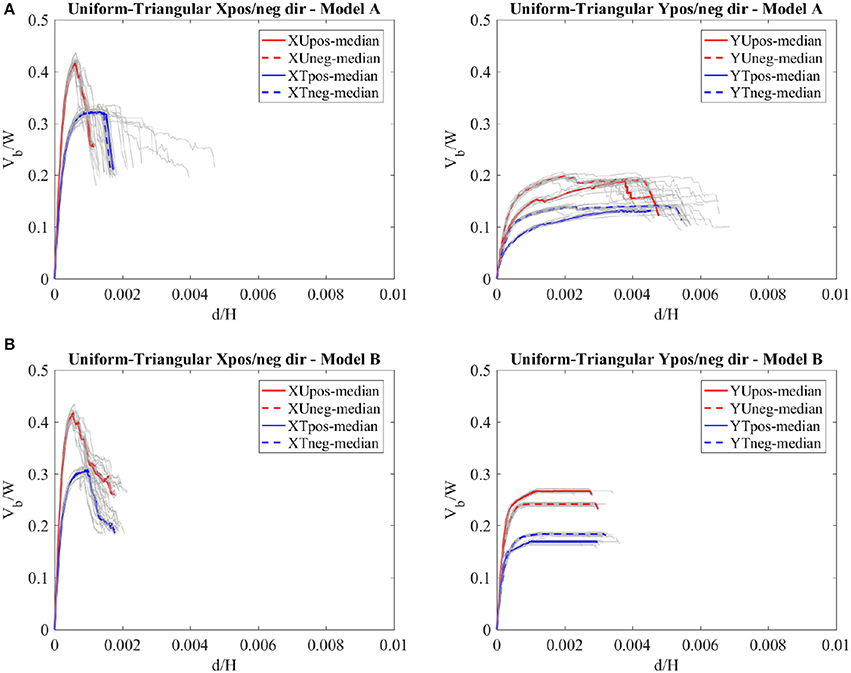
Figure 9 represents the normalized pushover curves in case of both analyzed models for each main direction and both load distributions. The overall base shear is normalized to the total weight W, while the top displacement d to the total height H of the buildings. The pushover curves depend, among others, on the material's strength, deformation capacity of each structural element and on the structural details. In the present study, the values of mechanical parameters are varied between min-median-max values, together with the two different models in terms of the connection between walls, series of the pushover curves are obtained (Figure 9). In total 184 analyses were performed for each defined model (A and B). Next to the pushover curves obtained by median values of mechanical parameters (red and blue for uniform and triangular load distribution, respectively), pushover curves obtained for all models (represented in gray color) considered in the sensitivity analysis are also presented; in this way, it is possible to observe the variability of the behavior of the structure, considering different values of mechanical parameters. According to Figures 9A,B), which refers to Model A, it is possible to observe that both, stiffness and base shear capacity are higher in case of the X direction for both load patterns, whereas the higher ductility is obtained for Y direction due to the flexural behavior (damage) of the walls in such direction. Comparing the two load patterns considered in the analysis, it is worth highlighting that in both directions the uniform pattern distributions gives higher capacity, whereas the triangular pattern distributions leads to higher ductility, mainly in X direction. Concerning the median pushover curves obtained in positive and negative directions, there is no such a big difference, particularly in the X direction, due to the symmetry of the buildings. However, based on the results obtained for all performed analyses, the dispersion in the displacement is more emphasized in case of the triangular load distribution. Namely, the values adopted for drift in case of piers for different DLi (group X5, Table 1) are the ones that significantly affect the final ductility of the buildings (Figure 9A).
As concern the Model B, similar conclusion as to the Model A is reached: bigger strength is obtained in case of the uniform load pattern for both analyzed directions. Comparing the Model A and Model B, obtained base shear is higher for the latter one, particularly in case of the Y direction, where the bad connections between walls were mainly considered (Milosevic et al., 2018a). These results are showing: (i) the importance of improving the connections between exterior/exterior for this typology; and (ii) the need to perform the seismic analysis considering the bad connections between walls.
Based on the more appropriate load pattern defined for each direction (Milosevic et al., 2018b), only the correspondent results are presented in the following and, consequently, the behavior factor is obtained for such cases (see section Structural Behavior Factor).
It should be mentioned that pushover curves are presented only until the value of the ultimate displacement (du), i.e., displacement which corresponds to Damage Level 4 (see section Definition of Limit States).
Definition of Limit States
The evaluation of damage levels (DLs) (assuming to have a direct relation to Limit States, LSs) from nonlinear static analysis is not an easy task, and different approaches may be adopted. For instance, in the Eurocode 8 (CEN Eurocode 8, 2004) a heuristic approach is followed, where LSs are defined based on conventional limits directly defined on the pushover curve, usually in terms of decay percentage or reaching of the maximum value of the overall base shear.
Though, in case of existing old masonry or mixed masonry-timber and masonry-RC buildings, application of this approach may lead to untrustworthy results. In fact, while in case of a box-type behavior with in-plane almost rigid floor behavior it is realistic to assume that many structural elements and walls reach almost at the same time a certain damage level (DLi), in case of existing buildings with timber floors this condition is far to be true due to the existence of flexible floors. In fact, for unreinforced masonry buildings (URM) with flexible diaphragms, the limited load transfer between vertical elements leads to a more independent behavior of the walls. Consequently, the reaching of serious damage in a wall may not appear evident on the global pushover curve, when this wall offers a small contribution to the total base shear force.
Aiming to monitor the occurrence of significant damage in parts of the structure that may not be evident in the pushover curve, Lagomarsino and Cattari (2014) and Lagomarsino and Cattari (2015) proposed a multi-scale approach to define DLs on the pushover curve that defines the behavior of the buildings at three scales: (i) local, with damage on structural elements, piers and spandrels, (ii) macro-elements (like masonry walls or floors) and (iii) global (represented by the pushover curve).
In the presented work, damage levels (DLi, i = 1 … 4) are defined by taking into account the different scales considered. It may be mentioned that reference is made to the attainment of damage levels 2, 3, and 4 assumed to correspond respectively to the Damage Limitation, Life Safety and Near collapse as defined in the part 3 of Eurocode 8 (CEN Eurocode 8, 2005). According to the multi-scale approach, the DLi is defined by the minimum displacement threshold obtained from the verification of conventional limits at the three scales, explained briefly in the following:
i. Local scale: related with the assessment of the cumulative rate of damage in piers that reach DLi in accordance to the element multi-linear constitutive law (Lagomarsino and Cattari, 2015);
ii. Macro-element scale: comprehends the verification of inter-story drift limits in each wall and level (θDLi) or the angular strain (γF) (in case of floors assumed as flexible);
iii. Global scale: described as a function of a rate (kG) of the maximum base shear force (V/Vmax). In this study, the following limits are considered: 0.5 for DL1, 0.75 for DL2, 0.8 for DL3 and 0.6 for DL4.
For the macro-element scale, a new formulation is adopted in this study, as proposed by Marino et al. (2018). It refers to the attainment of a given DL on all piers located on a story at a certain level with the aim of checking the occurrence of a soft-story mechanism.
Figure 10 presents the final position of DLi in the pushover curve in X and Y directions for the Model A and the for the most representative cases in terms of load pattern distributions.
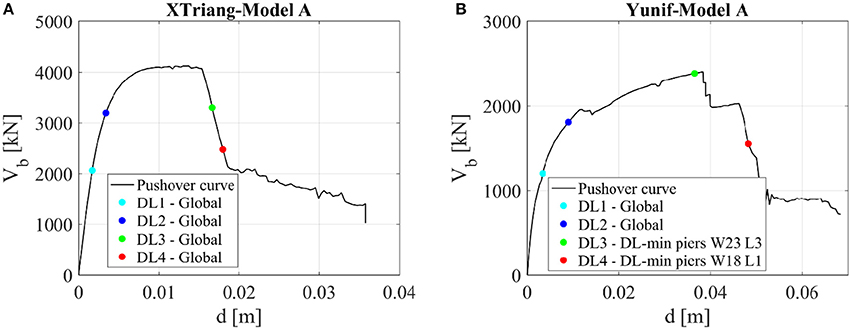
Figure 10. Example of the final position of DLi in the pushover curve in the X (A) and Y (B) directions (W23L3 stands for wall 23 in the 3rd floor and W18L1 for wall 18 1st floor–see Figure 8A).
Structural Behavior Factor
The determination of the expected behavior factor (q-factor according to the part 1 of Eurocode 8 (CEN Eurocode 8, 2004), for existing buildings is of great importance from the engineering point of view. Indeed, as linear analysis are still the most used in various countries and well-known among practicing engineers, suggesting adequate values of q-factors would contribute for a more predictable seismic structural performance of existing building stock.
According to EC8-1, the q-factor is a “factor used for design purposes to reduce the forces obtained from a linear analysis, in order to account for the non-linear response of a structure, associated with the material, the structural system and the design procedures.” EC8-1 clear refers that q-factor is estimated approximately as “the ratio of the seismic forces that the structure would experience if its response was completely elastic with 5% viscous damping, to the seismic forces that may be used in the design, with a conventional elastic analysis model, still ensuring a satisfactory response of the structure.” The evaluation of the behavior factors for different types of masonry buildings have been carried out by different authors (e.g., Benedetti and Castoldi, 1982; Benedetti et al., 1984, 1998; Tomaževič and Weiss, 1994; Tomaževič, 1999; Tomaževič et al., 2004) performing static and dynamic experimental tests. Moreover, considering the probabilistic approach Thomos and Trezos (2005) have been derived the behavior factor for reinforced concrete structures. However, neither of these structures correspond completely to the structures under investigation. Indeed, a lot of variety exist in terms of material and structural elements and in principle q-factor should be defined for each typology.
In the presented casestudy, q-factor is estimated based on nonlinear static sensitivity analysis. After having defined the pushover curves (section Pushover Curves), DLis (explained in section Definition of Limit States) were defined on each pushover curve. Then Intensity measure for each damage level (IMDLis), in terms of the peak ground acceleration (IMDLis = ag,DLis), were computed (adopting the capacity spectrum method) for each pushover curve and each damage level, defined on such pushover curve (as demonstrated in Figure 10). Finally, after the definition of all these data, the q-factor was calculated following different criteria. It should be mentioned that, despite all values have been evaluated, only median, min and max values (obtained between the analyzed models) for q-factors are presented (Figure 12).
In the following, adopted criteria are briefly explained:
• Criterion 1: The typicalcriterion to evaluate the q-factor is defined according to Equation (1) and the response of the structure is represented by a pushover curve F-d (base shear vs. control displacement).
Fel,max is the ideal elastic base shear response and Fy corresponds to the strength of an ideal bi-linear system equivalent to the “true” nonlinear behavior. The bilinear system is defined considering (i) an equivalent initial stiffness defined following the suggestion of Bondarabadi (2018) and NTC (NTC Italian Code for Structural Design, 2008), as the secant stiffness in the first point of the seismic resistance curve attaining 60% (Fy,60%) and 70% (Fy,70%), respectively, of the maximum lateral strength. This was adopted with the aim to analyze how q-factor is influenced by the definition of Fy; (ii) the equal displacement rule (same du); and (iii) equal areas below idealized equivalent elastic-plastic relationship and the nonlinear pushover curve. With this equivalence criterion, the strength Fy is usually slightly lower than the maximum resistance Fmax (Figure 11) but can be considered an estimate of the ultimate base shear capacity of the structure. Fel,max is the maximum seismic base shear developed in a completely linear elastic structure.
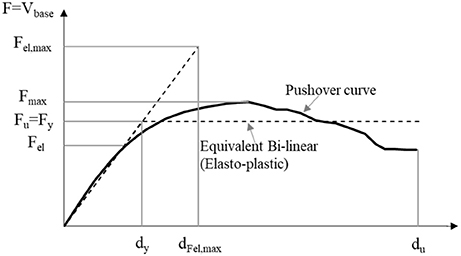
Figure 11. Parameters for the definition of the behavior factor q (F base shear, d displacement at a control point).
Nevertheless, the definition of the q-factor should then consider an overstrength ratio (OSR). The force Fel (Figure 11) represents the base shear at which the first structural element would reach its strength capacity (shear or flexural) according to a linear elastic analysis. Beyond this elastic limit, a restricted deformation capacity into the nonlinear regime is still available, sufficient to allow the structure to withstand an increasing seismic load, by increasing the forces on other structural elements (redistribution of seismic loads). Thus, ultimate strength capacity (Fmax or Fy for a bilinear idealization of the response) is reached for values of base shear that are higher than Fel. Then, a correct definition of q-factor would be then:
• Criterion 2: An alternative criterion to define q-factor consists of its identification with the ratio between the ground acceleration leading the structure to its ultimate limit state and the ground acceleration leading to the elastic limit. In the presented case study, the acceleration which correspond to the ultimate limit state is related to the value of DL4 (ag,DL4, explained in the section Definition of Limit States), whereas the value of DL2 is considered as the acceleration to the elastic limit (ag,DL2). The q-factor (qag) is calculated as it is presented in Equation 3:
It is worth noting that DL1 could also be considered for the definition of the elastic limit of the acceleration; indeed, it is more similar with the concept of the first element that attains the nonlinear behavior. Though, DL2 was adopted as will lead to q-factor values on the safe side. A discussion about this issue will be presented at the end of the section.
Figure 12 presents the values of the behavior factor for model A, obtained following the above- mentioned criteria. As can be observed, the values obtained for the examined type of buildings, in case of the X direction are smaller or in correspondence with the minimum value (depends on the criterion) proposed by NTC and EC8 (q = 1.5). On the other side, in case of the Y direction, q-factors values match well with the ones recommended by the seismic standards (q = 1.5–2.5). The values in X direction attained from different criteria are very close, opposite what was found in Y direction, particularly for Model A. Namely, as can be seen in Figure 12B), for Model A, in case of the Y direction it is clear a difference between the values obtained for q and qag. This difference is due to the fact that in the first criterion, the q-factor is calculated with the elastic force Fel,max (defined for an elastic stiffness), while the values of the q-factor for the second criterion correspond to the stage of the buildings DL4 where the side walls, the structural elements which mainly contributed for the global building's behavior in the Y direction, are damaged. In case of the Model B, the significant difference between these two criteria, does not appear, since that most of the walls have influence on the total base shear and damage is spread through all the walls, even in the stage of DL4.
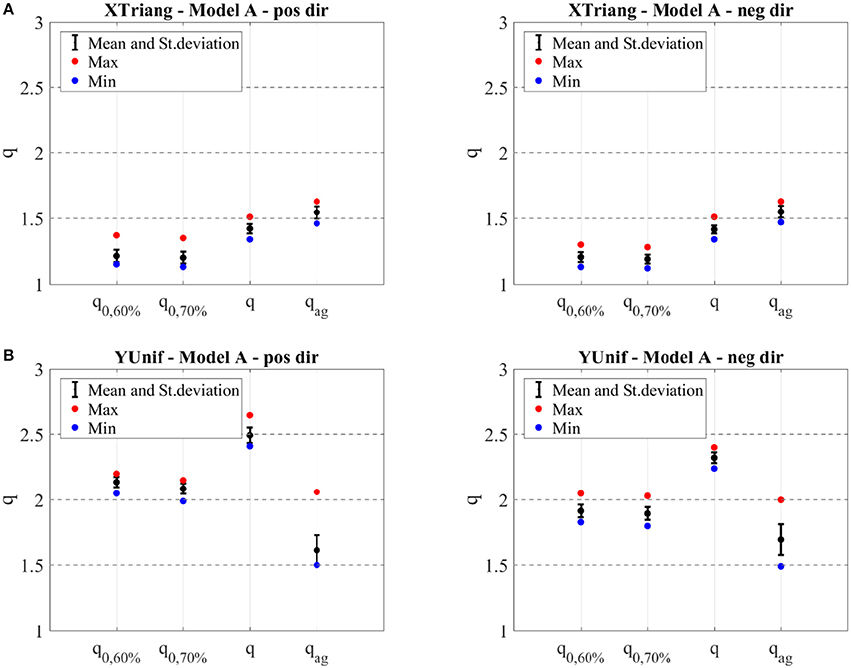
Figure 12. Mean, maximum and minimum values and standard deviation of the behavior factor for X (A) and Y direction (B) for Model A. Doted lines represent the values proposed by NTC Italian Code for Structural Design (2008).
From the results of Figure 12, it is shown that the values of the standard deviation of the behavior factor are greater in Y than in X direction, particularly in case of the second criterion. This is related to the different behavior of the models analyzed in the current study varying the mechanical parameters as abovementioned. In fact, the higher dispersion in terms of capacity was likewise obtained for Y direction (Milosevic et al., 2018b). The difference between the values calculated with Fy,60% and Fy,70% is irrelevant for these typology, as is depicted in Figure 12. Finally, regarding all presented conclusions, the values of the behavior factor proposed for the typology under investigation, considering the bad connections between walls are 1.5 and 2 for X and Y direction respectively.
As concern the Model B, the values of the behavior factor are presented in Figure 13. The values of q-factor in the X direction are in range with the values defined by Model A. This similarity was expected, since bad connections between walls in such direction are not considered. On the other side, the values in Y direction are different, showing the higher values of q-factor for Model A; this is mainly since Model B (good connections) has higher values of maximum strength (i.e., higher values of Fy), leading to smaller q-factor values. Concerning standard deviation values, higher values are obtained for Model A, as expected.
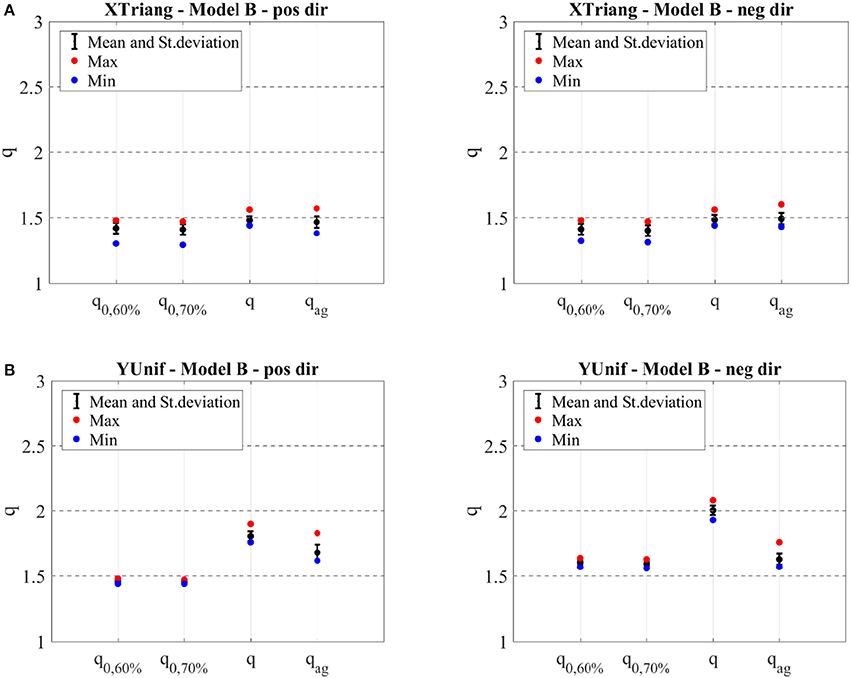
Figure 13. Mean, maximum and minimum values and standard deviation of the behavior factor for X (A) and Y direction (B) for Model B. Doted lines represent the values proposed by NTC Italian Code for Structural Design (2008).
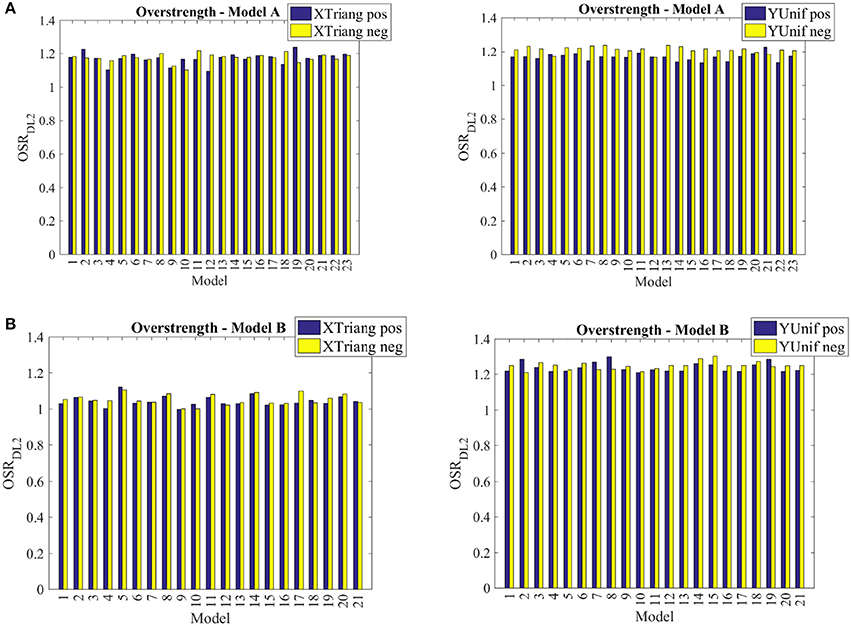
As it is considered as important parameter which influence the final definition of q-factor, overstrength (OSR) was calculated and the results presented for both models (A and B), and taken into account all the aleatory uncertainties. As known, the OSR depends on a series of factors varying from the structural configuration and associated redundancy to modeling assumptions (Magenes, 2006). In previous studies, OSR has been evaluated numerically (Magenes, 2004; Magenes and Morandi, 2006; Magenes and Menon, 2009), through nonlinear static analyses from nonlinear capacity curves, of several low-rise reinforced and unreinforced masonry buildings. Additionally, experimental evaluation of OSR have been also reported in the literature (Benedetti and Castoldi, 1982; Benedetti et al., 1984, 1998; Magenes and Menon, 2009).
In the current study OSR values were calculated numerically, for all models with good and bad connections for the most representative cases. As it can be noticed, the range of variation of the OSR is not significant (Figure 14): in case of the model with bad connections all values are around 1.2, whereas in case of the models with good connections, values are of 1 and 1.2 for X and Y direction respectively. It worth noting that typically, the unreinforced masonry structures are characterized by higher values of OSR (Magenes, 2006). However, the structures under study are mixed masonry-RC buildings and all reinforced elements are characterized for weak concrete and very low ratios of vertical and transversal steel reinforcement which can decrease, in average, the typical values of OSR in URM buildings (Magenes, 2006). Besides, it is clear that, for the typology under study, OSR does not depend on the variation of the mechanical parameters of the material for this typology.
Based on the results obtained, and according to all assumptions adopted, it is recommended to adopt an OSR = 1.2 for the mixed masonry-RC typology studied.
If DL1 was chosen to define the limit of the elastic behavior, higher values of OSR (OSRDL1) are reached. In Figure 15 the values of OSRDL1 are presented, as well as the ratio of OSRDL1 and OSRDL2. Based on these results, one can say that the OSR would increase of about 1.5 times if DL1 is adopted. Thus, this way, a value of about 1.8 would be recommended for OSR.
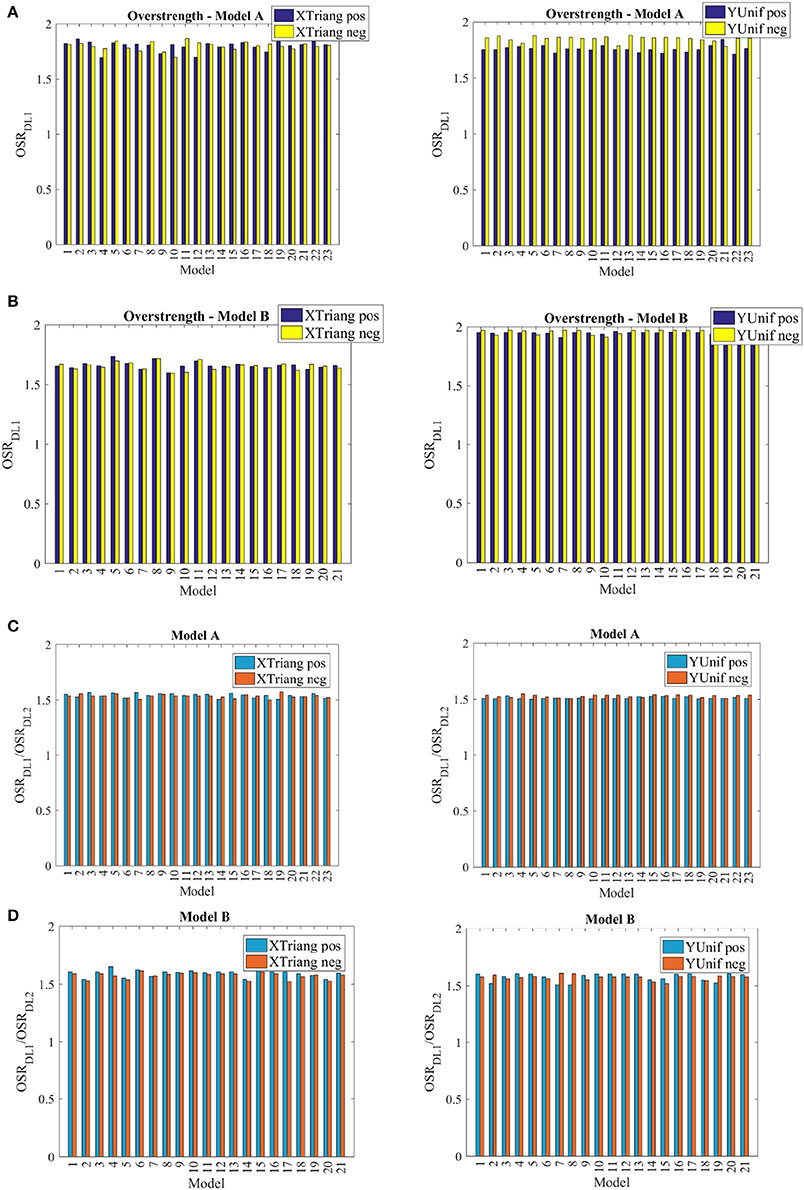
Figure 15. Overstrenght for X and Y direction for Model A (A) and Model B (B) adopting DL1 and ratio between the overstrength defined for DL1 and DL2 for X and Y direction in case of Model A (C) and Model B (D).
Conclusions
As well-known, each traditional building typology is unique and the need of an exhaustive understanding and knowledge on the materials of the building and structural details are crucial before performing any type of analysis. In addition, collecting accurate historical information, concerning the building construction chronology is also relevant. Due to this, the first step of the presented research was focused on the understanding the historical background of the typology under study, the mixed masonry-RC buildings existent in Lisbon. Afterwards, information about structural characterization of the buildings was collected and examined and the appropriate values of the mechanical parameters were defined. After collecting all important above-mentioned information seismic behavior of the buildings structures was assessed and the correspondent structural behavior factor defined.
Definition of adequate q-factors corresponds to an important step ahead in the seismic safety and preservation of our constructions, mainly as linear elastic methods are the ones most frequently used in engineering offices. Thus, in the presented paper, the q-factor was defined and values are proposed for the type of mixed masonry-RC building selected: the rectangular type shape mainly located in Cell I and II of “Alvalade” area in Lisbon. This configuration was chosen as it represents one of most representative of mixed buildings in Lisbon. Nevertheless, it is planned to evaluate q-factors to the other types, including all the “Rabo de Bacalhau” plan configurations.
The seismic behavior of the buildings was evaluated by using sensitivity nonlinear (pushover) static analysis, considering both aleatory and epistemic uncertainties, aiming to define, as accurate as possible, the q-factor values. In fact, the presented study indicates that values of structural behavior factor depend most on the type of connections between walls.
Behavior factor was defined considering two different criteria, as explained in section Structural Behavior Factor. Based on all results obtained and herein presented for rectangular shape of mixed masonry-RC buildings case study, one can recommend:
• a q-factor = 1.5 in the direction of façades (X direction) and equal to 2.0 in the direction of side-walls (Y direction);
• not to use the criterion 2 for the definition of q-factor of this type of buildings (this recommendation should be generalized for buildings with flexibles floors in plan but further studies are still required);
• a 1.2 for the OSR value in case when the DL2 is adopted.
It worth noting that the q-values and OSR herein suggested are in the range of the values proposed by EC8 and NTC. Though, if a different damage limit was chosen for the definition of the limit of elastic behavior (i.e., DL1 instead of DL2), the OSR would be of about 1.8. Lastly, it is recommended that the assessment of such factors, for a specific class and a particular structural building type should always be adequately evaluated.
Furthermore, it is worth to note in this work the conclusions are supported based on the results from nonlinear static analyses. However, additional confirmation may be derived by performing additional nonlinear dynamic analyses.
Author Contributions
JM, RB, and SC Contributed their research experience and knowledge to the seismic assessment of a mixed masonry-reinforced concrete structures with the final goal to define the structural behavior factor. It is a relevant work in the sense that linear analysis is still the most used procedure in the design engineering offices.
Funding
This work was supported by the Portuguese Foundation for Science and Technology (FCT) [SFRH/BD/102713/2014].
Conflict of Interest Statement
The authors declare that the research was conducted in the absence of any commercial or financial relationships that could be construed as a potential conflict of interest.
Footnotes
1. ^Available online at: http://cm-lisboa.pt/en (Consulted in 2015).
2. ^3Muri Program, S.T.A.DATA s.r.l., release 5.0.4.
References
Alegre, A., and Heitor, T. (2004). Flexibility in the first generation of reinforced concrete housing: a public housing estate in Lisbon. J. Constr. Hist. 20, 85–93. Available online at: https://www.jstor.org/stable/41613879
Benedetti, D., Benzoni, G. M., and Petrini, V. (1984) “Experimental evaluation of seismic provisions for stone masonry buildings,” in Proceedings 8th WCEE (San Francisco, CA).
Benedetti, D., and Castoldi, A. (1982). “Dynamic and static experimental analysis of stone masonry buildings,” in Proceedings of 7th ECEE (Athens).
Benedetti, D., Pezzoli, P., and Carydis, P. (1998). Shaking table tests on 24 simple masonry buildings. J. Earthq. Engin. Struct. Dyn. 27, 67–90. doi: 10.1002/(SICI)1096-9845(199801)27:1<67::AID-EQE719>3.0.CO;2-K
Bondarabadi, H. (2018). Analytical and Empirical Seismic Fragility Analysis of Irregular URM Buildings With Box Behavior. dissertation/Ph.D. Thesis, University of Minho (Minho).
Cattari, S., Lagomarsino, S., Bosiljkov, V., and D'Ayala, D. (2015a). Sensitivity analysis for setting up the investigation protocol and defining proper confidence factors for masonry buildings. J. Bull. Earthq. Eng. 13, 129–151. doi: 10.1007/s10518-014-9648-3
Cattari, S., Marino, S., and Lagomarsino, S. (2015b). “Seismic assessment of plan irregular masonry buildings with flexible diaphragms,” in Proceedings of the 10th Pacific Conference on Earthquake Engineering. Building an Earthquake-Resilient Pacific, (Sydney, NSW)
Cattari, S., and Lagomarsino, S. (2013a). “Masonry structures,” in Developments in the Field of Displacement Based Seismic Assessment, eds T. Sullivan and G. M. Calvi (Pavia: IUSS Press; Eucentre) 151–200.
Cattari, S., and Lagomarsino, S. (2013b). Seismic assessment of mixed masonry-reinforced concrete buildings by non-linear static analyses. J. Earthq. Struct. 4, 241–264, doi: 10.12989/eas.2013.4.3.241
CEN Eurocode 8 (2004). Design of Structures for Earthquake Resistance - Part 1: General Rules, Seismic Actions and Rules for Buildings (EC8-1). EN1998–1:2004, Comité Européen de Normalisation, (Brussels).
CEN Eurocode 8 (2005). Design of structures for earthquake resistance – Part 3: Assessment and retrofitting of buildings (EC8-3). EN1998-3:2005, Comité Européen de Normalisation, (Brussels).
Costa, J. (2005). Bairro De Alvalade: Um Paradigma No Urbanismo Português. Lisbon: Livros Horizonte.
ESRI (2014). Online Documentation of Geographic Information System, Arcgis (Arcmap and Arccatalog). Redlands, CA: EUA; ESRI. Available online at: http://esri.com/
Fernandez, P. (1943). Memória Descritiva Do Edifício N° 3 Da Praça João Do Rio, Arquivo Municipal De Lisboa - Obra 4553-Proc 26322-Dag-Pg-1943. Folha 8, Lisboa.
ICOMOS/ISCARSAH Committee (2003). Recommendations for the Analysis, Conservation and Structural Restoration of Architectural Heritage. ICOMOS International Committee for Analysis and Restoration of Structures of Architectural Heritage.
Lagomarsino, S., and Cattari, S. (2014). “Fragility functions of masonry buildings,” in SYNER-G: Typology Definition and Fragility Functions for Physical Elements at Seismic Risk: Elements at Seismic Risk, Geotechnical, Geological and Earthquake Engineering 27, eds K. Pitilakis, H. Crowley, and A. M. Kaynia (Dordrecht: Springer Science+Business Media), 111–156.
Lagomarsino, S., and Cattari, S. (2015). “Seismic performance of historical masonry structures through pushover and nonlinear dynamic analyses,” in Perspectives on European Earthquake Engineering and Seismology. Geotechnical, Geological and Earthquake Engineering, Vol. 39, ed A. Ansal (Cham: Springer), 455.
Lagomarsino, S., Penna, A., Galasco, A., and Cattari, S. (2013). TREMURI program: an equivalent frame model for the nonlinear seismic analysis of masonry buildings. J. Eng. Struct. 56, 1787–1799. doi: 10.1016/j.engstruct.2013.08.002
Magenes, G. (2004). Prospects for the Revision of the National Seismic Code With Regard to Masonry Constructions. Isola Vicentina: Assemblea ANDIL, sezione Murature (in Italian).
Magenes, G. (2006). “Masonry building design in seismic areas: recent experiences and prospects from a European standpoint,” in Proceedings of the 1st European Conference on Earthquake Engineering and Seismology (a joint event of the 13th ECEE and 30th General Assembly of the ESC) (Geneva).
Magenes, G., and Menon, A. (2009). A review of the current status of seismic design and assessment of masonry buildings in Europe. J. Struct. Eng. SERC Madras 35, 247–256.
Magenes, G., and Morandi, P. (2006). National and European Masonry Codes: Eurocode 8 and Evolution of the OPCM 3274. EUCENTRE Report, Pavia (in Italian).
Marino, S., Cattari, S., and Lagomarsino, S. (2018). “Use of non-linear static procedures for irregular URM buildings in literature and codes,” in Proceedings of the 16th European Conference on Earthquake Engineering (Thessaloniki).
Milosevic, J., Cattari, S., and Bento, R. (2018a). Sensitivity analyses of seismic performance of ancient mixed masonry-RC buildings in Lisbon. J. Masonry Res. Innov. 3, 108–154. doi: 10.1504/IJMRI.2018.092459
Milosevic, J., Bento, R., and Cattari, S. (2018b). Definition of fragility curves through nonlinear static analyses: procedure and application to a mixed masonry-RC building stock. J. Eng. Struct.
NTC Italian Code for Structural Design (2008). (Norme Tecniche per le Costruzioni – NTC) D.M. 14/1/2008. Official Bulletin N° 29 of February 4, (In Italian).
RRCS (1935). Regulamento De Estruturas De Betão Armado – Dec. 25948, Incm, 16 De Outubro De 1935, Lisbon, Portuguese Standard.
Senaldi, I., Magenes, G., Penna, A., Galasco, A., and Rota, M. (2014). The effect of stiffened floor and roof diaphragms on the experimental seismic response of a full-scale unreinforced stone masonry building. J. Earthq. Eng. 18:407–443. doi: 10.1080/13632469.2013.876946
Thomos, G. C., and Trezos, C. G. (2005). Behaviour factor of RC structures: a Probabilistic Approach, Earthquake Resistant Engineering Structures. WIT Press W IT Transactions on The Built Environment. Vol. 81, Available online at: www.witpress.com, ISSN 1743-3509 (on-line).
TomaŽevič, M. (1999). Earthquake -resistant design of masonry buildings, Series on Innovation in Structures and Construction, Vol. 1, (London: Imperial College Press).
Tomaževič, M., Bosiljkov, V., and Weiss, P. (2004). “Structural behavior factor for masonry structures,” in Proceedings of the 13th World Conference on Earthquake Engineering, Paper no. 2642 (Vancouver, BC).
Keywords: seismic behavior, mixed masonry-RC buildings, practical assessment, uncertainties, nonlinear static analyses, behavior factor
Citation: Milosevic J, Bento R and Cattari S (2018) Seismic Behavior of Lisbon Mixed Masonry-RC Buildings With Historical Value: A Contribution for the Practical Assessment. Front. Built Environ. 4:43. doi: 10.3389/fbuil.2018.00043
Received: 03 June 2018; Accepted: 23 July 2018;
Published: 08 August 2018.
Edited by:
Oren Lavan, Technion–Israel Institute of Technology, IsraelReviewed by:
Alessia Monaco, Dipartimento di Ingegneria Civile, Ambientale, Aerospaziale, dei Materiali, Università degli Studi di Palermo, ItalyLuigi Di Sarno, University of Sannio, Italy
Copyright © 2018 Milosevic, Bento and Cattari. This is an open-access article distributed under the terms of the Creative Commons Attribution License (CC BY). The use, distribution or reproduction in other forums is permitted, provided the original author(s) and the copyright owner(s) are credited and that the original publication in this journal is cited, in accordance with accepted academic practice. No use, distribution or reproduction is permitted which does not comply with these terms.
*Correspondence: Rita Bento, cml0YS5iZW50b0B0ZWNuaWNvLnVsaXNib2EucHQ=
 Jelena Milosevic1
 Rita Bento