 Mohammad Zaher Serdar
 Sami G. Al-Ghamdi
- 1Division of Sustainable Development, College of Science and Engineering, Hamad Bin Khalifa University, Doha, Qatar
- 2Environmental Science and Engineering Program, Biological and Environmental Science and Engineering Division, King Abdullah University of Science and Technology (KAUST), Thuwal, Saudi Arabia
- 3KAUST Climate and Livability Initiative, King Abdullah University of Science and Technology (KAUST), Thuwal, Saudi Arabia
This research presents a novel framework that employs the resilience index and metrics, building on previous studies, to conduct a sequential evaluation of flooded road network performance at each timestep throughout the recovery stage. Subsequently, the mathematical integration of the performance-time diagram produces the Recovery Resilience Index (RRI) used to evaluate any recovery strategy/sequence. Furthermore, a sensitivity analysis ensures the consistency of the results. As a case study, this research evaluated three post-flood interventions: Flood-susceptibility-based; Centrality-based; and Critical-links-first recovery strategies, within the context of the FIFA World Cup in Qatar, 2018. The results showed that the best strategy to be dealing with the critical-links-first and flood-susceptibility strategy to be the worst. The suggested framework will expand the options for recovery planning and resource allocation. Also, it will provide the policymakers with a recommendation to improve the recovery process during FIFA World Cup in Qatar, 2018 and any future mega event.
1 Introduction and background
Cities and urban areas are continuously growing and expanding, and likewise, their supporting critical infrastructures. These urban infrastructures act as indispensable lifelines that are not only necessary for the livability in the urban areas but also a defining factor for their growth, thriving, and even the unique character of each city (Neuman, 2020). Currently, infrastructures are increasingly facing more challenges to keep up with the growth in the urban population and to withstand the climate change impacts (Serdar et al., 2021). Such challenges introduced unprecedented disturbances that execrated their impacts in terms of both economic and human losses (Duy et al., 2019; Ilbeigi, 2019; Tahir et al., 2021; Serdar et al., 2022c). These losses motivated to expand the design philosophy beyond the current limits of accommodating certain volumes of load (whether it is m3 of water, kWh of electricity, or the number of vehicles passing from one place to another) (Serdar and Al-Ghamdi, 2021a). The emerging philosophy focuses on the system’s ability to sustain a disturbance, the level of performance during such disturbance, and its recoverability process (Linkov and Palma-Oliveira, 2017). These different aspects of infrastructure performance during disturbances are referred to as resilience.
1.1 Resilience definitions and aspects
There are many definitions revolving around the concept of resilience suggested in the literature. This variation stems from various reasons, such as the variation in the nature of the disturbances, the nature of the investigated system, or sometimes a reflection of the used metric or stage of interest (Faturechi and Miller-Hooks, 2015; Hosseini et al., 2016; Serdar et al., 2022b). Moreover, in many cases, resilience is reflected through a combination of qualities that can describe a system, such as vulnerability and robustness, among several others (Faturechi and Miller-Hooks, 2015; Al-Humaiqani and Al-Ghamdi, 2022; Serdar et al., 2022b). Overall, resilience could be defined as the capacity of the system to withstand a disturbance (reflecting low vulnerability), maintain an acceptable level of service (reflecting robustness and survivability), and recover in a timely manner (reflecting rabidity and recoverability) (Faturechi and Miller-Hooks, 2015; Hosseini et al., 2016; Al-Humaiqani and Al-Ghamdi, 2022; Serdar et al., 2022b). Moreover, other system qualities could improve its resilience include reflectivity, to leverage the expertise acquired in previous events, resourcefulness, to determine the availability of recovery resources and alternatives, and flexibility, enable development and adjustments to the system (Hosseini et al., 2016; Al-Humaiqani and Al-Ghamdi, 2022; Serdar et al., 2022b).
During the resilience assessment, there are two important stages one related to the system’s ability to sustain the damage, and the other one is its recovery (Goldbeck et al., 2019; Liu and Song, 2020; Serdar and Al-Ghamdi, 2021b; Butry et al., 2021). Both aspects are interrelated, as a less damaged system will require fewer recovery resources; however, there are some fundamental differences. Among the differences is the concept of resilience by design versus resilience by intervention, with the former being determined by the design of the system and its nature as an inherent property, which is mostly translated into system resistance to degradation under certain disturbances. On the other hand, resilience by intervention is reflected by the group of processes, actions, and steps taken upon the onset of the disturbance, which is mostly reflected in the recovery stage (Kott et al., 2021). Within the context of urban infrastructures, resilience by design presents an important inherent property but one that is costly to change, as most of such networks were developed over a long span of time and may require huge investments to accommodate their upgrade cost and the damage resulting from their limited capacity or availability during the process. Meanwhile, there is huge potential for resilience by intervention, which through various possible approaches, can lead to reducing the recovery time and costs and thus significantly improve the resilience of the systems (Liu and Song, 2020; Kott et al., 2021). Emphasizing the importance of recovery approaches, many researchers have investigated its role in improving system performance and resilience of various built environment systems, including water, energy, and transportation, among others, as presented in (Liu and Song, 2020), leveraging resilience qualities enhancements (Sharkey et al., 2021), or within the framework of humanitarian operations as in (Çelik, 2016).
1.2 Transportation networks resilience and floods
Among all infrastructures, the transportation networks play a central role in the recovery process of other networks as they facilitate the accessibility of recovery teams for all other infrastructure; thus, their recovery and resilience are essential for the effective recovery of other networks and the overall resilience of the city (Bešinović, 2020; Liu and Song, 2020; Bešinović et al., 2022; Serdar et al., 2022b). Urban transportation networks are exposed to several disturbances, such as natural hazards, intentional attacks, random failures, cyber-attacks, and even failure propagation from other networks (Serdar et al., 2022b). However, natural hazards present the main threat to transportation networks, as they impact large parts of the networks and can significantly restrict mobility, thus affecting network performance. For example, the loss of important connections, such as a bridge, due to an earthquake can excessively impact the network (Twumasi-Boakye and Sobanjo, 2021; Twumasi-Boakye and Sobanjo, 2018). Moreover, a flood can impact a large portion of the network and jeopardize its connectivity inflecting massive cost and performance reduction, as in Hurricane Sandy in 2012 (USA) and Pakistan floods in 2022 (Abramson and Redlener, 2012; Bhamani, 2022). Among all natural hazards, floods prevail as the largest in terms of disaster cost and annual occurrence rate (UNDRR, 2020). These reasons necessitate allocating additional attention to flood resilience and especially to the interventional aspect of resilience, which is related to recovery strategies. To expand on the literature on flood resilience of transportation networks, readers can refer to (Rebally et al., 2021; Watson and Ahn, 2022).
Flood recovery is a complicated process one which various stakeholders are engaged on multiple levels (Medd et al., 2015). Some studies observed the recovery practices and documented the day-to-day recovery efforts in the aftermath of a flood helping to shed light on the physical and social aspects of the recovery (Medd et al., 2015). Others focused on funding the recovery process by comparing the strategies of different nations and responses (Slavíková et al., 2020) and even different social classes in the same country (Wilson et al., 2021). Recovery strategies play a major role in improving the resilience of the networks, with the effectiveness of different strategies could be attributed to both the cost and recovery sequence (Henry and Emmanuel Ramirez-Marquez, 2012; Saadat, 2021). The cost of a recovery strategy can be reflected through the sum of the cost of lost income (or services) and the cost of repairing resources and efforts (Saadat, 2021). While focusing on the post-disasters phase, simulation-based approaches help to compare different recovery strategies, which is the aim of this research. Based on the results of different recovery sequences and strategies, the decision-makers can approve an informed decision that enhances the system’s resilience in light of the available resources, presenting a direct example of resilience-by-intervention (Nurre et al., 2012; Almoghathawi et al., 2019; Bešinović et al., 2022). However, these studies focused on the resilience of the transportation networks to floods during normal working conditions outside the strain caused by MSE. Despite the importance of MSE, represented by the associated cost both in terms of finance and reputation, and the strict conditions to ensure the successful hosting of such events, the resilience to flooding during MSE remains an under-investigated topic, and moreover the role of recovery strategies in enhancing the performance and resilience under such conditions, which this paper tries to address.
Qatar’s capital, Doha, presents a unique case as one of the fastest-growing cities, increasing its size 60 times over the past 50 years (Rizzo, 2013). Moreover, Doha is the host city for the FIFA World Cup Qatar 2022, delivering the most compact version of this event, with almost all the venues located in its metropolitan area at an astronomical price tag of $200 billion (Griffin, 2019; Meza Talavera et al., 2019). This high cost was essential to overhaul and modernize the infrastructures in Doha and develop the competition venues to accommodate the event and facilitate spectators attending multiple matches a day. However, over the last decade Doha, situated in a hyper-arid climate, witnessed unusual precipitation and flooding events, especially in 2015 and 2018, which caused large disruption to mobility throughout the city and obstructed activities at several important venues, such as Education City, in addition to catastrophic asset and property losses (Mamoon, 2017; Ajjur and Al-Ghamdi, 2022; Serdar et al., 2022a). Moreover, this trend of extreme precipitations is projected to increase over the coming years (Mamoon, 2017; Ajjur and Al-Ghamdi, 2022). However, no official data shows the cost or damage extent of previous events, other than some press reports or photos posted online by individuals (Middle East Eye, 2018; Qatar, 2018; Muraikhi and Al-Shafi, 2022; Flood List, 2023). Such intense precipitations during the World Cup, which exceed the design capacity, could cause huge losses in terms of direct cost and reputational damage to the small nation, jeopardizing the huge investments and effort put forward for the event’s success.
1.3 Aim and scope of the study
The advent of climate change impacts, particularly flooding, puts the huge investments needed for hosting a successful Mega-Sport event (MSE) at a perplexing risk and necessitates the resilience of critical infrastructure, especially road networks. For example, as presented in previous research (Serdar and Al-Ghamdi, 2021b), the road network, which is planned to be the main facilitator of the fans’ mobility during the FIFA World Cup in Qatar 2022, has a very limited resilience level under the threat of natural hazards scenario, presented by flooding. This lack of resilience threatens the success of the competition and requires investigating various possible recovery strategies to determine the most effective one. Moreover, while inherent resilience introduced during the design stage can increase the cost significantly to be adapted to changes in climate and result in a white-elephant network, the adoption of an effective recovery-strategy and informed use of recovery-resources could substantially improve the post-disaster circumstances and improve the overall performance and resilience of the system at a fraction of the cost. Thus, quantifying the impacts of different interventions/recovery-strategies on the resilience of road networks under floods during MSE is highly important, yet it is an under-investigated topic (Meza Talavera et al., 2019; Serdar et al., 2021; Orr et al., 2022). (Meza Talavera et al., 2019) conducted a review on the role of MSE in sustainable development and noted the potential challenges posed by climate change to such events, while (Orr et al., 2022) review totally focused on climate change hazards on sports competitions and events, highlighting coping approaches and potential risks at several levels including individual and city levels. Both reviews, in addition to (Serdar et al., 2021), noted the lack of literature focusing on resilience during MSE and compared the importance of preparedness and recovery planning to address such impacts, including flooding and quantifying the performance to better manage MSE and their legacy. (Serdar et al., 2022b). assessed the flood resilience of the road network during the FIFA World Cup Qatar 2022 but ignored the role of the recovery stage in enhancing the overall resilience of the network, which is the central focus of the current research. Thus, this study aims to present a simple and robust approach to assess the role of recovery strategies to improve the resilience of the road networks during MSE. Moreover, this research:
• Presents a framework that spans the life cycle of disaster, identifies the critical disturbance, and highlights the role of recovery strategies in enhancing the resilience of MSEs.
• Facilitates the development of different recovery sequences based on several strategies.
• Investigates the effectiveness of using flood susceptibility to guide the recovery process compared to other strategies from a resilience perspective.
• Assesses the impacts of several recovery strategies on the resilience of a flooded road network during an MSE, building on the results and metrics of previous studies.
The study uses the FIFA World Cup Qatar 2022 as a case study building on a previous assessment of different potential critical disturbances, which identified the flooding as the critical disturbance and evaluates the effectiveness of several recovery strategies in enhancing resilience within that context. These recovery strategies rely on flood susceptibility, network centrality, or critical paths, as will be explained later in the methodology section. Also, it is important to consider that the aim is to compare different recovery strategies rather than finding the optimal recovery sequence. Furthermore, a sensitivity analysis is conducted to verify the consistency of the assessment results under different weighting factors. Subsequently, the results will guide response teams during flooding and help pre-locate the required resources accordingly. The rest of the manuscript is divided into methodology, results and discussion, and conclusion.
2 Methodology
The suggested method for this research starts by conducting the initial resilience assessment, as presented in (Serdar and Al-Ghamdi, 2021b), to identify the disturbance scenario that causes the maximum degradation in the network performance, which was denoted as the critical disturbance; nevertheless, we can use this method to plan the recovery of any disturbance scenario. Based on the disturbance nature, network characteristics, and public authorities’ recovery resources and goals, several assumptions that control and outline the recovery stage will be drafted, which will form the basis for the development of different recovery strategies. Each recovery strategy will be translated into a recovery sequence that satisfies the process assumptions and timeline. At each time step of the recovery, the metrics identified in (Serdar and Al-Ghamdi, 2021b), total betweenness [using Gephi (Bastian et al., 2009)] and average trip duration will be calculated, and this process will be repeated for each recovery strategy. Using the performance results, we will calculate the Recovery Resilience Index (RRI) for each recovery strategy. Finally, we will conduct a sensitivity analysis for weighting factors to ensure the consistency of the results and identify the optimal recovery strategy. The following subsection will expand on the aforementioned steps and clarify their application, and the general outline of the method is presented in Figure 1.
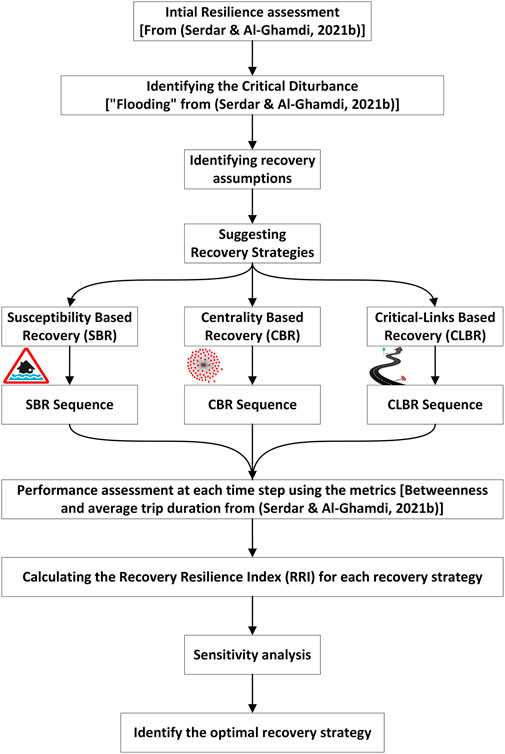
FIGURE 1. Resilience-Oriented recovery framework and the general outline of the methodology. Square brackets refer to the source or application in our case study.
2.1 Identifying flooding as the critical disturbance during the initial resilience assessment
The initial resilience assessment relied on the impacts caused to the network due to several disturbances, namely, natural hazard/flooding, an intentional attack, and random accidents, which was previously conducted by (Serdar and Al-Ghamdi, 2021b), the general framework of that assessment is presented in Figure 2. The flooding scenario relied on flooding maps developed by the Ministry of Municipalities and Environment (MME) for the 100-Years Average Recurrence Interval (ARI) scenario, representing an extreme precipitation event (MME, 2018), with road segments covered by high hazard level, inundation depth of 61–120 cm, to be considered inaccessible. The intentional attack scenario was represented by an attack targeting the central node, the node with the highest betweenness, creating an inaccessible area of 3 km radius, while the random accidents scenario created ten randomly scattered failure points each with an inaccessible radius of (500) m. The three scenarios were simulated and resulted in calculating Mega Sport Events Road Resilience Index (MSERRI) for each case, as presented in Table 1, which shows an extremely low performance of the network during the 100ARI flood scenario, thus denoted as the critical disturbance. The output of the critical disturbance scenario, 100 ARI flooding, is presented in Figure 3. Figure 3 highlights fragmentation and severe degradation in the road network under the natural hazards scenario represented by flooding. The flooding caused the maximum damage by far compared to other scenarios and thus was denoted the critical scenario. In this research, we will focus on the identification of the optimum recovery strategy, using the same performance metrics from (Serdar and Al-Ghamdi, 2021b), from the damage caused by the considered flooding scenario of 100 ARI. However, the same method could be applied to the recovery from other scenarios and for other networks by changing the recovery assumption and strategies to suit the application.
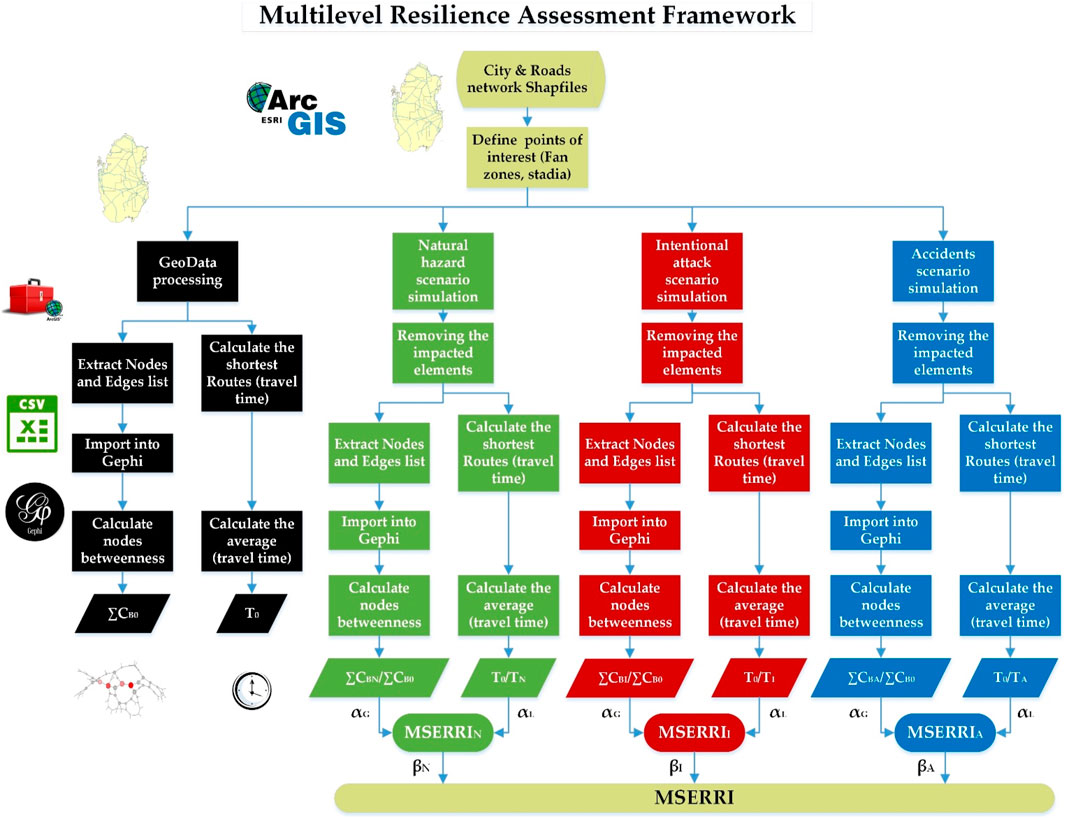
FIGURE 2. Multilevel resilience assessment framework developed for MSEs.
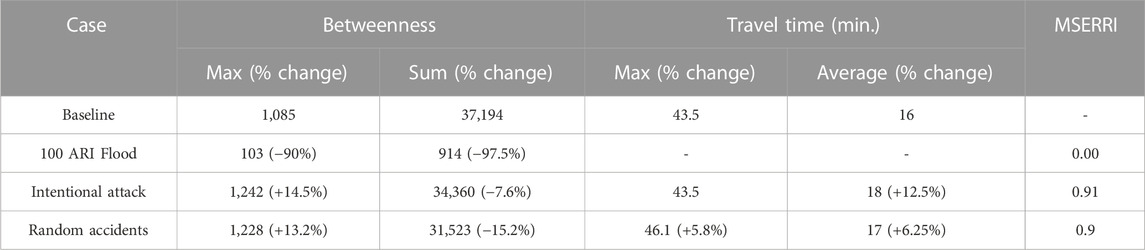
TABLE 1. Doha Road network initial assessment results and resilience index. Adopted from (Serdar and Al-Ghamdi, 2021b).
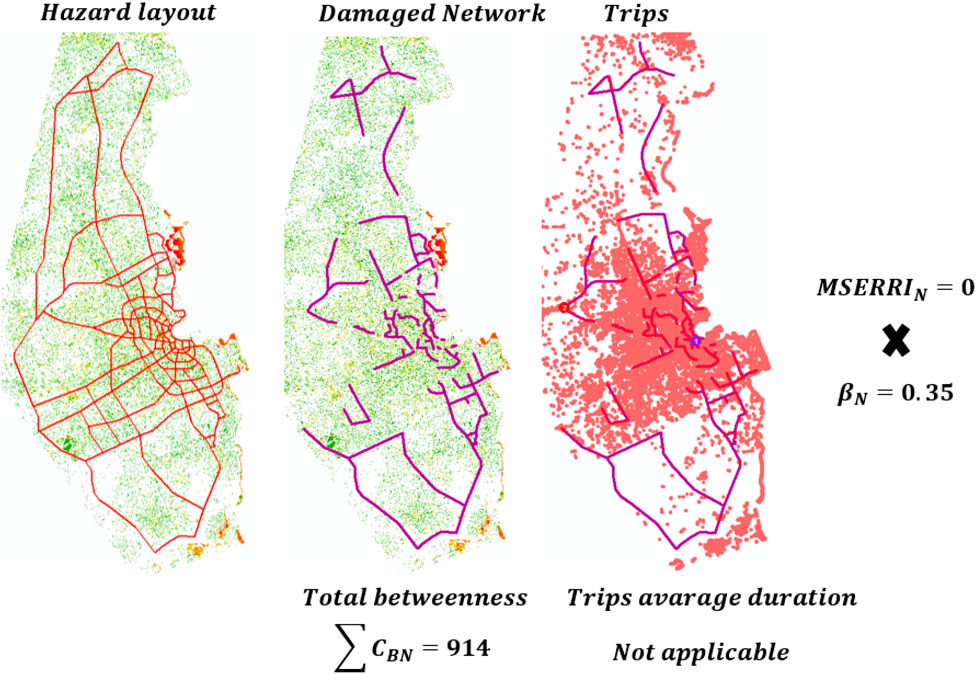
FIGURE 3. Flooding scenario and its impact on Doha roads network. Under the Natural hazard scenario, the sum of betweenness centrality has dropped by almost 97.5%, and the important trips could not be completed due to the extensive damage to the network. Due to the failure of the damaged network to facilitate the trips, its resilience index during this scenario was equal to zero: MSERRIN = 0. Adopted from (Serdar and Al-Ghamdi, 2021b).
Several resilience metrics are reported in the literature, with the choice of suitable resilience metric is related to the context, aim, and scale of the assessment (Liu and Song, 2020; Sun et al., 2020; Serdar et al., 2022b; Büyüközkan et al., 2022). However, in this study, we are concerned with measuring the performance and, subsequently the resilience, at two levels, one is at the overall network level, and the other is related to the trips between MSE venues. For this purpose, there are two performance metrics reported in (Serdar and Al-Ghamdi, 2021b) and adopted in this study; these metrics are total network betweenness centrality (
2.2 Recovery process assumptions
The recovery process is complex and requires clear outlining to reflect reality and produce a reliable recommendation. Moreover, the recovery process depends on the nature of the disturbance, available resources, precautions and pre-deployed preparation, and authority plans and goals; as such, a recovery from an intentional attack will be totally different from a natural hazard, and even in the case of an intentional attack there will be a difference when dealing with physical threat compared to the case in the cyber domain. In the case of natural hazards, especially flooding, several precautions and support system could be available, ranging from city-wide storm management sewer systems to on-site pumping and storing ponds or tanks, in addition to mobile resources that act as intervention resources to apply the recovery strategies set by the disaster management authorities.
In our case, the public works authority (Ashghal), which is tasked with flood hazards mitigation and management in Qatar, is managing a large spectrum of assets, including roads, sewers, and storm drainage networks. Moreover, it employs many on-site emergency assets, such as fixed and mobile pumps and trucks, all aimed to intervene in the case of flooding, as it emerged as an unusual costly threat over the past decade. All these assets serve in Ashghal plan to achieve full recovery of the network within 24 h from the beginning of the recovery process, as mentioned in Ashghal design guides and stated by several of their design and operation managers (Public Works Authority - Drainage Affairs, 2005). Based on the design guide and interviews with the managers, the stormwater management system will drain the flooding water throughout the network. Additionally, recovery intervention teams will contribute to speeding up the process and achieving the goal of full recovery, in the form of regaining mobility, within 24 h. This intervention will be mainly directed to the areas with high and extreme inundation and risk levels, identified in the flood hazard map developed by MME (MME, 2018) and used in (Serdar and Al-Ghamdi, 2021b) to identify the damaged parts of the network, as presented in Figure 3. Based on this information, it could be assumed that the recovery resources will be allocated to the inaccessible segments of the networks, identified by the high and extreme hazards level, and these recovery resources will be enough to complete the restoration of the accessibility on these sections within 24 h regardless on the location and resources needed.
By using the model from (Serdar and Al-Ghamdi, 2021b) presented in Figure 3, we can calculate the length of the damaged/inaccessible segments (
Furthermore, another important assumption is reflected in the “localized smart recovery/shortest-local-first strategy”; it is assumed that the recovery teams, at any given node/intersection, will try to recover the shortest segment connected to it first, thus maximizing the number of recovered sections at any given time step. Additionally, as a starting value, the weighting factors will be assumed to be distributed equally (0.5 total betweenness and 0.5 average trip time); however, these weighting factors will be subjected to sensitivity analysis to verify the consistency of the results.
2.3 The suggested recovery strategies and sequences development
Based on the disturbance scenarios and the established assumptions, a suitable recovery alternative needs to be developed. This study suggests three recovery strategies that are expected to have a unique benefit to the network. These strategies were proposed and developed by the authors. For example, some sources in the literature mentioned that susceptibility mapping could be used to lead recovery planning or efforts without any details about how it could be employed for that purpose, so the authors have to come up with a way to convert the susceptibility into normalized recovery sequence as presented in the paper, as in the case of Link Averaged Flood Susceptibility (LAFS).
The first recovery strategy is related to road flood susceptibility; this method relies on the averaged link susceptibility to the flooding threat, based on the mapping done by (Serdar et al., 2022a) and presented in Figure 4. The calculation of the Link Averaged Flood Susceptibility (LAFS) is done using Eq. 1, as follows:
Where:
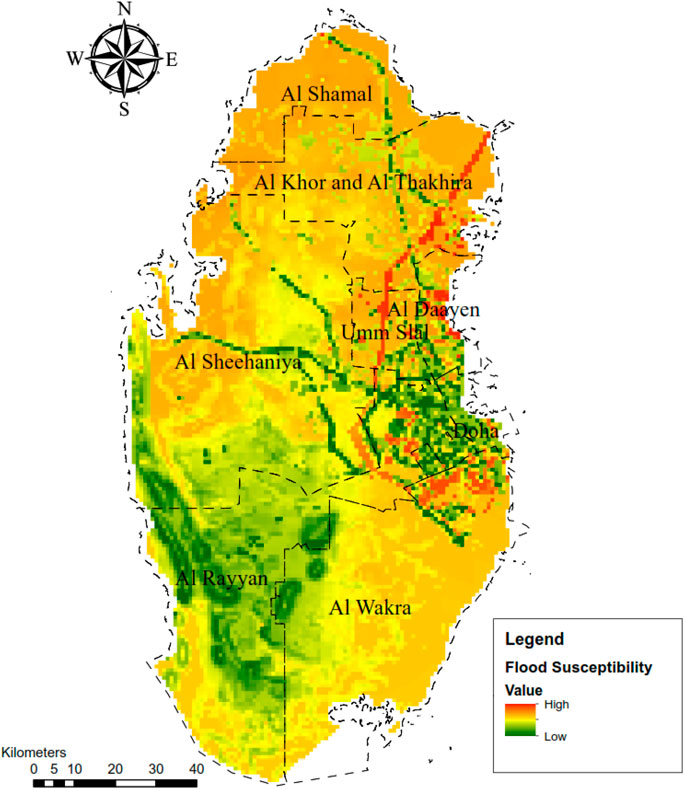
FIGURE 4. Flood susceptibility map for the state of Qatar. Adopted from (Serdar et al., 2022a).
These ascending weights would facilitate ranking the links/roads based on their flood susceptibility and then developing the recovery sequence starting with the highest flood susceptibility.
The following example, presented in Figure 5, will facilitate the understanding of the calculation of LAFS and the development of the recovery sequence associated with flood susceptibility:
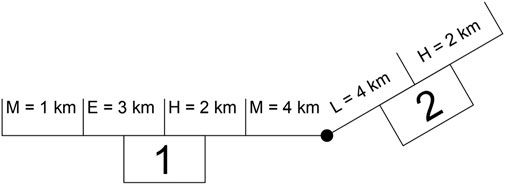
FIGURE 5. LAFS calculation and sequencing example.
Based on the calculation of LAFS, we can establish that (link 1) is more susceptible to flood and thus will be recovered first. This approach can be repurposed to be employed in other sectors other than flood susceptibility by using the suitable layer associated with a problem of concern, such as student evacuation during a totally different disturbance scenario; however, in the current application, it was denoted as Susceptibility Based Recovery (SBR).
The second recovery strategy relies on network nodes’ centrality using the betweenness results obtained in the model developed in (Serdar and Al-Ghamdi, 2021b). Contrary to the first one, this strategy focuses on network nodes instead of links. Under this strategy, the recovery is aimed to restore the links connected with nodes with the highest betweenness values, under normal conditions, first and then in a descending manner, with the application of the “localized smart recovery” to restore the shortest link first among the links connected to the same node. This strategy is denoted as Centrality-Based Recovery (CBR). The following example, presented in Figure 6, will facilitate the understanding of the second recovery strategy and the development of the recovery sequence associated with node centrality:
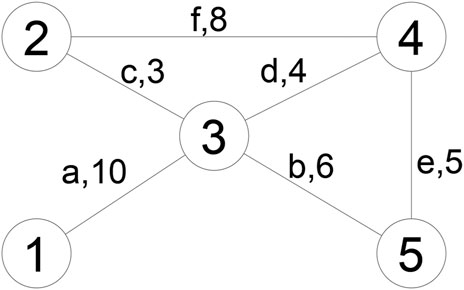
FIGURE 6. Centrality-based recovery example. This presents a sample network with its nodes connected prior to disturbance used to calculate the nodes’ betweenness. a, b, c, d, e, and f are links annotations, and the numbers after (,) are the associated required recovery length of each link in km.
By calculating the betweenness centrality for the nodes in the sample network presented in Figure 6, we can find that node (3) is the highest betweenness with a value equal to (3.5), and the next will be node (4), with rest of the node having betweenness value equal to (0). Considering these values and the recovery length of each of the links are as provided in Figure 6, and assuming that 13 km will be restored at each time step, the resulting recovery sequence will be as demonstrated in Table 2.

TABLE 2. Centrality-based recovery sequencing example.
The third recovery strategy was based on recovering the critical trips paths, related to the competition or the considered event, starting from the shortest segments first, and after restoring these paths, the rest of the links in the network will be restored starting from the shortest damaged segments, this strategy was denoted as Critical Links Based Recovery (CLBR). Using this mentality, the associated sequence was developed and prepared for application on the model.
Various other recovery sequences could be developed based on any justifiable or suitable strategy and thus can be integrated into the assessment to find the most suitable one, which can be done in future studies.
2.4 Recovery resilience index and sensitivity analysis
During the application of the recovery sequences on the model, we will get the total betweenness
Where:
Using the diagram of performance against time, presented in Figure 7, the Recovery Resilience Index (RRI) can be calculated using Eq. 3, as follows:
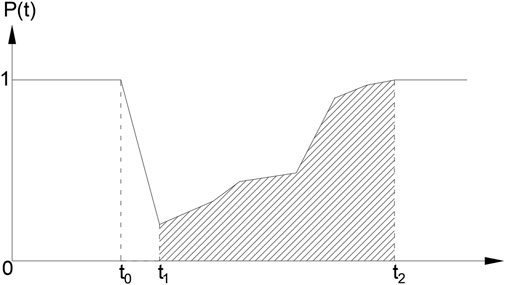
FIGURE 7. An example of the Performance-time diagram. P(t) is the performance at moment t. t0, t1, and t2 are the start of the event, the start of the recovery, and the end of the planned recovery process, respectively.
It is important to notice that during the calculation of RRI, represented by the hatched area (area under the curve during the recovery phase), only the recovery phase is of concern since the recovery strategy used has no impact on the degradation of the performance prior to the recovery phase.
After calculating the performance-time diagram and RRI for each recovery strategy, a sensitivity analysis will be conducted to verify the impact of weighting factors,
3 Results and discussion
The main result of applying the methodology presented in the previous section is identifying the best recovery strategy among the suggested strategies. However, leading to that result, the performance metrics, total betweenness and average trip time, are calculated at each time step for each strategy, assuming equal weighting. Furthermore, the RRI for each recovery strategy will be calculated and later subjected to sensitivity analysis for the weighting factors to verify the results’ consistency and pave the way for identifying the best recovery strategy. The following paragraphs will present the results of these steps.
Using the sequences developed for each recovery strategy, the performance metrics were calculated at each time step and are presented in Figure 8 and Table 3.
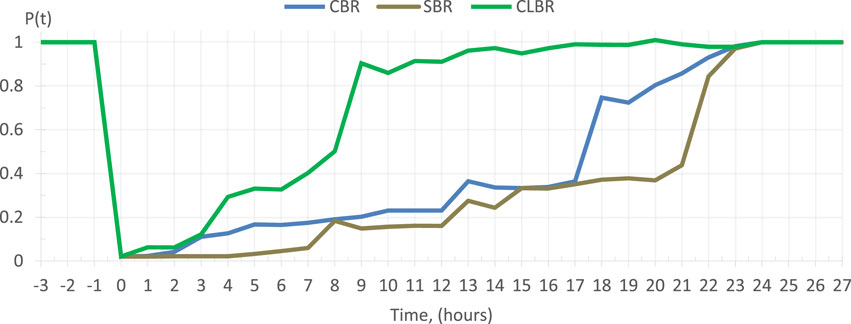
FIGURE 8. Performance-Time diagram of the recovery strategies. As mentioned in previous sections, CBR Centrality Based Recovery, SBR Susceptibility Based Recovery and, CLBR Critical Links Based Recovery. The presented values reflect equal weighting,
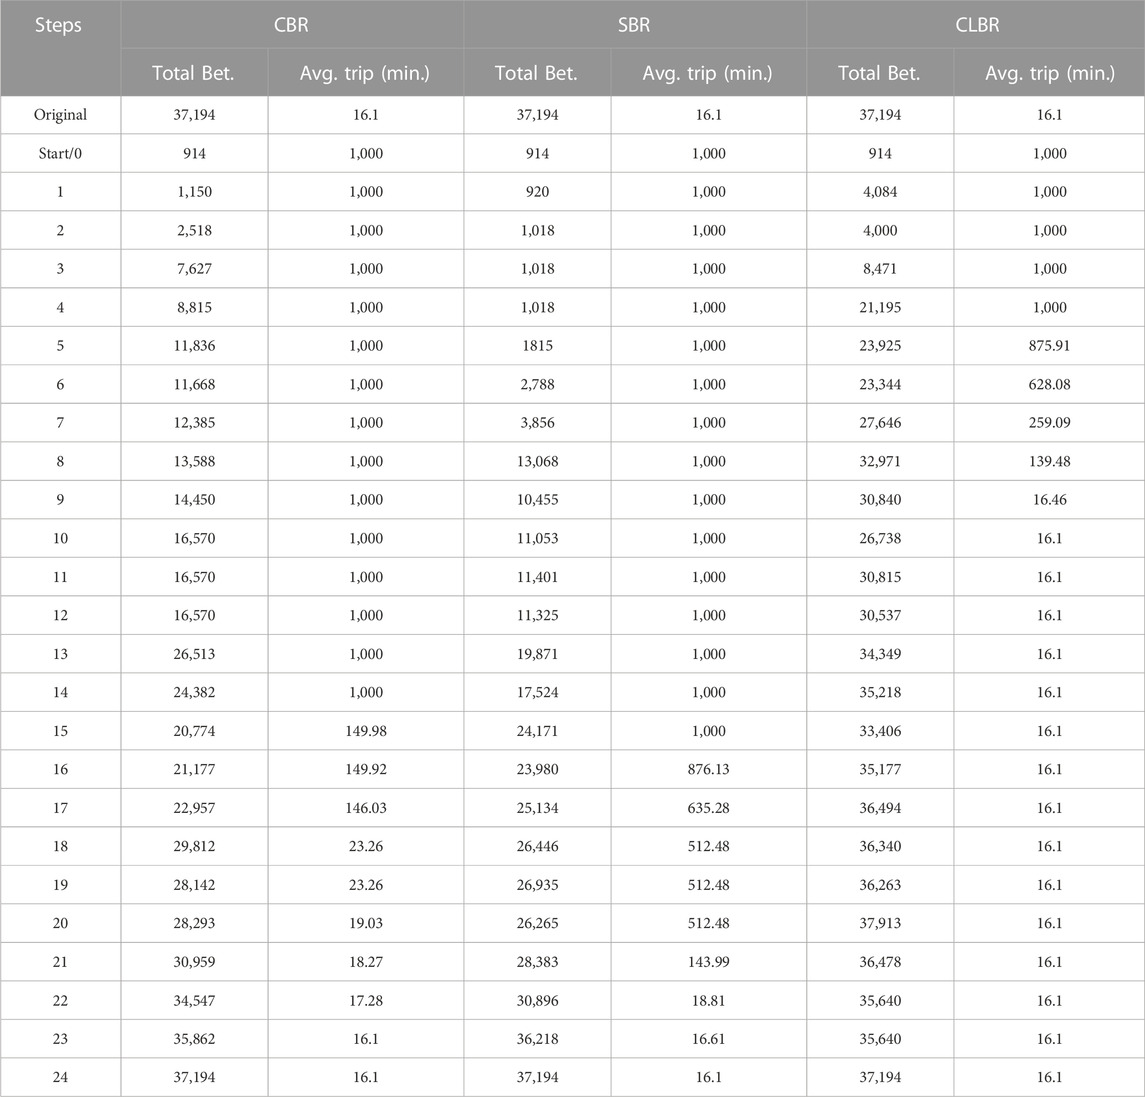
TABLE 3. Step-by-step performance metrics results of recovery strategies. Average trip 1,000 stands for inaccessible; this value is only used to facilitate the calculations.
The results showed that CLBR is the best strategy; this is also proven by the application of Eq. 3, considering t1 = 0, t2 = 24 h, and P(t) as presented in Table 4, to calculate RRI for each recovery strategy, which yields the following values:
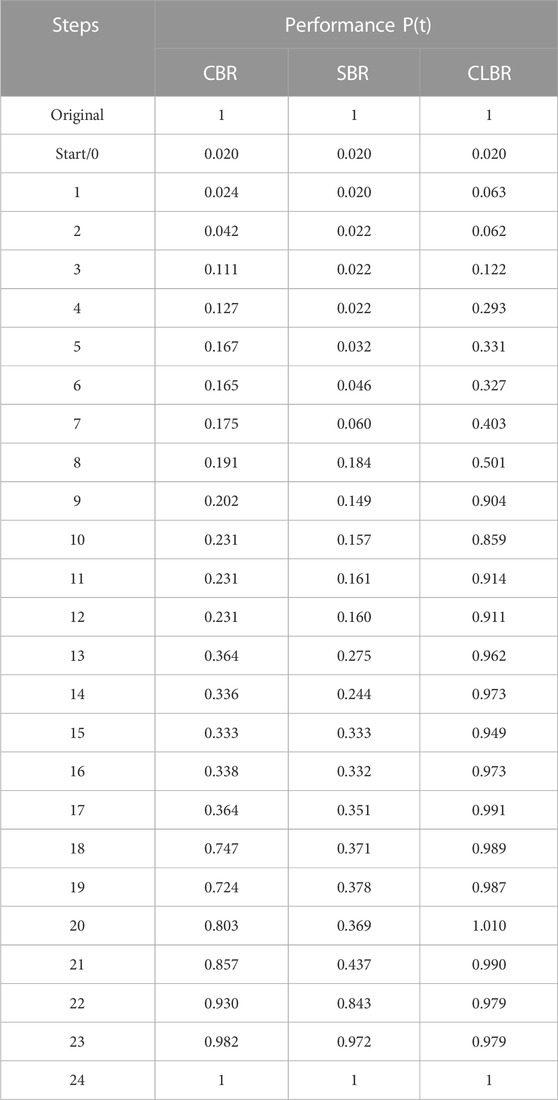
TABLE 4. Performance value at each step of the recovery strategies. (Metrics equally combined, weights 0.5,0.5).
On the other hand, it is important to observe the steps by which different recovery strategies re-established accessibility to the event venue from the fan zone. The results showed that in the CLBR strategy, the fans gained access to the venues by the 9th hour, and full access was established by the 10th hour; in the CBR strategy, access was gained by the 18th hour and full access by the 23rd hour; and in SBR strategy, access was gained by the 22nd hour and the full access was achieved only at the 24th hour. These results also reassure that the CLBR strategy is the best one among the suggested strategies. The results are summarized in Table 5 and given in step-by-step detail for each recovery strategy in Tables 6, 7, 8.
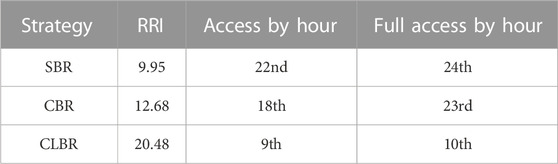
TABLE 5. Summarized recovery strategies assessment results.
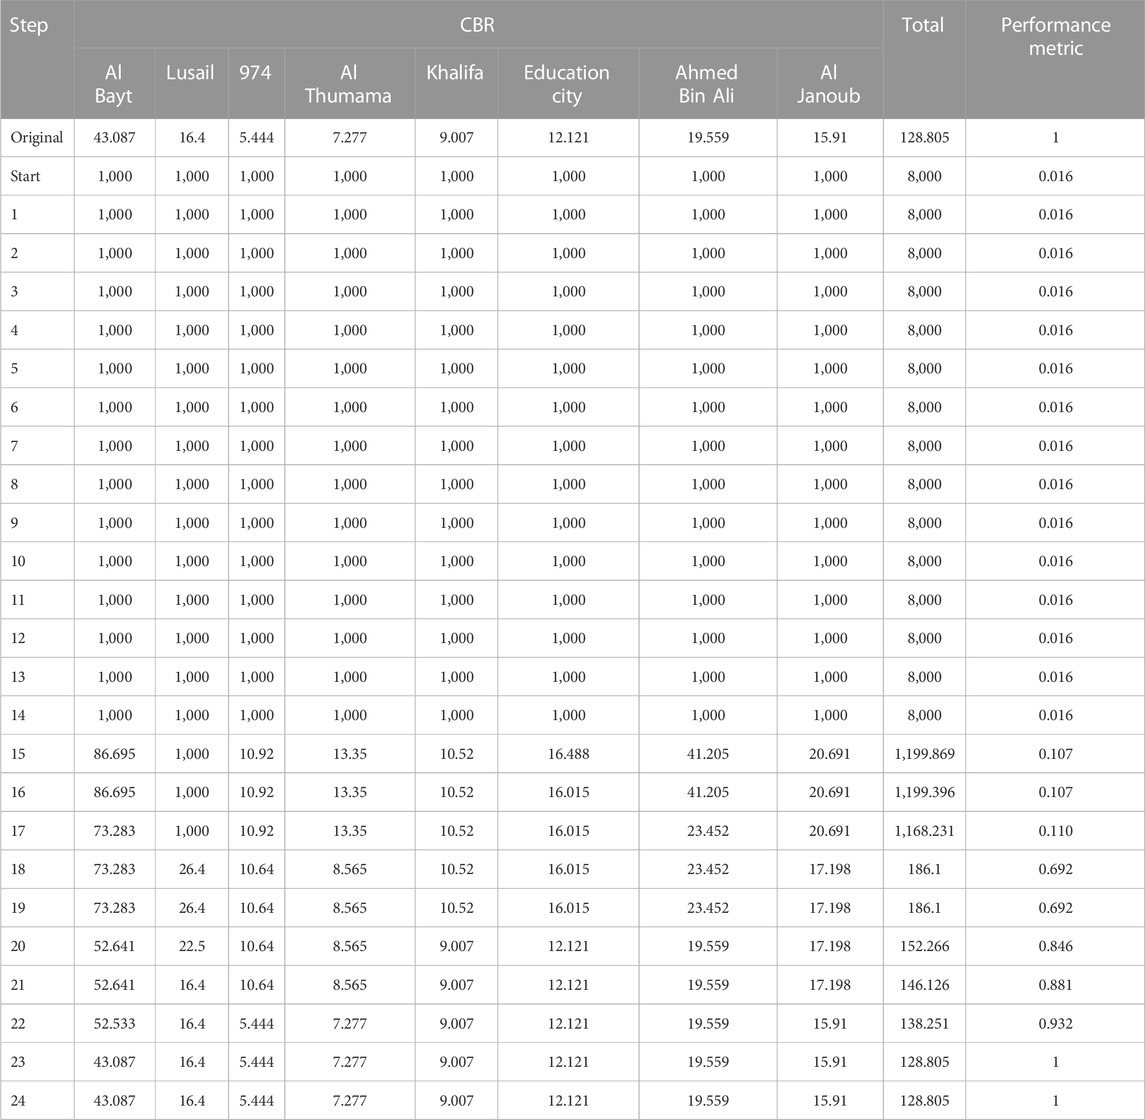
TABLE 6. Average trip length (km) to stadiums at each step during the CBR strategy. 1,000 stands for no accessibility.
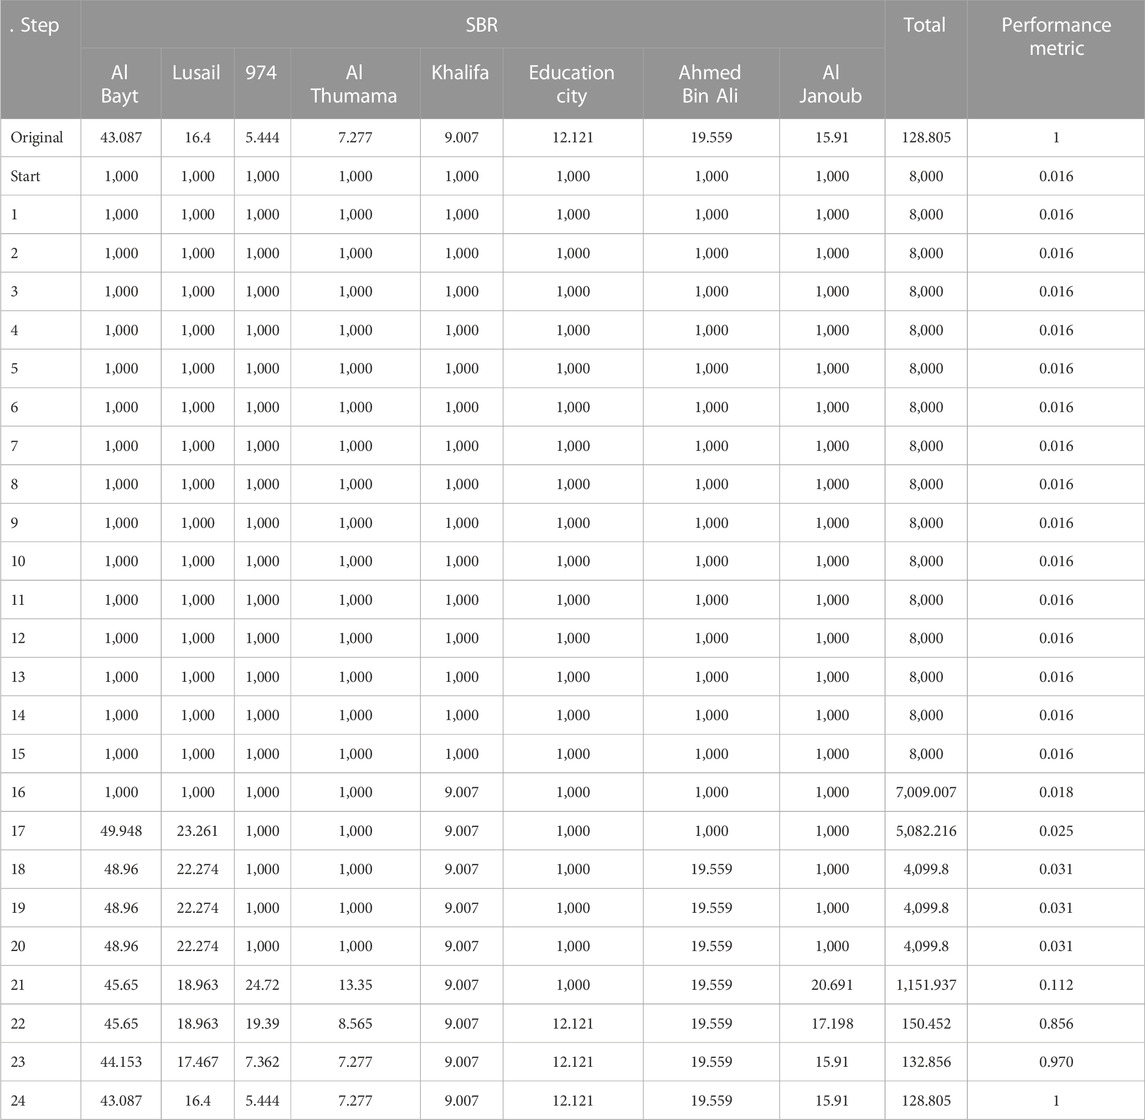
TABLE 7. Average trip length (km) to stadiums at each step during the SBR strategy 1,000 stands for no accessibility.
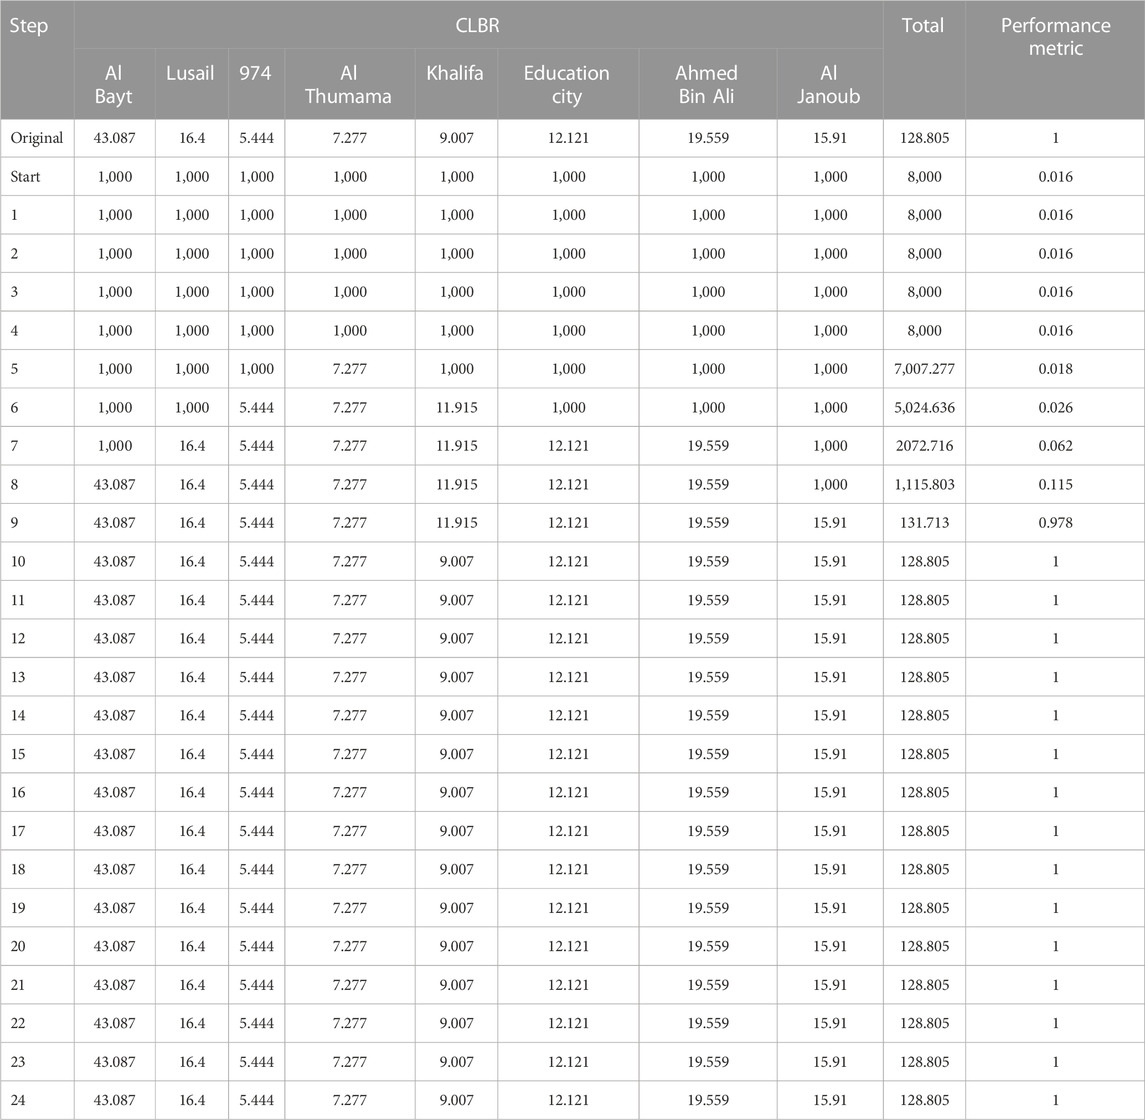
TABLE 8. Average trip length (km) to stadiums at each step during the CLBR strategy 1,000 stands for no accessibility.
It is worth noting that in the step-by-step results and Figure 8, there were some fluctuations, which were caused by the partial recovery of some links and the emergence of pseudo nodes that later disappear in the following steps with the restoration of the normal links and nodes, and the re-establishment of the connection between large clusters. These fluctuations could be observed in steps 5 & 9 of CLBR, 8 & 13 of SBR, and 13 & 18 of CBR. However, they do not affect the accuracy of the assessment as they happen in all strategies and do not create any long-term changes to the diagram or performance, as could be observed in Table 4 and Figure 8. Nevertheless, it is recommended to investigate the stability of the total betweenness metric to improve it or the adaptation of more stable centrality metrics in future studies. The step-by-step recovery development of the network under each strategy can be observed in Figures 9, 10, 11.
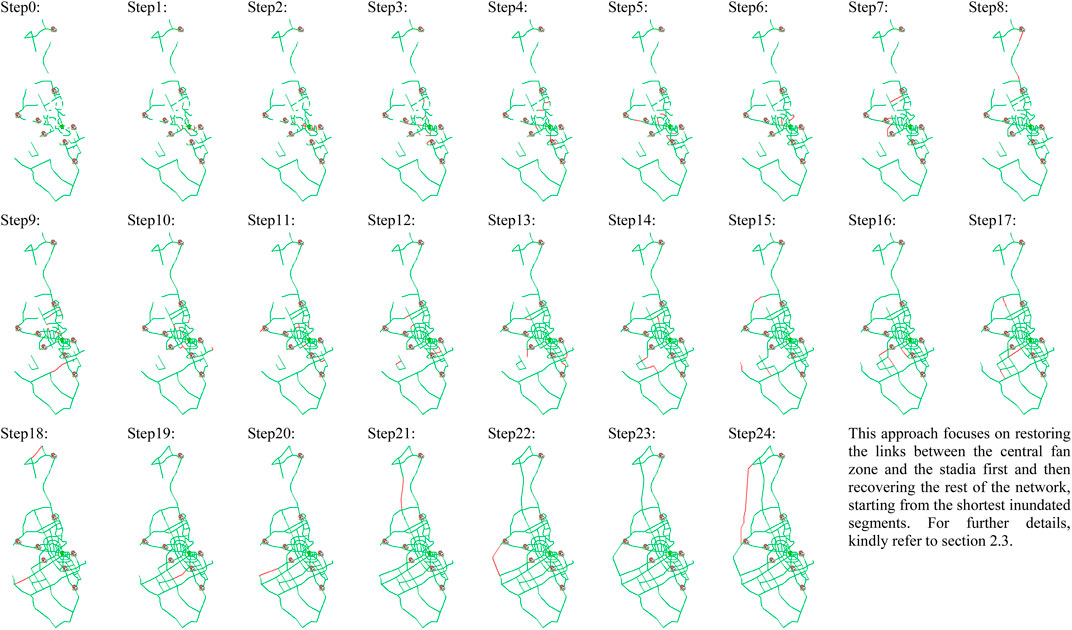
FIGURE 9. CLBR recovery step-by-step. The red lines are the ones recovered in the current step, and the green ones recovered in the previous steps or the ones that survived the disturbance (flood). The competition venues are also presented. Step0 represents the post-event situation.
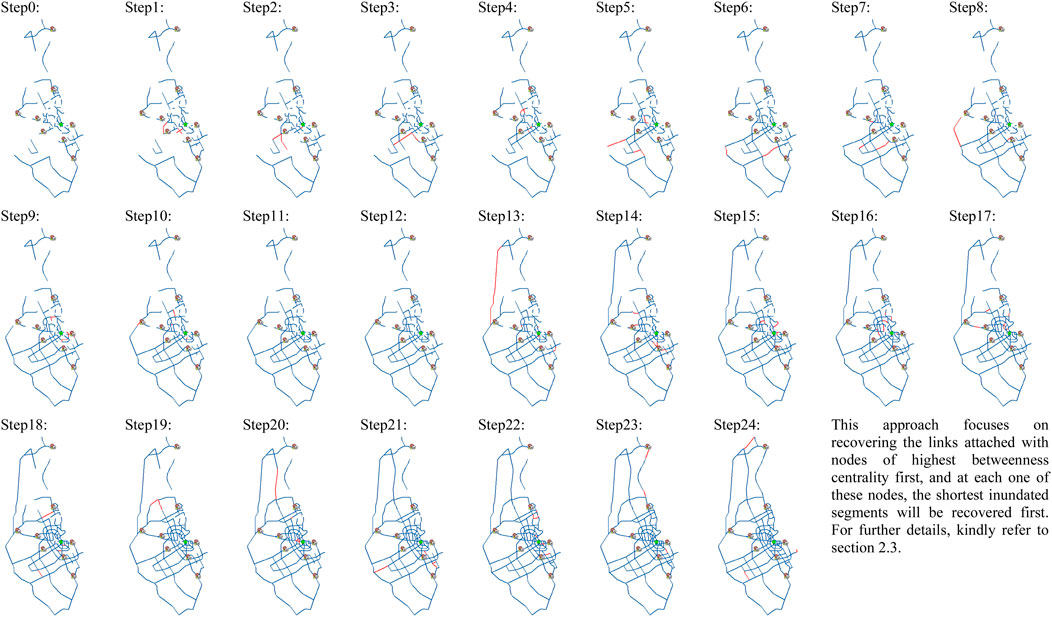
FIGURE 10. CBR recovery step-by-step. The red lines are the ones recovered in the current step, and the blue ones recovered in the previous steps or the ones that survived the disturbance (flood). The competition venues are also presented. Step0 represents the post-event situation.
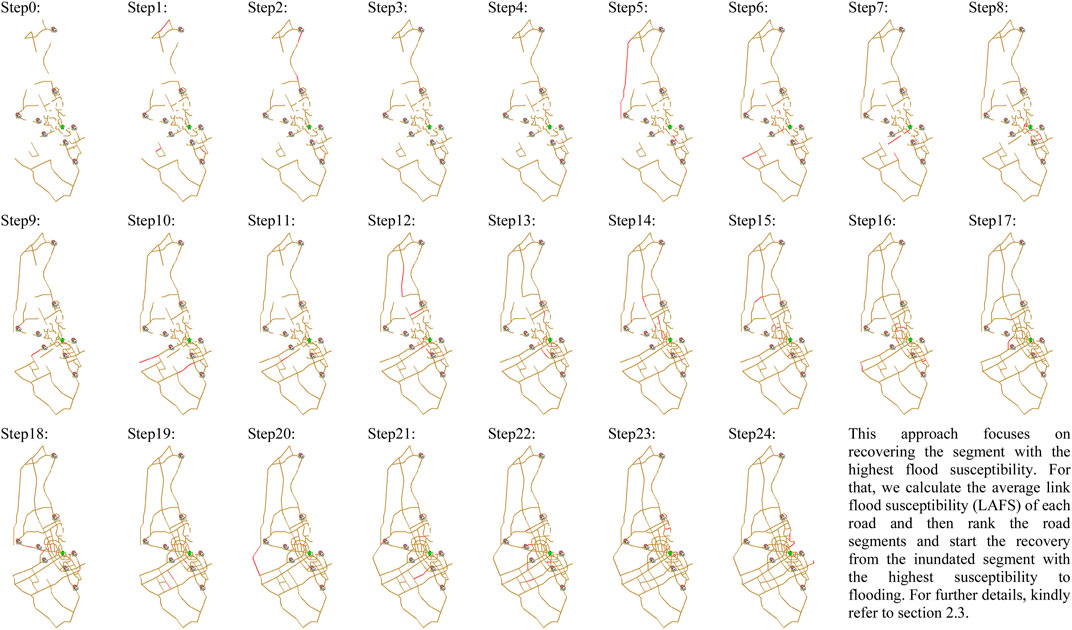
FIGURE 11. SBR recovery step-by-step. The red lines are the ones recovered in the current step, and the brown ones recovered in the previous steps or the ones that survived the disturbance (flood). The competition venues are also presented. Step0 represents the post-event situation.
Conducting the sensitivity analysis is important in evaluating the possible changes in the analysis outcomes due to favouring one metric over the other. Therefore, the sensitivity analysis was conducted following the method stated in the methodology section; by changing the weighting factors by 10%, starting from 0% to 100%. The result, presented in Table 9, shows that regardless of the weighting used in all cases, the best strategy is CLBR, then CBR, and the worst is SBR. This proves the consistency of the assessment results and reaffirms the CLBR as the most efficient recovery strategy among the suggested ones.
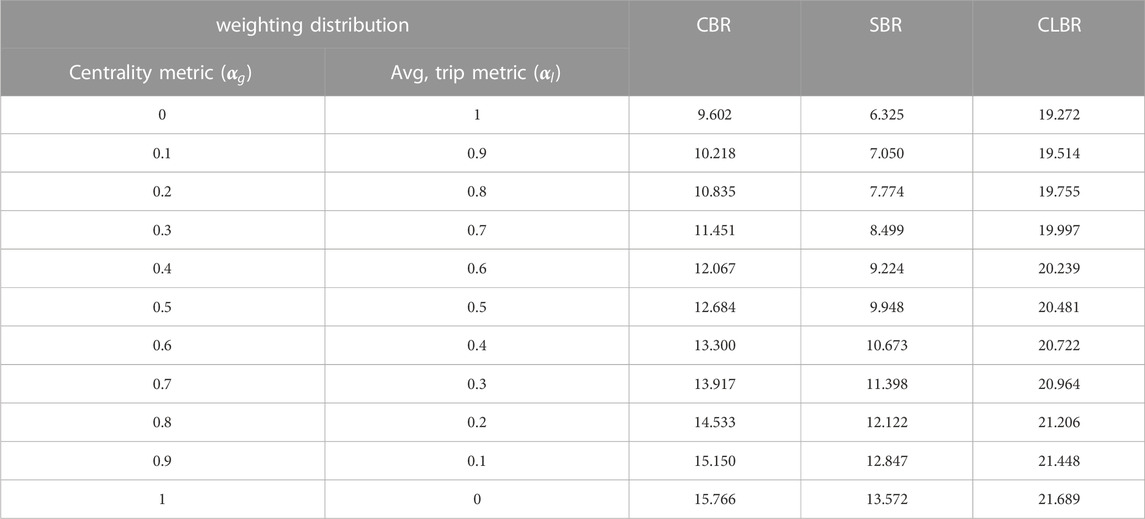
TABLE 9. RRI sensitivity analysis results.
CLBR enjoys an advantage by focusing on the links that have a higher value to the metrics used in the evaluation, the links that facilitate the connections between the fan zone and the stadia; this gives it the potential always to achieve a higher performance earlier than other approaches, especially when higher weighting is given to the average trip duration. Nevertheless, CLBR also achieves better performance when the weighting is totally focused on centrality metrics, as it focuses on regaining a central part of the network first and then recovering the shortest links, which increases the number of regained connections at each time step. This pattern presents an added advantage to CLBR as the Doha Road network consists of a large number of short roads in the center close to the coast which will be added to the initially recovered critical links creating a more connected and centralized recovered subnetwork/cluster compared to the other strategies. Additional recovery strategies could be derived by combining these strategies or introducing other strategies, which may result in better overall performance and resilience. The possible optimization of the recovery efforts resulting from the coupling of different strategies could be investigated in the future. Such development will require the integration of additional steps, such as Monte Carlo simulation, to evaluate possible improvement at each step and examine a large number of possibilities. However, such integration will require additional resources, prolong the assessment, and its effectiveness will depend on the variation between the suggested approaches. The current focus was to introduce the stepwise recovery and assess its impact on resilience, presenting the application through three strategies, which could be modified or coupled as seen fit by the authorities or researchers in the future, or while assessing other MSE in different countries.
On the other hand, from a decision-making and risk management perspective, it is important in any assessment to consider the financial aspects of each strategy and the resources required for its application. However, due to the huge cost associated with MSE compared to any potential cost of strategies, the complexity of quantifying the cost of late recovery, and the normalization of the recovery capacity per timestep, based on the study assumptions stated in section 2.2, this study did not account for the financial aspects of the recovery strategies. However, it is important to consider such aspects when assessing the recovery outside the context of MSE or develop a robust approach to integrate it into future studies.
Finally, it is intuitive that less intense precipitation/flood scenarios, 10,25,50 years ARI events, could cause some inundation in the network; however, their impact will always be less than the extreme event of 100 years ARI, which exceed the regular design requirements. Thus, the recovery efforts in such scenarios are less of a concern compared to the 100-year ARI events. While the variation between recovery strategies’ effectiveness could be less prevalent under these scenarios, investigating such variation is out of the scope of this study and could be addressed in future studies.
4 Conclusion
The recovery strategy of any system directly affects its resilience This research presents a framework that builds on the resilience index and metrics used in previous studies to conduct a resilience-oriented recovery strategies evaluation, within the context of Mega Sport Events (MSE). The damaged state was based on 100 ARI Flooding, which was found to be the critical disturbance in (Serdar and Al-Ghamdi, 2021b), as explained in methodology section. Three recovery strategies were suggested, namely,: Flood-susceptibility-based (SBR), Centrality-based (CBR), and Critical-links-first (CLBR) recovery strategies. Performance metrics are calculated for each strategy at different time steps, and the Recovery Resilience Index (RRI) is determined for each. The results consistently indicate that CLBR strategy significantly improves resilience compared to the other strategies, regardless of weighting. The suggested framework is flexible, allowing for various recovery sequences and expanding the options available to recovery planners and decision-makers.
The study presents a simple and robust approach for evaluating recovery strategies’ impact on road networks resilience and performance during MSE, using simple metrics. However, It overlooks crucial network aspects such as the impact on passengers, actual delays, and costs, which may require more detailed modeling and processing resources. Future studies should modify the framework to incorporate different metrics and applications beyond MSE, including urban disaster planning and management. Additionally, the framework could be developed into a user-friendly software tool to swiftly evaluate and identify optimal recovery strategies, potentially integrating optimization techniques. Future studies should modify the framework to incorporate different metrics and applications beyond MSE, including urban disaster planning and management. The utilization of Artificial Intelligence (AI) applications could leverage accumulated experiences to suggest more efficient and optimized recovery approaches. Furthermore, the framework can be enhanced to consider varying full-recovery duration, cost, and resources associated with different strategies, thus providing a more comprehensive and insightful evaluation.
Overall, this research contributes to understanding the implications of recovery strategies on resilience, particularly within the context of MSE and Mega Events in general. By adopting the findings, planners and decision-makers can develop better-informed policies, ultimately leading to more resilient and successful events capable of overcoming emerging challenges.
Data availability statement
The original contributions presented in the study are included in the article/Supplementary Material, further inquiries can be directed to the corresponding author.
Author contributions
MS and SA-G conceptualization and methodology; MS writing the original draft; MS, and SA-G writing-review and editing; SA-G supervision and funding acquisition. All authors contributed to the article and approved the submitted version.
Funding
This research was supported by a scholarship from Hamad Bin Khalifa University (HBKU) a member of Qatar Foundation (Q.F.). Any opinions, findings, and conclusion or recommendations expressed in this material are those of the author(s) and do not necessarily reflect the views of HBKU or Q.F.
Conflict of interest
The authors declare that the research was conducted in the absence of any commercial or financial relationships that could be construed as a potential conflict of interest.
Publisher’s note
All claims expressed in this article are solely those of the authors and do not necessarily represent those of their affiliated organizations, or those of the publisher, the editors and the reviewers. Any product that may be evaluated in this article, or claim that may be made by its manufacturer, is not guaranteed or endorsed by the publisher.
Abbreviations
AI, Artificial Intelligence; ARI, Average Recurrence Interval; Ashghal, the public works authority in Qatar; CBR, Centrality-Based Recovery; CLBR, Critical Links Based Recovery; FIFA, Fédération Internationale De Football Association; LAFS, Link Averaged Flood Susceptibility; MME, the Ministry of Municipalities and Environment; MSE, Mega-Sport Event; MSERRI, Mega Sport Events Road Resilience Index; RRI, Recovery Resilience Index; SBR, Susceptibility Based Recovery; UNDRR, The United Nations Office for Disaster Risk Reduction.
References
Abramson, D. M., and Redlener, I. (2012). Hurricane Sandy: Lessons learned, again. Disaster Med. Public Health Prep. 6, 328–329. doi:10.1001/dmp.2012.76
Ajjur, S. B., and Al-Ghamdi, S. G. (2022). Exploring urban growth–climate change–flood risk nexus in fast growing cities. Sci. Rep. 12, 12265. doi:10.1038/s41598-022-16475-x
Akbarzadeh, M., Memarmontazerin, S., Derrible, S., and Salehi Reihani, S. F. (2019). The role of travel demand and network centrality on the connectivity and resilience of an urban street system. Transp. (Amst). 46, 1127–1141. doi:10.1007/s11116-017-9814-y
Al-Humaiqani, M. M., and Al-Ghamdi, S. G. (2022). The built environment resilience qualities to climate change impact: Concepts, frameworks, and directions for future research. Sustain. Cities Soc. 80, 103797. doi:10.1016/j.scs.2022.103797
Almoghathawi, Y., Barker, K., and Albert, L. A. (2019). Resilience-driven restoration model for interdependent infrastructure networks. Reliab. Eng. Syst. Saf. 185, 12–23. doi:10.1016/j.ress.2018.12.006
Bastian, M., Heymann, S., and Jacomy, M. (2009). Gephi: An open source software for exploring and manipulating networks. Int. AAAI Conf. Weblogs Soc. Media 3, 361–362. doi:10.1609/icwsm.v3i1.13937
Bešinović, N., Ferrari Nassar, R., and Szymula, C. (2022). Resilience assessment of railway networks: Combining infrastructure restoration and transport management. Reliab. Eng. Syst. Saf. 224, 108538. doi:10.1016/j.ress.2022.108538
Bešinović, N. (2020). Resilience in railway transport systems: A literature review and research agenda. Transp. Rev. 40, 457–478. doi:10.1080/01441647.2020.1728419
Bhamani, S. (2022). Record flooding in Pakistan poses major health risks. BMJ 2148, o2148. doi:10.1136/bmj.o2148
Butry, D., Davis, C. A., Malushte, S. R., Medina, R. A., Taha, M. R., Van de Lindt, J. W., et al. (2021). Hazard-resilient infrastructure, hazard-resilient infrastructure. Reston, VA, United States: American Society of Civil Engineers. doi:10.1061/9780784415757
Büyüközkan, G., Ilıcak, Ö., and Feyzioğlu, O. (2022). A review of urban resilience literature. Sustain. Cities Soc. 77, 103579. doi:10.1016/j.scs.2021.103579
Casali, Y., and Heinimann, H. R. (2020). Robustness response of the Zurich road network under different disruption processes. Comput. Environ. Urban Syst. 81, 101460. doi:10.1016/j.compenvurbsys.2020.101460
Çelik, M. (2016). Network restoration and recovery in humanitarian operations: Framework, literature review, and research directions. Surv. Oper. Res. Manag. Sci. 21, 47–61. doi:10.1016/j.sorms.2016.12.001
Duy, P. N., Chapman, L., and Tight, M. (2019). Resilient transport systems to reduce urban vulnerability to floods in emerging-coastal cities: A case study of Ho chi minh city, vietnam. Vietnam. Travel Behav. Soc. 15, 28–43. doi:10.1016/j.tbs.2018.11.001
Faturechi, R., and Miller-Hooks, E. (2015). Measuring the performance of transportation infrastructure systems in disasters: A comprehensive review. J. Infrastruct. Syst. 21, 04014025. doi:10.1061/(ASCE)IS.1943-555X.0000212
Flood List, (2023). Qatar flash floods after years worth of rain in one day. https://floodlist.com/?s=qatar&submit.
Goldbeck, N., Angeloudis, P., and Ochieng, W. Y. (2019). Resilience assessment for interdependent urban infrastructure systems using dynamic network flow models. Reliab. Eng. Syst. Saf. 188, 62–79. doi:10.1016/j.ress.2019.03.007
Griffin, T. R. (2019). National identity, social legacy and Qatar 2022: The cultural ramifications of FIFA’s first arab world Cup. Soccer Soc. 20, 1000–1013. doi:10.1080/14660970.2019.1680499
Henry, D., and Emmanuel Ramirez-Marquez, J. (2012). Generic metrics and quantitative approaches for system resilience as a function of time. Reliab. Eng. Syst. Saf. 99, 114–122. doi:10.1016/j.ress.2011.09.002
Hosseini, S., Barker, K., and Ramirez-Marquez, J. E. (2016). A review of definitions and measures of system resilience. Reliab. Eng. Syst. Saf. 145, 47–61. doi:10.1016/J.RESS.2015.08.006
Ilbeigi, M. (2019). Statistical process control for analyzing resilience of transportation networks. Int. J. Disaster Risk Reduct. 33, 155–161. doi:10.1016/j.ijdrr.2018.10.002
Karduni, A., Kermanshah, A., and Derrible, S. (2016). A protocol to convert spatial polyline data to network formats and applications to world urban road networks. Sci. Data 3, 160046. doi:10.1038/sdata.2016.46
Kermanshah, A., and Derrible, S. (2017). Robustness of road systems to extreme flooding: Using elements of GIS, travel demand, and network science. Nat. Hazards 86, 151–164. doi:10.1007/s11069-016-2678-1
Kermanshah, A., Karduni, A., Peiravian, F., and Derrible, S. “Impact analysis of extreme events on flows in spatial networks,” in Proceedings of the 2014 IEEE International Conference on Big Data (Big Data), Washington, DC, USA, October 2014, 29–34. doi:10.1109/BigData.2014.7004428
Kott, A., Golan, M. S., Trump, B. D., and Linkov, I. (2021). Cyber resilience: By design or by intervention? Comput. Long. Beach. Calif. 54, 112–117. doi:10.1109/MC.2021.3082836
Linkov, I., and Palma-Oliveira, J. M. (2017). An introduction to resilience for critical infrastructures. Berlin, Germany: Springer, 3–17.
Liu, W., and Song, Z. (2020). Review of studies on the resilience of urban critical infrastructure networks. Reliab. Eng. Syst. Saf. 193, 106617. doi:10.1016/j.ress.2019.106617
Mamoon, A., and Rahman, A. (2017). Rainfall in Qatar: Is it changing? Nat. Hazards 85, 453–470. doi:10.1007/s11069-016-2576-6
Martín, B., Ortega, E., Cuevas-Wizner, R., Ledda, A., and De Montis, A. (2021). Assessing road network resilience: An accessibility comparative analysis. Transp. Res. Part D. Transp. Environ. 95, 102851. doi:10.1016/j.trd.2021.102851
Medd, W., Deeming, H., Walker, G., Whittle, R., Mort, M., Twigger-Ross, C., et al. (2015). The flood recovery gap: A real-time study of local recovery following the floods of june 2007 in hull, north East england. J. Flood Risk Manag. 8, 315–328. doi:10.1111/jfr3.12098
Meza Talavera, A., Al-Ghamdi, S., and Koç, M. (2019). Sustainability in mega-events: Beyond Qatar 2022. Sustainability 11, 6407. doi:10.3390/su11226407
Middle East Eye, (2018). Qatar drenched by floods as almost a year’s rain falls in one day | Middle East Eye. https://www.middleeasteye.net/news/qatar-drenched-floods-almost-years-rain-falls-one-day.
Mme, , 2018. MME flood mapping portal. https://aldeera.gisqatar.org.qa/mmeflood/(accessed 4.29.21).
Muraikhi, R. Al., and Al-Shafi, M. (2022). Video showing heavy rain on outskirts of Al Khor goes viral. https://s.thepeninsula.qa/nbgdyd.
Neuman, M. (2020). Infrastructure is key to make cities sustainable. Sustainability 12, 8308. doi:10.3390/su12208308
Nurre, S. G., Cavdaroglu, B., Mitchell, J. E., Sharkey, T. C., and Wallace, W. A. (2012). Restoring infrastructure systems: An integrated network design and scheduling (INDS) problem. Eur. J. Oper. Res. 223, 794–806. doi:10.1016/j.ejor.2012.07.010
Orr, M., Inoue, Y., Seymour, R., and Dingle, G. (2022). Impacts of climate change on organized sport: A scoping review. WIREs Clim. Chang. 13. doi:10.1002/wcc.760
Pregnolato, M., Ford, A., Robson, C., Glenis, V., Barr, S., and Dawson, R. (2016). Assessing urban strategies for reducing the impacts of extreme weather on infrastructure networks. R. Soc. Open Sci. 3, 160023. doi:10.1098/rsos.160023
Public Works Authority - Drainage Affairs, (2005). Qatar sewerage and drainage design manual. Surf. Water Drain. 3.
Qatar, I. Love (2018). Severe flooding in Qatar as heavy rainfall ensues!. https://www.iloveqatar.net/news/general/severe-flooding-in-qatar-as-heavy-rainfall-ensues.
Rebally, A., Valeo, C., He, J., and Saidi, S. (2021). Flood impact assessments on transportation networks: A review of methods and associated temporal and spatial scales. Front. Sustain. Cities 3. doi:10.3389/frsc.2021.732181
Saadat, Y. (2021). Enhancing resilience of complex networks: Washington D.C. Urban rail Transit as a case study. College Park PP - United States: ProQuest Diss. Theses. University of Maryland.
Sarlas, G., Páez, A., and Axhausen, K. W. (2020). Betweenness-accessibility: Estimating impacts of accessibility on networks. J. Transp. Geogr. 84, 102680. doi:10.1016/j.jtrangeo.2020.102680
Serdar, M. Z., Ajjur, S. B., and Al-Ghamdi, S. G. (2022a). Flood susceptibility assessment in arid areas: A case study of Qatar. Sustain 14, 9792. doi:10.3390/su14159792
Serdar, M. Z., and Al-Ghamdi, S. G. (2021a). “Preparing for the unpredicted: A resiliency approach in energy system assessment,” in Green energy and technology. Editor J. Ren (Cham, Germany: Springer International Publishing), 183–201. doi:10.1007/978-3-030-67529-5_9
Serdar, M. Z., and Al-Ghamdi, S. G. (2021b). Resiliency assessment of road networks during mega sport events: The case of FIFA world Cup Qatar 2022. Sustainability 13, 12367. doi:10.3390/su132212367
Serdar, M. Z., Koc, M., and Al-Ghamdi, S. G. (2021). Urban infrastructure resilience assessment during mega sport events using a multi-criteria approach. Front. Sustain. 2. doi:10.3389/frsus.2021.673797
Serdar, M. Z., Koç, M., and Al-Ghamdi, S. G. (2022b). Urban transportation networks resilience: Indicators, disturbances, and assessment methods. Sustain. Cities Soc. 76, 103452. doi:10.1016/j.scs.2021.103452
Serdar, M. Z., Macauley, N., and Al-Ghamdi, S. G. (2022c). Building thermal resilience framework (btrf): A novel framework to address the challenge of extreme thermal events, arising from climate change. Front. Built Environ. 8. doi:10.3389/fbuil.2022.1029992
Sharkey, T. C., Nurre Pinkley, S. G., Eisenberg, D. A., and Alderson, D. L. (2021). In search of network resilience: An optimization-based view. Networks 77, 225–254. doi:10.1002/net.21996
Slavíková, L., Raška, P., Banasik, K., Barta, M., Kis, A., Kohnová, S., et al. (2020). Approaches to state flood recovery funding in Visegrad Group Countries. Environ. Hazards 19, 251–267. doi:10.1080/17477891.2019.1667749
Soltani-Sobh, A., Heaslip, K., and El Khoury, J. (2015). Estimation of road network reliability on resiliency: An uncertain based model. Int. J. Disaster Risk Reduct. 14, 536–544. doi:10.1016/j.ijdrr.2015.10.005
Sun, W., Bocchini, P., and Davison, B. D. (2020). Resilience metrics and measurement methods for transportation infrastructure: The state of the art. Sustain. Resilient Infrastruct. 5, 168–199. doi:10.1080/23789689.2018.1448663
Tahir, F., Ajjur, S. B., Serdar, M. Z., Al-Humaiqani, M., Kim, D., Al-Thani, S. K., et al. (2021). Qatar climate change conference 2021, Qatar climate change conference 2021. Ar-Rayyan, Qatar: Hamad bin Khalifa University Press (HBKU Press. doi:10.5339/conf_proceed_qccc2021
Twumasi-Boakye, R., and Sobanjo, J. O. (2021). A computational approach for evaluating post-disaster transportation network resilience. Sustain. Resilient Infrastruct. 6, 235–251. doi:10.1080/23789689.2019.1605754
Twumasi-Boakye, R., and Sobanjo, J. O. (2018). Resilience of regional transportation networks subjected to hazard-induced bridge damages. J. Transp. Eng. Part A Syst. 144, 04018062. doi:10.1061/jtepbs.0000186
Ukkusuri, S. V., and Yushimito, W. F. (2009). A methodology to assess the criticality of highway transportation networks. J. Transp. Secur. 2, 29–46. doi:10.1007/s12198-009-0025-4
Watson, G., and Ahn, J. E. (2022). A systematic review: To increase transportation infrastructure resilience to flooding events. Appl. Sci. 12, 12331. doi:10.3390/app122312331
Wilson, B., Tate, E., and Emrich, C. T. (2021). Flood recovery outcomes and disaster assistance barriers for vulnerable populations. Front. Water 3. doi:10.3389/frwa.2021.752307
Yadav, N., Chatterjee, S., and Ganguly, A. R. (2020). Resilience of urban transport network-of-networks under intense flood hazards exacerbated by targeted attacks. Sci. Rep. 10, 10350. doi:10.1038/s41598-020-66049-y
Keywords: road networks resilience, flood resilience, climate change resilience, disaster recovery planning, mega sport events, FIFA World Cup Qatar 2022
Citation: Serdar MZ and Al-Ghamdi SG (2023) Resilience-oriented recovery of flooded road networks during mega-sport events: a novel framework. Front. Built Environ. 9:1216919. doi: 10.3389/fbuil.2023.1216919
Received: 04 May 2023; Accepted: 21 June 2023;
Published: 29 June 2023.
Edited by:
Sakdirat Kaewunruen, University of Birmingham, United KingdomReviewed by:
Mehmet Hamarat, Boğaziçi University, TürkiyeXiongfei Zhou, Southwest Jiaotong University, China
Copyright © 2023 Serdar and Al-Ghamdi. This is an open-access article distributed under the terms of the Creative Commons Attribution License (CC BY). The use, distribution or reproduction in other forums is permitted, provided the original author(s) and the copyright owner(s) are credited and that the original publication in this journal is cited, in accordance with accepted academic practice. No use, distribution or reproduction is permitted which does not comply with these terms.
*Correspondence: Sami G. Al-Ghamdi, c2FtaS5hbGdoYW1kaUBrYXVzdC5lZHUuc2E=