 Joan F. Rey
 Nicolas Meisser3
 Dusan Licina
- 1Western Switzerland Center for Indoor Air Quality and Radon (croqAIR), Transform Institute, School of Engineering and Architecture of Fribourg, HES-SO University of Applied Sciences and Arts Western Switzerland, Fribourg, Switzerland
- 2Human-Oriented Built Environment Lab, School of Architecture, Civil and Environmental Engineering, Ecole Polytechnique Fédérale de Lausanne (EPFL), Lausanne, Switzerland
- 3Muséum Cantonal des Sciences Naturelles, Geology Department, UNIL—Chamberonne, University of Lausanne, Lausanne, Switzerland
Radon, a naturally occurring radioactive gas, poses a significant health risk by accumulating in buildings and potentially leading to lung cancer. Depending on building construction and geographical location, radon levels can vary substantially both within individual buildings and between different buildings. While previous studies have primarily focused on the impact of temperature and relative humidity on radon devices, the influence of aerosols remains largely unexplored. This paper presents a comprehensive evaluation of the influence of indoor aerosol sources on the performance of real-time radon sensors, encompassing consumer, medium, and research-grade devices. Measurements were performed at relatively low (300 Bq/m3) and high (2′000–3′000 Bq/m3) radon levels in a controlled environment—a stable atomic shelter with constant temperature and humidity conditions. Six different aerosols sources were introduced to produce aerosols of different sizes and concentrations. The results suggest that the tested indoor aerosols did not significantly influence the performance of radon devices, irrespective of their grade or detection method. Consequently, sensor performance and the radon levels being investigated may exert a more significant influence on the obtained results than aerosol levels alone. This paper provides valuable insights into the influence of indoor environment on the performance of radon measuring devices, underscoring the importance of understanding their utility and application scope for researchers, professionals, and the general public alike.
1 Introduction
Western population spends on average 90% of their time indoors, which underlines the critical importance of indoor air quality (IAQ) (Klepeis et al., 2001). Among the myriad of pollutants present in indoor air, radon is of particular concern due to its noble, natural, and radioactive properties and capability of accumulating indoors (World Health Organization, 2009). Prolonged exposure to radon has been linked to an increased risk of lung cancer, contributing globally to 3%–14% of all lung cancer cases, depending on national average radon level and smoking prevalence (World Health Organization, 2023). Consequently, various radon national plans emerged in recent years, notably in Switzerland, Canada, and the USA (Swiss Federal Office of Public Health, 2020; Swiss Federal Office of Public Health, 2011; U.S. Environmental Protection Agency, 2022; Health Canada, 2022), emphasizing the ongoing need for action in both existing and new buildings, as well as initiatives for professional training and public awareness. The impact of radon exposure on human health is typically evaluated through the effective dose, which is determined by factors such as the average radon concentration, equilibrium factor, exposure duration, and effective dose coefficient (ICRP, 2018; Bertoni, El Hajj, and Gandolla, 2022). To ensure precise effective dose estimation, it is important to enhance the accuracy of radon measurements and the equilibrium factor assessment.
While previous research has primarily focused on the influence of temperature and relative humidity (Xianjie et al., 1993; Vargas and Ortega, 2007; Heidary et al., 2011) on radon measurement devices and temperature and humidity operational ranges are specified by manufacturers, it is important to recognize that indoor environmental conditions extend beyond these factors alone. Indoor aerosols, varying in source, composition, shape, size, and concentration (Vincent, 1995; Hussein et al., 2006; Salma et al., 2013), contribute to the complexity of indoor air dynamics. While radon is gaseous, its solid decay products interact with indoor aerosols. Following decay, solid radionuclides rapidly react with vapors and trace gases to form unattached clusters in the size range 0.5–5 nm (Porstendörfer, 1994). The attachment process, influenced by aerosol sources such as cigarette smoke or cooking emissions, has been studied extensively (Porstendörfer, 1994; Vaupotic, 2011; Skubacz and Wołoszczuk, 2019), with findings indicating differing attachment rates based on aerosol size and composition (Porstendörfer, 1994). In enclosed indoor environments, surface deposition serves as the primary mechanism for reducing radon decay product concentrations, with studies indicating that higher aerosol concentrations result in reduced deposition rates (Porstendörfer, 1994).
The equilibrium factor
Given that aerosol levels influence the behavior of radon daughters and related processes, it is essential to assess the impact of aerosols on different radon measurement devices. Although the aforementioned processes do not directly correlate with radon devices, we hypothesize that aerosols levels may bias radon measurements by accumulating aerosols within the sampling chamber of the sensors. Thus, there is a clear need and value to assess the performance of real-time radon devices under different aerosols conditions. Consequently, this paper seeks to determine the impact of diverse indoor sources of aerosols on real-time radon measurements devices. We explored the variation of measurement device grade (from consumer-to research-grade) and different radon detection methods.
The objective of this paper is to bring new insights into the reliability of different radon devices used by researchers, professionals, and the general public. From a wider perspective, this paper aims to reduce uncertainties in radon measurements, ensuring the highest measurement reliability, and consequently enabling a refined assessment of radon exposure among the population.
2 Materials and methods
The experiments were conducted in one of the atomic shelters located in the basement of the Anthropole building at the University of Lausanne. This shelter was chosen due to its stable indoor environmental parameters, specifically air temperature and relative humidity. Indeed, average air temperature and relative humidity ranges vaulted respectively 20.9°C–23.5°C and 52.4%–61.2% with a maximal standard deviation of 0.27°C and 1.09%. This stability ensured that the influence on radon sensors is minimized, allowing for an isolated assessment of the impact on aerosols. The shelter has a floor area of 40 m2 and a volume of approximately 144 m3. Radon sensors were strategically placed on a table in the center of the room. To ensure homogeneous radon and aerosols concentrations, fans were installed at each corner of the shelter.
2.1 Experiment design
The experiment comprised two main stages. First, the influence of common indoor aerosols on radon sensors was tested at high radon levels (2′000–3′000 Bq/m3) in July 2021, and second, at low radon levels, i.e., close to Switzerland’s national reference value of 300 Bq/m3 (Swiss Federal Office of Public Health, 2020), in September 2022. During both stages, a consistent and strict protocol was followed. Radon sensors were sequentially exposed to different aerosol sources for at least 48 h (Owen, Ensor, and Sparks, 1992; Demanega et al., 2021). To assess the influence of different aerosol sources, we compared the performances of radon sensors exposed to different sources with those in the absence of aerosol generation beyond existing ambient aerosols. Between each experiment, the shelter air was purged by turning on the ventilation system.
2.1.1 Aerosol generation
Aerosols were generated based on the specifications outlined in Table 1, emulating usage scenarios typical in Swiss households (He, 2004; Demanega et al., 2021). In cases where usage recommendations were unavailable, aerosols were generated based on practical and reasonable criteria for a product use (e.g., simulating cooking fumes by preparing three meals daily). Additionally, all products used to generate aerosols were sourced from large retail stores to ensure a realistic representation of indoor aerosol conditions.
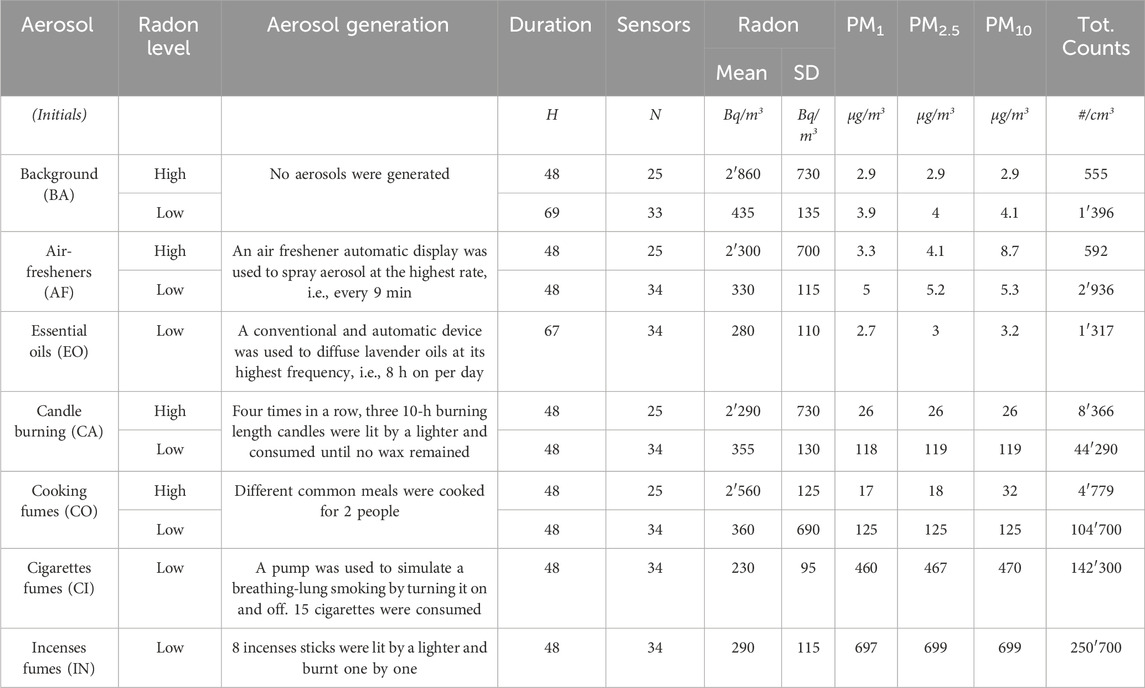
Table 1. Experimental design and description of the aerosol sources. Aerosol levels were retrieved for the highest 1-min total counts (tot. counts) value during each experiment.
2.1.2 Radon generation
Given the subterranean location of the atomic shelter, a natural radiative background was initially assessed. However, to establish both high and low radon levels, two highly active natural radon sources were employed. The “Swiss Radon Mega Source Facility” was used for high radon levels, consisting of a mobile lead and steel enclosure filled with 20 kg of high-grade uraninite (UO2 + UO3 85%–94%) sourced from La Creusaz uranium mine in Switzerland (Meisser, 2012). For low radon levels, we used a fragment of pure uraninite (“pitchblende” variety (UO2 + UO3 87%–93% - 550 g) from the Mine of La Crouzille-Bessine in Limousin, France (Geffroy and Sarcia, 1955).
High radon levels were established by releasing radon at the beginning of the experiment, gradually decreasing after approximately 15 min when the source was moved outside the shelter. In contrast, low radon levels were maintained by keeping the uraninite source within the shelter due to its lower weight.
2.2 Measurement devices
Monitoring of time- and size-resolved particle levels was done using an aerosol spectrometer (size range 0.01–35 µm divided into 40 size channels, Mini-WRAS, GRIMM Aerosol Technik). Equilibrium factor was assessed by a SARAD EQF 3220, which was measuring both radon concentrations and its daughters’ concentrations (EEC). Various radon sensors representative of the European market were tested in the experiments, differing in brand, grade, detection method, accessibility, and price (see Table 2). We categorized sensor grades based on their selling price as follows: 1) Consumer-grade, sold below 950 USD; 2) Medium-grade, ranging between 950 and 5000 USD, and 3) Research-grade, sold over 5000 USD. Radon detection methods were aggregated in three main categories: 1) alpha spectrometry, 2) scintillation cell, 3) ionization chamber. These three categories are the most widespread among the European market.
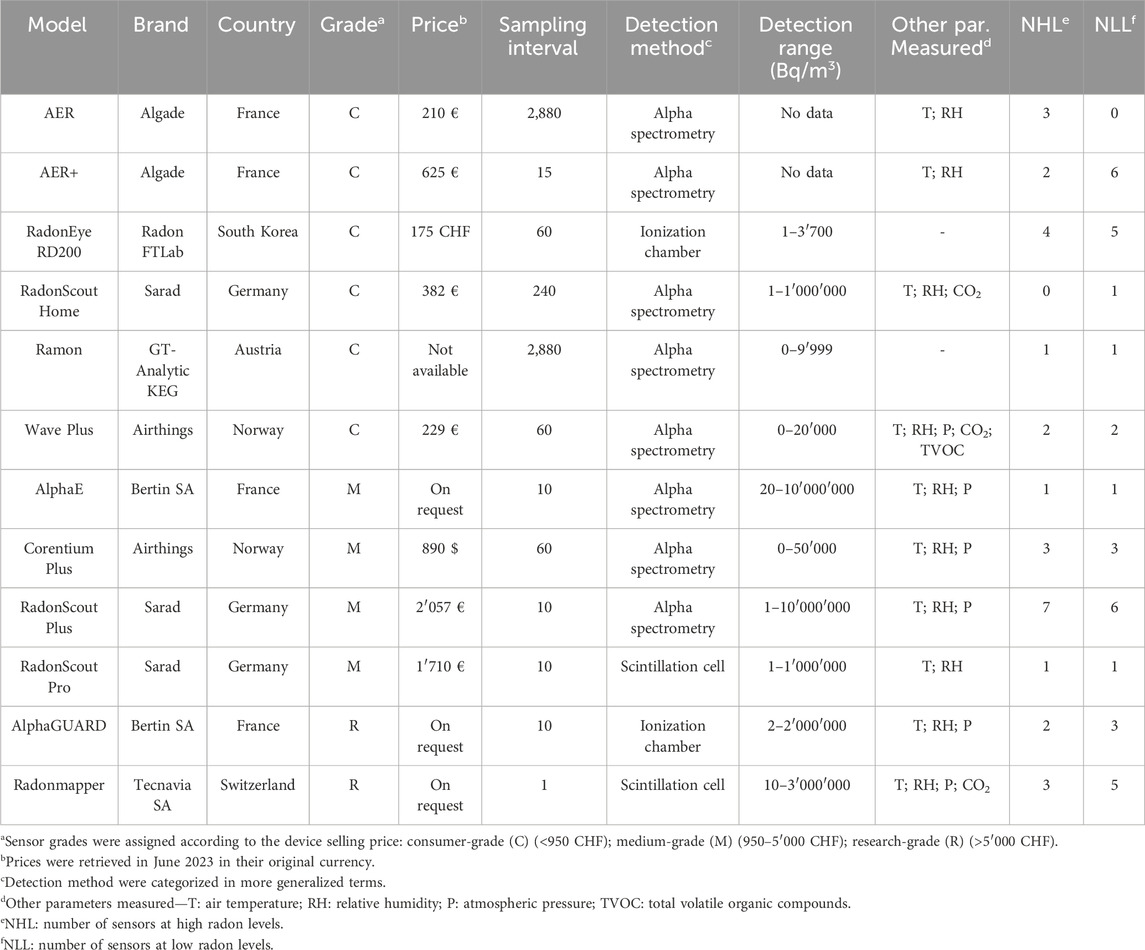
Table 2. Manufacturer-specified technical characteristics for the different radon real-time sensors tested in this study.
To ensure cross-comparison between different sensors, Radonmapper (TECNAVIA SA, 2016) served as the reference sensor. An AlphaGUARD (Bertin Technologies S.A.S 2012) served as a backup reference instrument in case of Radonmapper failure.
2.3 Data analysis
To identify the influence of common indoor aerosols on radon measurement devices, several statistical analyses were carried out. We first compared the tested sensors to the reference to ensure comparison among all sensors. To that end, ratios were calculated by comparing the average values measured by each tested sensor X to the average values measured by the reference sensor (Janik et al., 2009; Mamont-Cieśla et al., 2010; Papp, Cosma, and Cucos, 2016; Rey et al., 2024) during a time series t (Eq. 1). A ratio value close to 1 indicates similar means between the tested sensor and the reference. These ratios enabled comparisons within sensors and across different aerosol situations.
In a second step, ratios were grouped into distributions based on grade (i.e., consumer-, medium-, research-grade) and detection method (i.e., scintillation counter, ionization chamber, alpha spectrometry). For each group, the relative standard deviation (also called the coefficient of variation) was computed to assess the dispersion relative to their proper mean. The relative standard deviation
Then, different distributions of ratios were statistically compared in relation to the different aerosol sources and background concentration. Wilcoxon tests were employed to statistically assess the statistical influence of different aerosol sources and background on these distributions (Wilcoxon, 1945). We used a non-parametric statistical test due to the low sample size, indicating that the normality cannot be assumed. The null hypothesis posits that no difference exists between the distributions of two ratios, while the alternative hypothesis suggests that distributions of the two ratios differ. p-values were adjusted using the Bonferroni method to minimize errors.
The statistical analyses and graphical representations were performed using the R language and RStudio (Version 1.4.1717 March 2022) (RStudio Team, 2022). Graphics and figures were produced using the ggplot2 package within RStudio (Wickham, 2016).
2.4 Quality assurance
The reference instruments were high-grade sensors with a stable calibration accredited by METAS (DFJP, 2012). Where possible, we used multiple sensors of the same type in our experiments. Among all the real-time radon sensors, only AlphaE, RadonScout Pro, RadonScout Home, and Ramon were single tested (without a pair). Most of real-time radon sensors (AER, AER+, AlphaE, RadonEye RD200, RadonScout Home, Ramon, Wave Plus, RadonScout Pro and AlphaGUARD) were tested in multiple samples (Table 2). These sensors were provided to our research team by different institutions from Switzerland and France, implying variations in their usage history. To minimize differences between sensors of the same type, all sensors were powered on 1 week before the experiments and deployed in accordance with manufacturer-specified recommendations. Finally, the experimental protocol was strictly followed to reduce measurement uncertainty and increase repeatability of results.
3 Results
3.1 Influence of aerosols on radon sensors by grade
Figure 1 illustrates the statistical assessment of common indoor aerosol influence on radon sensors, showcasing the distributions of ratios categorized by sensor grade and aerosol source at both high and low radon levels. Overall, the distributions of ratios exhibited greater variability for consumer-grade sensors compared to medium- and research-grade sensors, irrespective of the aerosol source at high radon levels. This observation is supported by relative standard deviations (RSD) ranging from 9 to 11% for consumer-grade sensors, and from 3.9% to 6.8% for medium- and research grade sensors (Table 3). Conversely, the distributions were more similar for consumer and medium-grade radon sensors at low radon levels compared to research grade sensors. Specifically, RSD ranged from 9.2% to 17.5%, 4%–14.8% and 2.2%–3.8% respectively for consumer-, medium-, and research-grade sensors. Across the different aerosol sources, the interquartile range for research-grade sensors consistently exceeded a value of 1, a trend not observed for medium and consumer-grade sensors, especially at low radon levels during cigarette smoke generation.
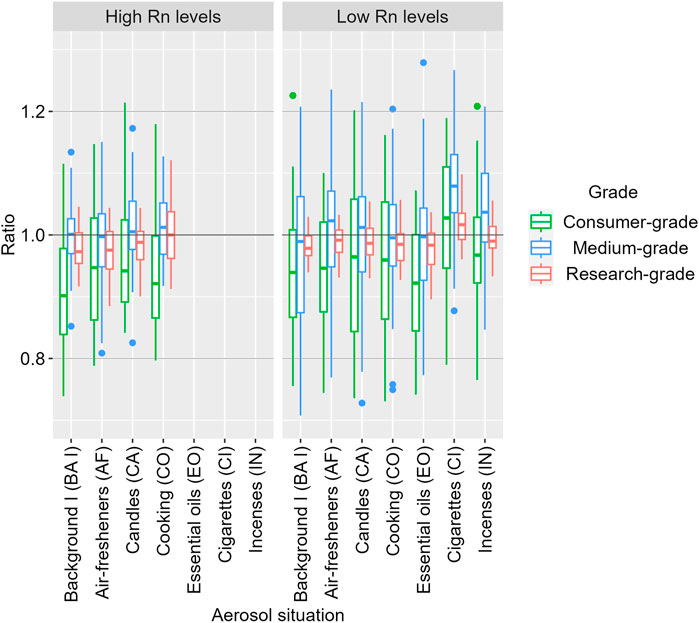
Figure 1. Distributions of ratios based on sensor grade (consumer-, medium-, and research-grade) under different aerosol types at high (right) and low (left) radon levels.
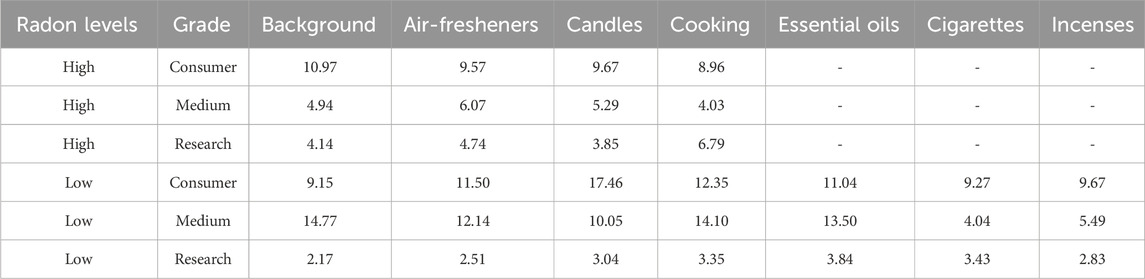
Table 3. Results of relative standard deviations (coefficients of variation) in percent for each ratios grouped according to the experiment, grade and aerosol situation.
Table 4 presents the results of pairwise Wilcoxon tests carried out to assess the influence of common indoor aerosols on radon sensors. Although most p-values were not significant, indicating no discernible influence of aerosols on radon measurements, statistically significant differences were observed for consumer-grade sensors during candles smoke generation at high radon levels and cigarettes smoke generation at low radon levels. However, the influence noted for candles at high radon levels was not evident at low radon levels. Overall, these results did not indicate any significant influence between measurements performed by devices of different grades under common indoor aerosol sources.
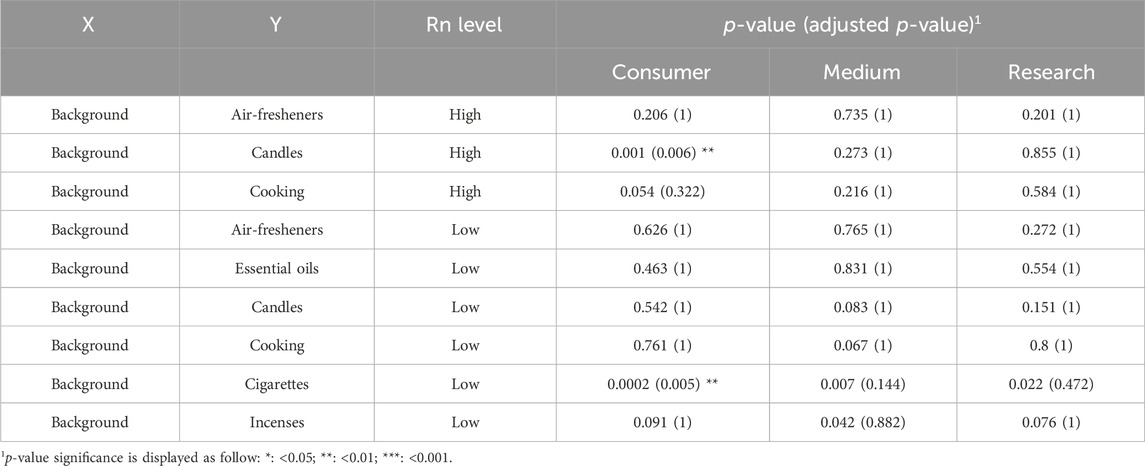
Table 4. Results of paired Wilcoxon tests according to the sensor grade. p-values adjusted with the Bonferroni method.
3.2 Radon detection method analysis
Figure 2 presents sensors’ ratios classified according to the radon detection method. The widest distributions were observed for sensors using alpha spectrometry, while those using ionization chamber and scintillation counter exhibited narrower spreads. At high radon levels, differences were identified between ionization chamber and scintillation counter sensors, while they appeared more similar at low radon levels. Across different aerosol sources, only sensors employing alpha spectrometry exhibited varying ratio distributions at both high and low radon levels. These observations align with the measured RSD presented in Table 5. At high radon levels, RSD ranged from 7.4% to 10%, 6.3%–7.5% and 2.3%–5.4% respectively for alpha-spectrometry, ionization chamber, and scintillation counter devices. This trend was also observed at low radon levels, where scintillation counter devices presented lower variability (2%–3.7%), while ionization chamber devices exhibited higher variability (5.6%–8.1%), and alpha-spectrometry devices the higher variability (8.4%–15.7%).
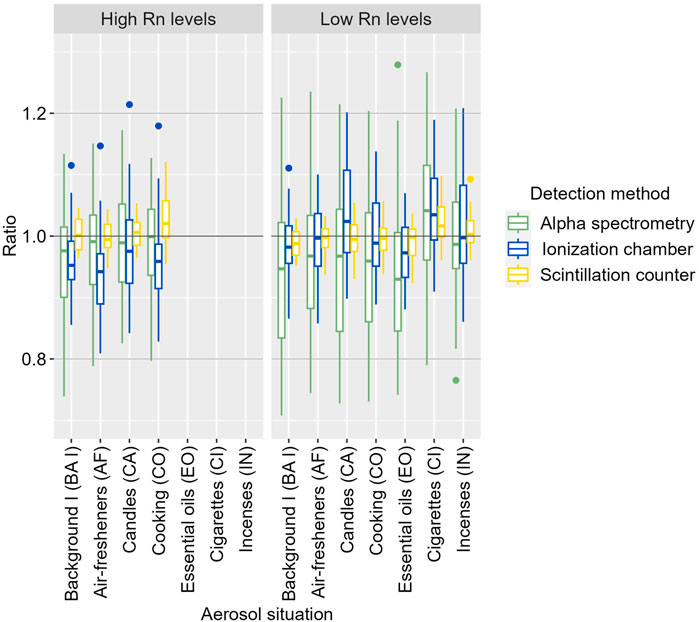
Figure 2. Distributions of ratios based on sensor detection method under different aerosol types at high (right) and low (left) radon levels.
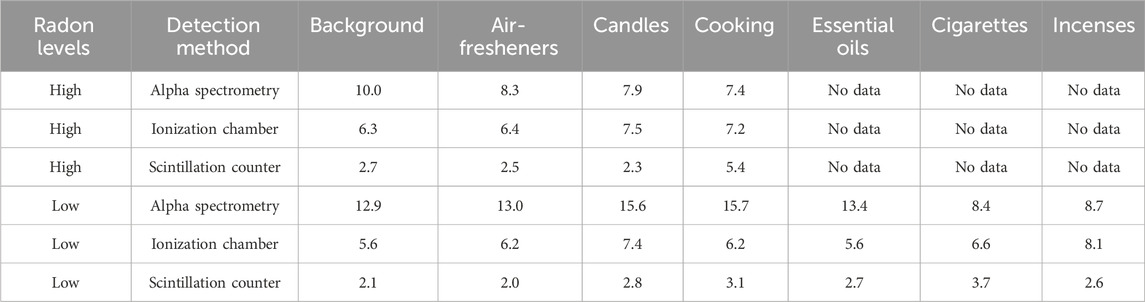
Table 5. Results of relative standard deviations (variation coefficients) in percent for each ratios grouped according to the experiment, detection method and aerosol situation.
These observations were further supported by paired Wilcoxon statistical tests, revealing significant differences for sensors using alpha spectrometry during candles and cooking at high radon levels and cigarette smoke at low radon levels (Table 6). Similar to the grade analysis, the influence detected with cooking and candle at high radon levels was not evident at low radon levels, despite higher aerosol concentrations. Notably, the lowest radon levels were recorded during cigarette smoke generation at low radon levels, suggesting potential challenges in detecting radon at these lower levels. Therefore, these results do not suggest any significant influence of aerosols on radon measurements in relation to different methods of detection.
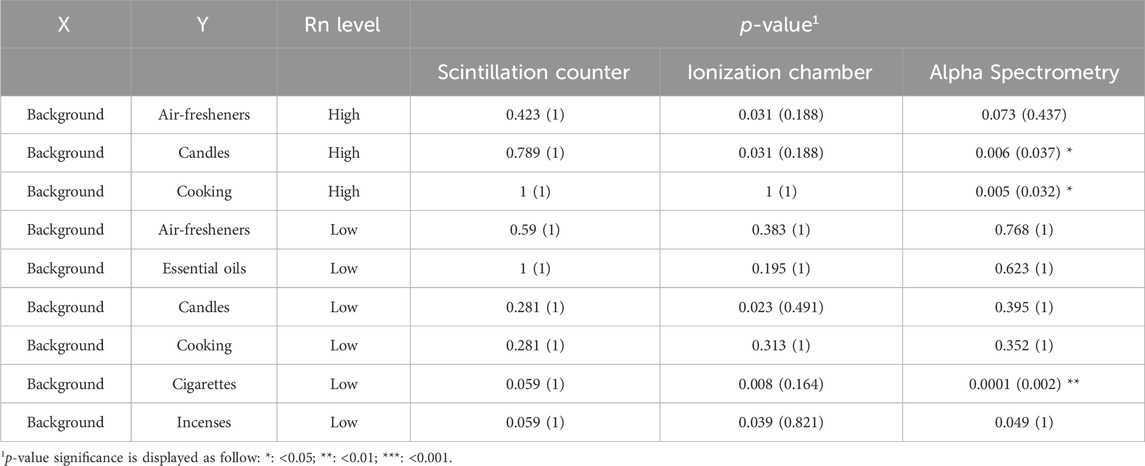
Table 6. Results of paired Wilcoxon tests according to the radon detection method. p-values adjusted with the Bonferroni method.
3.3 Equilibrium factor
Table 7 presents the descriptive statistics of the equilibrium factor monitored during the two experiments. The results provided at high radon levels highlighted a trend: higher aerosol levels corresponded to higher equilibrium factors. For instance, the average and the maximum values retrieved for the equilibrium factor were 0.46 and 0.79, respectively, for candles, while they were 0.05 and 0.1 for background levels. Unfortunately, due to sensor failure, the equilibrium factors assessed during the experiments at low radon levels were not deemed reliable and, consequently, are not reported.
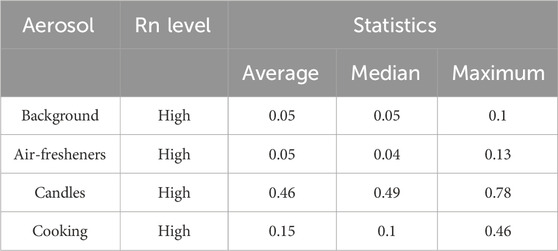
Table 7. Descriptive statistics of the equilibrium factor monitored during the experiments at high radon level.
4 Discussion
In this study, we aimed to assess the influence of common indoor aerosols on various radon devices, considering differences in sensor grades and detection methods. Radon sensors were exposed to different aerosol sources during at least 48 h at both high and low radon levels, encompassing six artificially generated aerosol types.
Overall, our results suggest that aerosols did not influence the majority of radon measurement devices tested in our experiment setup, while an increase of the equilibrium factor was observed at high radon levels. p-values below the significance level were obtained for research- and medium-grade sensors at both high and low radon levels, as well as for sensors using scintillation counter and ionization chamber methods. This implies that the indoor aerosol sources did not influence the performance of these sensors. Performance of consumer-grade sensors and those equipped with alpha-spectrometry was not altered when exposed to aerosols from air-fresheners, essential oils, candles, cooking, and incense. Thus, our experiments did not detect any influence of the tested indoor aerosol sources on the performance of radon sensors, irrespective of radon levels.
However, some statistically significant p-values were observed at low and high radon levels for consumer-grade sensors and those equipped with alpha-spectrometry during exposure to aerosols generated from candles, cooking, and cigarette smoke. These results should be interpreted cautiously for several reasons. Firstly, at low radon levels, the experiments with cigarette smoke had the lowest average radon levels. Previous studies have indicated lower performances for consumer-grade sensors, especially those utilizing alpha-spectrometry to detect radon, suggesting an alternative explanation for the observed differences (Rey et al., 2024). Secondly, at high radon levels, only consumer-grade sensors or those equipped with alpha-spectrometry had differences compared to background experiments with no aerosol generation. These sensors typically have lower sensitivity, as highlighted in their user manuals, implying that a substantial increase in radon concentration may not be detected as effectively as with other devices. Therefore, the distributions of ratios may be more influenced by the performances of sensors rather than the aerosol levels. Given these considerations, it is premature to conclude that aerosols influence the performance of real-time radon devices. Lastly, certain potential influences observed at high radon levels were not replicated at low radon levels, despite higher aerosol concentrations at the latter. To solidify these preliminary conclusions, it is essential to replicate these experiments using a similar setup.
While the experiment setup, protocol, and statistical analyses were robust, this study does present several limitations. Firstly, our results were obtained within laboratory settings, which may not fully mirror the diverse indoor climate conditions encountered in real-world buildings. To mitigate this potential limitation, future experiments should be conducted in settings that better reflect the variability of indoor environments. Additionally, regarding the examined sensors, two main limitations should be acknowledged: 1) some sensors were tested as single devices (without a pair), and 2) sensor conditions varied as they were not all brand new at the time of the experiments. Finally, we strongly recommend other researchers to monitor equilibrium factor while performing similar experiments. Notwithstanding these limitations, this study marks an initial effort to assess the influence of aerosols on radon device performances, accounting for sensor grade and radon detection methods.
5 Conclusion
This study provides insights into the impact of indoor aerosols type and concentration on the performance of real-time radon devices. We studied three different grades of real-time sensors based on their selling price, and equipped with three detection methods, at high (2′000–3′000 Bq/m3) and low (300 Bq/m3) radon levels. Through a robust experimental design, the results revealed that indoor aerosol levels had an insignificant influence on the performance of radon devices at both investigated radon levels. While some differences were observed, it is crucial to acknowledge that other factors, such as radon levels or inherent device performances, may also play a role. Consequently, our results suggest that radon devices remain largely unaffected by aerosol exposure. These findings imply that data obtained from real-time radon sensors can be deemed reliable, regardless of the type and concentration of aerosols encountered.
However, it is important to note that sources and concentrations of aerosols can still influence the clusterization process of radon decay products and thus affect the equilibrium factor. Our findings indicate an increase in the equilibrium factor at higher aerosol levels, which may carry implications for human health. Monitoring indoor aerosols alongside radon levels could prove beneficial, not only for assessing radon exposure but also for estimating the radon effective dose experienced by building occupants. In a broader perspective, radon and aerosols contribute significantly to indoor air quality, each exerting its unique influence on health through distinct mechanisms. This research contributes to a more detailed understanding of indoor air by shedding light on the reliability of radon detection devices available in the market, catering to the needs of researchers, professionals, and the general public alike.
Data availability statement
The raw data supporting the conclusion of this article will be made available by the authors, without undue reservation.
Author contributions
JR: Conceptualization, Data curation, Formal Analysis, Investigation, Methodology, Software, Validation, Visualization, Writing–original draft. NM: Resources, Supervision, Writing–review and editing. DL: Conceptualization, Methodology, Resources, Supervision, Writing–review and editing. JG: Conceptualization, Funding acquisition, Methodology, Project administration, Resources, Supervision, Validation, Writing–review and editing.
Funding
The author(s) declare that financial support was received for the research, authorship, and/or publication of this article. This research was funded by Euratom H2020 RadoNORM (grant number 900009), and the Smart Living Lab/HEIA-FR. Open access funding by EPFL Library, Rolex Learning Center.
Acknowledgments
We deeply thank Mrs. Martha Palacios and Mr. Fabio Barazza (Federal Office of Public Health of Switzerland), Mrs. Lucie Maret and Mr. Peter Peier (Federal Office of Metrology of Switzerland), Mr. Luca Pampuri and Mr. Nicola Ostinelli (SUPSI), Mr. Antoine Geiser (FHNW), Mr. Mauro Gandolla and Mr. Markus Oelhafen (ECONS SA), Mrs. Régine Gschwind (University of Franche-Comté) and Mrs. Hélène Tissot (ATMO-Bourgogne-Franche-Comté) for lending us different real-time radon sensors. We extend our warmest thanks to Mrs. Vanessa Terrapon, conservator and restorer at the Musée cantonal de géologie, and Mr. Henri Premat, technical manager at the University of Lausanne, as well as Henri Goyette, experiment assistant, for their valuable support during our experiments. The authors gratefully acknowledge the financial support provided by the Euratom H2020 Radonorm project, and the Smart Living Lab/HEIA-FR.
Conflict of interest
The authors declare that the research was conducted in the absence of any commercial or financial relationships that could be construed as a potential conflict of interest.
Publisher’s note
All claims expressed in this article are solely those of the authors and do not necessarily represent those of their affiliated organizations, or those of the publisher, the editors and the reviewers. Any product that may be evaluated in this article, or claim that may be made by its manufacturer, is not guaranteed or endorsed by the publisher.
References
Bertin Technologies S.A.S. (2012). AlphaGUARD - user manual. Available at: https://www.bertin-instruments.com/wp-content/uploads/secured-file/ALGU_Manual_2012-08_E.pdf.
Bertoni, G., El Hajj, T. M., and Gandolla, M. (2022). Radon risk assessment and mitigation deadlines. J. Eur. Radon Assoc. doi:10.35815/radon.v3.7790
Chen, J., and Harley, N. H. (2018). A review of indoor and outdoor radon equilibrium factors—Part I: 222Rn. Health Phys. 115 (4), 490–499. doi:10.1097/HP.0000000000000909
Demanega, I., Mujan, I., Singer, B. C., Anđelković, A. S., Babich, F., and Licina, D. (2021). Performance assessment of low-cost environmental monitors and single sensors under variable indoor air quality and thermal conditions. Build. Environ. 187 (January), 107415. doi:10.1016/j.buildenv.2020.107415
DFJP (2012). Ordonnance du DFJP sur les instruments de mesure des rayonnements ionisants (OIMRI). RS 941.210.5. Available at: https://www.fedlex.admin.ch/filestore/fedlex.data.admin.ch/eli/oc/2012/878/fr/pdf-a/fedlex-data-admin-ch-eli-oc-2012-878-fr-pdf-a.pdf.
Geffroy, J., and Sarcia, J. A. (1955). Contribution à l’étude des pechblendes françaises. Commis. à l’Énergie At. 380.
He, C. (2004). Contribution from indoor sources to particle number and mass concentrations in residential houses. Atmos. Environ. 38 (21), 3405–3415. doi:10.1016/j.atmosenv.2004.03.027
Health Canada (2022) Guide d’action contre le radon à l’intention des municipalités. Ottawa (Ontario): Santé Canada = Health Canada.
Heidary, S., Setayeshi, S., Ghannadi-Maragheh, M., and Negarestani, A. (2011). Monitoring and measurement of radon activity in a new design of radon calibration chamber. Radiat. Meas. 46 (8), 694–700. doi:10.1016/j.radmeas.2011.06.014
Hussein, T., Glytsos, T., Ondráček, J., Dohányosová, P., Ždímal, V., Hämeri, K., et al. (2006). Particle size characterization and emission rates during indoor activities in a house. Atmos. Environ. 40 (23), 4285–4307. doi:10.1016/j.atmosenv.2006.03.053
ICRP (2018). “Occupational intakes of radionuclides. Part 3,” in Annals of the ICRP (London: SAGE), 46.3/4
Janik, M., Tokonami, S., Kovács, T., Kávási, N., Kranrod, C., Sorimachi, A., et al. (2009). International intercomparisons of integrating radon detectors in the NIRS radon chamber. Appl. Radiat. Isotopes 67 (9), 1691–1696. doi:10.1016/j.apradiso.2009.03.006
Klepeis, N. E., Nelson, W. C., Ott, W. R., Robinson, J. P., Tsang, A. M., Paul, S., et al. (2001). The national human activity pattern survey (nhaps): a resource for assessing exposure to environmental pollutants. J. Expo. Sci. Environ. Epidemiol. 11 (3), 231–252. doi:10.1038/sj.jea.7500165
Mamont-Cieśla, K., Stawarz, O., Karpińska, M., Kapa\la, J., Kozak, K., Grządziel, D., et al. (2010). Intercomparison of radon CR-39 detector systems conducted in CLOR’s calibration chamber. Nukleonika 55 (4), 589–593.
Meisser, N. (2012). “La Minéralogie de l’uranium Dans Le Massif Des Aiguilles Rouges,” in Matériaux Pour La Géologie de La Suisse. Série Géotechnique (Bern: Office fédéral de topographie swisstopo), 2012/96.
Owen, M. K., Ensor, D. S., and Sparks, L. E. (1992). Airborne particle sizes and sources found in indoor air. Atmos. Environ. Part A. General Top. 26 (12), 2149–2162. doi:10.1016/0960-1686(92)90403-8
Papp, B., Cosma, C., and Cucos, A. (2016). International intercomparison exercise of active radon devices and passive detectors at the first east European radon symposium (FERAS 2012). Rom. Rep. Phys. 68 (1), 1–10.
Porstendörfer, J. (1994). Properties and behaviour of radon and thoron and their decay products in the air. J. Aerosol Sci. 25 (2), 219–263. doi:10.1016/0021-8502(94)90077-9
Rey, J. F., Meisser, N., Licina, D., and Pernot, J. G. (2024). Performance evaluation of radon active sensors and passive dosimeters at low and high radon concentrations. Build. Environ. 250 (February), 111154. doi:10.1016/j.buildenv.2023.111154
RStudio Team (2022) RStudio: integrated development environment for R. Boston, MA: RStudio, PBC. Available at: http://www.rstudio.com/.
Salma, I., Dosztály, K., Borsós, T., Söveges, B., Weidinger, T., Kristóf, G., et al. (2013). Physical properties, chemical composition, sources, spatial distribution and sinks of indoor aerosol particles in a university lecture Hall. Atmos. Environ. 64 (January), 219–228. doi:10.1016/j.atmosenv.2012.09.070
Skubacz, K., and Wołoszczuk, K. (2019). Size distribution of ambient and radioactive aerosols formed by the short-lived radon progeny. J. Sustain. Min. 18 (2), 61–66. doi:10.1016/j.jsm.2019.03.006
Swiss Federal Office of Public Health (2011) National action plan concerning radon 2012 – 2020. Bern, Switzerland: Federal Office of Public Health.
Swiss Federal Office of Public Health (2020) National action plan concerning radon 2021 – 2030. Bern, Switzerland: Federal Office of Public Health.
TECNAVIA SA (2016). RadonMapper - user manual. Available at: https://www.tecnavia.com/eedition/environment/wp-content/uploads/sites/7/2014/03/radonMAPPER-Leaflet-v2.0.pdf.
U.S. Environmental Protection Agency (2022). The national radon action plan 2021–2025. Available at: http://www.radonleaders.org/sites/default/files/2022-01/NRAP-2021-2025-Action-Plan-508.pdf.
Vargas, A., and Ortega, X. (2007). Influence of environmental changes on integrating radon detectors: results of an intercomparison exercise. Radiat. Prot. Dosim. 123 (4), 529–536. doi:10.1093/rpd/ncl161
Vaupotic, J. (2011). “Nano particles including radon decay products in ambient air,” in Chemistry, emission control, radioactive pollution and indoor air quality. Editor M. Nicolas (London, InTech). doi:10.5772/16369
Vincent, J. H. (1995) Aerosol science for industrial hygienists. Oxford, Tarrytown, N.Y.: Pergamon: Elsevier Science.
Wickham, H. (2016) Ggplot2: elegant graphics for data analysis. New York: Springer-Verlag. Available at: https://ggplot2.tidyverse.org.
Wilcoxon, F. (1945). Individual comparisons by ranking methods. Biom. Bull. 1 (6), 80. doi:10.2307/3001968
World Health Organization (2009) WHO handbook on indoor radon: a public health perspective. Geneva, Switzerland: World Health Organization.
World Health Organization (2023). Radon. Available at: https://www.who.int/news-room/fact-sheets/detail/radon-and-health January 25, 2023).
Keywords: radon measurements, indoor aerosol sources, performance comparison, sensor grades, radon detection methods, controlled environment
Citation: Rey JF, Meisser N, Licina D and Goyette Pernot J (2024) Evaluating the impact of indoor aerosols on the performance of real-time radon sensors. Front. Built Environ. 10:1407499. doi: 10.3389/fbuil.2024.1407499
Received: 26 March 2024; Accepted: 18 April 2024;
Published: 08 May 2024.
Edited by:
Fabrizio Ambrosino, University of Campania Luigi Vanvitelli, ItalyReviewed by:
Mumtaz Ali Khan, Bahria University, PakistanMostafa Yuness Abdelfatah Mostafa, Minia University, Egypt
Copyright © 2024 Rey, Meisser, Licina and Goyette Pernot. This is an open-access article distributed under the terms of the Creative Commons Attribution License (CC BY). The use, distribution or reproduction in other forums is permitted, provided the original author(s) and the copyright owner(s) are credited and that the original publication in this journal is cited, in accordance with accepted academic practice. No use, distribution or reproduction is permitted which does not comply with these terms.
*Correspondence: Joan F. Rey, am9hbi5yZXlAZXBmbC5jaA==