 Rubayet Bin Mostafiz1*
 Ayat Al Assi1
 Arash Taghinezhad2
 Carol J. Friedland1,3
 Robert V. Rohli3,4
 Md Adilur Rahim1
 Christopher T. Emrich5
 Melanie Gall6
 Eric Johnson7
- 1LaHouse Research and Education Center, Department of Biological and Agricultural Engineering, Louisiana State University Agricultural Center, Baton Rouge, LA, United States
- 2Institute for a Disaster Resilient Texas (IDRT), Texas A&M University at Galveston, Galveston, TX, United States
- 3Coastal Studies Institute, Louisiana State University, Baton Rouge, LA, United States
- 4Department of Oceanography & Coastal Sciences, Louisiana State University, Baton Rouge, LA, United States
- 5School of Public Administration, National Center for Integrated Coastal Research, University of Central Florida, Orlando, FL, United States
- 6Center for Emergency Management and Homeland Security, School of Public Affairs, Arizona State University, Phoenix, AZ, United States
- 7Department of Information Systems Technology, University of Central Florida, Orlando, FL, United States
Real-estate websites make it easy to find and access information about a home. Information on property value, square footage, number of rooms, quality of schools, crime rates, and more is readily available. Some of these platforms have begun integrating climate-related risks in generic ways. However, this information provides limited if any actionable value and is unlikely to guide people’s decision-making on buying or renting a home, deciding where to vacation, or investing in a property. Making residents aware of the natural hazard risks to which their homes may be exposed is an important component of making communities more resilient. Both a need and an opportunity exists to communicate hazard risk at the address-level in a meaningful and actionable way that goes beyond hazard probabilities and historic losses. One such example is the Flood Risk and Mitigation Calculator (FRAMC) embedded within the “HazardAware” platform, which educates users on the resilience of their community, neighborhood, and perhaps most importantly, their home (present or future, temporary or permanent). FRAMC enables users to assess their local flood risk, explore risk reduction options, and determine the financial viability of implementing potential risk mitigation options. This study outlines the development of the FRAMC and its integration into the larger framework of HazardAware. FRAMC’s key features include a user-friendly interface and draw on novel research related to innovative mitigation strategies. The intent of FRAMC is to enhance users’ ability to make informed decisions, take proactive measures in mitigating flood hazards, and contribute to the development of resilient, residential communities.
1 Introduction
In the United States, flood risk is ubiquitous. More than 40 million people live in the 100-year floodplain alone (Wing et al., 2018). Many more live in the 500-year floodplain and millions more are at risk from flash flooding and/or urban flooding outside of such designated Special Flood Hazard Areas (SFHA; Pollack et al., 2023). Reasons for living in a flood-prone area are manifold. Some live in flood-vulnerable areas because of the economic opportunities that exist in those areas (Correll et al., 2021). Others gain homeownership because homes may be less expensive than comparable homes outside of the federally mandated 100-year floodplain (i.e., the area that has at least a 1% chance of experiencing flood in a given year) or SFHA (Harrison et al., 2001; Tate et al., 2021). However, most residents may not make these decisions deliberately meaning they do not factor hazard-risk into their decision-making. Many were or are likely unaware of their flood exposure (Al Assi et al., 2022a) unless disclosed during a home purchasing process or required by their mortgage holder. Or their flood risk may have changed or is changing over time due to development, storm water management, and/or flood mitigation projects around them.
This unawareness of flood risk is persistent among U.S. residents. Few expect to flood in the next years (Tasantab et al., 2023) despite that fact that flooding is one of the most frequent and most damaging natural hazards. Between 1980 and 2022, the United States experienced 40 separate billion-dollar floods that caused a total of $184.1 billion (2022 consumer price index adjusted) in insured losses and 701 deaths (NOAA, 2022). Wing et al. (2022) estimates that average annual loss (AAL) is currently $12.1–14.1 inside and $17.9–20.1 billion outside the SFHA. Their projections for 2050 indicate an expected increase about 30%–37% ($16–19 billion) inside the SFHA and 19%–24.0% ($22–25 billion) outside the SFHA, respectively. Moreover, sea level rise is projected to increase by a foot or more along United States coastlines between 2020 and 2050, increasing the vulnerability of buildings in coastal areas to floods (National Ocean Service, 2022). Yet the public and community officials remain largely unaware of the economic realities that might facilitate decisions to invest in the future of their communities by mitigating the flood hazard (Mostafiz et al., 2022a). Therefore, understanding and educating the general public, particularly those making housing decisions, on economic loss from past events, future flood loss potential, and risk mitigation strategies is an important aspect of risk management (beyond mortgage, insurance, and tax costs) and fostering more resilient communities (National Research Council, 2012).
Despite the clear benefits of flood mitigation (Gall and Friedland, 2018; FEMA, 2018), the adoption of proven measures remains low (Botzen et al., 2019). Limited access to relevant information and unfamiliarity with the process of implementing flood mitigation techniques hinder adoption (Mostafiz et al., 2022a). Also, historical and hydrological flood data are often either inaccessible to the lay public and community decision-makers or too complicated for most community members to understand and utilize in their housing choices. The inclusion of flood risk information and potential benefits (e.g., financial, health) of mitigation measures into real-estate websites in a meaningful way could potentially change the trajectory of flood losses and help people make smarter location choices. For example, Katz et al. (2022) demonstrated a meaningful difference between homebuyers’ decisions when they have access to a flood risk communication tool.
Flood-focused web tools that can overcome these data, computational, and access-related hurdles would represent a solution to this problem and assist people and communities in enhancing resilience to the flood hazard. Such a flood risk communication tool would need to convey flood risk and associated losses or mitigation costs accurately using high-resolution flood modeling data and variables such as elevation cost amortized throughout the life of a mortgage either at the time of construction or as a remodeling effort, mortgage rate, flood insurance premiums and savings therein from having an elevated home considering Risk Rating 2.0 (RR2.0; Horn, 2021; Rahim et al., 2023; Susman, 2022), reduction of AAL due to mitigation, and impacts on home resale value.
In this context, HazardAware (2024) emerges as a novel platform that has been developed to address the lack of easily accessible and comprehensive information on hazard risk, loss, and mitigation. For flood risk estimation, existing literature offers various web tools, but HazardAware takes a significant step forward by enhancing the way individuals and decision-makers engage with flood risk mitigation. It is specifically designed to bridge the gap and provide users with critical information they need to make informed decisions regarding flood risk as well as other natural hazards risk in the Gulf Coast of United States. The Flood Risk and Mitigation Calculator (FRAMC) within the HazardAware platform makes information about flood risk, losses, and mitigation easily accessible. FRAMC empowers users to make informed choices and take action to reduce flood risk by translating complex cost-benefit calculations into actionable information.
The goal of this research is to introduce and outline the development of the FRAMC, providing a comprehensive description of its features and methodology related to a) development of a comprehensive framework for flood risk assessment tools that can be used in web applications for common types of residential buildings in the United States, (b) calculation of the economic savings from flood mitigation actions and the payback period to assist users in understanding their flood hazard risk and making improved mitigation decisions, and (c) delivery of educational resources to assist landlords, owners, and tenants (i.e., renters). By doing so, the aim is to enable users, including researchers, scientists, and homeowners, to effectively access and utilize the functionalities of this tool.
The main contribution of this paper is shedding light on the development of FRAMC within HazardAware, marking a collaborative effort to bolster the platform’s capacity in addressing specific hazards such as flood. While HazardAware provides users with broad, census-level data on various disaster events—like flood, wind, drought, wildfire, and lightning—based on SHELDUS (2024) historical loss data, FRAMC takes a more granular approach. Unlike the general census-level trends in HazardAware, which do not derive from detailed, individual building data, FRAMC enables users to specifically assess and modify home properties and evaluate the benefits of applying elevation strategy to reduce risks associated with flood hazards.
The necessity of introducing FRAMC lies in its crucial role in providing homeowners and decision-makers with targeted risk assessments and actionable insights tailored to residential structures. This capability not only facilitates informed decision-making but also strengthens community resilience planning efforts by empowering stakeholders with the tools to mitigate flood-related risks effectively. The dissemination of detailed methodology and practical applications in this paper aims to raise awareness among researchers, academia, and practitioners. This effort is pivotal in encouraging the adoption and utilization of FRAMC across various sectors. Also, integrating FRAMC and methodology into curricula related to risk management, engineering, and environmental studies equips students with practical experience in understanding flood risk assessment and mitigation strategies and fosters a culture of resilience by embedding practical tools and knowledge into academic frameworks.
2 Background
2.1 Web-based flood risk communication
Several in recent years (Menegon et al., 2018; Whitehead and Booker, 2019; Strapasson et al., 2022; Mostafiz et al., 2022a) have suggested that web tools are effective for long-term planning. Disaster risk communication tools have functionality for forecasting hazard threats (Khalid and Ferreira, 2020; IFIS, 2024), showing hazard insurance requirements and benefits (Friedland et al., 2023), chronicling historical events (First Street Foundation, 2020; First Street Foundation, 2021),estimating hazard risks and costs (Ward et al., 2020), and providing management tools and educational and outreach materials (Holz et al., 2006; Almoradie et al., 2013). However, each of these aspects is specific and no single tool offers all of these functionalities. Recognizing the utility of natural hazard risk communication for a variety of applications, several web-based tools for multi-hazard risk assessment have recently been launched. Mostafiz et al. (2022a) provided a comprehensive inventory of the major web-based flood risk communication tools for such purposes, which is amended here due to the rapidly-changing landscape of online resource availability, and to capture recent updates to the existing tools, new tools, and broader hazard awareness tools focusing on flood hazards.
In this context, real-estate websites like Zillow and Realtor play a pivotal role in the property market, serving as widely used online platforms for identifying available properties and assessing residential real estate features. Among the crucial information they provide, environmental risk factors, such as flood risk, take center stage. These platforms offer valuable insights into flood risk through metrics like the Risk Factor, details on FEMA-designated flood zones, and information on available flood insurance.
Risk Factor shows the risk at the individual property level for multiple hazards, with the risk of flooding ranked on a scale from 1 to 10 with demonstration of how the flood risk is projected to change in the next 30 years. Recent improvements to Risk Factor include flood insurance cost and flood damage estimators based on multiple flooding scenarios (First Street Foundation, 2020; First Street Foundation, 2021). However, Risk Factor does not include costs and benefits of mitigation options.
FEMA’s National Risk Index (NRI; Zuzak et al., 2022; Zuzak et al., 2023) represents the traditional risk assessment approach exemplified by its data-heavy application that considers losses to agriculture, buildings, and population, resulting from 18 common natural hazards in the United States including flood, though solely at the county and census tract level. Expected annual loss, social vulnerability, and community resilience are considered the main components of the calculation (Burns et al., 2018; Zuzak et al., 2022; 2023). While helpful, especially because risk is defined in terms of dollars in the form of AAL, NRI is limited by the fact that the most localized spatial scale offered is at the census tract level; individual homes even within the same census tract may have substantially different risks to some hazards, particularly flood. Moreover, the NRI stops short of offering tools or suggestions regarding the mitigation of these risks.
The Climate Mapping for Resilience and Adaptation (CMRA, 2024) is another interactive web-based map tool that helps community organizations understand recent extreme weather occurrences, including extreme heat, drought, wildfire, flooding, and coastal inundation in the United States using real-time climate data. Although this tool provides general information about the risk of each hazard separately, CMRA suffers from many of the same shortcomings as NRI. In addition, it lacks a true representation of risk, as no AAL calculations or other surrogates for risk in terms of the consequence of extreme weather occurrences are offered. These features are required to communicate risk and promote resilience at the individual and community scales.
Of the many other flood risk assessment tools that have been developed in recent years to provide educational flood prevention tools for residents and community decision-makers, each is developed for specific purposes within a specific geographical location. Many of these were reviewed in Mostafiz et al. (2022a), but “Flood Safe Home” (FSH), developed at Louisiana State University, has since become operational. FSH is an interactive, decision-making website to provide customized information about optimal freeboard (i.e., first-floor height above the base flood elevation) for individual homes based on construction cost, insurance premiums, and flood risk reduction, with AAL at the heart of assessing the monetary risk of flooding to the property (Friedland et al., 2023). The focus on new construction, restriction to pre-RR2.0 premium calculations, and regional limitations to coastal Louisiana remain shortcomings of FSH.
In summary, while existing tools offer actionable information regarding enhancement of flood resilience for residential properties, most tend to communicate only risk information without offering specific solutions to the end user. A web tool that optimizes freeboard benefit-to-cost ratio at the individual building scale, for homeowners, landlords, tenants, developers, engineers, architects, and planners, applicable to both new and existing construction, is needed. Such a tool supports residents across a wide range of locations by facilitating individual and community leader decision-making based on quantitative, long-term, actionable information.
2.2 Flood risk assessment approaches
Recent approaches to assessing flood risk have relied upon the flood loss vs. flood depth functions contained within widely-available flood impact models such as FEMA’s Hazus (Scawthorn et al., 2006a; 2006b; Ding et al., 2008; Tate et al., 2015; Rahim et al., 2024) and Flood Assessment Structure Tool (FAST; Mostafiz et al., 2021a) and U.S. Army Corps of Engineers (USACE) Hydrologic Engineering Center’s Flood Impact Analysis (HEC-FIA; Lehman et al., 2014; Brackins and Kalyanapu, 2016; Mokhtari et al., 2017). For example, Mostafiz et al. (2021a) found that including building features such as presence/absence of a basement and number of stories, along with loss functions customized for homes with these features, enhances flood loss model output, regardless of whether Hazus, FAST, or HEC-FIA is used. A HEC-FIA-based comparison of present and future flood losses for a case study area of coastal Louisiana, United States, led Mostafiz et al. (2021b) to conclude that a substantial increase in future flood loss is likely due to acceleration of the combined effects of subsidence and eustatic sea-level rise.
Gnan et al. (2022a) cautioned that Hazus and other similar models fall short by limiting their loss calculations to those incurred at a few discrete return periods (i.e., 10-, 50-, 100-, and 500-year) for which data are commonly available, and that a more refined depth-damage-based numerical approach that includes the fully-integrated range of return periods improves flood risk estimates (i.e., AAL) substantially. Al Assi et al. (2022a) advanced the method of Gnan et al. (2022a) to apportion flood risk to homes by owner-occupancy type (i.e., homeowner, landlord, and tenant), while considering the economic risk not only to structure itself, but also to its contents and that resulting from loss of use while unoccupied (i.e., rent loss by landlords and relocation expenses for homeowners or tenants).
Disaster models like Verisk’s AIR Inland Flood Model (IFM) use a probabilistic methodology to evaluate flood risk dynamically at various spatial scales. The AIR IFM estimates exceedance probabilities at several spatial scales, ranging from individual buildings to regional and national levels, by simulating hundreds of possible flood scenarios (Wojtkiewicz, 2016). To effectively depict inland flooding dynamics, the model incorporates hydrologic and hydraulic simulations, including flood routing, precipitation-runoff connections, and statistical downscaling (Wojtkiewicz, 2016). The AIR IFM’s capacity to assess mitigation strategies is one of its main advantages. The model takes into consideration the main risk factors, including construction type, location, occupancy, elevation, as well as secondary risk modifiers such freeboard height and protection for service equipment (Wojtkiewicz, 2016). The AIR IFM helps homeowners, insurers, legislators, and community planners make risk-informed decisions by fusing financial loss modeling with high-resolution hazard mapping.
2.3 Flood risk mitigation options
Each home has an economically optimal flood mitigation solution, with the investment offset by the avoided losses. Potential flood mitigation options are elevation (Al Assi et al., 2024; Botzen et al., 2013; Xian et al., 2017; Montgomery and Kunreuther, 2018; Zarekarizi et al., 2020), buyout and acquisition (Mobley et al., 2020), relocation (Marino, 2018), reconstruction (Dube, 2020), wet floodproofing (Aerts et al., 2014; Shan et al., 2022), dry floodproofing (Botzen et al., 2017; de Ruig et al., 2020), local flood barriers (Nofal and van de Lindt, 2020), and flood walls (Alabbad et al., 2022). Yildirim and Demir (2021) demonstrated that low-cost mitigation options such as dry floodproofing and wet floodproofing are effective for immediate flood impact reduction, but that elevation and relocation offer long-term solutions for permanently reducing flood risk. Elevation was found to be the most cost-effective option for individual residential buildings in Louisiana according to an analysis of reported costs incurred for post-hurricane flood damage mitigation (Taghinezhad et al., 2020). Further, in an evaluation of elevation and flood barrier mitigation scenarios for buildings within communities, Gupta et al. (2022) recommended elevation over flood barriers as a mitigation strategy.
In recognition that elevation is often the most effective option, especially for new construction, Gnan et al. (2022b) identified optimal freeboard for single-family homes through life-cycle benefit-cost analysis in Monte Carlo simulations to probabilistically simulate flood events for flood risk analysis. Al Assi et al. (2022a) confirmed that approximately two feet of freeboard provides the most economically advantageous mitigation for homes located in the SFHA. Elevating a home outside the SFHA also reduced median AAL between 0.06 and 0.23 percent of building replacement value when elevating by an additional 1 and 4 feet, respectively, above ground elevation (Al Assi et al., 2022b). Gnan et al. (2024) further partitioned the economic advantages of mitigation via freeboard from the perspective of the homeowner, landlord, tenant, and flood insurer. In an analysis of homes flooded by Hurricanes Katrina or Rita, Al Assi et al. (2023) found that elevating existing homes funded by CDBG-DR Road Home Program is generally cost-effective if the home is in service for more than 12 years after elevation, with a benefit-to-cost ratio (BCR) of up to 1.7.
Despite the significant advancements in flood risk assessment webtools, approaches, and mitigation options, knowledge—particularly among the general public—remains lacking to propel societal understanding of the value of flood mitigation through elevation to support individual- and community-level decision making. Spatial variations in flood hazards require individualized analyses, highlighting the need for a comprehensive web tool at the individual building scale. Flood mitigation web application tools should provide quantitative, long-term, actionable information based on factors like the BCR and desired payback periods. By addressing this gap, users can make informed decisions and assess the feasibility of flood mitigation measures, leading to resilient communities and reduced flood impacts in the future.
3 Methodology
In HazardAware, building-level flood risk analysis integrates both front-end and back-end components to provide accurate risk calculations and mitigation savings estimates (Figure 1). The front-end interface allows users to input information, which then proceeds through back-end system to gather essential building information such as flood parameters and flood zone data (based on Flood Insurance Rate Maps) from the application’s database. Using these data and through a calculation framework, FRAMC generates valuable outputs presented on the front-end. FRAMC calculates the flood risk before and after elevating the home in terms of AAL and determines the potential savings that can be achieved through this mitigation measure and the payback period, defined as the number of years from the present until the benefits equal the cost. This framework structure allows complex data processing and calculations to be managed effectively in the back end, while the front end offers a user-friendly interface that guides property owners through customized building information and flood mitigation options.
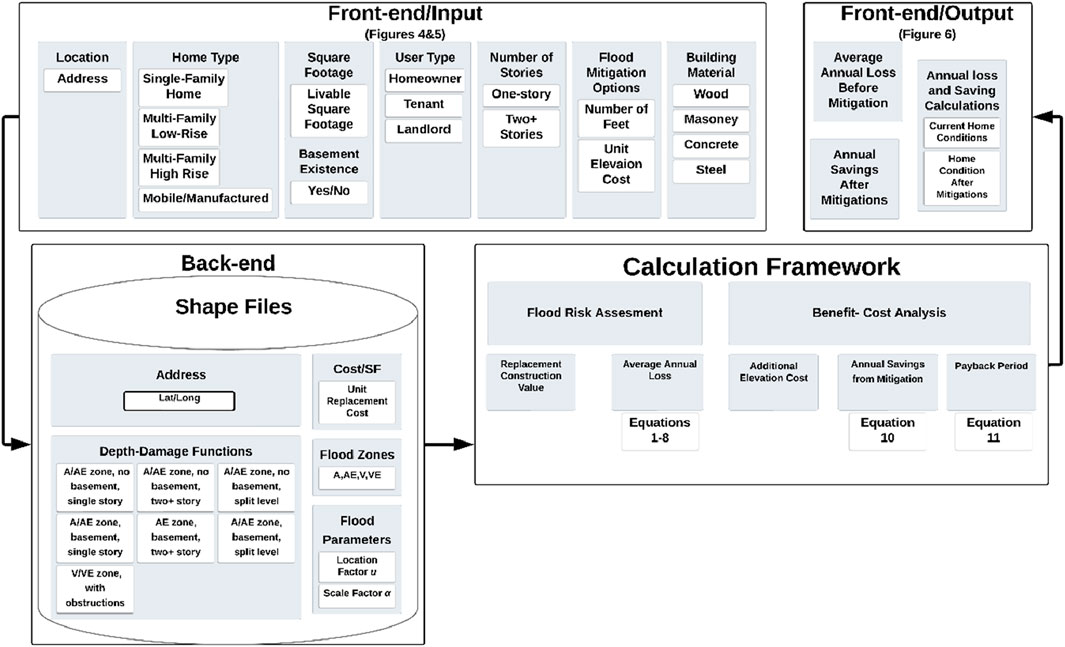
Figure 1. Flood risk and mitigation calculator tool framework to support user decision-making.
3.1 Data
FRAMC is integrated into HazardAware, which was developed for 196 counties/parishes along the United States Gulf Coast and includes more than 14.6 million properties and 34.4 million people in Florida and coastal zones (NOAA, 2023) of Alabama, Louisiana, Mississippi, and Texas (Figure 2). Figure 2 reveals clear spatial variation in population exposure across the Gulf Coast, with notably high concentrations in coastal counties of southeastern Texas (particularly Harris County), central and southern Florida, and portions of Louisiana, where several parishes show exposure levels exceeding 100,000 residents—highlighting significant regional disparities that are critical for targeted flood risk mitigation and planning.
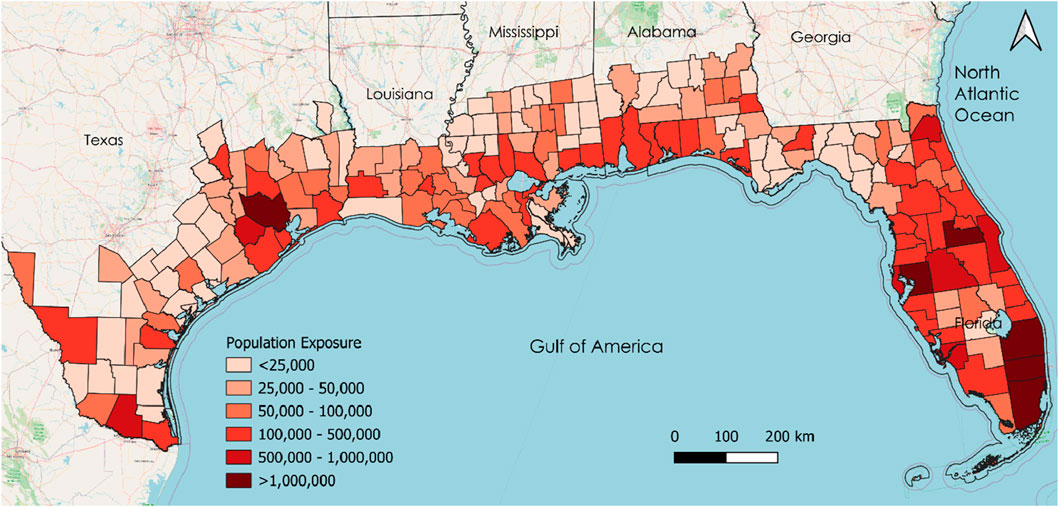
Figure 2. Coastal counties/parishes included in the flood risk and mitigation calculator in HazardAware.
The U.S. Gulf Coast has a long and devastating history of record-breaking hurricanes and floods (Organization of American Historians, 2007). Figure 3 illustrates the number of billion-dollar disaster events and the total losses in billions of USD across different time periods from 1980 to 2024. This graph highlights the impact of billion-dollar flooding events affecting Gulf Coast States (AL, FL, LA, MS, TX) from 1980 to 2024 (NCEI, 2024).
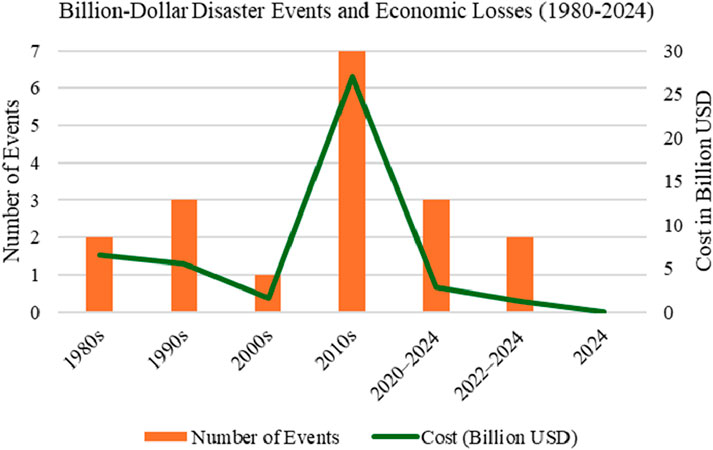
Figure 3. Number of billion-dollar flooding events and total losses in billions of USD in Gulf Coast States (AL, FL, LA, MS, TX) from 1980 to 2024.
Some of the most catastrophic events in the region’s history have left lasting impacts on communities and infrastructure. One of the most destructive events was the Great Mississippi Flood of 1927, which inundated over 27,000 square miles, displaced approximately 630,000 residents, and caused widespread structural damage, particularly across the Mississippi Delta (Barry, 1997). Hurricane Betsy in 1965 was the first U.S. hurricane to cause over $1 billion in damages, inundating 164,000 homes. It hit the Bahamas as a category 3 hurricane and from there, the storm moved along the coast of Florida, causing flooding in the low-lying coastal areas of the region. Betsy made landfall in New Orleans as a category 4 hurricane, with wind speeds reaching up to 140 mph as it moved across the state. Betsy’s storm surge reached Lake Pontchartrain, and leaves along some of New Orleans’ canals failed. An estimated 164,000 homes were flooded (LSU Libraries, 2024a). The 2005 Atlantic hurricane season was one of the most active in recorded history, generating seven major hurricanes such as Dennis, Wilma, Rita, and Katrina. Collectively, these storms caused over 2,000 fatalities and more than $125 billion in damage (Organization of American Historians, 2007). Hurricane Katrina, the costliest storm in U.S. history, was among the most devastating and is a recent example of the Gulf Coast’s vulnerability to severe hurricanes. Hurricane Katrina claimed over 1,800 lives and flooded New Orleans’ levees which was followed weeks later by Hurricane Rita, causing $10 billion in damage and hitting 25,000 square miles in Texas (Mayer et al., 2008). Approximately 1.5 million residents from Louisiana, Mississippi, and Alabama evacuated during Hurricane Katrina, and about 40% never returned. The disaster left thousands without homes and caused New Orleans’ population to drop by half. In the 10 months following the storm, an estimated 95,000 New Orleans residents lost their jobs, and hundreds of thousands of homes were inundated by floodwaters (LSU Libraries, 2024b).
More recently, in August 2016, a stationary low-pressure system brought unprecedented rainfall totaling 648.3 mm (25.5 inches) over 3 days near Baton Rouge, Louisiana, leading to flash and river flooding that affected over 60,600 homes, displaced tens of thousands of people, and resulted in at least 13 fatalities (van der Wiel et al., 2017). Texas has also experienced frequent and severe flood events, Hurricane Harvey in 2017 ranks among the most destructive and expensive storms in U.S. history, which brought over 1,500 mm (60 inches) of rainfall in some areas, flooded more than 204,000 homes, and resulted in damages totaling approximately $125 billion (Blake and Zelinsky, 2018). In Texas alone, at least 68 people died as a direct result of the storm—the highest number of direct fatalities from a tropical cyclone in the state since 1919 (National Environmental Satellite, Data, and Information Service (NESDIS), 2018).
In Florida, Hurricane Ian in 2022 generated extreme storm surge and intense rainfall, leading to extensive inland and coastal flooding that damaged over 150,000 structures, caused 150 fatalities, and exceeded $112 billion in losses (National Hurricane Center, 2023). These historical and recent events demonstrate the recurrent and multifaceted nature of flooding in the region—ranging from riverine to pluvial to storm surge events—and underscore the importance of incorporating long-term flood history, exposure, and damage records into risk assessment frameworks to inform future mitigation and adaptation strategies.
FRAMC utilizes two types of data: “user-generated data” and “embedded data” (Figure 4). User-generated data involve inputs directly provided by individual users through FRAMC’s front-end component such as home address. Upon entry, the user’s home address triggers the selection of property information from a localized version of the ATTOM (2024) database. This auto-generated data includes basic attributes of the home such as building type, livable area, and number of stories. Default values are preloaded, but users have the flexibility to modify these entries, enabling them to verify and update embedded data as needed. However, all user inputs must adhere to the standards set by embedded data, ensuring consistency and accuracy in assessments. For flood mitigation strategies, users also have the flexibility to input and adjust mitigation options, including details like the number of feet for potential elevation and the unit elevation cost.
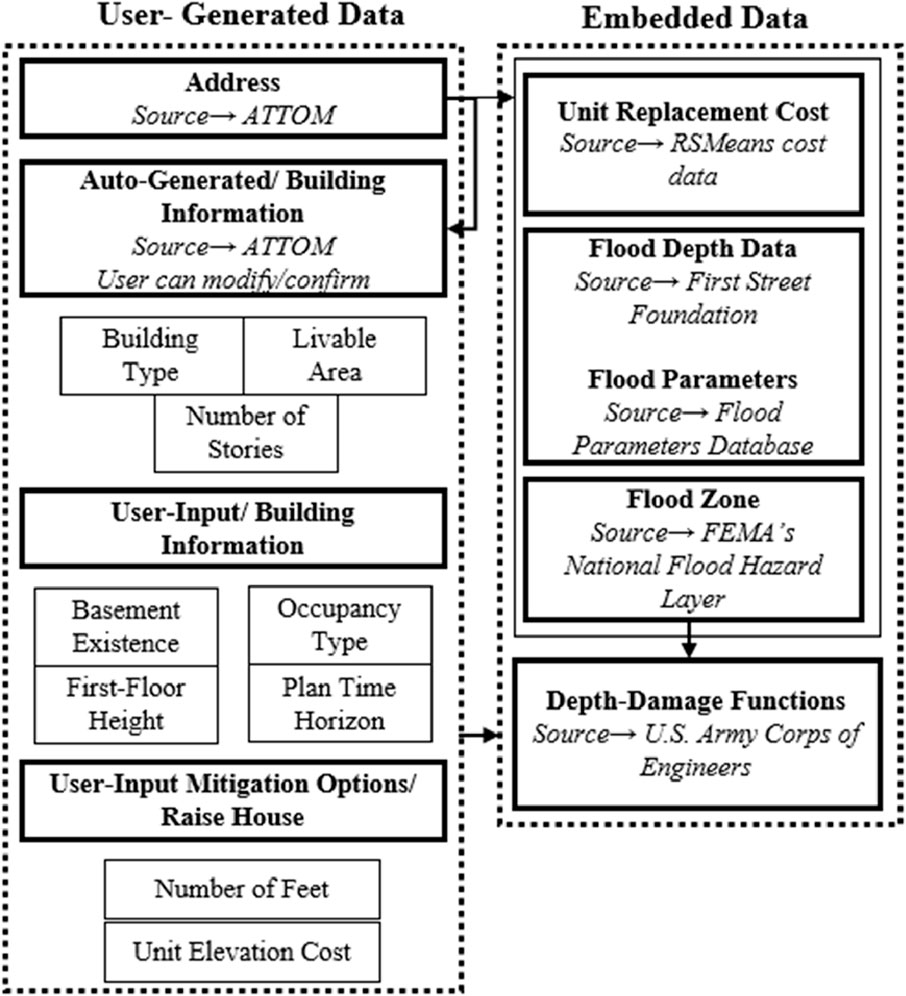
Figure 4. User-generated and embedded data in flood risk and mitigation calculator (FRAMC).
Embedded data encompass foundational data sets within FRAMC, including location-specific information from ATTOM such as the unit replacement cost is obtained from RSMeans cost data (Doheny, 2021) and data describing the local flood risk (e.g., flood parameters).
Flood parameters represented by the location (
Flood zone information obtained from FEMA’s National Flood Hazard Layer (FEMA, 2023) are assigned for each home integrated in the ATTOM database based on its latitude and longitude. This information played a major role in selecting an appropriate flood loss function for the building, its contents, and use. By incorporating the flood zone data, flood risk is evaluated more accurately.
3.2 Flood risk assessment
This section details the procedure for performing flood risk assessment in terms of AAL and benefit-cost analysis based on annual savings and payback period. This flood risk assessment framework is used to determine individualized risk and risk reduction with elevation to support user decision-making.
The flood hazard at the building location is characterized by the Gumbel extreme value distribution (GEVD; Gnan et al., 2022b; Patel, 2020; Rahim et al., 2021; Singh et al., 2018). GEVD is one of the most widely used probability functions for predicting flood peaks (Patel, 2020; Parhi, 2018) and evaluating flood frequency to determine return periods. Studies have shown that it is more suitable than log-normal distributions, the generalized extreme value, and Log Pearson type III (Onen and Bagatur, 2017). GEVD is particularly effective for modeling annual exceedance probability of expected flood depths since it is especially useful for simulating skewed distributions, which are associated with rare events (Gnan et al., 2022a). The cumulative distribution function (CDF) of the Gumbel distribution is the annual probability that a stochastic variable X is less than or equal to a flood event of height
where
The relationship between a flood event and a building’s associated loss (in terms of percentage of building replacement value) is represented using a loss function, generally called a depth-damage function (DDF). The two primary sources of DDFs in the United States are the U.S. Army Corps of Engineers (USACE) and the Flood Insurance Administration (FIA). In USACE, DDFs are used for inland areas (U.S. Army Corps of Engineers (USACE), 2000; USACE, 2003) and FIA DDFs are used for coastal areas (FEMA, 2013). Specifically, the USACE DDFs used are: (a) A/AE zone, no basement, single story; (b) A/AE zone, no basement, two + story; (c) A/AE zone, no basement, split level; (d) A/AE zone, basement, single story; (e) A/AE zone, basement, two + story; and (f) A/AE zone, basement, split level. The FIA DDF is used for the (g) V/VE zone, with obstructions. To compute the total restoration time as a function of flood depth/elevation for homeowner, landlord, and tenant, FEMA (2013) is used here.
The average per-square-foot construction cost for the zip code (inferred from the latitude-longitude coordinates) of each type of residential building is collected from RSMeans cost data (Doheny, 2021), which is among the most common construction cost sources in the United States (Taghinezhad et al., 2021). Multiplication of per-square-foot construction cost by livable area (i.e., square footage) yields the building replacement value (BRV), which is then multiplied by the proportion of loss, calculated from the flood loss functions, to compute the monetary value of flood loss. These values are then projected to 2022 costs using the national average historical consumer price indices (Officer, 2022) for 2020 and 2021 (U.S. Bureau of Labor Statistics, 2023).
3.3 Flood risk expressed as average annual loss (AAL)
AAL (Equation 3) is the mean of the loss-exceedance probability L(P) distribution and is calculated by integrating the flood loss function
where
The loss due to flood is segregated among owner-occupancy types. The homeowner loss consists of building loss, content loss, and loss of use. The AAL dollar value for homeowners,
The landlord loss only includes the building loss and loss of use. Because landlords do not live in the building and have minimal contents inside the building, the content loss is considered zero for the landlord. Therefore, the dollar value of AAL for the landlord (
Finally, the tenant’s loss consists of the content loss and loss of use. The AAL dollar value for the tenant (
3.4 Moving beyond flood risk to value mitigation options
Elevation is an expensive, yet viable, long-term option for both homeowners and landlords, but tenants do not have the authority to mitigate by modifying the building itself, including elevation. FRAMC includes information on all of the owner-occupancy types by not only providing economic estimates for homeowners and landlords, but also by giving non-owner tenants information about flood risk and how to mitigate flooding impacts without building modifications so they can make more informed housing decisions, including where to live, whether to purchase flood insurance, and whether to develop a plan for moving belongings to a higher floor.
Elevating existing buildings is much more costly than elevating during the initial construction (Aerts et al., 2013). FRAMC considers the number of elevation feet required, the livable area of the building, and the average cost per square foot of the home area, which is predetermined. However, it is important to note that the provided cost estimates within the tool are intended as rough approximations, serving the convenience of users in their calculations. To ensure greater accuracy, the web tool prompts users to modify the cost information based on quotes obtained from local contractors, considering the specific conditions of their buildings.
It is worth mentioning that HazardAware also provides practical guidance for short-term mitigation for homeowners, landlords, and tenants in the form of a sandbag calculator, which determines the number (
Furthermore, HazardAware offers valuable recommendations and actions to help homeowners and renters mitigate flood risk. It provides information about access to real-time hazard information, enabling users to stay informed about ongoing hazards. For homeowners specifically, HazardAware offers additional measures such as wet floodproofing techniques, installation of sewer backflow valves, and securing fuel tanks. These measures aim to enhance flood resilience and reduce potential damage but are not (yet) implemented in FRAMC.
3.5 Benefit-cost analysis
The average annual savings from mitigation (
The payback period,
4 Web-based flood risk and mitigation calculator tool
FRAMC is a decision-making tool consisting of front-end and back-end development (Figure 4). The front-end focuses on what users virtually see on their browser or application. The back end, on the other hand, makes the website function. FRAMC of HazardAware is a C#.NET (Programing Language) application that follows a “forms-based” architecture and utilizes an MS SQL (Structured Query Language) server database. This architectural approach ensures a proven separation between the user interface, which constitutes the front-end, and the business logic along with the database, forming the back end. This clear division allows for effective management and maintenance of the application, making it easier to handle and update each component independently. The forms-based design is a reliable choice for deploying FRAMC within HazardAware as it ensures a seamless and organized user experience while handling data processing and management efficiently in the background.
4.1 Back-end system
The back end is responsible for various critical tasks, such as querying the database server, consuming web services, and generating reports. It operates within a secure environment, completely abstracted from the end-user. To ensure robust and secure database interactions, HazardAware utilizes LinqToSQL as the SQL framework, which facilitates the creation of parameterized query statements, effectively preventing vulnerabilities like SQL injection. To optimize the performance and query times for large data sets, particularly from sources like ATTOM, numerous indexes are strategically added to key tables in the database. The communication with third-party web services, such as FEMA, is based on the Representational State Transfer (ReST) protocol. When accessing services that offer proprietary data, FRAMC of HazardAware generates temporary tokens seamlessly and includes them in the ReST request without requiring any action from the user. The streamlined development process leverages the extensibility of the.NET Framework through the “NuGet” package manager, which allows the addition of beneficial packages for PDF report generation and JSON data parsing, reducing overall development time.
4.2 Front-end system
The front-end utilizes traditional web-based technologies like Hypertext Markup Language (HTML), Cascading Style Sheets (CSS), and JavaScript to deliver an immersive user experience. HTML is used to build the basic structure, with CSS styling the website, and then JavaScript is used to manipulate and validate the data as well as update HTML and CSS. The application relies heavily on the ArcGIS JavaScript API to present numerous data-driven maps that convey effectively property-related information and its surrounding area. To ensure consistency in user interface elements, FRAMC of HazardAware employs jQuery (JavaScript library that simplifies HTML document) and other third-party JavaScript libraries. For displaying charts, the team opted for.NET charting due to its seamless integration with the.NET server-side objects. To enhance user understanding, interface elements such as modal popups, customized tooltips, and discernible color schemes are implemented. Moreover, collapsible and scrollable page sections are introduced to optimize the use of the user’s screen space. In terms of security, the.NET framework’s forms-based architecture inherently incorporates protection against cross-site scripting, which is particularly crucial for forms that gather user information for reporting and mitigation purposes.
5 Implementation of flood risk and mitigation calculator tool (FRAMC)
This section describes the developed features of the web-based FRAMC decision-making tool and the detailed analyses of the customized report. In addition, a case study is included to show the functionalities and implications of the developed web-based decision-making tool in HazardAware.
The HazardAware platform was developed using user-centered design (Stephens and Altamirano, 2024). Members of the HazardAware research team interviewed residents and professional stakeholders during the development of the interface. On the one hand, these interviews produced changes to the design of the user interface, and on the other, helped the development team better understand user needs during the development phase. The perception of flood risk information and selected mitigation options was tested using choice-experiments. The platform offers a user-friendly experience, requiring that the user only input an address. For users interested in additional risk insights can explore more detailed information via tabs. The “Be Risk Ready” tab is of particular value; it requires information related to the home, building construction, and available mitigation options, and returns the flood risk and the value of applying mitigation strategies. The options presented in this tab depend on the type of home and materials used.
While most web-based tools, such as NRI, provide risk assessments at the census-tract level, FRAMC, like FSH and Risk Factor, offers assessments at the individual property level. The primary distinction between these latter tools is that FSH focuses on new construction homes, whereas Risk Factor and FRAMC focus on existing homes. In both FRAMC and Risk Factor, the user can edit the default home information extracted from the building address details if desired. FRAMC distinguishes itself from Risk Factor by incorporating a consideration of owner/occupancy types and taking future scenarios into account. In the specific example shown in Figure 5, the input of “single-family home” and living area equal to 2,500 square feet then initiates a prompt to input the remaining home information, such as the elevation above ground level and the type of owner/occupant (Figure 5; Table 1).
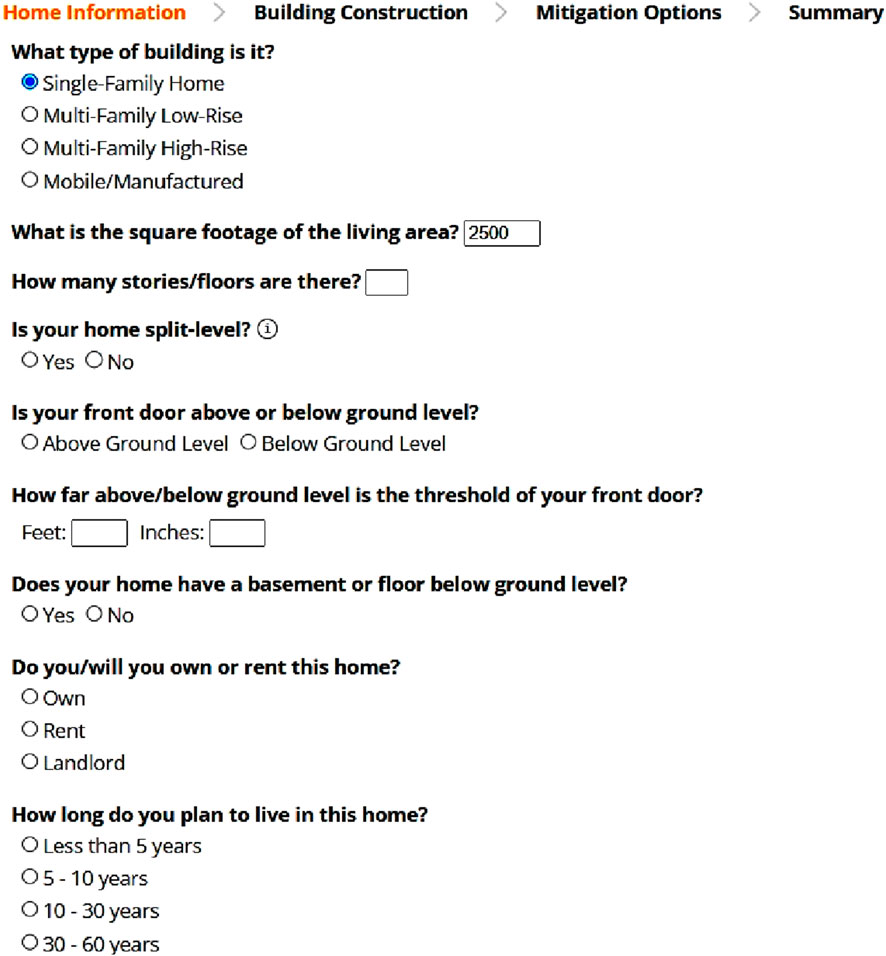
Figure 5. Home information page within the “Be Risk Ready” tab in FRAMC.
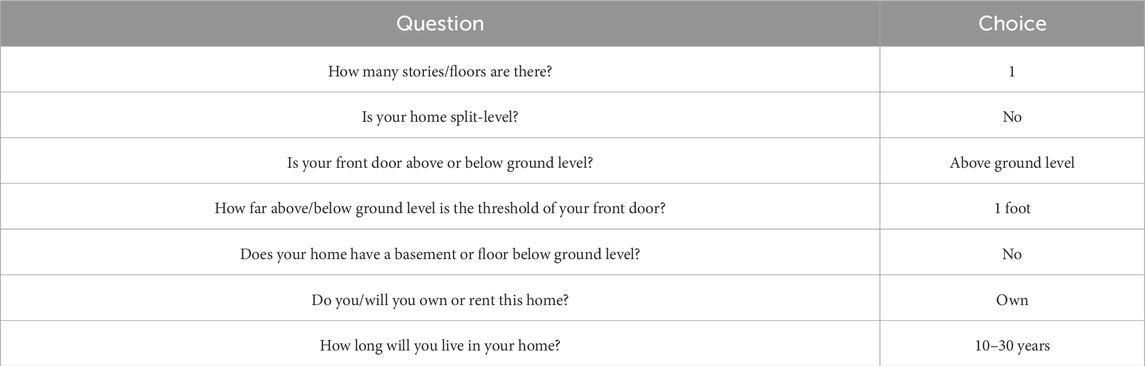
Table 1. Questions related to the home information page in FRAMC.
Furthermore, In the building construction tab, FRAMC sets itself apart from other tools by including elevation as a customizable mitigation strategy, along with proposed cost estimates that can be adjusted by the user. FRAMC empowers users to input different elevation scenarios, with cost implications associated with reaching the optimal elevation (Table 2) taking into account the year of construction (inferred from the input address) and other user input related to the wind risk. Because these costs are rough estimates for user convenience while working with the tool, the users have the option to modify the cost information based on quotes from local contractors and their specific building conditions.
Table 2. Questions related to mitigation options in FRAMC.
As users progress through FRAMC, the “Summary” tab shows all input parameters for home information, building construction, and mitigation options, to allow users to review and confirm the information before viewing the results of the mitigation analysis via the “Calculate” button (Figure 6).
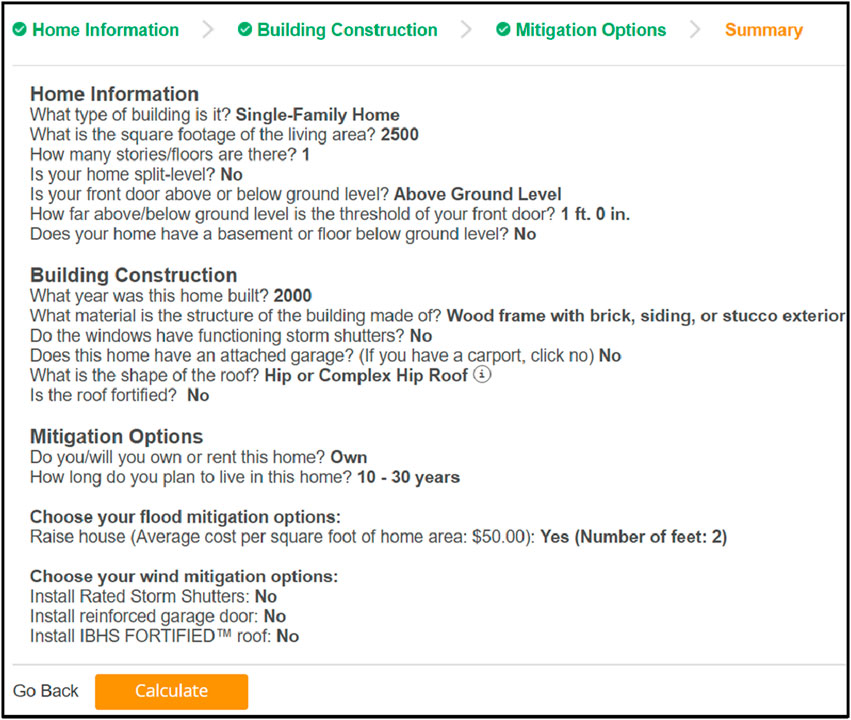
Figure 6. Summary of input or default information provided to the user in the flood risk and mitigation calculator tool.
Ultimately, the FRAMC provides analysis-based mitigation results expressed in dollar figures. This analysis includes the annual loss and savings, and number of years to recover the investment of elevating the home (Figure 7). In this example, the
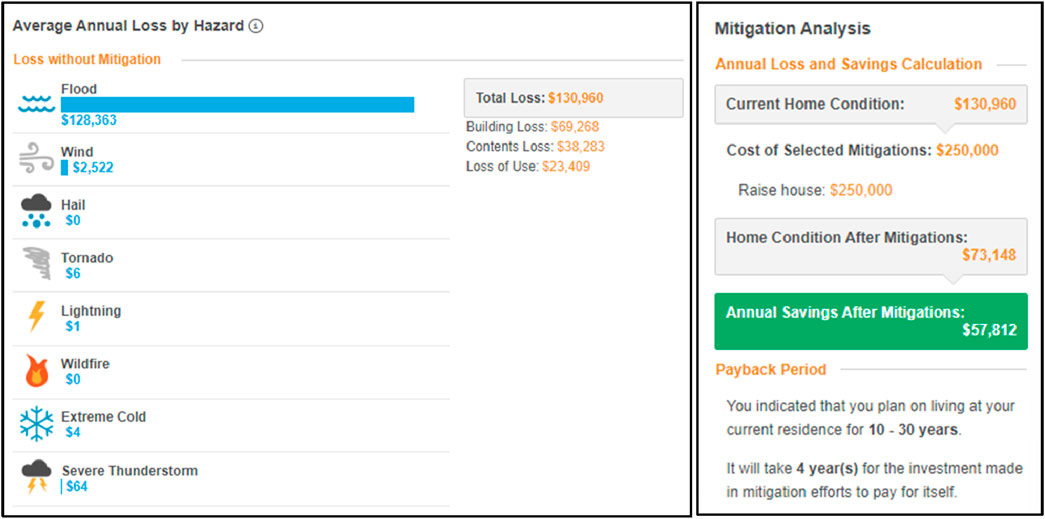
Figure 7. Mitigation cost and savings information output to the user in the flood risk and mitigation calculator tool.
6 Discussion
Flood hazard communication is a vital tool for risk reduction. While users can access web-based FEMA’s flood insurance rate maps (FIRMs) to identify their flood zone, the FRAMC within HazardAware offers many advantages for communicating the flood risk. Its address-based calculations that consider building type, area, and attributes provide more comprehensive information for “back end” calculations than FIRMs, which gives only flood zone and BFE as shown on a flood map. Moreover, HazardAware supplements FIRMs by providing action-oriented information as a function of the calculated elevation benefits, cost, and payback period to recover the investment hereby translating abstract flood zones into meaningful decision points.
Access to (understandable) flood risk information is of particular importance due to the legal right of home sellers (or landlords) to not-disclosing flood history at the time of sale in many U.S. states. This leaves new owners unaware that they have purchased a home that has flooded multiple times. This also leaves new owners unaware of the need to invest in flood mitigation. Laws relating to disclosure should be considered for amendments, as consumer flood damage awareness is a protected right for other types of purchases, such as vehicles. However, regardless of local and state laws regarding flood history disclosure, FRAMC is likely to be an effective communication mechanism for informing residents, particularly those in high-risk zones, of the benefits vs. costs of elevation. This information will assist in decision-making regarding flood insurance purchase, recognizing that tax credits may be awarded upon mitigation through elevation.
FRAMC can also communicate to federal agencies, such as FEMA or the Department of Housing and Urban Development how federal disaster recovery dollars (e.g., Community Development Block Grant for Disaster Recovery) could be spend more effectively on flood relief programs at the individual or community level. However, as Salvati et al. (2016) cautioned, web tools for such purposes should not come at the expense of advances in other forms of flood communication designed for the layperson.
Again, what distinguishes FRAMC from similar applications is its ability to provide actionable information based on calculated elevation benefits, costs, and the payback period required to recover the investment. It goes beyond the probability of risk by letting users see how risk, costs, and benefits change with different home details, building features, owner types, and elevation choices. For example, if the user compares 3 feet vs. 2 feet of elevation in the example shown here, the tool shows that the
Moreover, the HazardAware and FRAMC more specifically, are educational resources for comparison of risk from various perspectives of home residency. For homeowners, FRAMC provides important information about flood risk, ways to reduce risk, and the benefits of each method. In addition, FRAMC could offer homeowners crude cost estimates post-disaster, which could possibly speed up decision and recovery time. For tenants, the “Rent” instead of the “Own” option offers appropriate mitigation recommendations and costs emphasizing content losses, from FEMA and other credible sources for natural hazard mitigation information, which informs decisions about reducing flood risk. However, the actual impact of these tools on guiding mitigation decisions and enhancing consumer awareness falls outside the scope of this paper and will be explored as part of future work.
7 Limitations and future work
Much room for improvement exists in this initial version of the FRAMC in HazardAware for consideration in future iterations. One current limitation is that the tool does not consider insurance premiums or payoffs in its benefit vs. cost calculations. The actuarial approach undergirding the National Flood Insurance Program was recently overhauled. So-called Risk Rating 2.0 (RR2.0) methodology now calculates flood insurance premiums for buildings based on a new set of variables and data that are currently not fully publicly accessible. Therefore, in the current version of HazardAware, the effect of reduction in flood insurance premiums after elevating is not considered. However, the authors are currently working on simulating RR2.0’s calculations, for inclusion in future iterations of the flood web tool. Another notable limitation is the absence of market value considerations in the tool. Current calculations focus on the reduction of AAL rather than the potential increase in property value that certain mitigation measures might offer, but recent research (Kijewski-Correa et al., 2023) suggests that knowledge of avoided losses fall short of motivating residents to invest in mitigation. Recognizing the importance of this factor for homeowners, we are prioritizing future research on incorporating market and appraisal values into benefit-cost analyses to better capture the real estate and financial advantages of adaptation measures.
A second limitation is the absence of indirect losses, such as lost wages while a commercial or industrial building is out of service and expenses due to mental health challenges following a flood, and intangible losses, such as the loss of items of sentimental but not monetary value, in FRAMC. The calculation of indirect losses itself is fraught with high degrees of uncertainty, both methodologically and conceptually, particularly at the address or household level. Third, due to the uncertainty involved, elevation costs and future savings from AAL are unadjusted for inflation, but future updates should consider the inclusion of a user-defined inflation adjustment in the calculations. Fourth, more sophisticated consideration of elevation costs for existing homes should be considered. The elevation cost for this study is obtained from general cost guidance from Taghinezhad et al. (2021). Fifth, while the flood building and content loss functions used in this research are among the most acceptable flood loss functions in North America, further research is required for developing site-specific flood depth vs. damage (i.e., loss) functions, as local conditions such as humidity that promotes mold/mildew may cause considerable variation from these standard loss functions. Sixth, the benefit-cost analysis here does not (yet) consider effects of future climate change, sea level rise, and local subsidence. Finally, benefit-cost analysis-based flood mitigation in HazardAware is for existing homes; future upgrades may include separate benefit-cost analysis for flood mitigation for new residential construction or for a new community in an undeveloped area. Despite these limitations, this research takes an important step toward disseminating the knowledge of building-specific flood risk and short- and long-term mitigation options for owner-occupancy types.
8 Conclusion
Effective communication of flood hazards remains vital when it comes to minimizing risks associated with floods. This paper introduces a framework for flood risk assessment and mitigation calculation (FRAMC) integrated within the HazardAware application. FRAMC and HazardAware are designed to meet the needs of various users, both at individual and community levels. FRAMC offers several new advances in flood risk communication compared to tools such as NRI, FSH, or Risk Factor.
One notable advantage of FRAMC is its address-based calculations, which take into account factors such as building type, area, and specific attributes. By incorporating flood layers derived from high-resolution flood modeling data, the methodology uses AAL calculation as a surrogate for risk. FRAMC provides sufficient information for informed decision-making in mitigating flood hazards to homes. Moreover, FRAMC surpasses other web tools by providing action-oriented information that considers the detailed process for computing average annual savings and payback calculations, which are central to providing sufficient information for decision-making in mitigating the flood hazard to homes.
This paper presents the FRAMC framework along with the methodology behind developing flood risk analysis web tools and provides detailed insights into each feature’s purpose and how it can be utilized. This transparency allows researchers to expand on the tool’s capabilities, and residents and community officials to better understand flood risk and the value of implementing mitigation measures. Areas of FRAMC applicability extend beyond housing decisions. The tool could be useful to insurance companies for determining insurance rates, especially when assessing the effectiveness of mitigation strategies in reducing flood-related losses. Many insurers offer discounts to homeowners who implement structural elevation enhancements. Integrating FRAMC into educational curricula related to risk management, engineering, and environmental studies will provide students with practical understanding for flood risk assessment and mitigation strategies. The FRAMC platform holds great promise as an effective communication mechanism for conveying the risks, benefits, and costs associated with elevation measures, particularly for those in high-risk zones who are unaware that their home has a history of flood damage. The expression of results in terms of dollars rather than flood zones as provided in FIRMs gives a more direct impression as users can contextualize the information.
The broader features of HazardAware are also advantageous given that HazardAware covers all-natural hazard risk. This offers users a sense of comparative risk analysis across all types of natural hazards and situates flood risk within the local context. In an even broader sense, HazardAware contributes to risk education of its users that can lead to enhanced preparation before the next disaster strikes and protect the users from further disasters.
Data availability statement
The original contributions presented in the study are included in the article/supplementary material, further inquiries can be directed to the corresponding author.
Author contributions
RM: Conceptualization, Data curation, Formal Analysis, Investigation, Methodology, Resources, Software, Supervision, Validation, Visualization, Writing – original draft, Writing – review and editing. AA: Visualization, Writing – review and editing. AT: Conceptualization, Data curation, Investigation, Project administration, Writing – review and editing. CF: Conceptualization, Funding acquisition, Investigation, Project administration, Resources, Supervision, Writing – review and editing. RR: Funding acquisition, Writing – review and editing. MR: Data curation, Formal Analysis, Methodology, Writing – review and editing. CE: Funding acquisition, Project administration, Resources, Software, Supervision, Writing – review and editing. MG: Funding acquisition, Project administration, Writing – review and editing. EJ: Data curation, Resources, Software, Visualization, Writing – review and editing.
Funding
The author(s) declare that financial support was received for the research and/or publication of this article. This research was supported by the Gulf Research Program of the National Academies of Sciences, Engineering, and Medicine under the Grant Agreement number: 2000-10880 “The New First Line of Defense: Building Community Resilience through Residential Risk Disclosure,” Department of Defense/Department of the Army under contract no. W912HZ2220005, and USDA National Institute of Food and Agriculture, Hatch project LAB 94873, accession number 7008346. Any opinions, findings, conclusions, and recommendations expressed in this manuscript are those of the authors and do not necessarily reflect the official policy or position of the funders.
Acknowledgments
The authors thank the First Street Foundation and ATTOM for generous access to their data.
Conflict of interest
The authors declare that the research was conducted in the absence of any commercial or financial relationships that could be construed as a potential conflict of interest.
Publisher’s note
All claims expressed in this article are solely those of the authors and do not necessarily represent those of their affiliated organizations, or those of the publisher, the editors and the reviewers. Any product that may be evaluated in this article, or claim that may be made by its manufacturer, is not guaranteed or endorsed by the publisher.
References
Aerts, J. C., Botzen, W. W., de Moel, H., and Bowman, M. (2013). Cost estimates for flood resilience and protection strategies in New York City. Ann. N. Y. Acad. Sci. 1294 (1), 1–104. doi:10.1111/nyas.12200
Aerts, J. C., Botzen, W. W., Emanuel, K., Lin, N., De Moel, H., and Michel-Kerjan, E. O. (2014). Evaluating flood resilience strategies for coastal megacities. Science 344 (6183), 473–475. doi:10.1126/science.1248222
Alabbad, Y., Yildirim, E., and Demir, I. (2022). Flood mitigation data analytics and decision support framework: Iowa Middle Cedar Watershed case study. Sci. Total Environ. 814, 152768. doi:10.1016/j.scitotenv.2021.152768
Al Assi, A., Mostafiz, R. B., Friedland, C. J., Rahim, M. A., and Rohli, R. V. (2022a). Flood risk assessment for residences at the neighborhood scale by owner/occupant type and first-floor height. Front. Big Data 5, 997447. doi:10.3389/fdata.2022.997447
Al Assi, A., Mostafiz, R. B., Friedland, C. J., and Rohli, R. V. (2024). Theoretical boundaries of annual flood risk for single-family homes within the 100-year floodplain. Int. J. Environ. Res. 18, 29. doi:10.1007/s41742-024-00577-7
Al Assi, A., Mostafiz, R. B., Friedland, C. J., Rohli, R. V., and Rahim, M. A. (2022b). Homeowner flood risk and risk reduction from home elevation between the limits of the 100-and 500-year floodplains. Front. Earth Sci. 11, 1051546. doi:10.3389/feart.2023.1051546
Al Assi, A., Mostafiz, R. B., Friedland, C. J., Rohli, R. V., Taghinezhad, A., and Rahim, M. A. (2023). Cost-effectiveness of federal CDBG-DR road home program mitigation assistance in jefferson parish, Louisiana. Nat. Hazards 117, 1291–1319. doi:10.1007/s11069-023-05904-3
Almoradie, A., Jonoski, A., Stoica, F., Solomatine, D., and Popescu, I. (2013). Web based flood information system: case study of Somes Mare, Romania. Environ. Eng. and Manag. J. (EEMJ) 12 (5), 1065–1070. doi:10.30638/eemj.2013.130
Amoroso, S. D., and Fennell, J. P. (2008). “A rational benefit/cost approach to evaluating structural mitigation for wind damage: learning “the hard way” and looking forward,” in Structures congress 2008 (Vancouver, British Columbia). doi:10.1061/41016(314)249
ATTOM (2024). Available online at: https://www.attomdata.com/.
Barry, J. M. (1997). Rising tide: the great Mississippi flood of 1927 and how it changed America. New York, NY: Simon and Schuster.
Blake, E. S., and Zelinsky, D. A. (2018). National hurricane center tropical cyclone report: hurricane Harvey. Miami, FL: NOAA National Hurricane Center. Available online at: https://www.nhc.noaa.gov/data/tcr/AL092017_Harvey.pdf.
Botzen, W. J. W., Aerts, J. C. J. H., and Van den Bergh, J. C. J. M. (2013). Individual preferences for reducing flood risk to near zero through elevation. Mitig. Adapt. Strategies Glob. Change 18, 229–244. doi:10.1007/s11027-012-9359-5
Botzen, W. W., Kunreuther, H., Czajkowski, J., and de Moel, H. (2019). Adoption of individual flood damage mitigation measures in New York City: an extension of Protection Motivation Theory. Risk Anal. 39 (10), 2143–2159. doi:10.1111/risa.13318
Botzen, W. W., Monteiro, É., Estrada, F., Pesaro, G., and Menoni, S. (2017). Economic assessment of mitigating damage of flood events: cost–benefit analysis of flood-proofing commercial buildings in Umbria, Italy. Geneva Pap. Risk Insurance-Issues Pract. 42, 585–608. doi:10.1057/s41288-017-0065-0
Brackins, J. T., and Kalyanapu, A. J. (2016). Using ADCIRC and HEC-FIA modeling to predict storm surge impact on coastal infrastructure. World Environ. Water Resour. Congr. 2016, 203–212. doi:10.1061/9780784479841.023
Burns, J., Zuzak, C., and Rozelle, J. (2018). “Introducing FEMA’s National Risk Index: a baseline multi-hazard risk assessment for the United States and an interactive Web platform to visualize it,” in Proceedings of the AGU fall meeting abstracts.
CMRA (2024). Climate mapping for resilience and adaptation. Available online at: https://resilience.climate.gov/.
Correll, R. M., Lam, N. S. N., Mihunov, V. V., Zou, L., and Cai, H. (2021). Economics over risk: flooding is not the only driving factor of migration considerations on a vulnerable coast. Ann. Am. Assoc. Geogr. 111 (1), 300–315. doi:10.1080/24694452.2020.1766409
De Ruig, L. T., Haer, T., de Moel, H., Botzen, W. W., and Aerts, J. C. (2020). A micro-scale cost-benefit analysis of building-level flood risk adaptation measures in Los Angeles. Water Resour. Econ. 32, 100147. doi:10.1016/j.wre.2019.100147
Ding, A., White, J. F., Ullman, P. W., and Fashokun, A. O. (2008). Evaluation of Hazus-MH flood model with local data and other program. Nat. Hazards Rev. 9 (1), 20–28. doi:10.1061/(asce)1527-6988(2008)9:1(20)
Dube, E. (2020). The build-back-better concept as a disaster risk reduction strategy for positive reconstruction and sustainable development in Zimbabwe: a literature study. Int. J. Disaster Risk Reduct. 43, 101401. doi:10.1016/j.ijdrr.2019.101401
FEMA (2013). Hazus-MH technical manual flood model. Washington D.C: Department of Homeland Security. Available online at: https://www.fema.gov/sites/default/files/2020-09/FEMA_Hazus_flood-model_user-manual_2.1.pdf (Accessed May 6, 2022).
FEMA (2023). National flood hazard layer. Available online at: https://www.fema.gov/flood-maps/national-flood-hazard-layer (Accessed May 6, 2023).
First Street Foundation (2020). First Street foundation flood model (FSF-fm) technical documentation. Available online at: https://assets.firststreet.org/uploads/2020/06/FSF_Flood_Model_Technical_Documentation.pdf.
First Street Foundation (2021). First Street Foundation finds over 4 million homes face annual financial losses from flooding that are 4.5 times the cost of their estimated national flood insurance premiums today and increase to 7.2 times over the next 30 years. Available online at: https://www.prnewswire.com/news-releases/first-street-foundation-finds-over-4-million-homes-face-annual-financial-losses-from-flooding-that-are-4-5-times-the-cost-of-their-estimated-national-flood-insurance-premiums-today-and-increase-to-7-2-times-over-the-next-30-years-301231982.html.
Friedland, C. J., Lee, Y., Mostafiz, R. B., Lee, J., Mithila, S., Rohli, R. V., et al. (2023). FloodSafeHome: evaluating financial benefits and savings of freeboard for improved decision-making in flood risk mitigation. Front. Commun. 8, 1060901. doi:10.3389/fcomm.2023.1060901
Gall, M., and Friedland, C. J. (2018). If mitigation saves $6 per every $1 spent, then why are we not investing more? Nat. Hazards Rev. 21, 1–3. doi:10.1061/(asce)nh.1527-6996.0000342
Gnan, E., Friedland, C. J., Mostafiz, R. B., Rahim, M. A., Gentimis, T., Taghinezhad, A., et al. (2022b). Economically optimizing elevation of new, single family residences for flood mitigation via life-cycle benefit-cost analysis. Front. Environ. Sci. 10, 889239. doi:10.3389/fenvs.2022.889239
Gnan, E., Friedland, C. J., Rahim, M. A., Mostafiz, R. B., Rohli, R. V., Orooji, F., et al. (2022a). Improved building-specific flood risk assessment and implications of depth-damage function selection. Front. Water 4, 919726. doi:10.3389/frwa.2022.919726
Gnan, E., Mostafiz, R. B., Rahim, M. A., Friedland, C. J., Rohli, R. V., Taghinezhad, A., et al. (2024). Freeboard life-cycle benefit-cost analysis of a rental single-family residence for landlord, tenant, and insurer. Front. Clim. 5, 1295592. doi:10.3389/fclim.2023.1295592
Gupta, H. S., Nofal, O. M., González, A. D., Nicholson, C. D., and van de Lindt, J. W. (2022). Optimal selection of short- and long-term mitigation strategies for buildings within communities under flooding hazard. Sustainability 14 (16), 9812. doi:10.3390/su14169812
Harrison, D., Smersh, T., and Schwartz, A. (2001). Environmental determinants of housing prices: the impact of flood zone status. J. Real Estate Res. 21 (1–2), 3–20. doi:10.1080/10835547.2001.12091045
HazardAware (2024). Know your risk. Be Risk Ready. Available online at: https://hazardaware.org/.
Holz, K. P., Hildebrandt, G., and Weber, L. (2006). Concept for a Web based information system for flood management. Nat. Hazards 38, 121–140. doi:10.1007/s11069-005-8605-5
Horn, D. P. (2021). National flood insurance program: the current rating structure and risk rating 2.0. Washington, DC: Congressional Research Service, 45999.
IFIS (2024). Iowa flood information system. Available online at: https://ifis.iowafloodcenter.org/ifis/.
Katz, L., Fairweather, D., and Sandoval-Olascoaga, S. (2022). Homebuyers with access to flood-risk data bid on lower-risk homes. Available online at: https://www.redfin.com/news/redfin-users-interact-with-flood-risk-data/.
Khalid, A., and Ferreira, C. M. (2020). Advancing real-time flood prediction in large estuaries: iFLOOD a fully coupled surge-wave automated Web-based guidance system. Environm. Modell. Softw. 131, 104748–24. doi:10.1016/j.envsoft.2020.104748
Kijewski-Correa, T., Javeline, D., Kakenmaster, W., and Chesler, A. (2023). Economic incentives for coastal homeowner adaptation to climate change. Clim. Policy, 23(10), 1314–1326. doi:10.1080/14693062.2023.2215207
Lehman, W., Dunn, C. N., and Light, M. (2014). “Using HEC-FIA to identify the consequences of flood events,” in 6thinternational Conference on flood management (ICFM6) (Brasil: São Paulo).
Lekuthai, A., and Vongvisessomjai, S. (2001). Intangible flood damage quantification. Water Resour. Manag. 15 (5), 343–362. doi:10.1023/A:1014489329348
LSU Libraries (2024a). Hurricane betsy (1965). Baton Rouge, LA: Louisiana State University. Available online at: https://guides.lib.lsu.edu/Hurricanes/Betsy.
LSU Libraries (2024b). Hurricane Katrina impact on communities. Baton Rouge, LA: Louisiana State University. Available online at: https://guides.lib.lsu.edu/Hurricanes/KatrinaCommunities.
Marino, E. (2018). Adaptation privilege and voluntary buyouts: perspectives on ethnocentrism in sea level rise relocation and retreat policies in the US. Glob. Environ. Change 49, 10–13. doi:10.1016/j.gloenvcha.2018.01.002
Mayer, B. W., Moss, J., and Dale, K. (2008). Disaster and preparedness: lessons from hurricane Rita. J. Contingencies Crisis Manag. 16 (1), 14–23. doi:10.1111/j.1468-5973.2008.00531.x
Menegon, S., Depellegrin, D., Farella, G., Sarretta, A., Venier, C., and Barbanti, A. (2018). Addressing cumulative effects, maritime conflicts and ecosystem services threats through MSP-oriented geospatial webtools. Ocean and Coast. Manag. 163, 417–436. doi:10.1016/j.ocecoaman.2018.07.009
Meyer, V., Haase, D., and Scheuer, S. (2009). Flood risk assessment in European river basins-concept, methods, and challenges exemplified at the Mulde River. Integr. Environ. Assess. Manag. 5 (1), 17–26. doi:10.1897/ieam_2008-031.1
Mobley, W., Atoba, K. O., and Highfield, W. E. (2020). Uncertainty in flood mitigation practices: assessing the economic benefits of property acquisition and elevation in flood-prone communities. Sustainability 12 (5), 2098. doi:10.3390/su12052098
Mokhtari, F., Soltani, S., and Mousavi, S. A. (2017). Assessment of flood damage on humans, infrastructure, and agriculture in the Ghamsar Watershed using HEC-FIA software. Nat. Hazards Rev. 18 (3), 04017006. doi:10.1061/(ASCE)NH.1527-6996.0000248
Montgomery, M., and Kunreuther, H. (2018). Pricing storm surge risks in Florida: implications for determining flood insurance premiums and evaluating mitigation measures. Risk Anal. 38 (11), 2275–2299. doi:10.1111/risa.13127
Mostafiz, R. B., Bushra, N., Rohli, R. V., Friedland, C. J., and Rahim, M. A. (2021b). Present vs. future property losses from a 100-year coastal flood: a case study of Grand Isle, Louisiana. Front. Water 3, 763358. doi:10.3389/frwa.2021.763358
Mostafiz, R. B., Friedland, C. J., Rahim, M. A., Rohli, R. V., and Bushra, N. (2021c). “A data-driven, probabilistic, multiple return period method of flood depth estimation,” in American geophysical union fall meeting 2021, New Orleans, Louisiana (Washington, DC: American Geophysical Union). doi:10.1002/essoar.10509337.1
Mostafiz, R. B., Friedland, C. J., Rahman, M. A., Rohli, R. V., Tate, E., Bushra, N., et al. (2021a). Comparison of neighborhood-scale, residential property flood-loss assessment methodologies. Front. Environ. Sci. 9, 734294. doi:10.3389/fenvs.2021.734294
Mostafiz, R. B., Rahim, M. A., Friedland, C. J., Rohli, R. V., Bushra, N., and Orooji, F. (2022b). A data-driven spatial approach to characterize the flood hazard. Front. Big Data 5, 1022900. doi:10.3389/fdata.2022.1022900
Mostafiz, R. B., Rohli, R. V., Friedland, C. J., and Lee, Y.-C. (2022a). Actionable information in flood risk communications and the potential for new web-based tools for long-term planning for individuals and community. Front. Earth Sci. Sect. Geohazards Georisks 10, 840250. doi:10.3389/feart.2022
National Centers for Environmental Information (NCEI) (2024). Billion-dollar weather and climate disasters: summary statistics. Asheville, NC: National Oceanic and Atmospheric Administration. Available online at: https://www.ncei.noaa.gov/access/billions/summary-stats/GCS/1980-2024.
National Environmental Satellite, Data, and Information Service (NESDIS) (2018). On August 25, 2017: hurricane Harvey slammed Texas. Available online at: https://www.nesdis.noaa.gov/news/august-25-2017-hurricane-harvey-slammed-texas.
National Hurricane Center (2023). Tropical cyclone report: hurricane ian. Available online at: https://www.nhc.noaa.gov/data/tcr/AL092022_Ian.pdf.
National Ocean Service (2022). 2022 sea level rise technical report: updated projections available through 2150 for all U.S. coastal waters. Silver Spring, MD: National Oceanic and Atmospheric Administration. Available online at: https://oceanservice.noaa.gov/hazards/sealevelrise/sealevelrise-tech-report.html.
National Research Council (2012). Disaster resilience: a national imperative. Washington, DC: The National Academies Press. doi:10.17226/13457
NOAA (2022). National Centers for Environmental Information (NCEI). U.S. billion-dollar weather and climate disasters. Available online at: https://www.ncei.noaa.gov/access/billions/summary-stats/US/1980-2022.doi:10.25921/stkw-7w73
NOAA (2023). “Office for coastal management. Digital coast,” in Defining coastal counties. Available online at: https://coast.noaa.gov/data/digitalcoast/pdf/defining-coastal-counties.pdf.
Nofal, O. M., and van de Lindt, J. W. (2020). High-resolution approach to quantify the impact of building-level flood risk mitigation and adaptation measures on flood losses at the community-level. Int. J. Disaster Risk Reduct. 51, 101903. doi:10.1016/j.ijdrr.2020.101903
Officer, L. H. (2022). “Consumer price index,” in Essays in economic history: purchasing power parity, standard of living, and monetary standards (Cham: Springer International Publishing), 173─185. doi:10.1007/978-3-030-95925-8_10
Onen, F., and Bagatur, T. (2017). Prediction of flood frequency factor for Gumbel distribution using regression and GEP model. Arabian J. Sci. Eng. 42 (9), 3895–3906. doi:10.1007/s13369-017-2507-1
Organization of American Historians (2007). Hurricanes along the Gulf coast. J. Am. Hist. Available online at: https://archive.oah.org/special-issues/katrina/resources/hurricanes.html.
Parhi, P. K. (2018). Flood management in Mahanadi Basin using HEC-RAS and Gumbel’s extreme value distribution. J. Institution Eng. (India) Ser. A 99 (4), 751–755. doi:10.1007/s40030-018-0317-4
Patel, M. B. (2020). Flood frequency analysis using Gumbel distribution method at garudeshwar weir, narmada basin. Int. J. Trend Res. Dev. 7 (1). Available online at: http://www.ijtrd.com/papers/IJTRD21899.pdf (Accessed May 6, 2022).
Penning-Rowsell, E. C., and Chatterton, J. B. (1977). The benefits of flood alleviation: a manual of assessment techniques. Aldershot, England: Gower Publishing Company Limited.
Pollack, A. B., Wrenn, D. H., Nolte, C., and Wing, I. S. (2023). Potential benefits in remapping the special flood hazard area: evidence from the US housing market. J. Hous. Econ. 61, 101956. doi:10.1016/j.jhe.2023.101956
Rahim, M. A., Al Assi, A., Mostafiz, R. B., and Friedland, C. J. (2024). Effects of damage initiation points of depth-damage function on flood risk assessment. npj Nat. Hazards 1, 6. doi:10.1038/s44304-024-00004-z
Rahim, M. A., Friedland, C. J., Rohli, R. V., Bushra, N., and Mostafiz, R. B. (2021). “A data-intensive approach to allocating owner vs. NFIP portion of average annual flood losses,” in American geophysical union fall meeting 2021, New Orleans, Louisiana (Washington, DC: American Geophysical Union). doi:10.1002/essoar.10509884.1
Rahim, M. A., Mostafiz, R. B., and Friedland, C. (2023). Disseminating flood risk information in the USA through Risk Rating 2.0. EGU General Assem. 2023. doi:10.5194/egusphere-egu23-16893
Salvati, P., Pernice, U., Bianchi, C., Marchesini, I., Fiorucci, F., and Guzzetti, F. (2016). Communication strategies to address geohydrological risks: the POLARIS web initiative in Italy. Nat. Hazards Earth Syst. Sci. 16 (6), 1487–1497. doi:10.5194/nhess-16-1487-2016
Scawthorn, C., Blais, N., Seligson, H., Tate, E., Mifflin, E., Thomas, W., et al. (2006a). Hazus-MH flood loss estimation methodology. I: overview and flood hazard characterization. Nat. Hazards Rev. 7(2), 60–71. doi:10.1061/ASCE1527-698820067:260
Scawthorn, C., Flores, P., Blais, N., Seligson, H., Tate, E., Chang, S., et al. (2006b). Hazus-MH flood loss estimation methodology. II. Damage and loss assessment. Nat. Hazards Rev. 7 (2), 72–81. doi:10.1061/ASCE1527-698820067:272
Shan, X., Wang, J., Wen, J., Hu, H., Wang, L., Yin, J., et al. (2022). Using multidisciplinary analysis to develop adaptation options against extreme coastal floods. Int. J. Disaster Risk Sci. 13 (4), 577–591. doi:10.1007/s13753-022-00421-6
SHELDUS (2024). Center for emergency management and homeland security. Available online at: https://cemhs.asu.edu/sheldus.
Singh, P., Sinha, V. S. P., Vijhani, A., and Pahuja, N. (2018). Vulnerability assessment of urban road network from urban flood. Int. J. Disaster Risk Reduct. 28, 237–250. doi:10.1016/j.ijdrr.2018.03.017
Stephens, S. H., and Altamirano, A. (2024). Envisioning user agency during development of a website for natural hazard communication. J. Bus. Tech. Commun. 38 (4), 345–370. doi:10.1177/10506519241258456
Strapasson, A., Ferreira, M., Cruz-Cano, D., Woods, J., Soares, M. P. D. M., and da Silva, O. L. (2022). The use of system dynamics for energy and environmental education. Int. J. Educ. Technol. High. Educ. 19 (1), 5. doi:10.1186/s41239-021-00309-3
Taghinezhad, A., Friedland, C. J., and Rohli, R. V. (2020). Benefit-cost analysis of flood-mitigated residential buildings in Louisiana. Hous. Soc. 48 (2), 185–202. doi:10.1080/08882746.2020.1796120
Taghinezhad, A., Friedland, C. J., Rohli, R. V., Marx, B. D., Giering, J., and Nahmens, I. (2021). Predictive statistical cost estimation model for existing single family home elevation projects. Front. Built Environ. 7, 646668. doi:10.3389/fbuil.2021.646668
Tasantab, C. J., Gajendran, T., and Maund, K. (2023). How the past influences the future: flood risk perception in informal settlements. Environ. Hazards 22 (3), 201–220. doi:10.1080/17477891.2022.2130854
Tate, E., Munoz, C., and Suchan, J. (2015). Uncertainty and sensitivity analysis of the Hazus-MH flood model. Nat. Hazards Rev. 16 (3), 04014030. doi:10.1061/(ASCE)NH.1527-6996.0000167
Tate, E., Rahman, M. A., Emrich, C. T., and Sampson, C. C. (2021). Flood exposure and social vulnerability in the United States. Nat. Hazards 106 (1), 435–457. doi:10.1007/s11069-020-04470-2
U.S. Army Corps of Engineers (USACE) (2000). Economic guidance memorandum 01-03: generic depth-damage relationships. Washington, DC: US Army Corps of Engineers.
U.S. Army Corps of Engineers (USACE) (2003). Economic guidance memorandum 04-01: generic depth-damage relationships for residential structures with basements. Washington, DC: US Army Corps of Engineers.
U.S. Bureau of Labor Statistics (2023). Consumer price index historical tables for U.S. City average. Available online at: https://www.bls.gov/regions/mid-atlantic/data/consumerpriceindexhistorical_us_table.htm.
van der Wiel, K., Kapnick, S. B., van Oldenborgh, G. J., Whan, K., Philip, S. Y., Vecchi, G. A., et al. (2017). Rapid attribution of the August 2016 flood-inducing extreme precipitation in south Louisiana to climate change. Hydrology Earth Syst. Sci. 21 (2), 897–921. doi:10.5194/hess-21-897-2017
Ward, P. J., Winsemius, H. C., Kuzma, S., Bierkens, M. F. P., Bouwman, A., Moel, H. D., et al. (2020). Aqueduct floods methodology. Washington, DC: World Resources Institute. Available online at: https://www.wri.org/research/aqueduct-floods-methodology.
Whitehead, A. L., and Booker, D. J. (2019). Communicating biophysical conditions across New Zealand’s rivers using an interactive webtool. N. Z. J. Mar. FGreshwater Res. 53 (2), 278–287. doi:10.1080/00288330.2018.1532914
Wing, O. E., Bates, P. D., Smith, A. M., Sampson, C. C., Johnson, K. A., Fargione, J., et al. (2018). Estimates of present and future flood risk in the conterminous United States. Environ. Res. Lett. 13 (3), 034023. doi:10.1088/1748-9326/aaac65
Wing, O. E. J., Lehman, W., Bates, P. D., Sampson, C. C., Quinn, N., Smith, A. M., et al. (2022). Inequitable patterns of US flood risk in the Anthropocene. Nat. Clim. Change 12 (2), 156–162. doi:10.1038/s41558-021-01265-6
Wojtkiewicz, R. (2016). AIR inland flood model and NFIP claims analysis. AIR Worldw. Available online at: https://www.casact.org/sites/default/files/presentation/reinsure_2016_presentations_c-8-wojtkiewicz.pdf.
Xian, S., Lin, N., and Kunreuther, H. (2017). Optimal house elevation for reducing flood-related losses. J. Hydrology 548, 63–74. doi:10.1016/j.jhydrol.2017.02.057
Yildirim, E., and Demir, I. (2021). Flood risk assessment and quantification at the community and property level in the state of Iowa. Int. J. Disaster Risk Reduct. 77, 103106. doi:10.1016/j.ijdrr.2022.103106
Zarekarizi, M., Srikrishnan, V., and Keller, K. (2020). Neglecting uncertainties biases house-elevation decisions to manage riverine flood risks. Nat. Commun. 11 (1), 5361. doi:10.1038/s41467-020-19188-9
Zuzak, C., Goodenough, E., Stanton, C., Mowrer, M., Sheehan, A., Roberts, B., et al. (2023). National risk index technical documentation. Washington, DC: Federal Emergency Management Agency.
Keywords: flood risk assessment, average annual loss (AAL), web-based risk disclosure, flood mitigation, flood loss analysis, catastrophic modeling, Gumbel extreme value distribution.
Citation: Mostafiz RB, Al Assi A, Taghinezhad A, Friedland CJ, Rohli RV, Rahim MA, Emrich CT, Gall M and Johnson E (2025) Flood risk and mitigation calculator tool to support decision-making for enhancing community resilience: a case study of the U.S.A. Gulf Coastal region. Front. Built Environ. 11:1486791. doi: 10.3389/fbuil.2025.1486791
Received: 26 August 2024; Accepted: 27 May 2025;
Published: 17 June 2025.
Edited by:
Bianca Mitrica, Romanian Academy, RomaniaReviewed by:
Ahmed U. Abdelhady, Verisk Analytics, United StatesRam Krishna Mazumder, Arcadis, U.S., Inc., United States
Copyright © 2025 Mostafiz, Al Assi, Taghinezhad, Friedland, Rohli, Rahim, Emrich, Gall and Johnson. This is an open-access article distributed under the terms of the Creative Commons Attribution License (CC BY). The use, distribution or reproduction in other forums is permitted, provided the original author(s) and the copyright owner(s) are credited and that the original publication in this journal is cited, in accordance with accepted academic practice. No use, distribution or reproduction is permitted which does not comply with these terms.
*Correspondence: Rubayet Bin Mostafiz, cm1vc3RhZml6QGFnY2VudGVyLmxzdS5lZHU=