 Zhaofeng Wu1
 Pengliang Yang
- 1Metro Project Management Branch of Nanchang Rail Transit Group Co., Ltd., Nanchang, China
- 2CCTEB Infrastructure Construction Investment Co., Ltd., Wuhan, China
- 3China Construction Third Engineering Bureau Group Co., Ltd., Wuhan, China
- 4School of Civil Engineering, Central South University, Changsha, China
This paper addresses the issue of crack expansion in adjacent buildings caused by foundation pit construction and develops a predictive model using the response surface method. Nine factors, including the distance between the foundation pit and the building, soil elastic modulus, and density, were selected as independent variables, with the crack propagation area as the dependent variable. An orthogonal test of 32 conditions was conducted, and crack propagation was analyzed using the FEM-XFEM model. Results indicate that soil elastic modulus, Poisson’s ratio, and distance between the pit and building significantly impact crack propagation. A predictive model was developed through ridge regression and validated with additional test conditions. Single-factor analysis showed that elastic modulus and Poisson’s ratio of the silty clay layer, elastic modulus of sandy soil, and pit distance have near-linear effects on crack propagation. In contrast, cohesion, density, and Poisson’s ratio of sandy soil exhibited extremum points, with certain factors showing high sensitivity in specific ranges. This study provides theoretical guidance for mitigating crack propagation in adjacent buildings during excavation.
1 Introduction
The rapid pace of urbanization has significantly increased the demand for underground space utilization in cities, which is essential for accommodating expanding populations and infrastructure needs (Shi et al., 2021; Liu et al., 2019; Lei et al., 2019; Cao et al., 2020; Liu et al., 2024). However, this rapid development often takes place in densely packed urban environments, where construction of foundation pits is frequently conducted in close proximity to existing structures. This proximity poses a unique challenge, as excavation activities can induce ground movements that impact surrounding buildings, some of which may already exhibit pre-existing damage (Han et al., 2022; Dmochowski and Szolomicki, 2021; Wang et al., 2023a). The consequences of these disturbances are critical, as they can not only exacerbate existing structural damage but also lead to catastrophic failures in the most extreme cases. This issue is particularly critical in urban environments, where the interaction between foundation pit excavation activities and aging infrastructure demands in-depth studies to evaluate its impact on structural safety, crack propagation, and effective mitigation strategies (Xue, 2023).
Extensive research has been conducted on the impact of foundation pit excavation on neighboring structures, particularly focusing on the resulting ground settlement and structural deformations. Early studies, such as those by Peck, using a wealth of field monitoring data, proposed a method to estimate surface settlement that accounts for soil parameters and excavation depth (Wei et al., 2021). Similarly, Hsieh divided the settlement profile into a shoulder type and a concave type and noted that the maximum settlement occurs within a distance of 2H (H being the excavation depth of the pit) (Hsieh and Ou, 1998). Research by Wang et al. demonstrated that as excavation depth increases, the lateral displacement and deformation of retaining structures increase, which in turn exacerbates the settlement of adjacent buildings (Wang et al., 2021). While these studies provide valuable insights into ground displacement, they tend to oversimplify the problem by not fully considering the interaction between the soil, the pit, and the surrounding buildings. The presence of nearby building structures can significantly influence soil behavior, including soil loss and surface settlement. Specifically, the structural integrity of neighboring buildings can alter local soil stress distributions and pore pressure gradients, which in turn affect the soil’s compaction and settlement patterns. The impact of these changes is particularly critical in urban environments, where even minor disturbances to soil can lead to substantial damage to adjacent structures.
Ding et al. utilized the finite difference method to simulate the entire excavation process, analysing the effects of isolation pile construction, diaphragm wall construction, and foundation pit dewatering and excavation on adjacent bridge piers (Ding et al., 2011). Lan conducted a numerical analysis of the stress characteristics of buildings under differential settlement and established threshold values for differential settlement (Tirca, 2017). Ou simulated the damage behavior of historical buildings affected by differential settlement via a combined finite-discrete element method (FDEM) (Ou et al., 2022). Zhang, through field monitoring and numerical simulation, analysed the factors influencing the shear deformation of buildings induced by foundation pit construction (Zhang, 2023). Chen adopted numerical simulations to study the distribution patterns of surface settlement caused by excavation and the influence of factors such as diaphragm wall thickness and depth (Zhao et al., 2023). Lu et al., using a deep foundation pit project as a case study, applied the finite element method to identify key factors affecting pit deformation and building settlement (Chen and Ma, 2018). Zhong, using the Baiyun Station foundation pit project in Guangzhou as a case study, developed a three-dimensional numerical model of the foundation pit, elevated bridge, and pile-beam foundation to analyse the effects of excavation on the lateral displacement of adjacent piles (Zhong et al., 2023). While these studies have taken into account the coupled system of the soil-pit-building structure, they primarily focus on analyzing factors such as stress, strain, and displacement in existing building structures, overlooking issues related to their service condition and crack propagation. In reality, cracks in building structures can significantly affect their load-bearing capacity and safety performance. The presence of cracks may lead to local stress concentration, thereby reducing the overall bearing capacity of the structure. This is because the expansion of cracks will destroy the continuity of the material, resulting in its inability to effectively share the external load under load. Therefore, in order to enhance the resistance of structures, new materials and structures are used in the construction of buildings and infrastructure (Li et al., 2024; Wang et al., 2023b).
Xu et al. studied the impact of soil parameters on the arching effect in deep foundation pits, emphasizing the key role of cohesion and internal friction angle in shaping the arching characteristics (Xu et al., 2024). Ye et al., through the study of actual engineering cases, confirmed that the impact of foundation pit excavation on adjacent tunnel structures is closely related to the distance from the pit and the geological conditions (Ye et al., 2021). Based on monitoring data from a foundation pit project, Yan et al. investigated the effect of foundation pit excavation on the cracking of nearby bridge pier structures. The results showed that the crack distribution is closely related to the proximity and excavation depth (Yan et al., 2024). Numerous studies have shown that soil parameters such as elasticity, cohesion, and internal friction angle, as well as the distance between the foundation pit and the building, play a crucial role in determining the magnitude of ground settlement and its effects on the surrounding structures (Arapakou and Papadopoulos, 2012; Arshad, 2016; Sou-Sen and Hsien-Chuang, 2004; Kim et al., 2001). In particular, factors like the stiffness and cohesion of the soil, and the distance from the excavation, significantly affect the settlement response and the resulting damage to adjacent buildings. While soil types such as silty clay and sandy soils are commonly considered in these analyses, the variability in soil properties can lead to differences in settlement behavior. Therefore, the factors selected for analysis in this study focus on the most influential parameters for ground settlement and building deformation. These parameters include the elastic modulus, Poisson’s ratio, and density of the silty clay and sandy soil layers, as well as the distance between the foundation pit and the building.
A review of the above studies reveals a significant gap in current research regarding the pre-existing damage conditions of adjacent buildings. Structures with pre-existing cracks or other forms of damage are more susceptible to further deterioration under the dynamic loading conditions induced by foundation pit excavation. This makes it essential to integrate the structural health of neighboring buildings into the predictive models. Failure to accurately represent and fully consider the damage status of existing buildings can lead to an underestimation of the impact of foundation excavation, jeopardizing the safety of these structures. This study investigates the effect of foundation pit excavation on the crack propagation of adjacent buildings, with a focus on buildings exhibiting pre-existing damage. A combination of finite element method (FEM), extended finite element method (XFEM), and response surface method (RSM) is employed in this study to model and predict the impact of excavation-induced disturbances on building integrity. An analysis of the disturbances induced by the excavation of a new foundation pit is conducted, and the patterns of damage propagation in nearby existing structures are discussed. This study aims to provide guidance for the rational design and construction of foundation pits.
2 Theoretical basis and methodology
2.1 FEM-XFEM methodology
In damage theory, Kachanov regarded microcracks and microvoids in materials as defects that do not bear load (Kachanov, 1992). Consequently, the effective load-bearing area of the material decreases from
where
When studying structural damage in buildings, both the length and depth of cracks influence the load-bearing capacity and operational performance of the structure (Laxman et al., 2023; Jafarifar et al., 2016; Lin et al., 2012). Existing engineering practices and theoretical research indicate that cracks induced by disturbances from foundation pit excavation typically appear at the junctions of walls and top slabs. Since these components are relatively thin, the resulting macrocracks can be approximated as planes perpendicular to the direction of loading (Li et al., 2022). The area of these cracks can be approximated as the product of the crack length and depth. In this study, the cracked portion of the building is treated as an area that cannot bear tensile forces. Thus, the larger the crack area, the smaller the effective load-bearing area and the greater the degree of structural damage. Conversely, the smaller the crack area, the larger the effective load-bearing area and the lesser the degree of structural damage. Therefore, the crack propagation area c is used to represent the extent of damage in the building, and it is defined as in Equation 2.
where
In the XFEM model, a crack plane with a specified length and width can be set to be inserted at a specified position in the model as pre-damage of the structure. During XFEM analysis, the mesh that intersects the crack plane is considered to be cracked and cannot withstand the tensile force of the crack plane normal. In this way, the Kachanov damage theory can be applied to XFEM analysis.
A 3D finite element model that integrates the soil, foundation pit, and building was constructed via advanced finite element software (Figure 1). The model dimensions are 400 m × 150 m × 50 m, and a total of 60,384 elements are generated. The soil, diaphragm walls, and building are all modelled with solid elements. The contact between the soil and diaphragm walls, as well as between the building foundation and the soil, is set as surface-to-surface contact, with tangential behavior defined as “penalty friction” and normal behavior as “hard contact.” The diaphragm walls and internal supports are modelled with coupled contact conditions. The soil is represented via the Mohr‒Coulomb material model, whereas the internal supports and building structures are modelled via a linear elastic material model (Hu et al., 2021; Zhou et al., 2024; Deng et al., 2023). Boundary conditions constrain displacements in all three directions at the bottom of the soil and normal displacements along the sides. Dewatering of the foundation pit is simulated by setting pore pressure boundary conditions, and isotropic seepage models are used for groundwater flow (Luo and Li, 2019; Hu et al., 2024). The excavation of the foundation pit is simulated via the *Model Change feature, with excavation steps set according to the conditions listed in Table 1. The specific parameters of the FEM model are shown in Table 2.
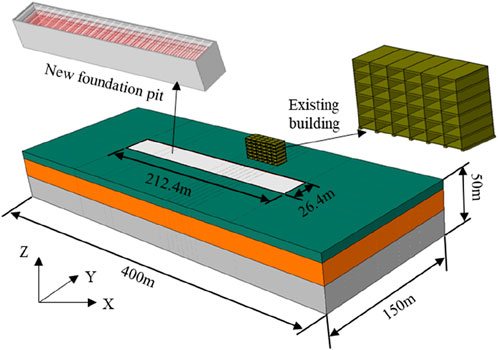
Figure 1. Overall model layout.
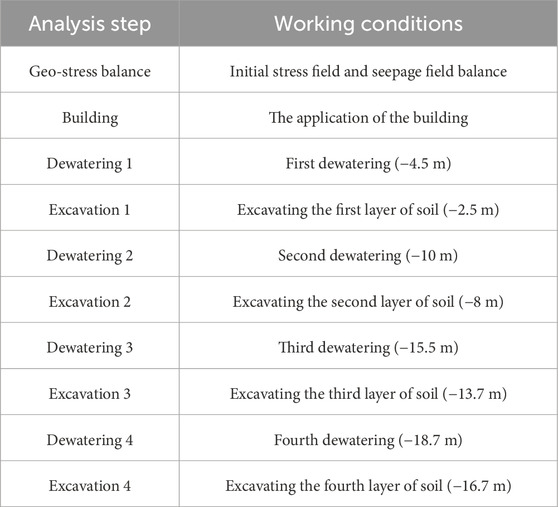
Table 1. Analysis step settings (Yang et al., 2024).
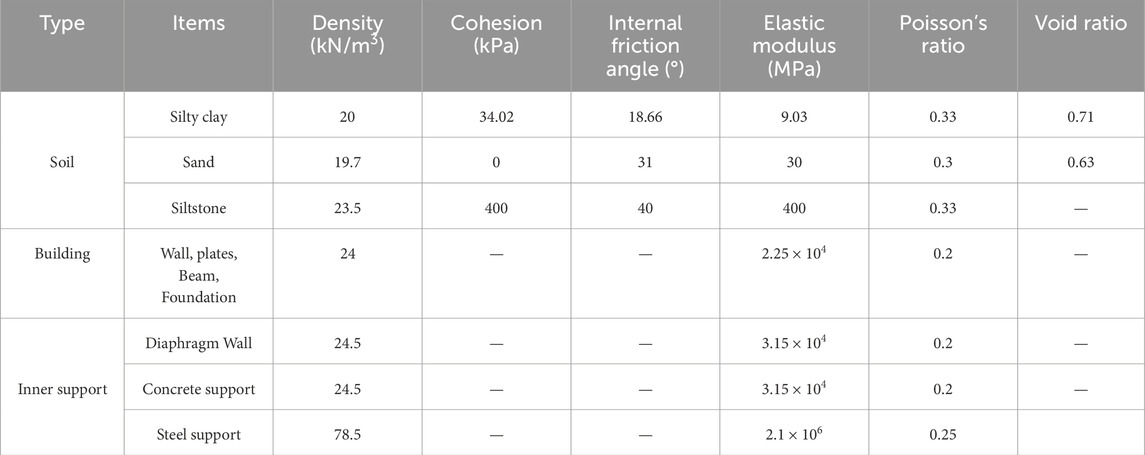
Table 2. FEM model parameters (Yang et al., 2024).
Since conventional finite element methods cannot simulate strong discontinuities such as cracks, the extended finite element method (XFEM) is used to simulate crack propagation in buildings under settlement (Yang et al., 2024; Ávila et al., 2024). Referring to the two-stage analysis method in the literature (Liu et al., 2020; Liang et al., 2017; Liu et al., 2021; Korff et al., 2016; Shi et al., 2016), an XFEM model containing only the building was established (Figure 2). The settlement calculated by the FEM model at the building’s foundation is applied as displacement vectors to the corresponding positions in the XFEM model (Figure 3). The cohesive crack initiation criterion is used in the model, and on the basis of reference (Kaklauskas and Ghaboussi, 2001; Liu et al., 2023), the maximum principal stress is set to 1.7 MPa and the fracture energy to 150 N/m. The specific parameters are shown in Table 3.
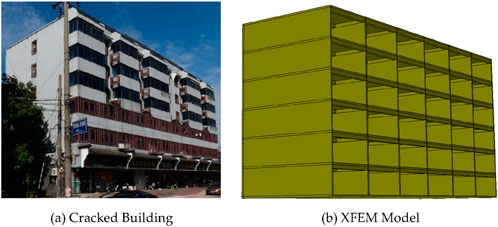
Figure 2. XFEM model. (a) Cracked Building (b) XFEM Model.
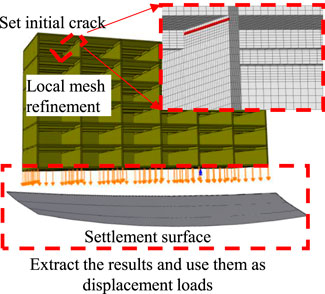
Figure 3. Initial crack and boundary condition setup.
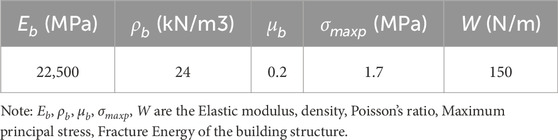
Table 3. XFEM model parameter.
While XFEM is an effective tool for modeling crack propagation in building structures under foundation pit excavation, it has certain limitations. For example, XFEM assumes that cracks propagate according to predefined failure criteria (such as stress intensity factors or strain criteria). This may not fully capture complex crack behaviors in real-world materials, where cracks can sometimes exhibit more irregular patterns or be influenced by additional factors like soil-structure interaction or dynamic loading. Additionally, XFEM requires a sufficiently refined mesh to accurately capture crack initiation and propagation, which can be computationally expensive. These limitations should be considered when applying XFEM in real-world scenarios, and further research may be needed to improve its applicability to a wider range of structural conditions.
2.2 Response surface method
In actual construction, different working conditions involve varying construction parameters, meaning that there are countless scenarios. If a numerical model were to be built for each scenario, it would undoubtedly increase computational costs. Therefore, this paper establishes a response surface model to predict the computational results under different construction parameters. The response surface method (RSM) is a statistical approach based on scientifically reasonable experimental designs, which quantifies variables and, through multiple trials, produces a simple mathematical model to describe the unknown relationships between these variables.
Given the high stiffness of the argillaceous siltstone layer, its variability has a relatively small effect on ground settlement and is therefore excluded from the parameter analysis. Additionally, since the plasticity parameters of sandy soil are generally fixed and show minimal variability, they are also excluded. Referring to the parameter sensitivity analysis by Lu (Lu, 2021), this study selects the following influencing factors: the elastic modulus
where
The third-order model formula includes square and cubic terms, which allows consideration of the strong nonlinear influence of the factors on the predicted variable. The formula is as follows Equation 4.
In this equation, the nine independent variables lead to 28 coefficients, which requires 28 equations to solve. To eliminate the effects of dimensional differences between parameters and ensure the comparability of the data, the orthogonal test results were normalized via the Equation 5 (Han et al., 2020; Cao et al., 2014):
where
When the response surface function is fit via the least squares method, high-order functions can easily lead to overfitting. Therefore, ridge regression was used to fit the re-sponse surface function in this study. Ridge regression, a regularized linear regression model, helps mitigate multicollinearity and overfitting issues. The penalty parameter for ridge regression was set to 1.
Since the number of influencing factors in this study is large, analysing the effect of each factor on crack propagation individually would require many experiments. To optimize computational resources, the orthogonal experimental method is used to investigate the impact of various factors on crack propagation. In orthogonal experiments, too few levels for each factor can affect the prediction accuracy, whereas too many levels can result in excessive computational demands. On the basis of the coefficient of variation for each parameter, four levels were selected for each factor. Ultimately, the L32(49) orthogonal experiment table was chosen, and the resulting orthogonal table is shown in Table 4. In this table, Group 1 corresponds to the average values of all the parameters.
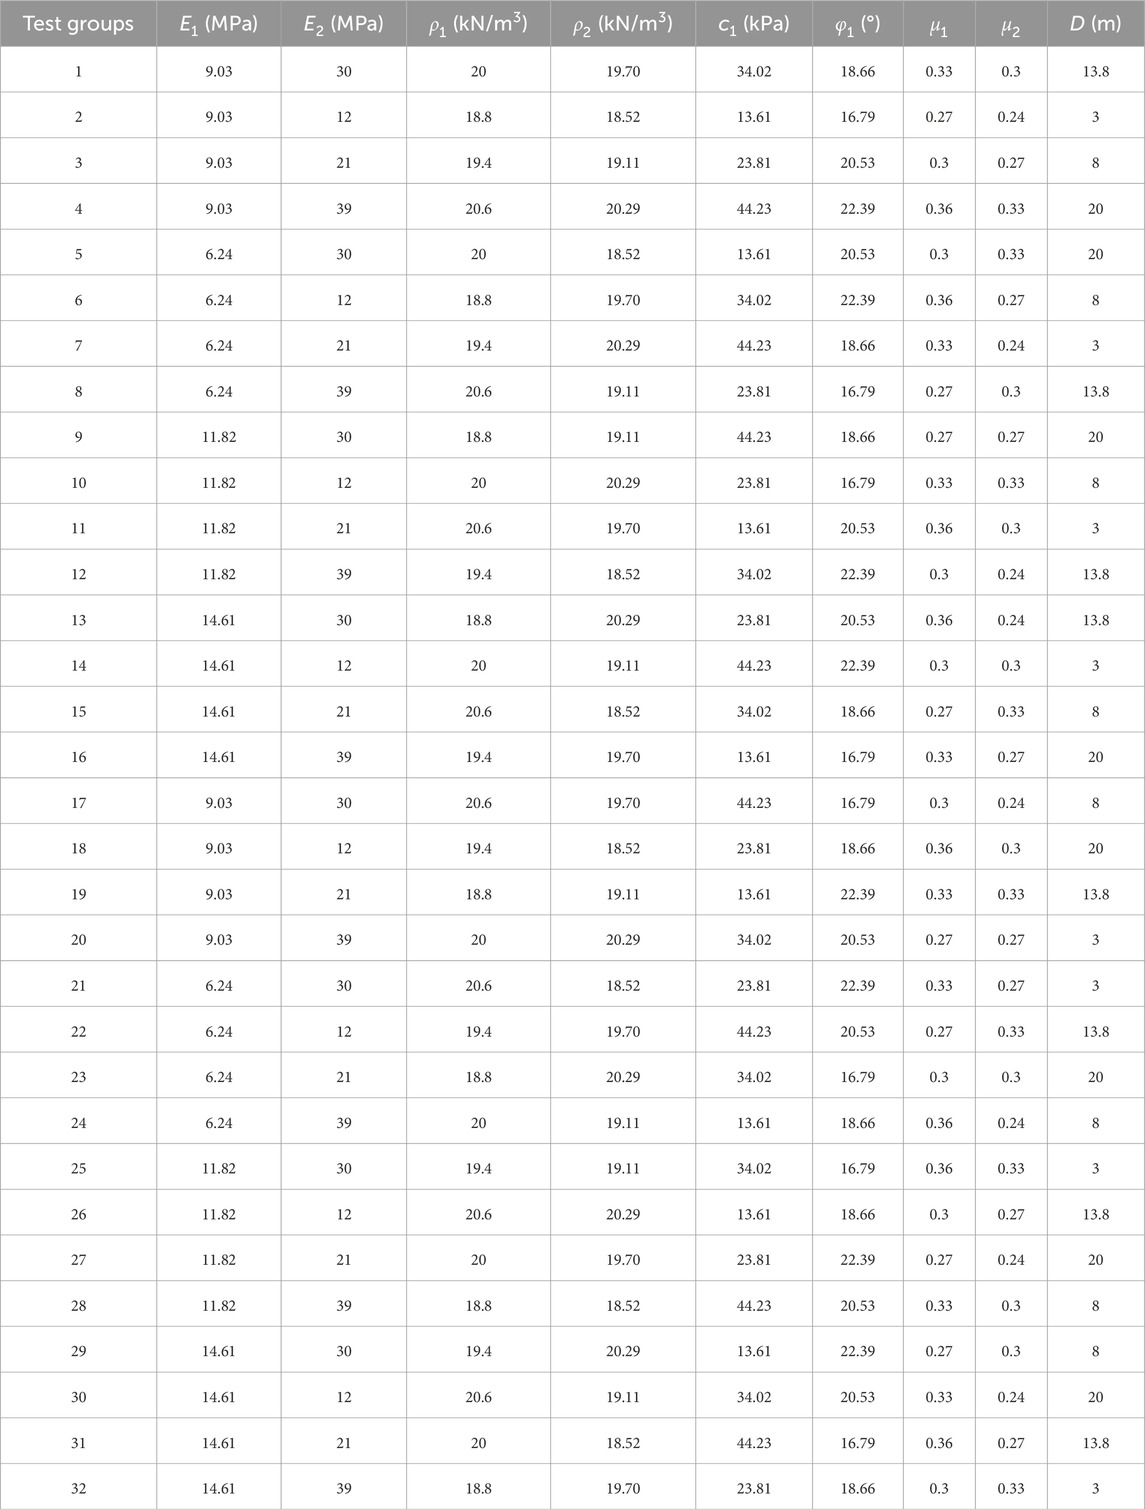
Table 4. Orthogonal test table.
The normalized parameters calculated by Equation 5 are as follows Equation 6.
3 Project overview
Figure 4 shows the plan view of a newly constructed foundation pit. The pit measures 212.4 m in length, 26.4 m in width, and 16.7 m in depth. According to the geotechnical investigation report, the site is composed of silty clay, sandy soil, and argillaceous siltstone from top to bottom (Figure 5). A representative existing building, located approximately 13.8 m from the foundation pit, is a six-story shear wall frame structure. Prior to excavation, construction personnel observed a continuous crack 33 mm deep at the junction between the shear wall and the top slab on the top floor of the building (Figure 6), along with other minor cracks. Clearly, this building is already damaged, and the disturbance caused by new foundation pit excavation is likely to cause further or accelerated damage. To ensure the safety of the existing structure during foundation pit excavation, a thorough assessment and analysis are necessary.
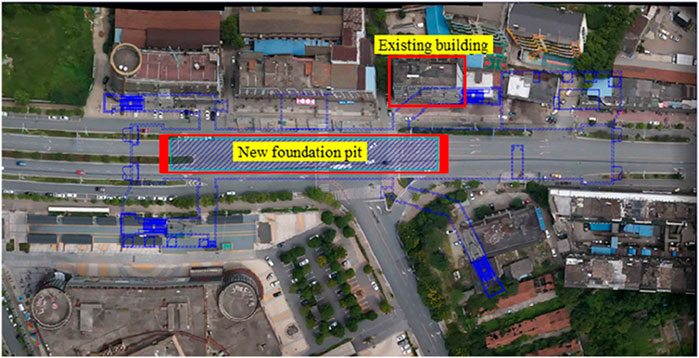
Figure 4. Plan view of the foundation pit.
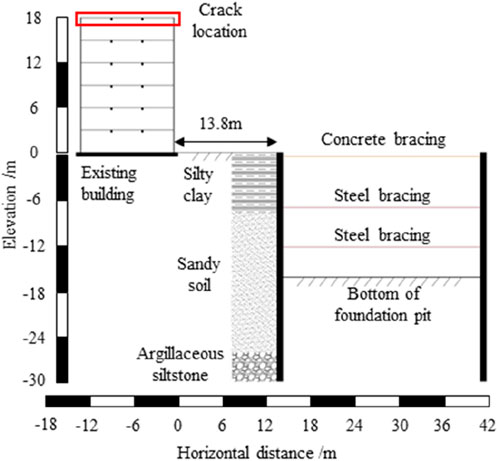
Figure 5. Geological profile and spatial relationships of surrounding buildings.
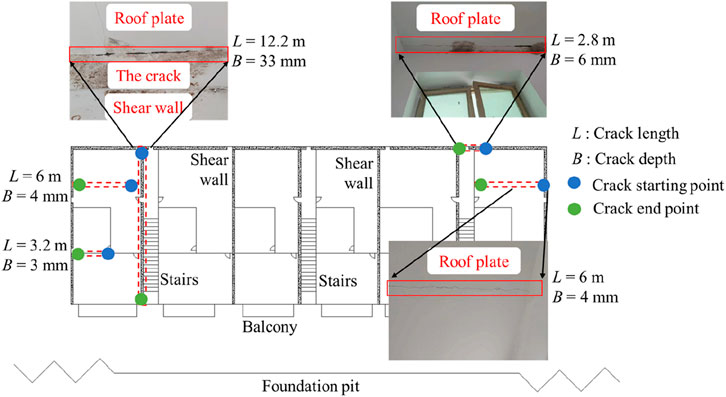
Figure 6. Crack damage in adjacent existing buildings (6th floor).
Although the building has multiple cracks, only one crack is relatively deep, classified as a medium-to-deep crack. Such medium-to-deep cracks are typically caused by factors such as significant shear forces, bending moments, or uneven settlement acting on shear walls. If not addressed in a timely manner, these cracks may further develop and affect the structural stability. The other cracks are relatively shallow and are considered surface cracks, which generally have little impact on the structural safety. Therefore, after considering the computational efficiency and cost, this study only takes the most severe crack into account in the calculations, while neglecting the other minor cracks.
4 Analysis and model application
4.1 FEM-XFEM analysis
As shown in Figure 7, the crack propagation area at the top of the shear wall was extracted, and the results for each group are displayed in Figure 8. The analysis reveals the following: Figure 9.
(1) In groups 12 and 16, no crack propagation was observed. In contrast, Group 2 experienced the most severe crack propagation, with a crack length of 9.6 m and an average depth of 0.156 m. The other groups displayed varying degrees of damage propagation. Notably, in several cases, cracks extended to the top slab of the building, with the total crack length in Group 22 exceeding 14 m.
(2) As the building’s differential settlement increases, stress concentration occurs at the crack tip. When the stress intensity factor at the crack tip reaches the fracture toughness of the concrete, cracks begin to form (Kumar and Barai, 2009). Cracks in the shear wall significantly alter the stress distribution in the top slab, eventually leading to crack propagation into the slab. Figure 9 shows the computational results for the top slab under varying degrees of damage. The figure shows that the crack initiates above the shear wall and gradually extends toward the center of the building. The specific distribution and propagation of cracks are detailed in Table 5.
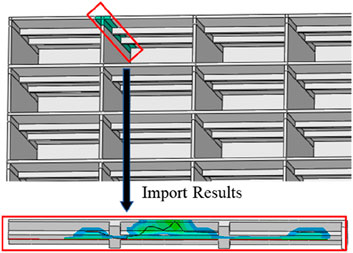
Figure 7. Schematic of the results extraction.
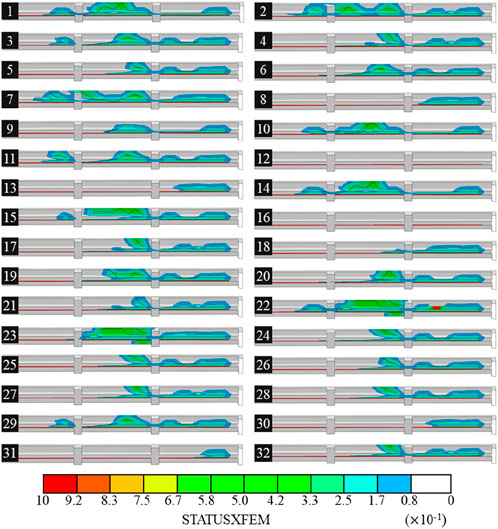
Figure 8. Crack propagation in shear walls under different conditions.
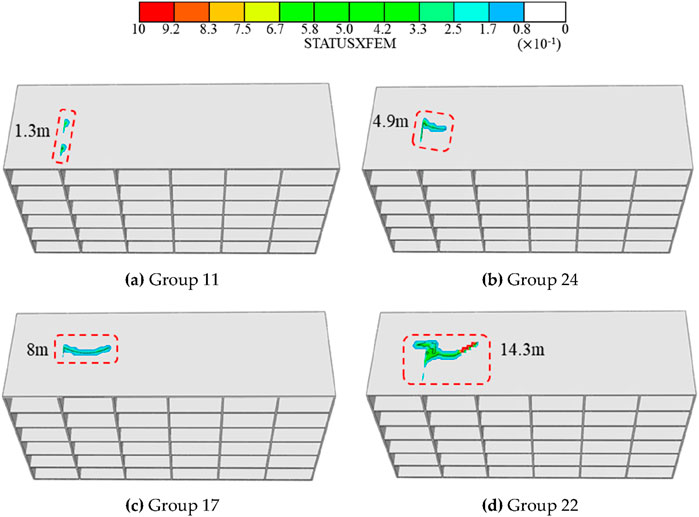
Figure 9. Crack cloud diagram of the top slab at different damage levels. (a) Group 11 (b) Group 24 (c) Group 17 (d) Group 22.
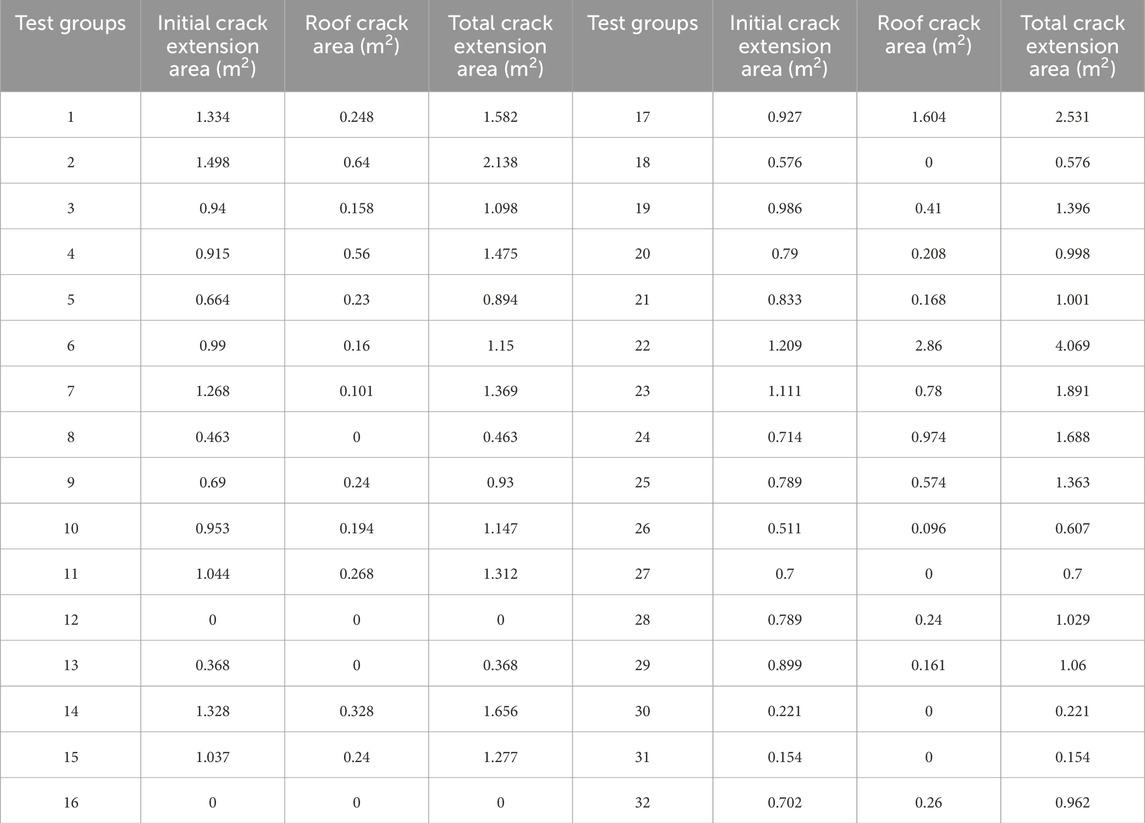
Table 5. Summary of the orthogonal test results.
4.2 RSM prediction model
The response surface model was constructed based on the orthogonal test results, and the regression coefficients were calculated using ridge regression in MATLAB. Table 6 presents the regression coefficients obtained from the model (the intercept is 1.896), which describe the influence of each factor on crack propagation.
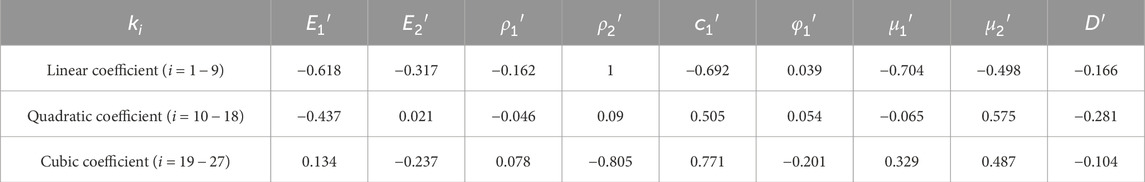
Table 6. Regression coefficients for the crack propagation prediction model.
5 Results and discussion
5.1 FEM-XFEM and RSM model results
The comparison between the numerical simulation results of 32 working conditions and the values predicted from the response surface function is shown in Figure 10. In civil engineering and fracture mechanics, data typically exhibit high variability and uncertainty, and if the mean squared error (MSE) is less than 0.4, the fit is considered good (Güçlüer et al., 2021; Chai et al., 2023; Salami et al., 2021). In this study, the ridge regression MSE was 0.15, confirming the reliability of the predictions for crack propagation in existing buildings.
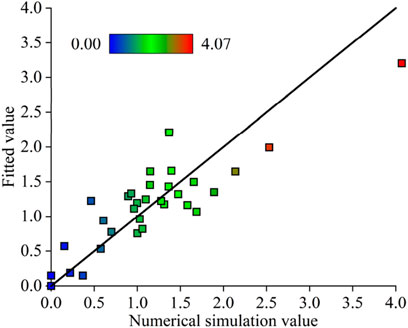
Figure 10. Fitting accuracy of the response surface function.
To verify the predictive effectiveness of the above model, four random working conditions, as shown in Table 7, were selected. Finite element calculations were performed to obtain the damage development for each condition (Figure 11), specifically the crack propagation area, and the results were compared with those predicted by the model, as shown in Figure 12. The analysis reveals that the damage trends predicted by the model closely match the numerical simulation results, indicating that the established response surface model can effectively predict damage propagation in buildings affected by foundation pit excavation.
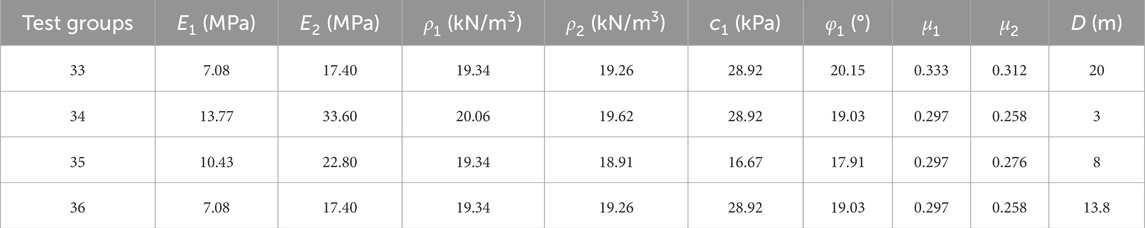
Table 7. Parameters of the validation conditions.
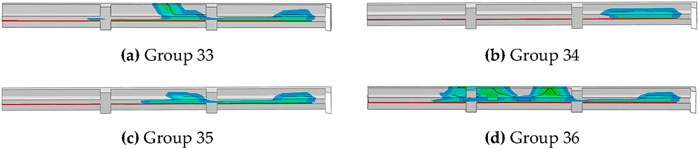
Figure 11. Damage cloud diagram of buildings under validation conditions. (a) Group 33 (b) Group 34 (c) Group 35 (d) Group 36.
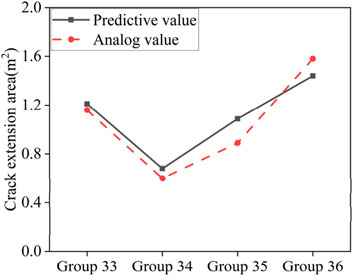
Figure 12. Comparison of predicted and simulated damage in buildings.
The FEM-XFEM model provides detailed, high-accuracy predictions of crack initiation and propagation, but it is computationally expensive, particularly when simulating a large number of scenarios. In contrast, the RSM model offers a computationally efficient alternative, though it sacrifices some precision for speed. The comparison between the two models reveals that both models are effective, but the choice between them depends on the specific application—FEM-XFEM is preferable for detailed analysis, while RSM is more suitable for rapid predictions across multiple scenarios.
5.2 Significance analysis of influencing factors
To analyse the sensitivity of building damage to various influencing factors, further calculations were conducted to determine the Pearson Product-Moment Correlation Coefficient (PPMCC) and the Maximal Information Coefficient (MIC) between the total crack propagation area and each parameter. The PPMCC measures the linear relationship between variables, with values ranging from −1 to 1, whereas the MIC measures the nonlinear relationship between variables, with values ranging from 0 to 1. The results are shown in Figure 13, and the analysis reveals the following:
(1) In terms of the MIC, the distance between the foundation pit and the building (
(2) Considering both MIC and PPMCC,
(3) Some parameters, such as
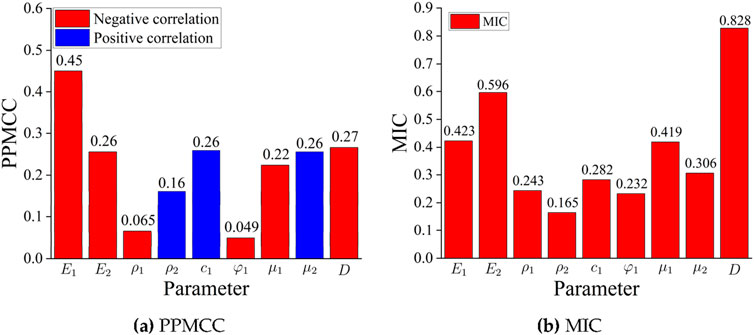
Figure 13. Correlation coefficients between the crack propagation area and various. (a) PPMCC (b) MIC.
5.3 Sensitivity analysis of influencing factors in the prediction model
To analyse the influence of each factor on building crack propagation individually, all other factors were set to their average values while the target factor was varied. For each target factor, standardized values were selected at intervals of 0.01. This study involves nine influencing factors, resulting in a total of 900 scenarios. The prediction model from Section 4.2 was used to calculate the crack propagation area for each scenario. Figure 14 illustrates the impact of each of the nine influencing factors on crack propagation. The analysis reveals:
(1) The trends for
(2) Identifying high-sensitivity regions in crack propagation analysis is crucial. In addition to
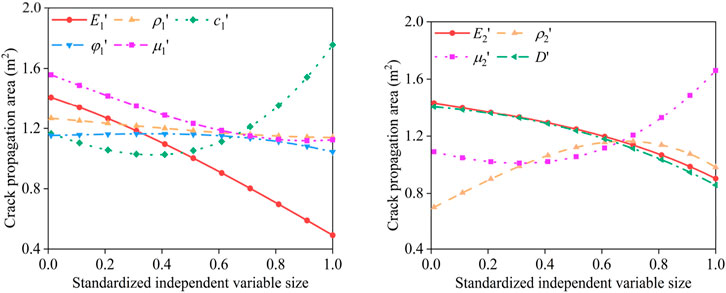
Figure 14. Patterns of influence of various factors.
6 Conclusion
This study aimed to address two key research questions:
(1) How does foundation pit excavation impact crack propagation in adjacent buildings?
(2) Can a predictive model effectively quantify the influence of soil properties and distance on crack behavior?
The investigation utilized FEM-XFEM and RSM models to analyze the crack propagation induced by foundation pit excavation. The results demonstrate the significant role of soil properties and spatial parameters in influencing structural damage. The findings highlight that both models effectively predict crack propagation, with the RSM providing a computationally efficient framework for large-scale parameter studies.
(1) This work selects nine parameters, including the distance between the foundation pit and the building, the elastic modulus of the soil, its density, and Poisson’s ratio, as independent variables, and the crack propagation area of existing adjacent buildings as the dependent variable. On the basis of an orthogonal test, 32 working conditions were set up, and the crack propagation areas for different conditions were calculated via the FEM-XFEM model. The results of the orthogonal test indicated that the elastic modulus, Poisson’s ratio of the soil, and distance between the building and the foundation pit significantly influence crack propagation in buildings. Building crack propagation was negatively correlated with the soil elastic modulus, the Poisson’s ratio of silty clay, and the distance from the pit and positively correlated with the Poisson’s ratio of sandy soil and the cohesion of silty clay.
(2) Using the ridge regression model, the results from the 32 conditions were fitted to create a predictive model for building crack propagation. The MSE results confirmed a good fit, and the effectiveness of the predictive model was further validated with four additional working conditions.
(3) The predictive model was used to conduct a single-factor analysis of the nine influencing factors, and the effects of these factors were visualized. The results showed that the behavior of
While this study provides valuable insights into the relationship between foundation pit excavation and crack propagation, several limitations should be acknowledged. First, the use of simplified assumptions regarding soil behavior and crack propagation limits the ability to capture the full complexity of real-world conditions. Additionally, the absence of comprehensive field data for model validation restricts the study’s generalizability. Future research should focus on incorporating dynamic loading effects, such as seismic activity, and explore interactions between multiple cracks and heterogeneous soil layers. Collaborative efforts to collect real-world excavation data would significantly enhance the model’s applicability and reliability.
Data availability statement
The original contributions presented in the study are included in the article/supplementary material, further inquiries can be directed to the corresponding author.
Author contributions
ZW: Conceptualization, Funding acquisition, Resources, Writing – original draft. TW: Methodology, Resources, Writing – original draft. YK: Data curation, Investigation, Validation, Writing – original draft. ZZ: Investigation, Project administration, Validation, Writing – original draft. FX: Formal Analysis, Writing – original draft. PY: Data curation, Formal Analysis, Writing – original draft, Writing – review and editing.
Funding
The author(s) declare that financial support was received for the research and/or publication of this article. This research was funded by “Research on Construction Techniques for Subway Deep Foundation Pits Near Structures and Buildings (2021)” and “Science and Technology Plan Project of China Construction Third Engineering Bureau (2022)”.
Conflict of interest
Author ZW was employed by Metro Project Management Branch of Nanchang Rail Transit Group Co., Ltd. Author TW was employed by CCTEB Infrastructure Construction Investment Co., Ltd. Authors YK and ZZ were employed by China Construction Third Engineering Bureau Group Co., Ltd.
The remaining authors declare that the research was conducted in the absence of any commercial or financial relationships that could be construed as a potential conflict of interest.
Generative AI statement
The author(s) declare that Generative AI was used in the creation of this manuscript. Generative AI was used during the preparation of this work the author(s) used ChatGPT in order to retranslation and optimization. After using ChatGPT, the author(s) reviewed and edited the content as needed and take(s) full responsibility for the content of the publication.
Publisher’s note
All claims expressed in this article are solely those of the authors and do not necessarily represent those of their affiliated organizations, or those of the publisher, the editors and the reviewers. Any product that may be evaluated in this article, or claim that may be made by its manufacturer, is not guaranteed or endorsed by the publisher.
Abbreviations
References
Arapakou, A. E., and Papadopoulos, V. P. (2012). Factors affecting differential settlements of framed structures. Geotech. Geol. Eng. 30 (6), 1323–1333. doi:10.1007/s10706-012-9546-x
Arshad, A. R. A. (2016). A review on selection of tunneling method and parameters effecting ground settlements. Electron. J. Geotechnical Eng. 21, 4459–4475. doi:10.1016/j.tust.2020.103614
Ávila, F., Puertas, E., Torrús, C., and Gallego, R. (2024). Influence of crack propagation on the seismic behavior of historic rammed earth buildings: the Tower of Muhammad in the Alhambra (Spain). Eng. Struct. doi:10.1016/j.engstruct.2023.117365
Cao, C., Shi, C., Liu, L., and Liu, J. (2020). Evaluation of the effectiveness of an alternative to control groundwater inflow during a deep excavation into confined aquifers. Environ. EARTH Sci. 79 (22), 502. doi:10.1007/s12665-020-09253-3
Cao, J., Liu, T., and Liu, H. M. (2014). Soil nailing reliability optimization design of foundation pit based on response surface method. Appl. Mech. Mater. 556-562, 4655–4659. doi:10.4028/www.scientific.net/amm.556-562.4655
Chai, M., Liu, P., He, Y., Han, Z., Duan, Q., Song, Y., et al. (2023). Machine learning-based approach for fatigue crack growth prediction using acoustic emission technique. FATIGUE Fract. Eng. M. 46 (8), 2784–2797. doi:10.1111/ffe.14032
Chen, L., and Ma, H. (2018). Sensitivity analysis of influencing factors of deep foundation pit engineering support structure design in soft soil area. AIP Conf. Proc. 1995 (1), 020027. doi:10.1063/1.5048758
Deng, Y., Guo, Y., Zou, B., Wang, J., Liu, X., Chen, Q., et al. (2023). Failure analysis and zoning control of water gushing in foundation pit. Eng. FAIL Anal. 145, 107029. doi:10.1016/j.engfailanal.2022.107029
Ding, L. Y., Wu, X. G., Li, H., Luo, H. B., and Zhou, Y. (2011). Study on safety control for Wuhan metro construction in complex environments. Int. J. Proj. Manag. 29 (7), 797–807. doi:10.1016/j.ijproman.2011.04.006
Dmochowski, G., and Szolomicki, J. (2021). Technical and structural problems related to the interaction between a deep excavation and adjacent existing buildings. Appl. Sci. 11 (2), 481. doi:10.3390/app11020481
Güçlüer, K., Özbeyaz, A., Göymen, S., and Günaydın, O. (2021). A comparative investigation using machine learning methods for concrete compressive strength estimation. MATER TODAY Commun. 27, 102278. doi:10.1016/j.mtcomm.2021.102278
Han, M., Li, Z., Mei, G., Bao, X., Jia, J., Liu, L., et al. (2022). Characteristics of subway excavation in soft soil and protective effects of partition wall on the historical building and pile foundation building. B Eng. Geol. Environ. 81 (8), 307. doi:10.1007/s10064-022-02802-z
Han, W., Li, G., Sun, Z., Luan, H., Liu, C., and Wu, X. (2020). Numerical investigation of a foundation pit supported by a composite soil nailing structure. SYMMETRY-BASEL 12 (2), 252. doi:10.3390/sym12020252
Hsieh, P., and Ou, C. (1998). Shape of ground surface settlement profiles caused by excavation. Can. Geotech. J. 35, 1004–1017. doi:10.1139/t98-056
Hu, Z., Lei, M., Zhang, H., Jia, C., and Shi, C. (2024). Ultimate support pressure determination for shield tunnel faces in saturated strata based on seepage flow control. Appl. Sci. 14 (15), 6781. doi:10.3390/app14156781
Hu, Z., Wang, Q., Yang, S., Shi, Z., Liu, B., Song, H., et al. (2021). Numerical simulation of soil displacement and settlement in deep foundation pit excavations near water. GEOFLUIDS 2021, 1–14. doi:10.1155/2021/5559009
Jafarifar, N., Pilakoutas, K., and Bennett, T. (2016). The effect of shrinkage cracks on the load bearing capacity of steel-fibre-reinforced roller-compacted-concrete pavements. MATER Struct. 49 (6), 2329–2347. doi:10.1617/s11527-015-0652-0
Kachanov, M. (1992). Effective elastic properties of cracked solids: critical review of some basic concepts. Appl. Mech. Rev. 8 (45), 304–335. doi:10.1115/1.3119761
Kaklauskas, G., and Ghaboussi, J. (2001). Stress‒strain relations for cracked tensile concrete from RC beam tests. J. Struct. Eng. (New York, N.Y.) 127 (1), 64–73. doi:10.1061/(asce)0733-9445(2001)127:1(64)
Kim, C. Y., Bae, G. J., Hong, S. W., Park, C. H., Moon, H. K., and Shin, H. S. (2001). Neural network based prediction of ground surface settlements due to tunnelling. Comput. Geotech. 28 (6-7), 517–547. doi:10.1016/s0266-352x(01)00011-8
Korff, M., Mair, R. J., and Van Tol, F. A. F. (2016). Pile‒soil interaction and settlement effects induced by deep excavations. J. Geotech. GEOENVIRON 142 (8). doi:10.1061/(asce)gt.1943-5606.0001434
Kumar, S., and Barai, S. V. (2009). Determining double-K fracture parameters of concrete for compact tension and wedge splitting tests using weight function. Eng. Fract. Mech. 76 (7), 935–948. doi:10.1016/j.engfracmech.2008.12.018
Laxman, K. C., Tabassum, N., Ai, L., Cole, C., and Ziehl, P. (2023). Automated crack detection and crack depth prediction for reinforced concrete structures using deep learning. Constr. Build. MATER 370, 130709. doi:10.1016/j.conbuildmat.2023.130709
Lei, M., Liu, L., Lin, Y., and Li, J. (2019). Study on flexural bearing capacity calculation method of enclosure pile with partial excision in deep foundation pit. Adv. Civ. Eng. 2019 (1). doi:10.1155/2019/4812857
Li, W., Wu, M., Hu, B., and Wang, P. (2024). Overcoming the brittleness of shear failure: a new FRP-RSC strengthening philosophy. COMPOS Struct. 330, 117857. doi:10.1016/j.compstruct.2023.117857
Li, Y., Ohkubo, T., Teramoto, A., Saga, K., and Kawashima, Y. (2022). Lab-scale reproduction test method for temperature-driven movement of through-thickness cracks in concrete exterior walls for crack repair evaluation. Constr. Build. MATER 331, 127169. doi:10.1016/j.conbuildmat.2022.127169
Liang, R., Xia, T., Huang, M., and Lin, C. (2017). Simplified analytical method for evaluating the effects of adjacent excavation on shield tunnel considering the shearing effect. Comput. Geotech. 81, 167–187. doi:10.1016/j.compgeo.2016.08.017
Lin, F., Song, X., Gu, X., Peng, B., and Yang, L. (2012). Cracking analysis of massive concrete walls with cracking control techniques. Constr. Build. MATER 31, 12–21. doi:10.1016/j.conbuildmat.2011.12.086
Liu, B., Wu, W., Lu, H., Chen, S., and Zhang, D. (2024). Effect and control of foundation pit excavation on existing tunnels: a state-of-the-art review. Tunn. Undergr. Sp. Tech. 147, 105704. doi:10.1016/j.tust.2024.105704
Liu, C., Peng, Z., Cui, J., Huang, X., Li, Y., and Chen, W. (2023). Development of crack and damage in shield tunnel lining under seismic loading: refined 3D finite element modeling and analyses. THIN WALL Struct. 185, 110647. doi:10.1016/j.tws.2023.110647
Liu, J., Shi, C., Cao, C., Lei, M., and Wang, Z. (2020). Improved analytical method for pile response due to foundation pit excavation. Comput. Geotech. 123, 103609. doi:10.1016/j.compgeo.2020.103609
Liu, L., Lei, M., Cao, C., and Shi, C. (2019). Dewatering characteristics and inflow prediction of deep foundation pits with partial penetrating curtains in sand and gravel strata. WATER-SUI 11 (10), 2182. doi:10.3390/w11102182
Liu, Z., Xue, J., Ye, J., and Qian, J. (2021). A simplified two-stage method to estimate the settlement and bending moment of upper tunnel considering the interaction of undercrossing twin tunnels. Transp. Geotech. 29, 100558. doi:10.1016/j.trgeo.2021.100558
Lu, B. (2021). Study on back analysis methodof soil parameter uncertainty in excavation deformation calculation of foundation pit. Nanjing: Southeast University.
Luo, P., and Li, C. (2019). Numerical simulation analysis of the influence of foundation pit excavation on the surrounding buildings of an office building. lOP Conf. Ser. Earth Environ. Sci. 252, 052077. doi:10.1088/1755-1315/252/5/052077
Ou, W., Chen, X., Chan, A., Cheng, Y., and Wang, H. (2022). FDEM simulation on the failure behavior of historic masonry heritages subjected to differential settlement. BUILDINGS-BASEL. 12 (10), 1592. doi:10.3390/buildings12101592
Salami, B. A., Olayiwola, T., Oyehan, T. A., and Raji, I. A. (2021). Data-driven model for ternary-blend concrete compressive strength prediction using machine learning approach. Constr. Build. MATER 301, 124152. doi:10.1016/j.conbuildmat.2021.124152
Shi, C., Cao, C., Lei, M., Peng, L., and Ai, H. (2016). Effects of lateral unloading on the mechanical and deformation performance of shield tunnel segment joints. Tunn. Undergr. Sp. Tech. 51, 175–188. doi:10.1016/j.tust.2015.10.033
Shi, C., Sun, X., Liu, S., Cao, C., Liu, L., and Lei, M. (2021). Analysis of seepage characteristics of a foundation pit with horizontal waterproof curtain in highly permeable strata. WATER-SUI 13 (9), 1303. doi:10.3390/w13091303
Sou-Sen, L., and Hsien-Chuang, L. (2004). Neural-network-based regression model of ground surface settlement induced by deep excavation. Autom. Constr. 13 (3), 279–289. doi:10.1016/s0926-5805(03)00018-9
Tirca, LLAH (2017). High-rise building subjected to excessive settlement of its foundation-A case study. lnternational J. Struct. lntegrity 2 (8). doi:10.1108/ijsi-05-2016-0019
Wang, G., Chen, W., Cao, L., Li, Y., Liu, S., Yu, J., et al. (2021). Retaining Technology for deep foundation pit excavation adjacent to high-speed railways based on deformation control. Front. EARTH SC-SWITZ 9. doi:10.3389/feart.2021.735315
Wang, K., Yang, Z., Guo, J., Dang, Y., and Yan, Y. (2023a). Numerical analysis of the influence of deep excavation on nearby pile foundation building. BUILDINGS-BASEL 13 (11), 2842. doi:10.3390/buildings13112842
Wang, P., Wu, H., Ke, L., Li, W., and Leung, C. K. Y. (2023b). Mechanical properties and microstructure of glass fiber reinforced polymer (GFRP) rebars embedded in carbonated reactive MgO-based concrete (RMC). Cem. Concr. Compos. 142, 105207. doi:10.1016/j.cemconcomp.2023.105207
Wei, H., Sang-Bing, T., and Tsai, S. (2021). Influence of foundation pit excavation and precipitation on settlement of surrounding buildings. Adv. Civ. Eng. 2021 (1). doi:10.1155/2021/6638868
Xu, Q., Xie, J., Lu, L., Wang, Y., Wu, C., and Meng, Q. (2024). Numerical and theoretical analysis on soil arching effect of prefabricated piles as deep foundation pit supports. Undergr. SPACE 16, 314–330. doi:10.1016/j.undsp.2023.09.011
Xue, H. (2023). Research on the control of excavation deformation of super deep foundation pit adjacent to the existing old masonry structure building. SUSTAINABILITY-BASEL 15 (9), 7697. doi:10.3390/su15097697
Yan, X., Tong, L., Li, H., Huang, S., Fu, Y., Wang, W., et al. (2024). Effects of the excavation of deep foundation pits on adjacent approach bridges: a case study of Nanjing Yangtze River Bridge. J. Civ. Struct. HEALTH 15, 1185–1205. doi:10.1007/s13349-024-00875-w
Yang, P., Lei, M., Hu, Z., Xiao, F., Jiang, T., and Zhong, Q. (2024). Analysis of the impact of new pit construction projects on the crack expansion of existing buildings. Eng. FAIL Anal. 162, 108431. doi:10.1016/j.engfailanal.2024.108431
Ye, S., Zhao, Z., and Wang, D. (2021). Deformation analysis and safety assessment of existing metro tunnels affected by excavation of a foundation pit. Undergr. SPACE 6 (4), 421–431. doi:10.1016/j.undsp.2020.06.002
Zhang, D. (2023). Influences of deep foundation pit excavation on the stability of adjacent ancient buildings. BUILDINGS-BASEL 13 (8), 2004. doi:10.3390/buildings13082004
Zhao, C., Feng, Y., Wang, W., and Niu, Z. (2023). Mechanical properties and numerical analysis of underground continuous wall in underground grain silo foundation pit. BUILDINGS-BASEL. 13 (2), 293. doi:10.3390/buildings13020293
Zhong, W., Huang, N., Nie, N., Ding, H., and Gao, F. (2023). Study on the influence of excavation of superlarge and ultra-deep foundation pits on the pile foundation of existing viaducts. Adv. Civ. Eng. 2023, 1–13. doi:10.1155/2023/5834958
Keywords: impact of foundation pit excavation, crack propagation prediction, damage in adjacent buildings, response surface methodology, finite element method
Citation: Wu Z, Wang T, Kuang Y, Zhu Z, Xiao F and Yang P (2025) A combined XFEM and RSM approach for predicting crack propagation in nearby buildings during foundation pit construction. Front. Built Environ. 11:1514217. doi: 10.3389/fbuil.2025.1514217
Received: 20 October 2024; Accepted: 21 April 2025;
Published: 01 May 2025.
Edited by:
Peng Wang, Shenzhen University, ChinaReviewed by:
Masoud Salar, Chabahar Maritime University, IranGeorgios Eleftherios Stavroulakis, Technical University of Crete, Greece
Tianyu Wang, Hong Kong University of Science and Technology, Hong Kong SAR, China
Shangtao Hu, Guangzhou University, China
Copyright © 2025 Wu, Wang, Kuang, Zhu, Xiao and Yang. This is an open-access article distributed under the terms of the Creative Commons Attribution License (CC BY). The use, distribution or reproduction in other forums is permitted, provided the original author(s) and the copyright owner(s) are credited and that the original publication in this journal is cited, in accordance with accepted academic practice. No use, distribution or reproduction is permitted which does not comply with these terms.
* Correspondence: Pengliang Yang, eXBlbmdsaWFuZ0AxMjYuY29t