 Ling Chen1
 Huihui Guo
- 1Guangdong Transportation Group Co., Ltd., Guangzhou, China
- 2School of Electrical and Control Engineering, North China University of Technology, Beijing, China
As the economy continues to develop rapidly, traffic volume on highways has increased dramatically, leading to increasingly severe congestion issues. In response, expanding expressways to two-way ten-lane configurations has become a mainstream strategy to alleviate traffic pressure. Given the absence of unified national standards for the design of two-way ten-lane highways, this study explores the relationship between the form and design parameters of speed change lanes. Using VISSIM simulation and the Surrogate Safety Assessment Model, we investigate the impact of different speed change lane lengths on traffic efficiency and safety under various traffic flow conditions on renovated and expanded two-way ten-lane highways. Key performance indicators include average delay time, average queue length, number of conflicts, and Post-Encroachment Time. The results show that, at a mainline design speed of 120 km/h, a 270-m acceleration lane reduces conflicts by 47.6% compared to conventional lengths, while a 161-m deceleration lane achieves a 32.8% reduction. This study provides crucial insights for the rational design of speed change lane lengths on two-way ten-lane highways, ultimately enhancing road capacity, improving safety, and optimizing traffic resource allocation.
1 Introduction
In recent years, rapid economic growth has significantly increased transportation demand, exceeding the capacity of existing four- to six-lane expressways. Expanding highways to two-way ten-lane configurations has become a primary strategy to alleviate congestion. However, the deployment of ten-lane expressways has exposed nonlinear scaling challenges absent in traditional six-lane standards.
The AASHTO Green Book (2018) specifies a minimum acceleration lane length of 335 m (including tapers) for 100 km/h design speed (AASHTO, 2018), derived from six-lane scenarios. Critically, this standard fails to address two key ten-lane complexities:
(1) Amplified lateral friction effects from extended vehicle paths across five or more lanes;
(2) Conflict cascading risks where local disruptions propagate across multiple lanes.
European practices reveal similar gaps. While German RAL Guidelines (2019) (German Federal Ministry of Transport and Digital Infrastructure, 2019) optimize six-lane dynamics, they lack geometric parameters for ten-lane designs such as sight distance adjustments and heavy-truck acceleration zones. Eurocode 1 (European Committee for Standardization, 2020) defines loads for up to eight lanes but omits ten-lane provisions—treating them as extrapolations rather than distinct systems.
Interchanges remain critical bottlenecks, with ramp terminals accounting for 44%–52% of entry/exit crashes (He et al., 2024). Poor speed change lane designs exacerbate ten-lane-specific risks including extended decision zones in multi-lane merges and speed differentials between inner high-speed lanes and outer truck-dominated lanes.
Although prior studies optimized speed change lanes for six or fewer lanes (Tian et al., 2022), no research has systematically calibrated designs for two-way ten-lane expressways under heavy-truck conditions using integrated VISSIM and SSAM simulation.
1.1 Objective and novelty
This study bridges this gap by developing a simulation framework to quantify how speed change lane lengths impact traffic efficiency (delay, queue length) and safety (conflict frequency, PET) on ten-lane expressways. Our novel contribution lies in establishing the first evidence-based design calibration for such highways under mixed heavy-truck flows using coupled microsimulation and surrogate safety modeling.
Interchanges, especially ramp entry and exit points, are major accident hotspots. Reports show that 44% of ramp exit crashes occur at terminal ends, while 52% of ramp entry crashes happen within merging zones (He et al., 2024). Poorly designed speed change lanes can worsen congestion and safety risks, particularly on multi-lane expressways. While prior studies have explored conventional speed change lane designs, research on high-capacity, ten-lane expressways remains limited.
The reconstructed GuangShao Expressway is a two-way ten-lane expressway with multiple lanes, a wide cross-section, and complex traffic organization (Tian et al., 2022). This study employs VISSIM simulation and the Surrogate Safety Assessment Model (SSAM) to systematically evaluate the effects of varying speed change lane lengths on traffic efficiency and safety under different traffic flow conditions. The objective is to provide scientific guidance for designing speed change lanes on two-way ten-lane expressways, enhancing road performance, meeting transportation demands, and improving national expressway safety and efficiency.
2 Calculation of speed change lane length
Given the high proportion of heavy-duty trucks on expressways in China and their limited acceleration capabilities, ensuring sufficient space for safe merging without queuing or forced merging is crucial to prevent safety risks. Longer parallel acceleration lanes are therefore necessary. In contrast, the design of deceleration lanes should prioritize both driver convenience and safety. Since parallel deceleration lanes often involve complex trajectories, direct deceleration lanes are commonly employed (Zhang et al., 2023). The calculations in this study are based on the design of parallel acceleration and direct deceleration lanes.
2.1 Calculation of acceleration lane length
Vehicles accelerate along the parallel acceleration lane segment, designated as
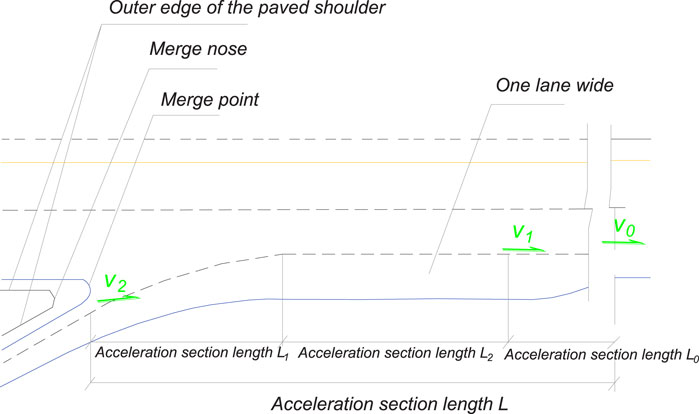
Figure 1. Parallel acceleration lane.
The total length of the acceleration lane is calculated as follows:
where

Table 1. Length of speed change lane transition section.
The length of the acceleration section,
Here, a represents the average acceleration in the
The auxiliary lane length,
where
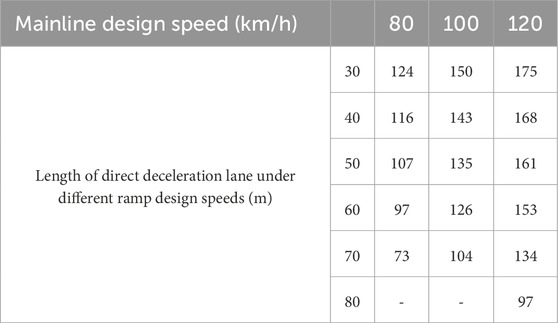
Table 2. Length of Direct Deceleration Lane.
2.2 Calculation of deceleration lane length
In the direct deceleration lane, vehicles first pass through the transition section,
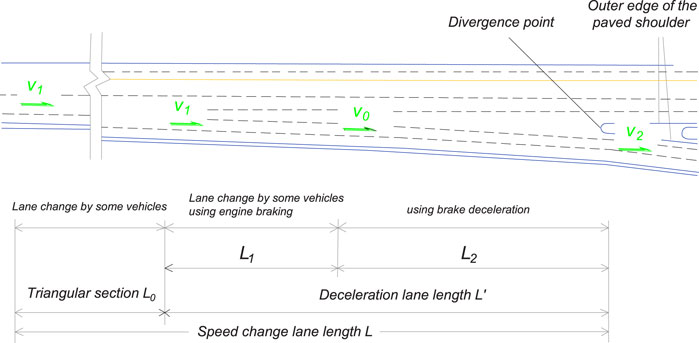
Figure 2. Direct deceleration lane.
Therefore, the formula for calculating the deceleration lane length is given by (Xu, 2008):
where
In this equation,
Based on Equations 4–6, the lengths of the direct deceleration lanes on the mainline and ramp for different design speeds are calculated, as shown in Table 3.
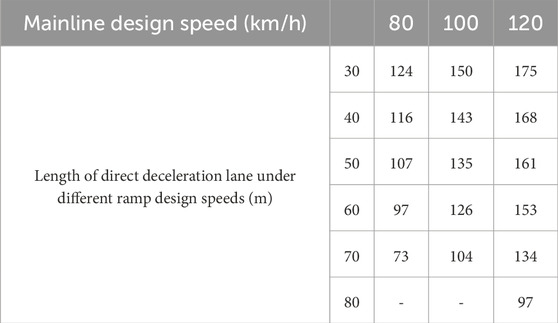
Table 3. Length of direct deceleration lane.
3 Analysis of safety impacts based on VISSIM simulation and SSAM
VISSIM, developed by PTV Group, is a microscopic simulation software designed to model urban and public transportation systems based on realistic driving behaviors and time intervals. It simulates various components, including lanes, traffic flows, signals, and public transit, providing an effective tool for evaluating traffic planning schemes (Xing, 2013).
3.1 Simulation of acceleration lanes
A VISSIM simulation was employed to construct a network model accurately representing the merging and diverging traffic flows at highway entrances and exits. The model was based on the existing road conditions, specifically the section where the G4 Beijing-Hong Kong-Macao Expressway intersects with the G45 Daqing-Guangzhou Expressway at a single-direction, five-lane merging point. The length of the simulated acceleration lane, including the auxiliary lane, was set at 230 m. The transition section and lane width were specified as 90 and 3.75 m, respectively. As illustrated in Figure 3, detectors were positioned 200 m before and after the entrance to record real-time traffic flow data for each lane in the vicinity of the event-triggering region.
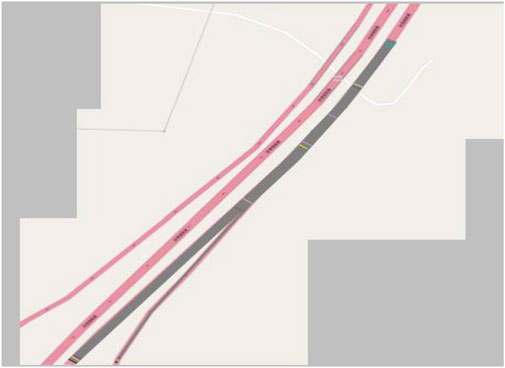
Figure 3. Detector setup and traffic data capture zones for the interchange entrance of G4 Beijing-Hong Kong-Macao expressway and G45 Daqing-Guangzhou expressway.
The mainline traffic flow was set at 8,000, 9,000, and 10,000 vehicles per hour (veh/h), with corresponding ramp traffic flows of 3,000, 3,300, and 3,600 veh/h, respectively. The simulation was conducted with the highest precision, using a time step of one second per simulation second. Each simulation run lasted 3,600 s. Based on the traffic composition, the relative proportions of passenger cars and heavy-duty trucks, as well as their desired speeds, were defined. Traffic operation data recorded at the detection points are shown in Figure 4.
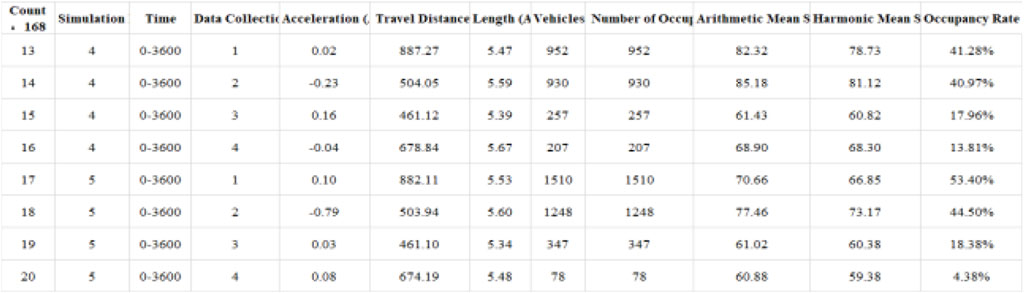
Figure 4. Traffic operation data recorded at detection points for the interchange entrance simulation.
To ensure that our VISSIM model accurately represents real traffic conditions, a rigorous calibration and validation process was carried out. The calibration involved adjusting model parameters such as vehicle arrival rates and driver behavior characteristics to match observed field data. Particular attention was given to key parameters like vehicle desired speeds and following distances, which were calibrated using field observation data collected from the study site. This calibration process involved comparing simulated traffic flow characteristics with real-world traffic data to ensure that the model accurately reflects actual driving behaviors. For validation, simulated traffic speeds and flow rates were compared with actual measurements collected from the study site. The model was fine-tuned until the simulated results closely aligned with the real-world observations, ensuring a high level of confidence in the model’s ability to replicate real traffic scenarios. Additionally, the following assumptions were made in the simulation setup: vehicle type distribution was set according to regional traffic statistics, no incidents or breakdowns occurred during the simulation period, and road conditions were maintained in a dry state to avoid the influence of adverse weather on traffic operations.
As specified in the Highway Route Design Specifications (JTG D20–2017), the eight-lane two-way expressway was expanded to a ten-lane configuration. The average delay time and queue length for the 230-m acceleration lane after expansion were compared to those of a standard two-way ten-lane expressway. The results are shown in Figures 5, 6.
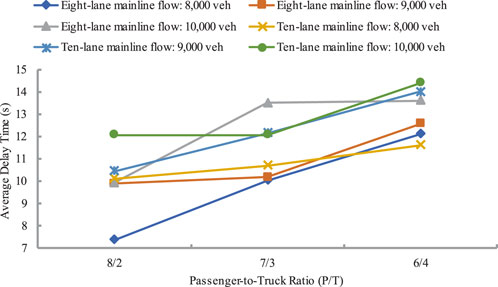
Figure 5. Comparison of average delay.
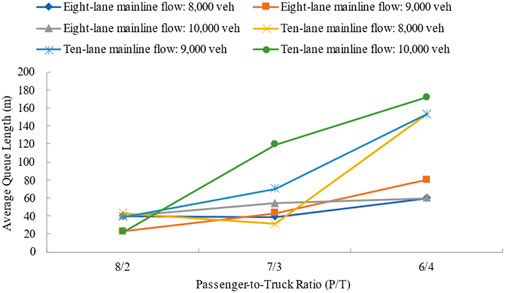
Figure 6. Comparison of average queue length.
As the number of lanes increases, the rise in mainline traffic flow significantly reduces vehicle speeds, leading to congestion in merging areas. Changes in traffic flow parameters, such as increased mainline input flow and a higher proportion of heavy-duty trucks, exacerbate congestion in the merging area, When mainline flow increased from 8,000 to 10,000 veh/h, average delay for 230 m lanes rose from 9.6s to 12.8s (+33.3%) under 8/2 passenger-truck ratio (Figure 7a), negatively affecting traffic efficiency. Under 10,000 veh/h flow:
- 6/4 ratio showed 168 m queues vs. 40 m at 8/2 ratio (+320%) in 230 m lanes (Figure 8a).
- 345 m lanes: 196 m vs. 21 m queues (+833%) (Figure 8d).
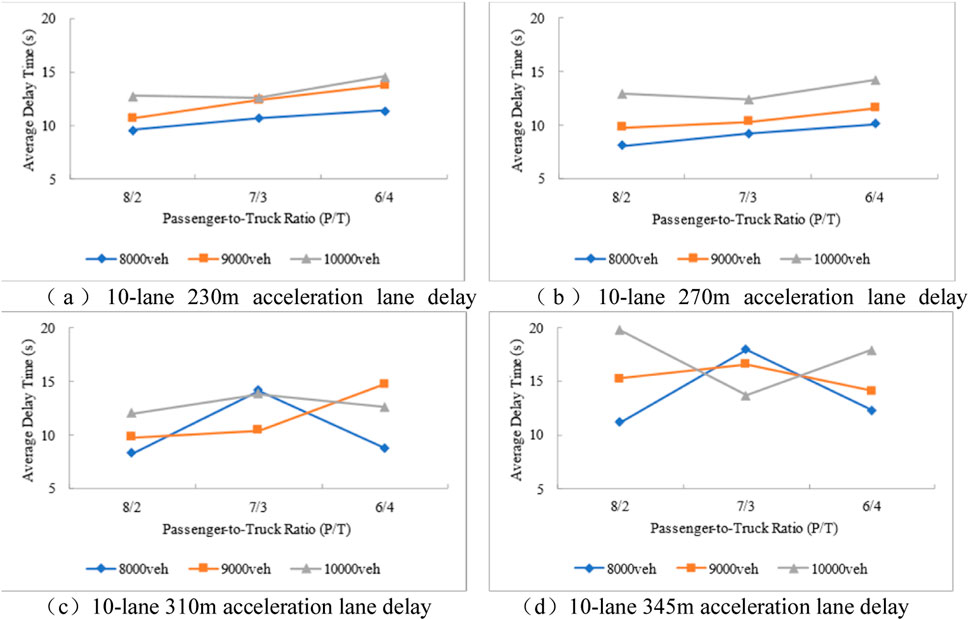
Figure 7. Comparison of Average Delay (a) 10-lane 230 m acceleration lane delay (b) 10-lane 270 m acceleration lane delay (c) 10-lane 310 m acceleration lane delay (d) 10-lane 345 m acceleration lane delay.
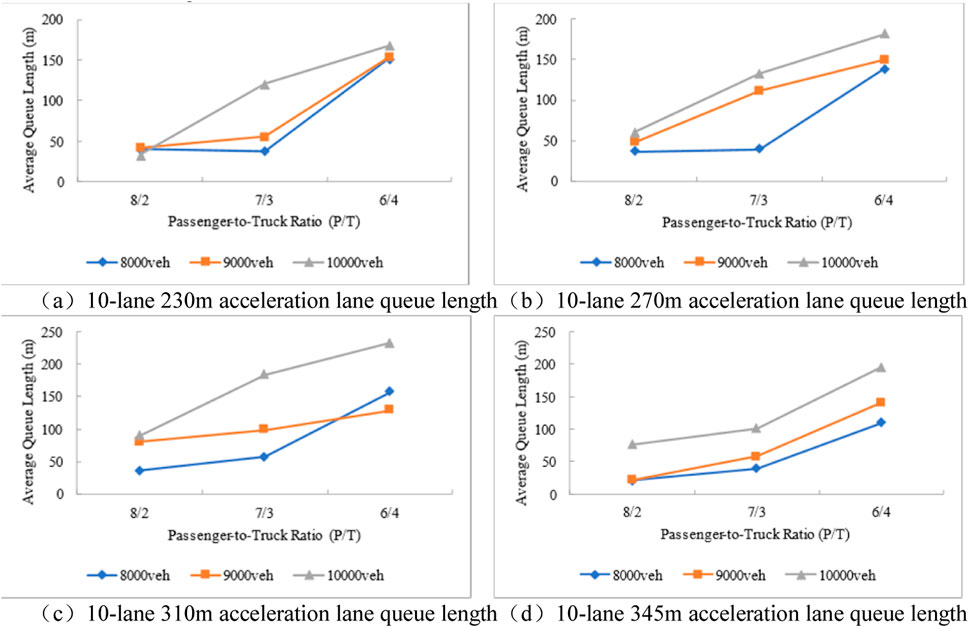
Figure 8. Comparison of Average Queue Length (a) 10-lane 230 m acceleration lane queue length (b) 10-lane 270 m acceleration lane queue length (c) 10-lane 310 m acceleration lane queue length (d) 10-lane 345 m acceleration lane queue length.
As the proportion of heavy-duty trucks increases, both queue lengths and stop delays rise substantially. The analysis reveals that the conventional 230-m acceleration lane in the merging section of a two-way ten-lane expressway is highly sensitive to traffic flow variations and insufficient to alleviate congestion.
The acceleration lane length data for a mainline design speed of 120 km/h, calculated from Table 2, was analyzed to generate a comparison chart of average delays for different acceleration lane lengths on two-way ten-lane expressways, as shown in Figure 7.
When mainline traffic flow is low, vehicle spacing is larger, and ramp merging delays are minimal. However, as mainline traffic flow increases, ramp vehicles must wait for suitable gaps in the mainline flow, resulting in greater delays. Additionally, higher proportions of heavy-duty trucks further aggravate traffic delays.
A comparison of queue lengths for different acceleration lane lengths was generated using simulation data, as shown in Figure 8. The results indicate that the average queue length in the merging area increases with higher mainline traffic flow and a greater proportion of heavy-duty trucks.
3.2 Simulation of deceleration lanes
The road parameters for the deceleration lane were based on the section where the G4 Beijing-Hong Kong-Macao Expressway intersects with the G45 Daqing-Guangzhou Expressway at a single-direction, five-lane merging point. In the simulation, the deceleration lane, including the auxiliary lane, was assigned a length of 145 m. The transition section length and lane width were specified as 100 and 3.75 m, respectively. Detectors were positioned 200 m upstream and downstream of the entrance to record real-time traffic data for each lane within the event-triggering zone, as shown in Figure 9.
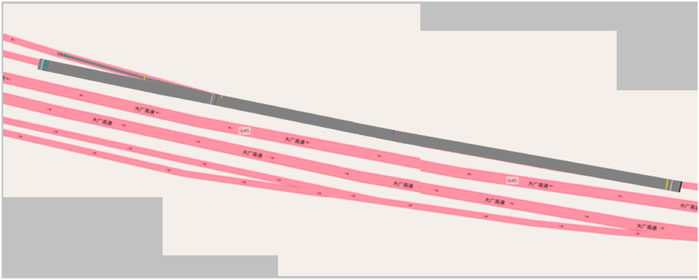
Figure 9. Detector setup and traffic data capture zones for the interchange exit of G4 Beijing-Hong Kong-Macao expressway and G45 Daqing-Guangzhou expressway.
The mainline input traffic flow was set at 8,000, 9,000, and 10,000 vehicles per hour (veh/h). The simulation was conducted with high precision, using a time step of 1 second per simulation second, and each simulation run lasted 3,600 s. Based on the actual traffic composition, the relative proportions of passenger cars and heavy-duty trucks, as well as their desired speeds, were defined in accordance with observed traffic patterns. During the simulation, vehicle detection points within the network recorded real-time raw traffic flow data.
To enhance the reliability of the simulation model for the deceleration lane, the same rigorous calibration and validation approach was applied as in the acceleration lane simulation. Key parameters, including vehicle desired speeds and following distances, were carefully calibrated against field observation data to ensure they align with real-world driving behaviors. The simulation setup also maintained the same assumptions regarding vehicle type distribution, incident-free conditions, and dry road conditions as mentioned in the acceleration lane simulation.
In line with the specifications outlined in the Highway Route Design Specifications (JTG D20–2017), the two-way eight-lane expressway was expanded to a two-way ten-lane configuration with the addition of a 145-m deceleration lane. The average delay time and queue length of the ten-lane expressway were subsequently compared before and after the expansion, particularly following the addition of the deceleration lane, to assess the effectiveness of the upgrade. The results are shown in Figures 10, 11.
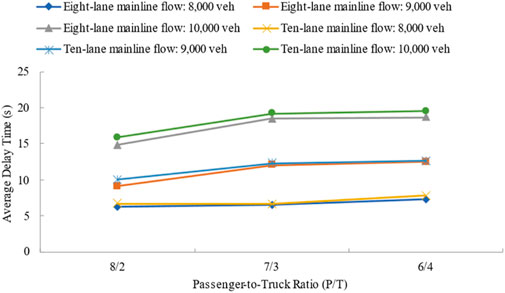
Figure 10. Comparison of average delay.
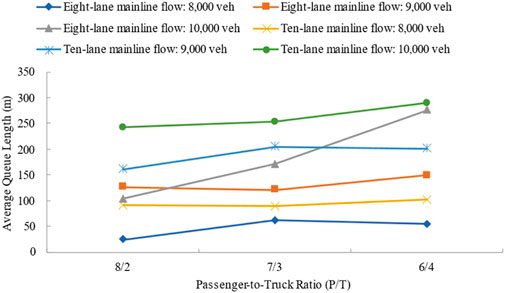
Figure 11. Comparison of average queue length.
As the number of lanes increases and mainline traffic flow grows, vehicle speeds decrease significantly, leading to congestion in diverging areas. Adjustments to traffic flow, such as increasing mainline input flow and the proportion of heavy-duty trucks, reduce traffic efficiency in the diverging area. Under 10,000 veh/h with 6/4 ratio:
- 145 m lanes: 20.2s delay (Figure 12a), 297 m queues (Figure 13a).
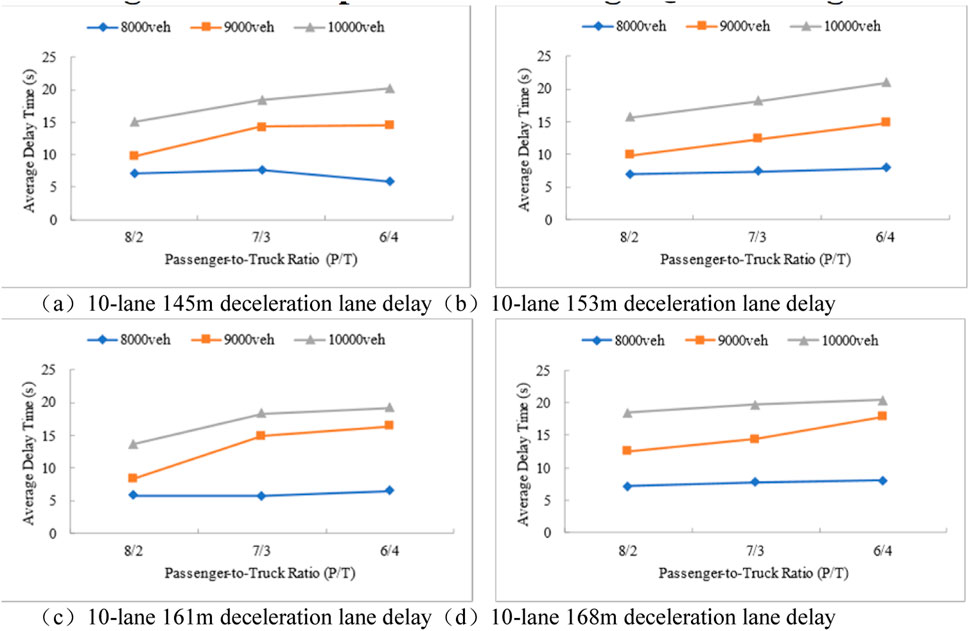
Figure 12. Comparison of average delay (a) 10-lane 145 m deceleration lane delay (b) 10-lane 153 m deceleration lane delay (c) 10-lane 161 m deceleration lane delay (d) 10-lane 168 m deceleration lane delay.
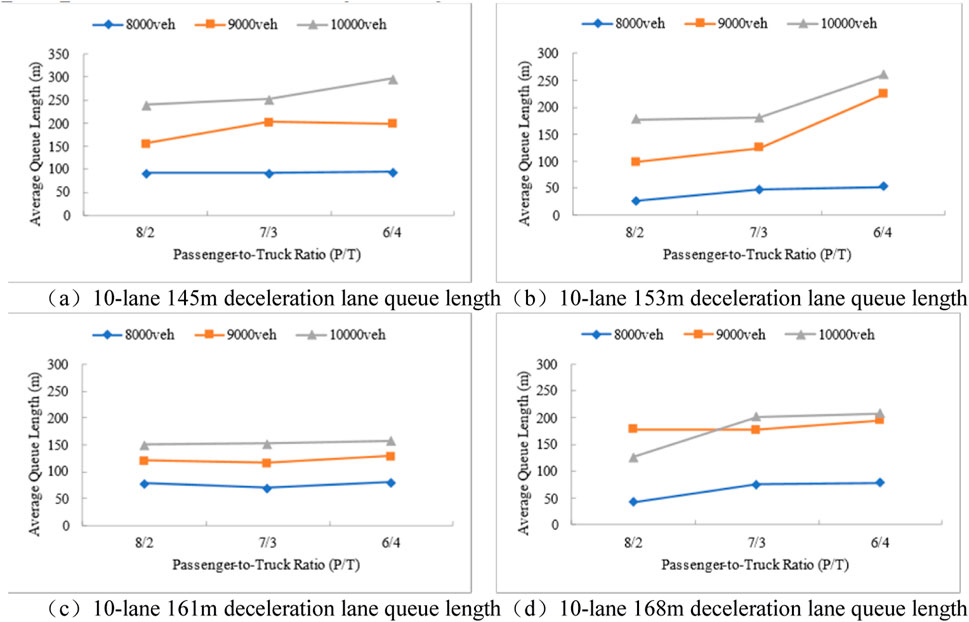
Figure 13. Comparison of Average Queue Length (a) 10-lane 145 m deceleration lane queue length (b) 10-lane 153 m deceleration lane queue length (c) 10-lane 161 m deceleration lane queue length (d) 10-lane 168 m deceleration lane queue length.
Comparing 145m–168 m lanes at 10,000 veh/h with 6/4 ratio:
- Delay reduction: 20.2s → 16.4s (−18.8%) (Figures 12a vs. 12d).
- Queue reduction: 297 m → 208 m (−30.0%) (Figures 13a vs. 13d).
Analysis shows that the traditional 145-m deceleration lane in the diverging section of a two-way ten-lane expressway is highly sensitive to traffic flow variations and insufficient to alleviate congestion.
Statistical analysis of simulation results, based on deceleration lane length data for a mainline speed of 120 km/h from Table 2, was conducted to evaluate vehicle delay times under different deceleration lane lengths, passenger-to-truck ratios, and traffic flows. The findings are presented in Figure 12, while the corresponding mean queue lengths are shown in Figure 13. When traffic flow approaches saturation, congestion occurs, vehicles begin to queue, and delays increase. As depicted in Figure 13, both average delays and queue lengths rise with greater mainline traffic flow and higher proportions of heavy-duty trucks.
As illustrated in Figure 13, the mean queue length in the diverging area increases with higher mainline traffic flow and a greater proportion of heavy-duty trucks.
3.3 Evaluation using SSAM
The conventional approach to traffic safety evaluation relies on comprehensive historical accident data. However, this method is not suitable for projects that lack sufficient statistical data or are still in the planning stages. The Siemens research team proposed the Surrogate Safety Assessment Model (SSAM) (Calvi et al., 2012), which uses traffic simulation software to construct models. Through algorithms, it analyzes traffic conflicts within the simulation, identifies conflicts from vehicle trajectories, and generates safety evaluation metrics for assessing both existing and planned traffic scenarios (Lin, 2017) (Cao, 2020) (Zhang, 2021).
The SSAM system provides detailed data on the characteristics of simulated conflicts, including their number, type, severity, and location. Severity is assessed using five indicators: Time to Collision (TTC), Post-Encroachment Time (PET), Deceleration Rate (DR), Maximum Speed (MaxS), and Speed Difference (DeltaS) (Ye and Liao, 2016; Muley et al., 2018).
The calculation methods for each conflict indicator are shown in Figure 14 (Huang, 2018). The following definitions apply to the times represented in the figure:
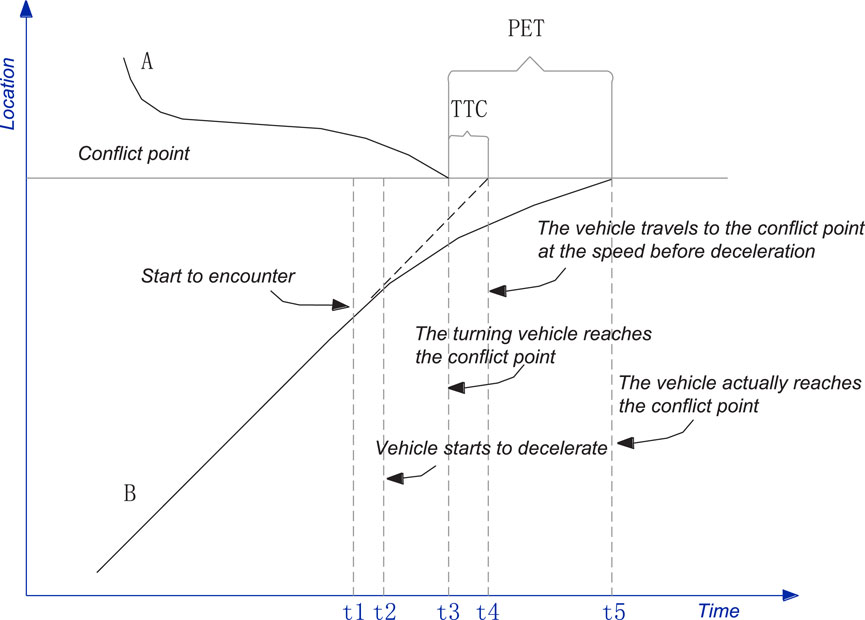
Figure 14. Time-space trajectory of Vehicle conflicts.
t1: Vehicle A enters the conflict zone.
t2: Vehicle B receives a collision warning from Vehicle A and initiates evasive action, beginning to decelerate.
t3: Vehicle A exits the conflict zone.
t4: In the absence of evasive action, the predicted time for vehicle B to reach the conflict point.
t5: The actual time at which vehicle B reaches the conflict point.
VISSIM simulations were performed for the merging area at the entrance of the ten-lane expressway. The SSAM model was used to analyze conflicts in the trajectory data and assess the safety impact of different lane lengths. It should be noted that SSAM, while a powerful tool for safety assessment, has certain limitations. For instance, it assumes standard driver reaction times and does not account for variations in driver behavior such as sudden maneuvers or differences in driver experience. Additionally, SSAM primarily focuses on conflict analysis and may not fully capture all aspects of traffic safety, such as the impact of environmental factors or the effects of traffic control measures. Furthermore, the model relies on simulated data, which may not perfectly represent real-world conditions due to simplifications and assumptions made during the modeling process.
The maximum critical value for PET is set at 5 s, and for a mainline design speed of 120 km/h, the simulation results for conflict numbers at different acceleration lane lengths are shown in Table 4.
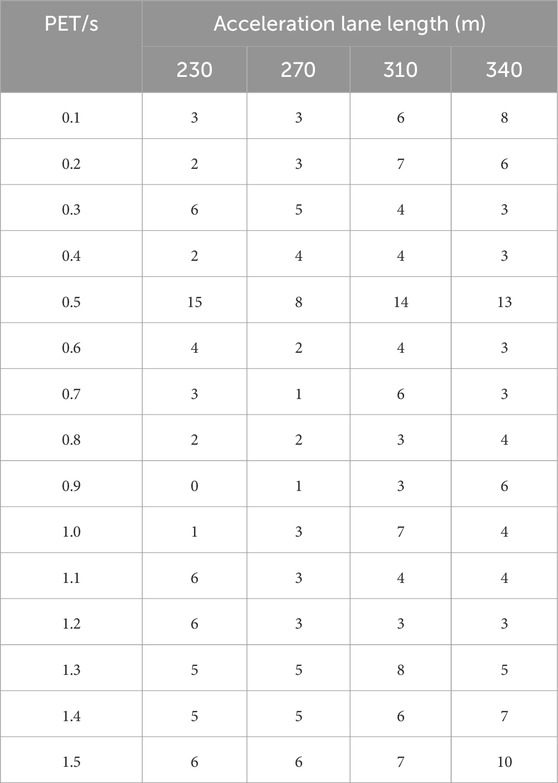
Table 4. Partial table of conflict PET indicators for different acceleration lanes.
A normal curve analysis was conducted on the PET data using SPSS. The distribution of traffic conflicts for the 230-m acceleration lane ranged from −6 to 15, with an average of 3.48. For the 270-m acceleration lane, the conflict count ranged from −4 to 10, with an average of 3.02. For the 310-m acceleration lane, the conflict count ranged from −6 to 15, with an average of 4.12, and for the 345-m acceleration lane, the conflict count ranged from −6 to 15, with an average of 3.98.
The conflict data were categorized into three levels: severe, minor, and potential conflicts. The cumulative frequency distribution is shown in Figure 15. Based on normal distribution theory, the 15th and 85th percentiles were used to define the thresholds for severe and potential conflicts. The results indicated that the PET threshold for severe conflicts was 0.3 s, while the threshold for potential conflicts was 3.3 s. These thresholds were determined based on a normal distribution analysis of the PET data. Using SPSS, a normal curve analysis was performed, and the 15th and 85th percentiles of the cumulative frequency distribution were used to define the thresholds for severe and potential conflicts. This approach is consistent with common practices in traffic conflict analysis, where the lower percentile represents severe conflicts that require immediate attention, and the higher percentile represents potential conflicts that may affect traffic safety and flow.
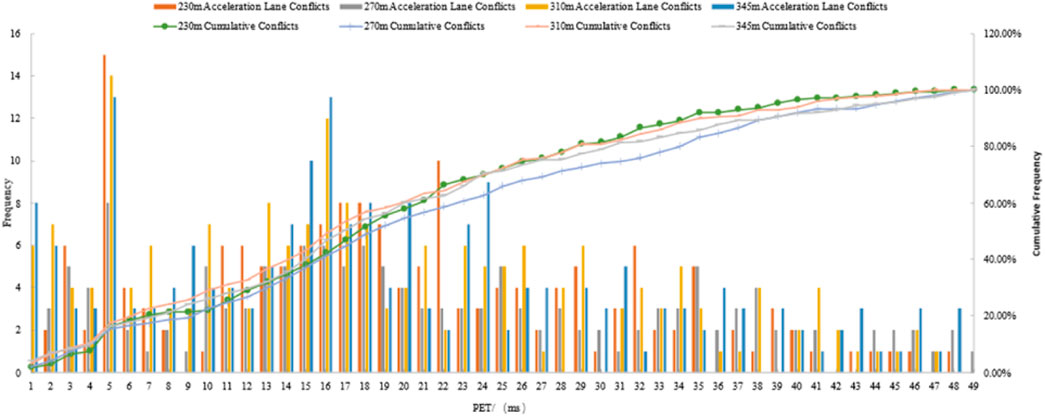
Figure 15. Cumulative PET curve of conflicts in the acceleration lane merging area before and after optimization.
Using the 15th percentile of the cumulative frequency distribution, a critical threshold of approximately 0.3 s was set for severe conflicts. The remaining conflict data were divided into two categories, with the PET value of approximately 3.3 s serving as the boundary between minor and potential conflicts.
According to this threshold-setting method, traffic conflicts in the optimized expressway merging areas were classified into three levels: severe, minor, and potential conflicts. The PET threshold ranges were as follows: PET > 3.3 s for potential conflicts, 0.3 < PET ≤ 3.3 s for minor conflicts, and PET ≤ 0.3 s for severe conflicts.
The analysis indicated that the 270-m acceleration lane consistently exhibited lower conflict PET indices compared to other options, with a 47.6% reduction in traffic conflicts compared to the traditional lane length. This design aligns with the statistically recommended design speed for the current entrance ramp.
Observations show that when vehicles merge from the entrance ramp onto the mainline, they initially decelerate at the end of the ramp to observe the mainline traffic flow and assess whether there is a sufficient gap for merging. When traffic density is high, vehicles tend to continue along the acceleration lane until a suitable and safe gap in the mainline flow is found. The length of the acceleration lane significantly affects the incidence of traffic conflicts. Shortening the acceleration lane in the merging section may prevent vehicles from accelerating adequately, increasing the risk of conflicts between vehicles entering the mainline and those already on the ramp.
A similar analysis was performed for the deceleration lane. When the mainline design speed is 120 km/h and the deceleration lane is 161 m long, the conflict PET index for the exit ramp is lower than for other configurations, showing a 32.8% reduction in traffic conflicts compared to the traditional length. It is recommended that the speed limit for the diverging ramp be set at 40 km/h, consistent with the statistically recommended design speed for the current exit ramp.
This study, based on experimental data at 120 km/h, also accounts for a safety margin for designs at lower speeds, including 100 km/h. The findings are primarily applicable to the traffic composition and driving behaviors observed on Chinese expressways, where the specific mix of vehicle types, traffic flow characteristics, and driver behavior patterns were integral to the simulation scenarios and analysis. While the general trends and design recommendations may offer insights for other regions with similar traffic conditions, their direct applicability to highways in other areas should be carefully evaluated considering local traffic composition, driving behaviors, and regulations. For the GuangShao Expressway reconstruction project, even with a reduction in the mainline design speed to 100 km/h, the proposed optimization strategy can still ensure both safety and efficiency, providing scientific guidance for expressway design under various speed conditions. However, it is important to conduct additional validation and calibration when applying these findings to different traffic environments.
4 Conclusion
This study utilized VISSIM simulation software to model traffic conditions before and after the implementation of the road optimization design. A set of traffic flow evaluation metrics were then developed using SSAM to assess the effectiveness of the optimization.
When the entrance ramp acceleration lane length was set to 270 m, with a 90-m transition section, the average delay time, average queue length, and occurrence frequency at the entrance were significantly reduced compared to other configurations. Additionally, the number of vehicle conflicts was also markedly lower. Similarly, when the exit ramp deceleration lane length was set to 161 m with a 90-m transition section, the results were outstanding, showing a clear reduction in average queue occurrences, queue lengths, and average stop delays compared to other configurations. The optimized design significantly improved both the traffic efficiency and safety of the two-way ten-lane expressway entrance and exit, while effectively reducing potential conflict points.
This study primarily focused on the driving speed of vehicles at entrance and exit ramps as the basis for analyzing speed change lanes. However, it did not include a sensitivity analysis to examine how variations in traffic conditions, such as changes in traffic flow, vehicle composition, or driver behavior, might affect the results. Future research should incorporate sensitivity analysis and additional evaluation metrics to further assess the robustness of the conclusions and enhance the reliability of the findings.
The contribution of this research lies not only in offering specific design recommendations for the GuangShao Expressway reconstruction project but also in advancing the methodology for evaluating and optimizing speed change lane designs on high-speed roadways. By combining VISSIM simulations with SSAM analysis, this study provides a practical example of how to assess and enhance traffic safety and efficiency in complex highway environments. This approach can serve as a valuable reference for transportation engineers and planners working on similar infrastructure projects.
Data availability statement
The original contributions presented in the study are included in the article/supplementary material, further inquiries can be directed to the corresponding author.
Author contributions
LC: Methodology, Conceptualization, Formal analysis, Visualization, Writing – original draft, Writing – review and editing. DX: Writing – original draft, Writing – review and editing. QY: Writing – original draft, Writing – review and editing. HG: Writing – original draft, Writing – review and editing.
Funding
The author(s) declare that no financial support was received for the research and/or publication of this article.
Conflict of interest
Authors LC and DX were employed by Guangdong Transportation Group Co., Ltd.
The remaining authors declare that the research was conducted in the absence of any commercial or financial relationships that could be construed as a potential conflict of interest.
Generative AI statement
The author(s) declare that no Generative AI was used in the creation of this manuscript.
Publisher’s note
All claims expressed in this article are solely those of the authors and do not necessarily represent those of their affiliated organizations, or those of the publisher, the editors and the reviewers. Any product that may be evaluated in this article, or claim that may be made by its manufacturer, is not guaranteed or endorsed by the publisher.
References
AASHTO (2018). A policy on geometric design of highways and streets. 7th ed. American Association of State Highway and Transportation Officials.
Calvi, A., Benedetto, A., and De Blasiis, M. R. (2012). A driving simulator study of driver performance on deceleration lanes. Accid. Analysis and Prev. 45, 195–203. doi:10.1016/j.aap.2011.06.010
Cao, H. W. (2020). Research on regional traffic coordination and optimization control based on vehicle average delay model. Nanjing, China: Nanjing University of Posts and Telecommunications.
European Committee for Standardization (2020). Eurocode 1: actions on structures – Part 2: traffic loads on bridges (EN 1991-2). Brussels: CEN.
German Federal Ministry of Transport and Digital Infrastructure (2019). Guidelines for the design of motorways (RAL). Bonn: BMVI Publications.
He, X. F., Xiong, W. L., and Li, Z. J. (2024). Study on the selection of transverse slope of roadway crown in the design of highway reconstruction and expansion with ultra-wide sections. Highw. and Automot. Appl. 40 (1), 91–94. doi:10.20035/j.issn.1671-2668.2024.01.017
Huang, F. (2018). “Research on the effectiveness verification of safety evaluation in expressway merging areas based on SSAM,” in Proceedings of the 2018 Annual Conference on Urban Transport Planning in China (Beijing, China: Urban Planning Society of China), 9.
Lin, L. P. (2017). Research on traffic conflict prediction and safety evaluation in expressway merging areas. Harbin, China: Harbin Institute of Technology.
Muley, D., Ghanim, M., and Kharbeche, M. (2018). Prediction of traffic conflicts at signalized intersections using SSAM. Procedia Comput. Sci. 130, 255–262. doi:10.1016/j.procs.2018.04.037
Tian, S. M., Li, T. F., Yuan, C. Y., Wang, M. Z., Tian, H., and Zhang, S. (2022). Analysis of the current characteristics and trends of traffic demand on national expressways. Mod. Transp. Metallurgical Mater. 2 (3), 18–26. Available online at: https://yaji.cbpt.cnki.net/portal/journal/portal/client/paper/77b01beb07a7d9a0970c8d05f220f5cc.
Xing, X. L. (2013). Study on the length of variable speed lanes on expressways. Xi'an, China: Chang'an University.
Xu, Q. S. (2008). Research on safety design methods for highway interchange bridges. Beijing, China: Beijing University of Technology.
Ye, H. B., and Liao, C. F. (2016). Traffic safety evaluation of intersections based on SSAM, 3. Shanghai, China: Editorial Department of Urban Roads, Bridges and Flood Control, 34–40.
Zhang, C., Liu, K., Wang, S. F., Xie, Z. L., and Wang, X. (2023). A review on the safety of highway interchange entrances and exits. J. Transp. Inf. Saf. 41 (2), 1–17. doi:10.3963/j.jssn.1674-4861.2023.02.001
Keywords: two-way ten-lane expressway, speed change lane, SSAM, acceleration lane length, deceleration lane length, VISSIM
Citation: Chen L, Xiong D, Yu Q and Guo H (2025) Study on the length of speed change lanes at the entrance and exit of two-way ten-lane expressways. Front. Built Environ. 11:1540170. doi: 10.3389/fbuil.2025.1540170
Received: 05 December 2024; Accepted: 25 June 2025;
Published: 30 July 2025.
Edited by:
Tianjie Zhang, Rutgers University, United StatesReviewed by:
Giovanni Leonardi, Mediterranea University of Reggio Calabria, ItalySakdirat Kaewunruen, University of Birmingham, United Kingdom
Copyright © 2025 Chen, Xiong, Yu and Guo. This is an open-access article distributed under the terms of the Creative Commons Attribution License (CC BY). The use, distribution or reproduction in other forums is permitted, provided the original author(s) and the copyright owner(s) are credited and that the original publication in this journal is cited, in accordance with accepted academic practice. No use, distribution or reproduction is permitted which does not comply with these terms.
*Correspondence: Huihui Guo, aHVlZWp1b2FAb3V0bG9vay5jb20=