 Mohammad S. Alam1*
 Tracy Kijewski-Correa2
 David B. Roueche3
 Khalid M. Mosalam4
 David O. Prevatt5
 Ian Robertson1
- 1Department of Civil, Environmental, and Construction Engineering, University of Hawaii at Manoa, Honolulu, HI, United States
- 2Department of Civil and Environmental Engineering and Earth Sciences and Keough School of Global Affairs, University of Notre Dame, Notre Dame, IN, United States
- 3Department of Civil and Environmental Engineering, Auburn University, Auburn, AL, United States
- 4Department of Civil and Environmental Engineering, Pacific Earthquake Engineering Research Center, University of California Berkeley, Berkeley, CA, United States
- 5Engineering School of Sustainable Infrastructure and Environment, University of Florida, Gainesville, FL, United States
Post-disaster field observations of the built environment are critical for advancing fundamental research that links hazard data to structural performance, cascading community impacts, and the development of effective mitigation strategies. Yet, data collection efforts remain fragmented across hazard types and infrastructure systems due to varying objectives, methodologies, protocols, and standards among investigators and organizations. To address this, a Unified Assessment Framework has been developed for standardized post-disaster hazard and structural assessment data and metadata collection across multiple natural hazards (earthquake, windstorm, coastal events) and infrastructure typologies. The framework encompasses a tiered performance assessment of infrastructure with increasing rigor and fidelity levels: Basic Assessment (BA), Load Path Assessment (LPA), and Detailed Component Assessment (DCA). The framework has been implemented as an open-access mobile application, the Structural Extreme Events Reconnaissance Network’s “StEER Unified App”, hosted on Fulcrum, a commercial data collection platform by Spatial Networks Inc. Along with unification of data fields, preliminary mapping rules were developed to map out existing hazard-specific damage rating scales (e.g., wind, surge/flood, rainwater ingress) to the European Macroseismic Scale (EMS-98) compatible unified damage scale, enabling consolidation of global damage ratings into a common data field, facilitating the unification of multiple hazards within a single app. In the mapping process, care was taken to retain the overarching damage level definitions (e.g., slight, moderate, severe damage) while customizing the specific descriptors to reflect hazard-specific damage mechanisms. Two use cases are presented to demonstrate the application of this framework through the StEER Unified App: a supervised pilot after the 2022 Hurricane Ian, Florida and an unsupervised deployment for the 2023 Turkey earthquake sequence. These deployments highlight the framework’s flexible and scalable nature, demonstrate the feasibility of standardized assessments, and offer insights into how data quality is influenced by assessor pre-deployment training and assessment tier, particularly for more complex tasks such as load path evaluation. This work advances the field by providing a scalable, standardized, and hazard-agnostic approach to structural field reconnaissance, enabling more consistent and coordinated data collection across events. The open-access framework and app not only support real-time deployments but also allow integration of legacy datasets into a unified platform—laying the foundation for longitudinal analyses, cross-hazard comparisons, and expanded data reuse within the Natural Hazards Engineering community.
1 Introduction
Post-disaster hazard and structural field assessments are essential for advancing both research and practice in natural hazards engineering (e.g., EERI, 1971; NRC, 2007; Delatte, 2008; Wartman et al., 2020; Kijewski-Correa et al., 2018; 2021; 2022). These assessments help correlate hazard characteristics with site-specific load effects, evaluate the performance of civil infrastructure under extreme conditions, and examine the cascading consequences for community resilience. They inform mitigation strategies, guide policy development, and ultimately contribute to more resilient built environments. Over the past several decades, detailed field investigations have been conducted following a wide array of hazard events, including earthquakes, tsunamis, tornadoes, and hurricanes. These investigations—often led by academic teams and interdisciplinary consortia—have yielded valuable insights into structural vulnerability, failure mechanisms, and post-event recovery processes. A summary of representative post-disaster assessments across various hazards is provided in Table 1, illustrating the breadth and depth of these efforts and their contributions to both engineering research and practice.
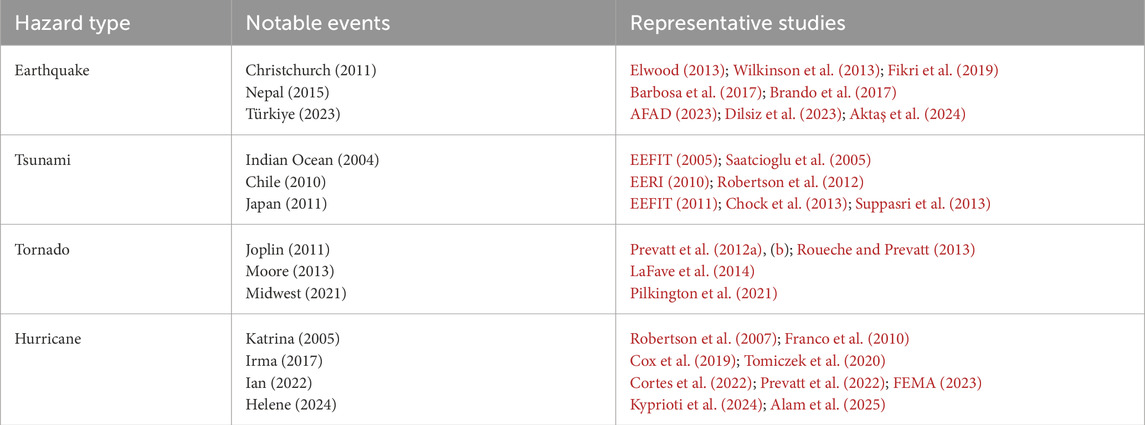
Table 1. Representative post-disaster field assessments by hazard type and year.
Despite advances made, data collection efforts remain fragmented across hazard types and infrastructure systems due to varying objectives, methodologies, protocols, and standards among investigators and organizations, limiting cross-event and cross-hazard analysis and comparisons. It is further compounded by the fact that raw field data often exist in cumbersome forms–such as paper notes, unstructured photographic datasets, and materials that lack appropriate metadata or geospatial context. As reconnaissance teams are often assembled on an ad hoc basis for each disaster response, standardization of data collection methodologies and data products across different hazard events has been challenging, hindering inter-event analyses (Roueche et al., 2023). As a result, barriers to diverse reuse and knowledge discovery remain, limiting the potential for fully understanding the interactions among hazards, infrastructure, and community resilience across multiple disaster events.
The Structural Extreme Events Reconnaissance (StEER) network was formed in 2018 (Kijewski-Correa et al., 2021) to address these issues and work toward more coordinated and standardized data collection for structural performance assessments under wind, seismic, and coastal hazards. StEER operates within the broader NHERI CONVERGE node (Peek et al., 2020), collaborating with other extreme events research and reconnaissance networks funded by the National Science Foundation. The organization uses Virtual Assessment Structural Teams (VASTs) to gather and contextualize publicly available data, news reports, and social media after major disasters to guide its subsequent field data collection efforts (Level 1 response). Field Assessment Structural Teams (FASTs) then deploy to quickly document the extent of damage over larger geospatial areas using surface-level panoramic (SLP) cameras mounted on vehicles or windshield surveys (Level 2 response). These efforts then direct the efforts of subsequent FASTs visiting target structures to conduct in-depth performance assessments (Level 3 response). StEER leveraged its partnership with Spatial Networks, Inc. to implement these performance assessment protocols in their Fulcrum platform. StEER’s initial approach was to digitize the assessment guidelines that had been, to date, established within the natural hazards engineering community (e.g., ATC 20 1989; ATC 45 2004), resulting in the development of a family of hazard- and structural typology-specific mobile apps. While this approach importantly streamlined data acquisition, promoted open data reuse, and moved away from data collection on paper forms, it resulted in multiple mobile apps. Slight variations in the assessment methodology and recorded fields across these established assessment tools, and thereby the apps emulating them, eventually presented obstacles to managing the network’s growing collection of data and its use for holistic knowledge discovery across different hazards and events. Moreover, while the data collected in each hazard-specific app is extensive, it still does not encompass the full range of factors likely to influence the structural performance, particularly for multi-hazards or for cascading hazards events (e.g., tsunami following earthquake, hurricane winds and surge, etc.). The fragmentation of data across a family of apps with variations in the recorded data fields ultimately impedes efforts to create a comprehensive understanding of built environment performance across different building typologies and hazards. In short, while StEER had greatly advanced swift collection of standardized structural assessments after hazard events, its apps still embodied the fragmentation of the community’s assessment methods, limiting the ability to then swiftly draw consistent and meaningful conclusions about how structures respond to diverse (and potentially multi-hazards cascading and compounding) hazard scenarios.
To address these limitations, this study draws upon the diverse literature on post-disaster structural assessments across multiple hazards to develop a unified tiered structural assessment framework. This framework encompasses requisite hazard, site, structural, and performance assessment data and metadata across different hazards (earthquake, windstorm, coastal) and structure classes. The proposed framework consists of three tiers of performance assessments with increasing rigor and fidelity: basic assessment (BA), load path assessment (LPA), and detailed component assessment (DCA). The framework is implemented as a single, user-friendly open-access mobile application “StEER Unified App” on the Fulcrum platform, facilitating efficient, community-led collection of consistent, high-quality standardized reconnaissance data. The data currently fragmented across StEER’s app collection was then mapped to the fields of the new unified app, consolidating all past StEER assessment data into a single backend database to promote diverse reuse and greater knowledge discovery.
This paper is organized into six sections, beginning with this introductory section (Section 1), which discusses the fragmentation of post-disaster data collection efforts across various hazards and infrastructure typologies, highlighting how these fragmented efforts hinder diverse data reuse, knowledge discovery, and the ability to fully understand the interactions between hazards, infrastructure, and community resilience across multiple disaster events. The section then emphasizes the need for developing a unified assessment framework to overcome these barriers and facilitate comprehensive hazard-agnostic assessments. Section 2 provides a detailed literature review of existing post-disaster structural assessment framework and methodologies and how this review informs the development of the unified assessment framework presented in Section 3. Section 4 outlines the implementation of the framework in a mobile application, named StEER Unified App, detailing the app’s key features and unification of different assessment attributes across hazards. Section 5 presents two use cases to demonstrate the application of the proposed unified assessment framework via the StEER Unified App: a supervised pilot during 2022 Hurricane Ian, Florida and an unsupervised deployment for the 2023 Turkey earthquake sequence and potential learning from those use cases. Finally, Section 6 presents conclusions and recommendations for future improvements.
2 Existing post-disaster structural assessments
Various organizations, including the Earthquake Engineering Research Institute (EERI) Learning from Earthquake (LFE) program, the Army Corps of Engineers (USACE), the National Institute of Standards and Technology (NIST), and the Federal Emergency Management Agency (FEMA) have spearheaded investigations of major earthquakes, tornadoes, and hurricanes in the US. Several field investigation guidance and protocols have emerged from these institutional efforts: (i) for earthquake hazards: ATC 20 (1989); JBDPA (1991); EERI LFE (1996); FEMA 306 (1998); Hughes and Lubkowski (1999); FEMA 352 (2000); CUREE (2010); NZMBIE (2014b); BCH (2019), FEMA (2020) (ii) for wind hazards: ATC 45 (2004); BCH (2019); FEMA (2000); FEMA (2020); and (iii) for coastal hazards: ATC 45 (2004); USACE (2006); NZMBIE (2014a); BCH (2019); FEMA (2020). In parallel, individual research teams have similarly worked to advance field investigations (e.g., for earthquake hazards: Kaminosono et al. (2002); Baggio et al. (2007); Anagnostopoulos and Moretti (2008); Maeda and Matsukawa (2019); Uroš et al. (2020); for wind hazards; Roueche and Prevatt (2013); LaFave et al. (2014); Egnew et al. (2018); and for coastal hazards; Friedland (2009); Franco et al. (2010); Kennedy et al. (2011); Xian et al. (2015); Hatzikyriakou et al. (2016); Tomiczek et al. (2017). These guidelines vary in terms of assessment objectives (e.g., safety, usability, damage, repair, retrofit, etc.), assessment fidelity level (e.g., rapid assessment, detailed assessment, engineering assessment, etc.), and building typologies (wood, reinforced concrete, steel, masonry, etc.) for different hazards, as illustrated in Figure 1.
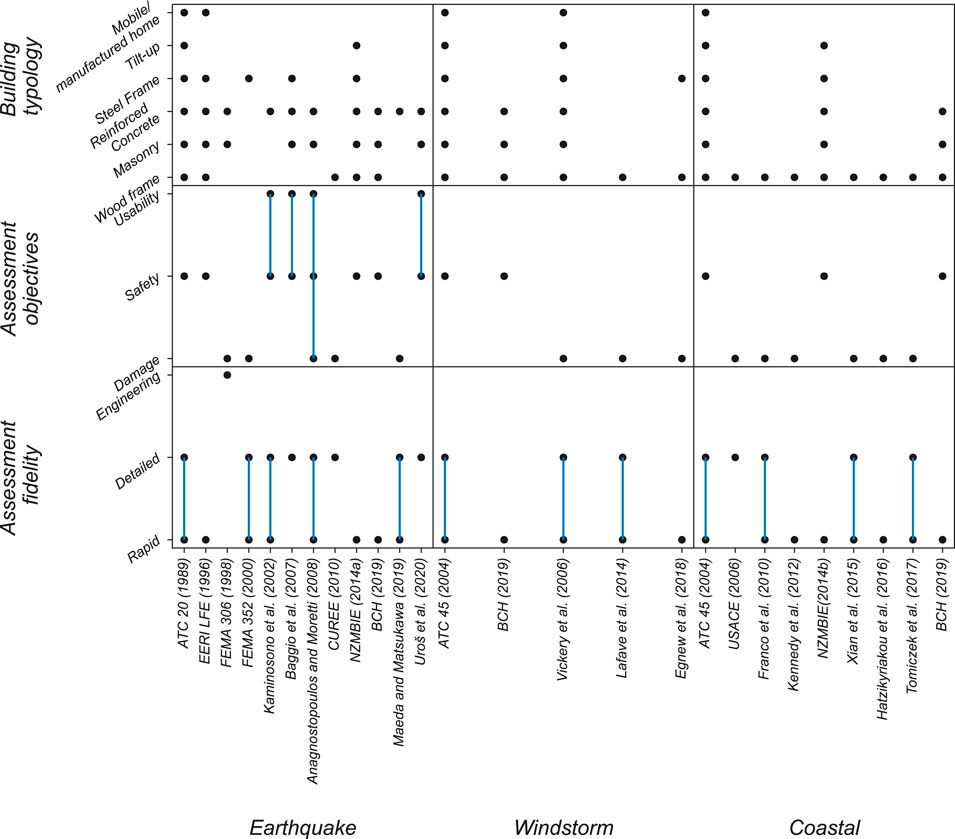
Figure 1. Mapping of assessment fidelity, assessment objectives, and building typology in existing post-disaster reconnaissance standards for earthquake, windstorm, and coastal hazards.
Notable among these are the Applied Technology Council’s (ATC) Procedures for Post-earthquake Safety Evaluation of Buildings (ATC 20 1989; ATC 20-2 1995; ATC 20-3 1996), which offer guidelines for post-earthquake safety inspections. The first of these guidelines, ATC 20 (1989), serves as a field guide offering clear, structured procedures and forms for inspection and has become a widely adopted standard for post-earthquake field investigation globally. The guideline outlines a three-level assessment methodology with increasing rigor and fidelity, namely, (i) rapid assessment: typically completed in under 30 min, focusing primarily on the global performance assessed through inspection of exterior of the building, though interior inspections are recommended for certain special cases; (ii) detailed assessment: conducted after a rapid evaluation, this thorough assessment takes several hours and involves a detailed examination of both the interior and exterior with a focus on load path elements; and (iii) engineering assessment: recommended when visual and detailed assessments of load path elements are insufficient to confidently determine the extent of damage; this assessment is performed by licensed structural engineers and may take up to a week or more. The guideline was developed to address the inconsistencies and subjectivity often seen in field evaluations before any formal standard was established. Following ATC20 (1989), similar standards were developed in other countries including Japan (JBDPA, 1991), Canada (BCH, 2019), New Zealand (NZMBIE 2014b; b), and Europe (Baggio et al., 2007). Like ATC 20 (1989), the ATC 45 (2004) field manual was developed to provide comprehensive guidelines for assessing building safety after windstorms and floods, with the goal of determining whether buildings are safe for occupancy or if entry should be restricted or prohibited. The guidelines follow a similar three-level assessment methodology, including rapid, detailed, and engineering evaluations. While the rapid assessment procedures are the same for both wind- and flood-related damage, the detailed assessment requires specific procedures tailored to each hazard type.
The field data gathered varies depending on the assessment objectives and level of fidelity. For example, in Rapid Assessments, data collected typically includes general building damage (e.g., collapsed/moved structures, significant leaning, damage to primary structural elements), geotechnical hazards (e.g., foundation scour, erosion, slope failure), and nonstructural damage and falling hazards (e.g., submerged ME&P system during flooding, chimney, parapet, or other falling hazards). Building performance is then rated on a global damage scale based on visual observations of structural and nonstructural damage and repair costs. Damage scales used to assess overall performance can vary, such as, qualitative scales: a four-point scale: none, slight, moderate to heavy, severe to total (Anagnostopoulos and Moretti, 2008), six-point scale: none, slight, moderate, severe, total, collapse (EERI LFE, 1996), and quantitative scales: five point-scale: none to 100% damage (NZMBIE 2014b; b), seven-point scale: no damage to 100% damage, excluding contents (ATC 20, 1989; ATC 45, 2004).
In Detailed Assessments, damage to structural components along the vertical and lateral-load carrying systems (columns, walls, roof framing, roof-to-wall connection, superstructure-to-foundation connection, vertical and horizontal bracing, etc.), nonstructural components (e.g., cladding, glazing, ceilings, and MEP systems), and geotechnical hazards (e.g., foundation issues, erosion, slope failures) are evaluated using visual inspection, measurements, and photographs. This process typically involves identifying damage mechanisms (e.g., shear, flexure, axial, sliding, overturning), damage location, damage severity, damage extent, and component behavior (ductile vs brittle) (e.g., EERI LFE, 1996; FEMA 352, 2000; CUREE, 2010; Vickery et al., 2006; Friedland, 2009; Tomiczek et al., 2017; FEMA 2022a). For earthquake assessments, damage severity of components is described both qualitatively and quantitatively, e.g., assessment of concrete structures may consider crack width, crack orientation, spalling, crushing, rebar buckling, as well as measurements of residual drift and ground movement. Component damage severity classifications include a three-point scale: slight, medium to severe, very heavy damage (Baggio et al., 2007), four-point scale: none, slight, moderate to heavy, severe to total (Anagnostopoulos and Moretti, 2008; Uroš et al., 2020), which are adapted and based on a slight variation of the European Macroseismic Scale (EMS-98) (Grünthal, 1998), and a five-point scale: I to V (Maeda and Matsukawa, 2019). For windstorms, damage severity is defined based on building envelope performance, i.e., the percent of building envelope (roof and wall subassemblies) removed or failed during a windstorm (Vickery et al., 2006; FEMA 2022a). For coastal hazards due to hurricanes, damage severity considers both building envelope damage and damage to the structural frame, foundation, and appurtenances due to wind, surge, wave, erosion and scour, and debris impacts using a seven-point scale (none, minor, moderate, severe, very severe, partial collapse, and collapse: Friedland, 2009; DS0 to DS6; Tomiczek et al., 2017).
Some detailed assessments also document the distribution and extent of damage by computing damage extent indicators like the damage index (FEMA 352, 2000), residual seismic capacity ratio (Maeda and Matsukawa, 2019), or percentage/number of elements at specific damage levels (Anagnostopoulos and Moretti, 2008; Uroš et al., 2020). These damage extent indicators may involve, Level-I detailed assessment, inspecting critical structural components and fracture-susceptible connections of some or all of the moment-frame connections within a story or Level-II detailed assessment, inspecting all fracture-susceptible connections in the building if multiple connection fractures and other component damage were observed in the Level-I detailed assessment (FEMA 352, 2000). In other cases, damage extent is evaluated by inspecting lateral frame elements of critical stories (Anagnostopoulos and Moretti, 2008; Uroš et al., 2020). For earthquakes, the component-level damage severity and extent results are then mapped to define system-level damage states using residual seismic capacity ratio, which accounts for damage to all structural members in a frame (Maeda and Matsukawa, 2019) or building safety classes (Anagnostopoulos and Moretti, 2008), or usability categories (Baggio et al., 2007; Uroš et al., 2020). For wind and coastal hazards, this component to system-level damage assignment considers the most severe damage state experienced by specific structural components (Vickery et al., 2006; Tomiczek et al., 2017).
In Engineering Assessments, building damage is assessed using visual inspection, investigative testing (e.g., nondestructive or intrusive), review of building drawings and design documents, and classification of component damage according to deformation modes and damage severity. These evaluations determine the impact of damage on the building’s future performance through hand calculations or numerical simulations of the affected component’s force-deformation response. Overall building performance may be linked to specific performance objectives: e.g., immediate occupancy, life safety, collapse prevention (FEMA 306 1998).
As discussed above and illustrated in Figure 1, while clustering of assessment methodologies across hazards is evident based on assessment objectives, fidelity levels, and structural classes, notable similarities exist among these methodologies and the types of data collected—making them largely hazard-agnostic. For instance, in Rapid Assessments, it is standard practice to collect basic data on site conditions, infrastructure materials, construction year, geometry, configuration, occupancy, and other metadata to correlate structural performance with site-specific hazards. These assessments evaluate the global performance of a structure primarily through external observations of key performance indicators, such as collapse or partial collapse of the structure, racking damage to primary lateral force-resisting systems, potential falling hazards, foundation failure, and site-specific geotechnical hazards. Similarly, Detailed Assessments focus on gathering data related to load path elements (e.g., foundation, columns, walls, beams, beam-column connections, wall-to-roof connections, and roofing systems) and documenting observed damage, though, the level of detail may vary depending on the hazard type—such as focusing on lateral frames for earthquakes versus building envelopes for wind events. Furthermore, if the assessment objective extends beyond evaluating damage and loss to assessing the structure’s functionality, the collected data—such as building safety, access to stories, tenant safety, and operational status (FEMA 2021)—remains relevant across different hazards, underscoring the hazard-agnostic nature of such assessments.
Recently, FEMA (2020) developed a Preliminary Damage Assessment (PDA) guide to establish a standardized national framework for state, local, tribal, and territorial (SLTT) government officials and FEMA personnel. The guide aims to support the consistent, efficient, and accurate collection, validation, quantification, and documentation of damages through a uniform PDA process, ultimately aiding in requests for federal assistance through a Presidential Disaster Declaration (PDD). The PDA methodology is adaptable to different hazards, utilizing a variety of techniques including self-reporting, door-to-door assessments, windshield surveys, geospatial analysis, remote sensing, and modeling. This marks a significant shift toward a standardized, hazard-agnostic approach to damage assessment unlike those hazard specific guidelines of ATC 20 (1989) and ACT 45 (2004). However, the PDA methodology focuses solely on preliminary damage assessments over large geographic areas, aiming to identify damage gradients and support decisions regarding federal disaster aid. It does not encompass multi-tiered assessment processes needed for deeper insights, such as correlating infrastructure performance to site-specific hazards, or understanding the complex interactions of factors affecting structural performance under multi-hazard scenarios and thus developing targeted response, recovery, and mitigation measures. Recognizing the need for a holistic, hazard-agnostic, and tiered structural performance assessment methodology, the similarities across existing assessment frameworks and data collection practices are systematically reviewed, documented, and finalized through a consensus-based approach within StEER leadership. Additionally, expert input from multiple hazard disciplines, gathered during the 2018 StEER Cross-Hazard Workshop at the University of California, Berkeley, was instrumental in identifying synergies in structural assessment data for various hazards and structural types, particularly in multi-hazard and cascading hazard contexts. All these efforts helped shape the development of the Unified Assessment Framework, which is discussed in detail in the following section.
3 Overview of StEER’s unified assessment framework
Over time, StEER operationalized a number of the existing assessment protocols into its mobile app suite in Fulcrum, generally in response to the sequencing of hazard events. For instance, the first app focused on wind damage to buildings in the US in response to 2017 Hurricane Harvey, adopting HAZUS-style assessments for wood frame residential construction (Vickery et al., 2006), which was quickly followed by a second app after 2017 Hurricane Maria to accommodate concrete and masonry residential construction common to Puerto Rico. The family of apps continued to grow in response to new use cases for unique construction styles and even languages, e.g., English/Creole apps to assess formal and informal construction in Haiti after the 2021 earthquake (Kijewski-Correa et al., 2024). As the prior section illustrates, StEER’s experience was not unique; the diversity of real-world performance assessment needs has driven a diversity of assessment protocols and tools in the literature, much like the diversity of custom apps that eventually unfolded in StEER’s Fulcrum library. Realizing this approach was both unsustainable and counterproductive to standardizing the assessment process across hazards and structure classes, StEER embarked upon a year-long effort to consolidate its diverse assessment protocols (and Fulcrum Apps) into a single framework.
Figure 2 provides an overview of this Unified Assessment Framework, which comprises three data classes: (1) Unified Assessment, (2) Hazard Survey, and (3) Performance Assessment Survey. These data classes help to organize the framework’s data structure by bundling collected data with similar attributes associated with the survey parameters, observed hazards, and the assessed structures, respectively. Within each data class, data subclasses are defined to further structure the data for improved backend data storage, sorting, discovery, and unification. In the current framework, data fields describe attributes of surveys, hazards, and structures that are stored within these data subclasses. The data fields can be of various types, including single- or multiple-choice lists, text or numeric input, and media (photo, video, and audio) attachments. Efforts have been made to unify attributes across the three hazard types (earthquake, wind, coastal).
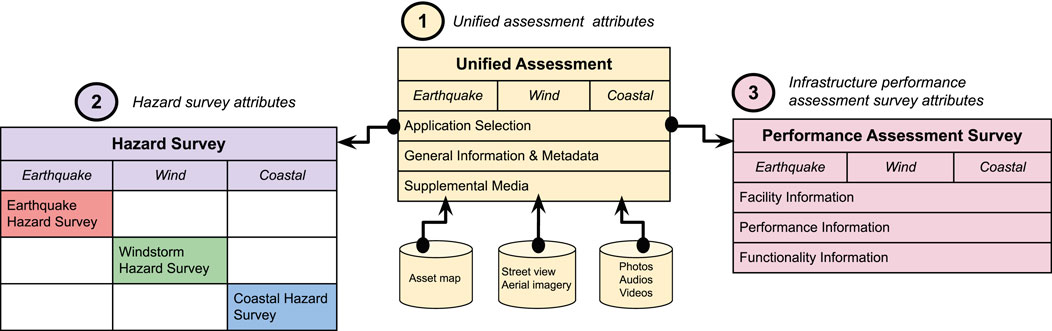
Figure 2. Overview of the Unified Assessment Framework illustrating the primary data classes and degree of unification across different hazard types.
3.1 Unified assessment attributes
In this data class (see Figure 2 inset 1), a generalized data model is developed to organize a comprehensive set of attributes needed for assessments of all possible hazards (earthquake, windstorm, coastal) and structural classes (e.g., buildings, bridges, power infrastructure) so as to call up and populate the necessary sequences of fields for subsequent data classes. The attributes are categorized into several data subclasses: Application Selection, General information and Metadata, and Supplemental Media. Table 2 provides a high-level summary of attributes associated with each subclass. The Application Selection subclass encompasses data fields that describe the survey type (hazard survey, infrastructure performance assessment survey), primary and cascading hazard categories, facility category, performance assessment fidelity category, and inspection type (structural, nonstructural, both). These attributes are defined as single-choice selections from a list of data fields. The General information and Metadata subclass contains information related to the inspection, such as the inspector’s name, affiliation, facility address, sampling method used in facility selection, and the area and elevation being assessed. The Supplementary Media subclass includes site photos, videos, and audio gathered by the investigator, as well as asset maps developed by the supporting team to aid in the field investigation. It also incorporates street view and aerial imagery gathered from secondary sources to facilitate the field investigation team’s survey efforts. Within the Unified Assessment data class, unification of attributes is achieved at the data class and subclass hierarchy level across hazards (see Table 2).
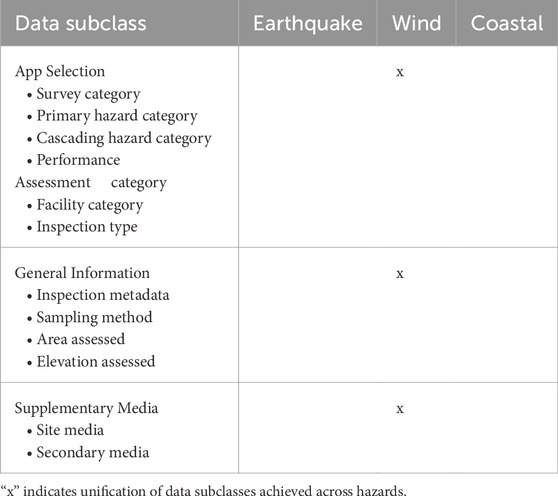
Table 2. Summary of data subclasses under Unified Assessment data class and associated unification across hazards.
3.2 Hazard survey attributes
In the Hazard Survey data class (see Figure 2 inset 2), both qualitative and quantitative data is gathered to estimate the hazard intensity at the site being assessed. This data class includes three distinct subclasses: Earthquake Hazard Survey, Wind Hazard Survey, and Coastal Hazard Survey. Table 3 provides a high-level summary of attributes associated with each hazard survey subclass. The Earthquake Hazard Survey subclass encompasses data fields on general earthquake information (e.g., date and time, moment magnitude, location, etc.), specific intensity information (e.g., ShakeMap shaking estimate, site peak ground acceleration, site-to-epicenter distance, etc.), ground motion recording information, and primary and secondary effects observed at the site. In the Wind Hazard Survey subclass, wind hazard intensity indicators such as downed trees, towers, and signposts are used as surrogates to gauge wind hazard intensity in the field. Data collected includes the indicators’ geometry, material properties, damage patterns, and damage distribution. The Coastal Hazard Survey subclass focuses on gathering surge and wave characteristics, such as maximum flow depth, maximum flow velocity, and wave height and period, through various measurement methods, including photo and video evidence, field measurements, post-event modeling, flow surrogate geometry, observed damage, and material properties. In the Hazard Survey data class, unification of attributes is achieved only at the individual hazard survey subclass level, as attributes are unique to each specific hazard (see Table 3).
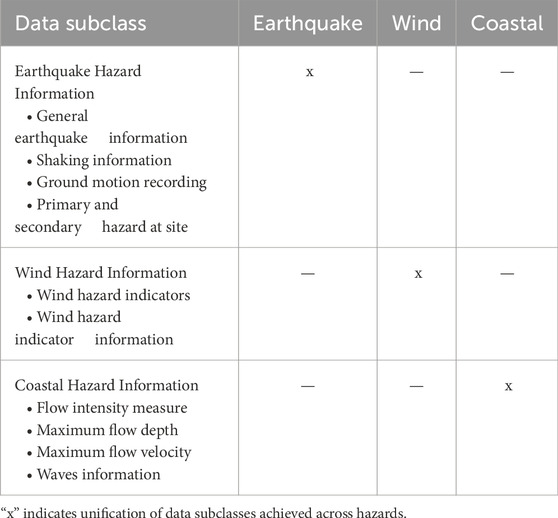
Table 3. Summary of data subclasses under Hazard Survey data class and associated unification at individual hazard level.
3.3 Performance assessment survey attributes
In the Performance Assessment Survey data class (see Figure 2 inset 3), information related to the facility and its observed performance and functionality is gathered under three data subclasses: Facility Information, Performance Information, and Functionality Information. Table 4 provides high-level summary of attributes associated with each subclass and unification of those attributes across hazards. Facility Information data is further categorized into site characteristics, facility basic metadata, structural information, and nonstructural information. Site characteristics attributes include site location on slope or beachfront, site soil classification, flood zoning, and terrain classification. These characteristics encompass the range of site conditions potentially affecting structural performance under different hazard conditions, e.g., beachfront properties and properties on slope are vulnerable to earthquakes and in the event of cascading earthquake-tsunami events (Suppasri et al., 2013; Alam, 2024), whereas terrain characteristics influence the structural windstorm performance (Kopp and Fewless, 2014). Facility material, geometry and configuration, construction year, and other relevant metadata known to affect performance under different hazards are collected under Facility Basic Metadata. For buildings, the framework compiles metadata such as the number of stories above and below grade, elevation of the lowest story, mean roof height, vertical (elevation) and horizontal (plan) irregularity, occupancy category, retrofit details, and instrumentation information. Structural information data entails collecting structural systems and components information along the structural load path from foundation to the superstructure. For buildings, this includes structural system classification, structural component information including foundation details, wall subassemblies (framing, anchorage, substrate), fenestration, roof-to-wall attachments, roof subassemblies (framing, cover, secondary water barrier, substrate), soffits, etc. For buildings, the structural systems included in the current implementation of the framework are based on the FEMA-310 classification (FEMA 310 1998). This classification represents the structural systems prevalent in the US and is adopted in all HAZUS regional loss modeling methodologies for earthquakes, tsunamis, and hurricanes (FEMA, 2024; FEMA 2022b; FEMA 2022a). Nonstructural information encompasses mechanical, electrical and plumbing (ME&P), interior partitions, and contents.
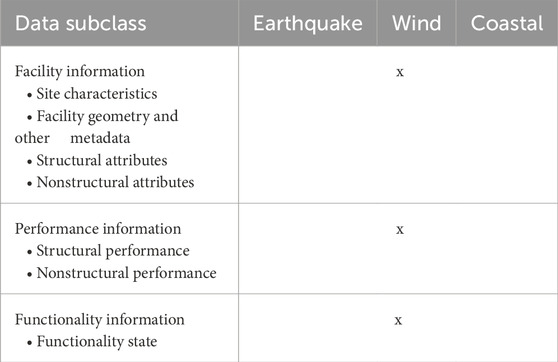
Table 4. Summary of data subclasses under Performance Assessment Survey data class and associated unification across hazards.
The Performance Information subclass records observed infrastructure performance indicators (e.g., damage, loss, downtime, etc.). The level of detailed performance data gathered depends on the infrastructure performance assessment fidelity level. Currently, StEER’s field investigation protocols support three increasingly rigorous performance assessments, namely, Basic Assessment (BA), Load Path Assessment (LPA), and Detailed Component Assessment (DCA). Figure 3 depicts the purpose, tradeoffs, use case, and the type of data collected for each of the performance assessment fidelity levels. Note from Figure 3 that the assessments build on one another, e.g., Detailed Component Assessment includes all the fields of the LPA and BA, plus additional fields unique to the DCA.
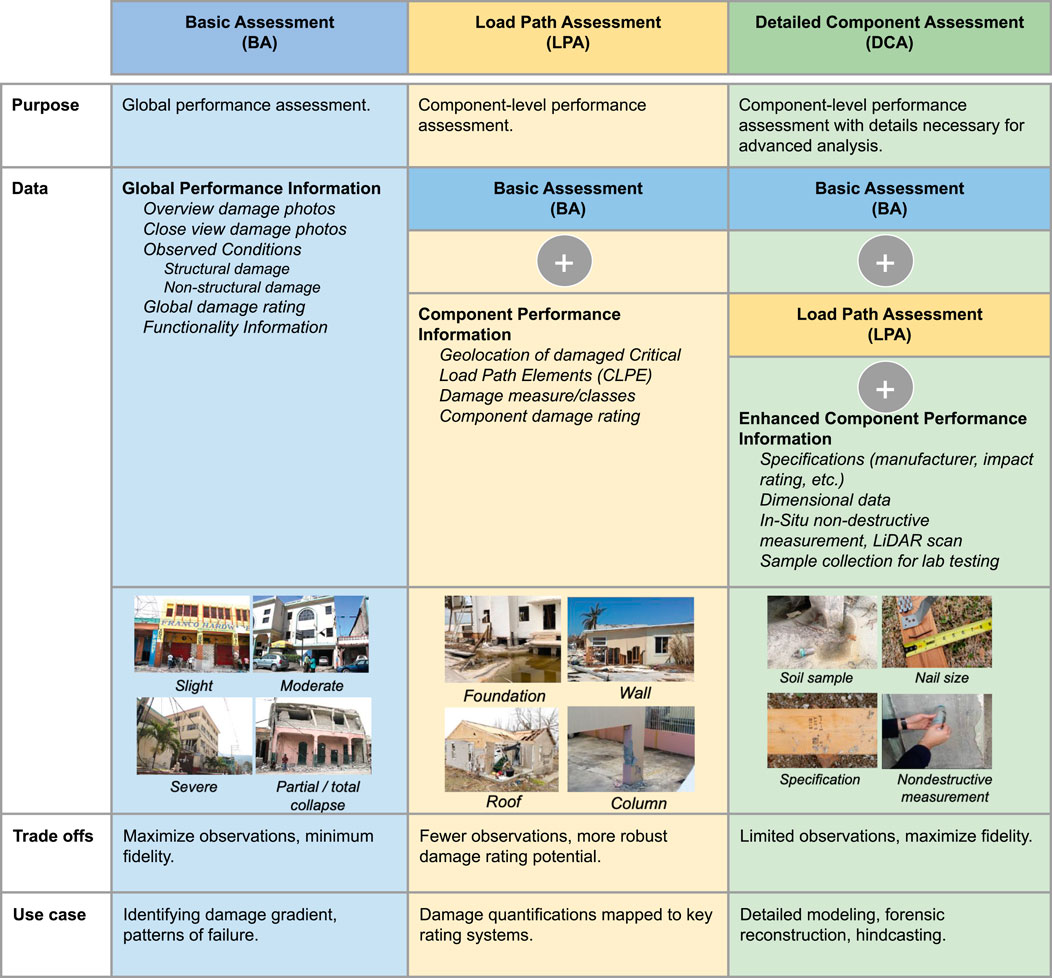
Figure 3. StEER’s increasingly rigorous performance assessment levels: Basic Assessment (BA), Load Path Assessment (LPA), and Detailed Component Assessment (DCA) with summary of purpose, collected data, trade-offs, and use cases.
Finally, Functionality State subclass documents the functional recovery state of the structure being assessed. In the current implementation of the framework, the functional recovery state of the building is assessed based on the building safety, story access, tenant safety, and tenant function following the functional recovery methodology outlined in FEMA (2021). Within the Performance Assessment Survey data class, unification of attributes is achieved at the data field level only in a few instances (see Tables 5, 6), with unification across two hazards being more common. Moreover, although not shown herein for brevity, unification of attributes also depends on the performance assessment fidelity level.
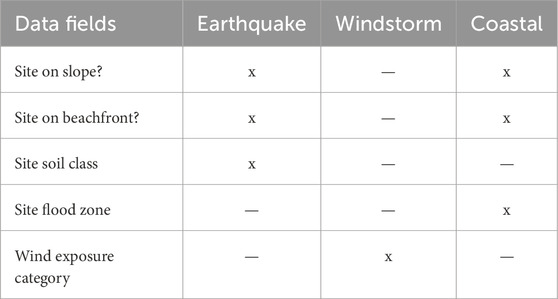
Table 5. Example unification of site characteristics attributes across hazards.
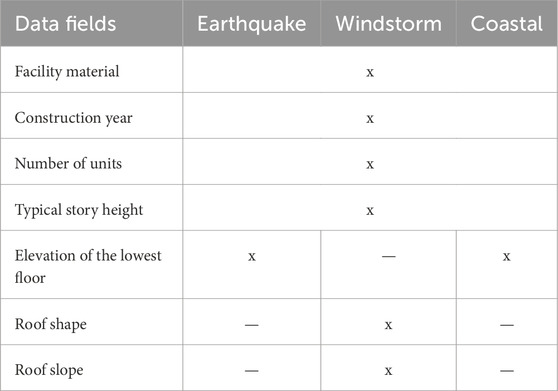
Table 6. Example unification of facility basic metadata attributes across hazards.
In summary, the unified framework adopts a modular design, enabling the collection of hazard-specific observations within a common data architecture. Each hazard type—such as earthquake or windstorm—is supported by tailored data entry fields that align with the physical manifestations and structural consequences unique to that hazard. This design ensures that key performance indicators—such as shear cracking and pounding for earthquakes; roof uplift and cladding loss for windstorms; and inundation depth, scouring, or waterborne debris impacts for tsunamis—are accurately documented. This simplifies the number of apps and databases that must be maintained by organizations like StEER who respond to different hazard classes. As these hazards can occur in a cascading or compound sequence (e.g., tsunami following earthquake, hurricane surge and wave accompanying wind and rain) this avoids users from having to engage multiple hazard-specific apps to document each of these effects on a site. In short, the harmonized data structure of the unified assessment framework is designed to facilitate cross-event and even cross-hazard analysis while preserving the fidelity of hazard-specific insights.
4 App implementation
The Unified Assessment Framework was implemented as a mobile application within the Fulcrum platform, which StEER has used for its Field Assessment Structural Teams (FASTs) since 2017. In addition to being free of charge for humanitarian groups at the time, Fulcrum was selected for its robust offline functionality and flexible cloud syncing, which are critical features in post-disaster environments with limited or intermittent connectivity. Once installed on a mobile device, the app enables surveyors to collect and store observations entirely offline. In the event of complete internet disruption—common after disasters—data is saved locally and automatically synced to the cloud when connectivity is restored. This ensures uninterrupted data collection and reduces the risk of information loss during time-sensitive field operations. In addition to offline capability, and its robust integration with the EsRI suite of services, Fulcrum supports user-level access controls, encrypted data storage, and multiple export formats. These features enhance data security, promote cross-platform compatibility, and support compliance with data protection standards and are downloadable for iOS and Android from all commercial app stores, making the platform well-suited for coordinated, volunteer post-disaster reconnaissance efforts.
Figure 4 illustrates the data flow through the Fulcrum app named as the StEER Unified App, designed to be used by FASTs for all future event responses, regardless of the hazard or structure type. The app features nested menus that intelligently display relevant sections and data fields based on the hazard type, assessment class, and infrastructure type under investigation. Information provided in earlier sections of the app will dictate the fields presented to the user in later sections, taking advantage of Fulcrum’s embedded logic with conditional if-else statements and logical AND/OR operators. To prepare FAST members for effective use of the app, a comprehensive set of training resources was developed, including a detailed handbook, quick reference sheet (QRS), and instructional videos. These materials were integrated into the pre-deployment briefing—a guidance document containing all relevant information on resources and planning to support FAST operations during active missions. These resources are also publicly available at https://www.steer.network/resources.
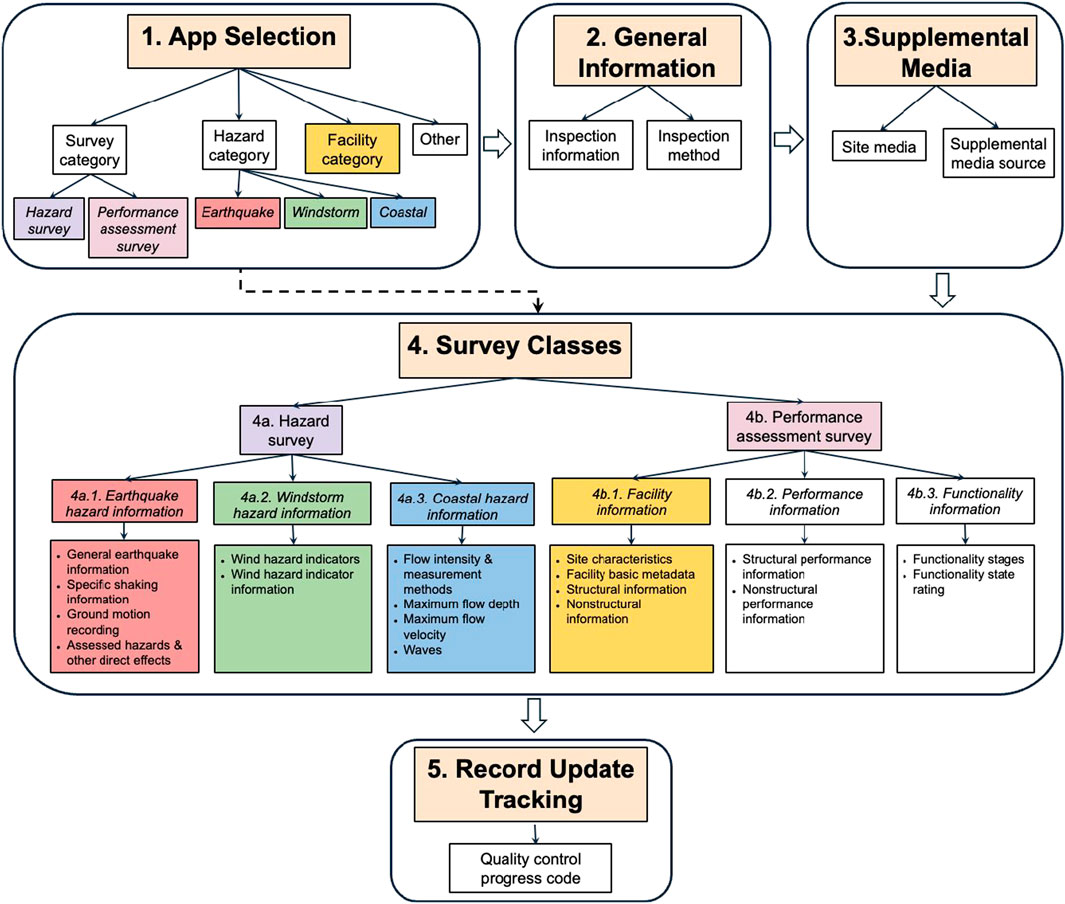
Figure 4. Flowchart of the StEER Unified App operationalizing the Unified Assessment Framework in Fulcrum.
As illustrated by Figure 4, the app consists of six major sections: App Selection, General Information, Supplemental Media, Survey Classes, and Record Update Tracking. The data subclasses and data fields in each section closely follow those described in Section 3, with the addition of the Record Update Tracking section. This backend feature is not available to field teams and is intended to document the data enrichment and quality control (DEQC) processes engaged by virtual data librarians once field data gathering is complete. Table 7 provides a brief overview of the purpose and type of data collected in each section of the app. In the current version of the app, only Basic Assessment (BA) is available to the users. Work is underway to synthesize and unify relevant fields for two additional assessment levels: LPA and DCA. A complete list of all app fields under each section, along with logic implemented to organize and display relevant sections and fields, is provided in Supplementary File S1. Unified App: Master Data Sheet.
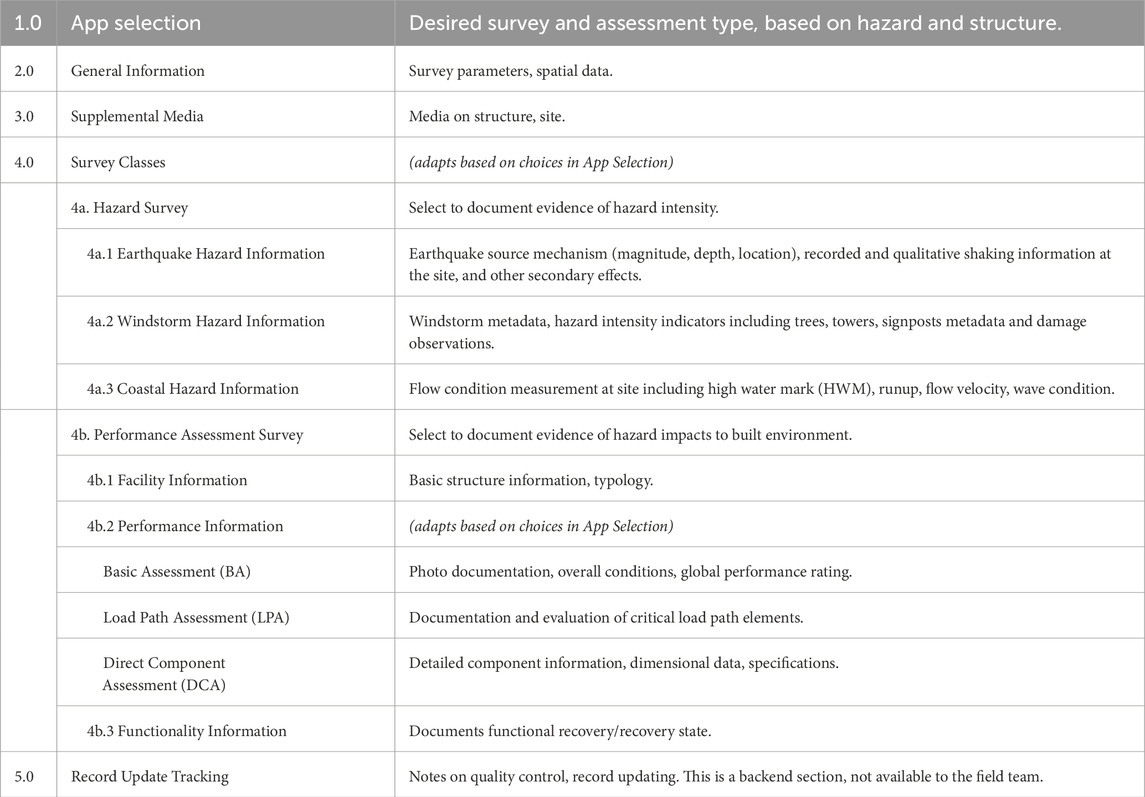
Table 7. Summary of the purpose and types of data collected in different sections of the app.
Note, while the unified framework has been primarily developed to support coordinated field data collection within the StEER network, it is deliberately designed to be openly accessible and highly adaptable, aiming to facilitate consistent, high-quality data collection across a broad spectrum of users, from individual researchers to multidisciplinary response teams. The framework is readily available to academic, governmental, and professional organizations interested in adopting or customizing it to meet their specific post-disaster assessment needs; its implementation in Fulcrum is available through StEER’s account which all members can access. Users can further tailor the framework—such as modifying forms to reflect local construction practices, hazard types, or regulatory requirements—by adapting the data fields in Supplementary File S1. Unified App: Master Data Sheet within the platform of their choice or working with a cloned version of the StEER Fulcrum App.
4.1 Special fields: required fields
The data fields in the app are primarily classified into three categories: Required Field (RF), Field Priority (FP), and media attachments. RFs, marked with red asterisks ( ), must be completed by field investigators as their responses trigger conditional logic in the app, instructing the display of subsequent sections, data subclasses, and associated fields throughout the app. Refer to the Supplementary File S2. Unified App: Required Fields for a complete list of required fields associated with different sections of the app. The color-coded data subclasses in Figure 4 illustrate the high-level dependencies between different sections and data subclasses in the app. These dependencies are coded as conditional logic using the RF responses in App Selection and other sections of the app. See the Supplementary File S1. Master Data Sheet for a complete list of all dependencies.
One of the key RFs in the app is the Sampling Method under the General Information section. Currently, StEER employs six sampling methods for selecting buildings and other infrastructure for assessment in the field. These sampling methods include: (i) statistical sampling where every Nth building in a cluster or along a route is assessed; (ii) critical case sampling selects buildings that meet specific criteria, e.g., instrumented or has targeted performance characteristics; (iii) cluster-based sampling where buildings within a defined radius of point are sampled, e.g., within X meters of a ground motion station; (iv) transect-based sampling that involves sampling buildings along a path that moves across the hazard intensity gradient; (v) quota-based sampling that involves sampling buildings to achieve a representative sample based on characteristics of underlying building inventory; and (vi) opportunistic sampling, which involves assessment of structure not included in initial sampling strategy, based upon unique features or performance observed in the field. The recommended sampling method(s) are communicated to the field team through the Field Assessment Structural Team (FAST) Pre-Deployment Briefing.
4.2 Special fields: field priorities
Given the comprehensive and rigorous nature of the unified assessment, it is not efficient or feasible for field investigators to complete every data field on-site. Therefore, the app prioritizes (i) capturing clear photographs of the site and structure from multiple perspectives, (ii) accurately geolocating the assessment, and (iii) populating the field priority (FP) fields. FP fields gather information that is typically discernible only through on-site forensic investigations and may otherwise be impossible for a virtual investigator to gather later. FP data fields are marked as “(Field Priority)” in the app. Refer to the Supplementary File S3. Unified App: Field Priority Fields for a complete list of FPs associated with different sections of the app. The majority of the RFs and FPs are single- or multi-choice lists, or text/numeric input fields. Additionally, field investigators are encouraged to note any unusual or unique characteristics of the hazard and structures that might affect their performance under a given hazard, capturing these observations through available free-form notes fields, additional photographs, and sketches. Extra guidance is provided throughout the app using descriptive field titles and text labels for any data fields that are not self-explanatory, helping to clarify the intended purpose of the questions. Figure 5 shows mobile app screenshots highlighting these and other features of the app.
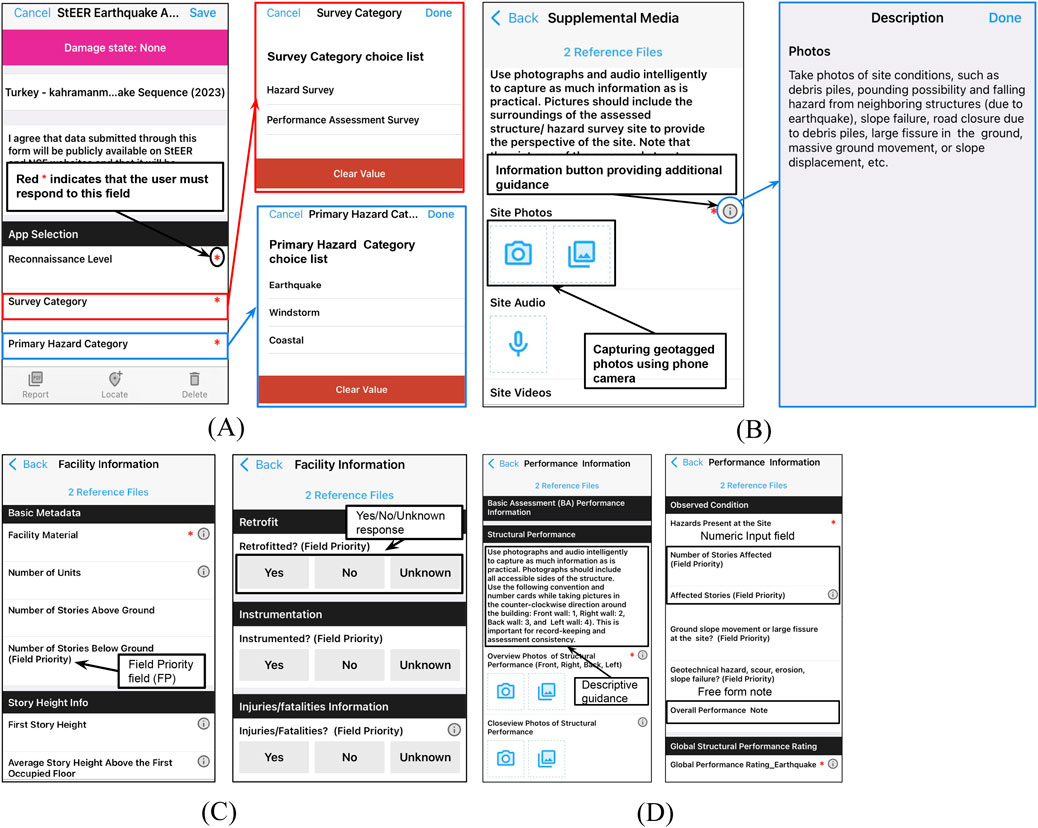
Figure 5. Snapshots in iOS highlighting key features of the StEER Unified App (A) Required Fields (RF) marked with red asterisks (

4.3 Special fields: media
The app heavily relies on visual evidence to document site conditions (under the 2. Supplemental Media Attachment section) and infrastructure performance (under the 4b.2 Performance Information subsection). For documenting site conditions surrounding the structure/site under investigation, field investigators are required to take photos in counterclockwise sequence (1: front, 2: right side, 3: back, and 4: left side) facing away from the structure being investigated. Using the counterclockwise sequence protocol while taking photos ensures documentation consistency, aids in the DEQC process, and aids with detailed numerical modeling at later stages. In the Performance Information subsection, irrespective of the assessment fidelity levels, i.e., BA, LPA, or DCA, visual evidence of structural and nonstructural damage is gathered through (i) overview photos - where photos of each accessible face of the structure are taken in counter clockwise direction from a distance sufficient to capture the full elevation; and (ii) detail photos - where close-up photos of component damage (e.g., damage to columns, beams, walls, connections) are documented. Field investigators are advised to avoid taking highly zoomed-in pictures that hinder identification of the location of the damage with respect to overall geometry of the structure or component. Additionally, the app includes options for audio dictations and video recordings or free-form note fields to document additional context or observations as needed. To ensure a standardized visual record of the site and structure context, a counterclockwise photo sequence is recommended: (1) front, (2) right, (3) back, (4) left. However, it is recognized that full coverage may not always be feasible due to site constraints, e.g., attached buildings or due to site debris. In such cases, investigators are encouraged to capture as many views as possible (ideally with compass orientation embedded in the photo metadata) and to document inaccessible sides using metadata fields or field notes. This flexible approach ensures adaptability to real-world conditions without compromising the value of a consistent visual record.
In App Selection, users can designate both the primary hazard, and any cascading hazards observed on site, which triggers the app’s logic to present fields relevant to both the primary and cascading hazards in subsequent sections and subsections. For example, in a multi-hazard scenario involving a tsunami following an earthquake, selecting Earthquake as the primary hazard and Tsunami as the cascading hazard prompts the app to display facility descriptions relevant to both hazards (e.g., vertical and horizontal irregularity relevant to earthquake damage, and elevation of the lowest horizontal structural member relevant to tsunami exposure) under Subsection 4b.1: Facility Information. Similarly, under Subsection 4b.2: Performance Information, the data fields are designed to support both hazard-specific and multi-hazard performance indicators (e.g., soft-story collapse for earthquakes vs debris impact, breakaway wall performance, and floor slab uplift for tsunamis). Users can attribute damage observations to specific hazards by selecting from a predefined list, pairing these observations with geotagged and labeled photos and supplementing them with descriptive notes to provide spatial and contextual clarity. In another scenario, during a coastal hurricane event, users can distinguish between surge and wave damage to lower stories and wind or rain effects on upper stories—capturing the location-specific impacts of multiple hazards within a single structure. Figures MH.1 and MH.2 in Supplementary File S4: Unified App: Multi-Hazard Fields showcase screenshots highlighting the multi-hazard (e.g., cascading or/and compounding) documentation capabilities of the StEER Unified App.
4.4 Unified damage rating scale
As discussed in Section 2, numerous qualitative and quantitative damage scales exist, both within individual hazard domains and across different hazards (e.g., Vickery et al., 2006; Baggio et al., 2007; Anagnostopoulos and Moretti, 2008; Friedland, 2009; Tomiczek et al., 2017; Uroš et al., 2020), creating significant challenges for consistent damage assessment. StEER, similar to its hazard-specific mobile apps, has utilized various damage rating scales: (i) for earthquakes–a five-point scale (none, minor, moderate, severe, collapse) by Baggio et al. (2007), (ii) for windstorm: a five-point scale (none, minor, moderate, severe, destroyed) by Vickery et al. (2006), and (iii) for coastal hazard: a seven-point scale (none/very minor, minor, moderate, severe, very severe, partial collapse, collapse) by Friedland and Levitan (2011). The integration of standardized and consistent field damage assessments significantly enhances the accuracy of damage estimates derived from engineering predictions or remote sensing driven proxies, which play a critical role in informing response and recovery decisions, better situational awareness, reoccupation decisions, and the allocation of recovery funding (Loos et al., 2022). In recent years, the earthquake engineering community has made significant strides in developing an International Macroseismic Intensity (IMS) scale, inspired by the EMS-98 scale (Grünthal, 1998), for global adoption (Wald et al., 2024). This scale, which is parameterized by building vulnerability and damage grades, serves as a crucial proxy for instrumented seismic intensity measures. The building vulnerability metrics can be adapted to regional or country-specific building typologies, such as those developed for the U.S. (Hortacsu et al., 2024) and New Zealand (Charleson et al., 2024). Given that instrumented hazard intensity measurements—like wind speed, inundation depth, or flow velocities at specific infrastructure locations during windstorms or coastal events—are often rare and impractical, developing a similar intensity scale to correlate damage with hazard intensity, akin to the IMS, is a logical and valuable step forward. In response to this need, the current version of the StEER Unified App introduces a preliminary mapping rules to map out existing hazard-specific damage rating scales-such as Vickery et al. (2006) for wind and Friedland and Levitan (2011) for coastal hazards to EMS-98-consistent scale. In consolidating damage ratings to a common scale for purposes of unification in the app’s data structure, care was taken to retain the overarching level definitions (e.g., slight, moderate, severe damage) while customizing the specific descriptors to reflect hazard-specific damage mechanisms. For example, earthquake-related damage states include descriptors such as “shear cracking” or “wall out-of-plane instability,” while wind damage descriptors reference roof loss, wall breach, and debris impact. Each hazard retains its own technical language and damage indicators, and the framework avoids directly transferring seismic descriptors to other hazards. Instead, EMS-98 is used as a conceptual scaffold for a common data structure to promote cross-hazard comparability while preserving hazard-specific relevance and remaining committed to further refinement. Detailed information on this preliminary mapping is provided in the Supplementary File S5: Quick Reference Sheets: Global Damage Ratings Mapping and is also available at https://www.steer.network/resources.
It is important to note that this mapping effort of consolidating global damage rating into a common data field was intended solely to support unification of the app’s data structure and not to propose a new damage rating scale or enforce strict equivalencies across hazards. Such harmonization would require rigorous expert consensus. Should such consensus emerge in the future, the app can be readily updated. For now, the initial mapping of wind, surge/flood, and rainwater ingress damage provides a starting point—though admittedly it may not fully reflect the balance between structural and nonstructural impacts for non-seismic hazards, especially when compared to EMS-98’s generalized structure. Users are encouraged to consult accompanying guidance documents to interpret the damage ratings within the context of each hazard. This limitation highlights an opportunity for future refinement through the establishment of hazard-specific expert working groups. These groups could enhance the scale by developing more detailed descriptors of structural impacts. For instance, “moderate” flood damage could be better defined by including indicators of structural material degradation—such as corrosion at connections or warping of timber framing—while “moderate” rainwater ingress might include early signs of structural deterioration, like ceiling sag or partial failure of roof sheathing. Such refinements will improve consistency across hazard types and ensure that equivalent damage levels reflect comparable severity in both structural and nonstructural terms.
4.5 Unification of data fields
Table 8 lists the number of data fields in different app sections unified across hazards and structural typologies. In the first three sections, categorized under the Unified Assessment data class (refer to Figure 2), all data fields have been unified, totaling 23 out of 23. This includes seven out of seven fields in App Selection, nine out of nine in General Information, and seven out of seven in the Supplemental Media section. This comprehensive unification is possible because the data fields in these sections are applicable to all hazards, facilitating app branching in subsequent sections for either Hazard Survey or Performance Assessment Survey classes. In the Survey Classes, unification has been achieved for 110 out of 278 data fields. However, no unification was possible in the Hazard Survey section, where the 133 data fields are unique to different hazards. In contrast, the Performance Assessment Survey section achieved unification for 110 out of 145 data fields across hazards. As illustrated in Tables 5 and 6, among the remaining 35 data fields in this section, unification across two hazards is more prevalent than no unification at all. In total 133 data fields have been unified out of a total of 301 in the Unified App.
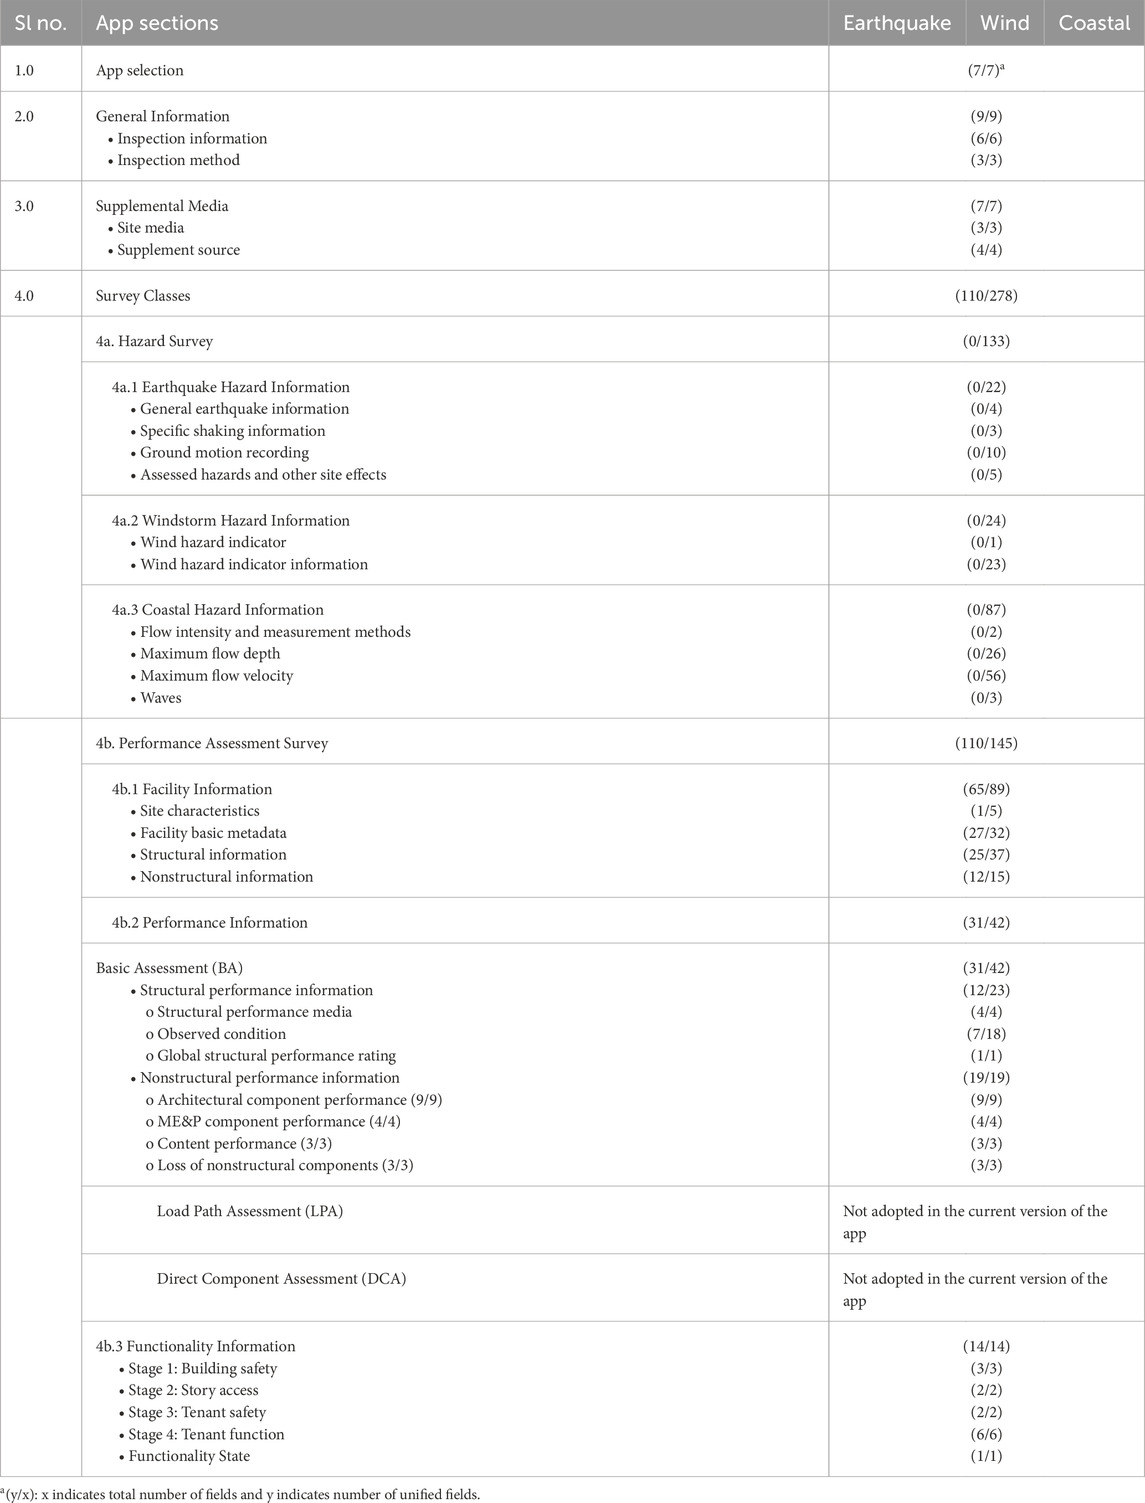
Table 8. Unification of data fields across hazards and structure typologies.
5 Illustrative use case
Two use cases are presented to demonstrate the application of the proposed Unified Assessment Framework via the StEER Unified App in Fulcrum: a supervised pilot during 2022 Hurricane Ian, Florida and an unsupervised deployment for the 2023 Turkey earthquake sequence. Hazard-specific apps, StEER Coastal App_v3 for Hurricane Ian and StEER Earthquake App_v2 for Turkey earthquake, were used. Feedback and user experience gathered from these two events contributed to the synthesis and unification of the data fields from these apps into the StEER Unified App_v1, through a consensus-based unification process led by StEER leadership. For Hurricane Ian, a FAST team was deployed by StEER for comprehensive data collection using a mixed methodological approach, which included: (i) rapidly imaging a wider cross-section of impacted regions using surface-level panoramas (SLP), (ii) aerial imaging of the barrier islands using unmanned aerial systems (UAS), (iii) surveying high-water marks (HWMs) and inundation extents across multiple sites, and (iv) conducting performance assessments of damage to buildings and other infrastructure, for which the app was used under the supervision of the first author (who was embedded with the FAST). In contrast, for the Turkey earthquake sequence, StEER did not deploy its own team but instead supported the Earthquake Engineering Field Investigation Team (EEFIT) by providing access to the StEER Earthquake App_v2 and training materials for their team’s self-directed structural assessments. The following use cases for these two events highlight the types of data gathered, the completeness of the data, its dependency on pre-deployment training of the app, and the time required to complete assessments of different fidelity levels—specifically, the LPA conducted by StEER FAST versus the BA conducted by EEFIT.
5.1 2022 Hurricane Ian
On 28 September 2022, Hurricane Ian made landfall near Cayo Costa, Florida, as a Category 4 hurricane, with peak sustained wind speeds over water estimated at 150 mph and a minimum surface pressure of 940 mb (NHC, 2022). Storm surge inundation measurements reached 7.5 m relative to NAVD88. Despite being a below-design-level wind event, the storm surge impacts were catastrophic, resulting in significant damage to infrastructure and loss of human lives along the densely populated west coast of Florida, particularly in the barrier islands of Fort Myers Beach (FMB), Sanibel, Saint Carlos, Cape Coral, and Bonita Beach (Cortes et al., 2022). Additionally, heavy rainfall led to extensive inland flooding across Florida and into the Carolinas as Ian made a second landfall there on September 30.
In response to Hurricane Ian’s impact, StEER activated all the way to Level 3, deploying multiple FASTs in phases to the landfall region (Prevatt et al., 2022). At Level 3, an 18-member team collected data from October 19 to November 4, 2022, which included specialists in aerial and surface imaging, high-water mark (HWM) documentation, and structural assessment, ensuring a diverse skill set for comprehensive data collection. The structural and coastal teams conducted a thorough assessment of 273 buildings and documented 177 HWMs using the StEER Coastal App_v3 (see Figure 6). As shown in Figures 7A, the data collection ensured hazard intensities were documented via HWM collocated with performance assessments of affected structures. Figures 7B–E showcase photographs from the HWM assessments and the structural performance assessment of a local post office in FMB. The majority of structural assessments focused on residential buildings (single family 64.7% and multi-family 17.85%), with limited representation of commercial (∼7.8%) and critical facilities (∼1.8%). The FAST collected extensive data within the Fulcrum app using the LPA option, capturing various attributes such as location, year built, building category, structural systems, details of the structural load path, including the presence of breakaway walls and other coastal features, types of loading experienced (hydrostatic, hydrodynamic, debris impact, etc.), and observed exterior damage to fenestration, wall cladding, roof cover, and structural systems.
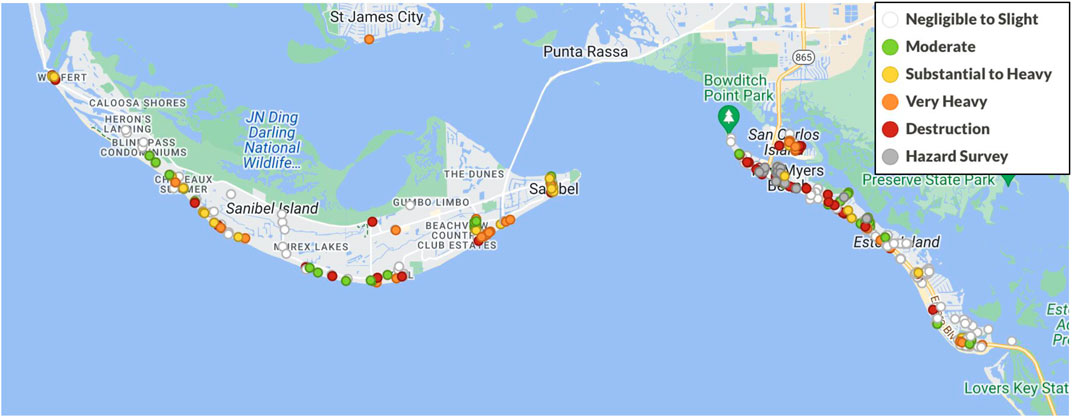
Figure 6. Locations of performance assessments and High-Water Mark (HWM) surveys conducted by StEER FAST in Fort Myers Beach and Sanibel Island, Florida, following 2022 Hurricane Ian.
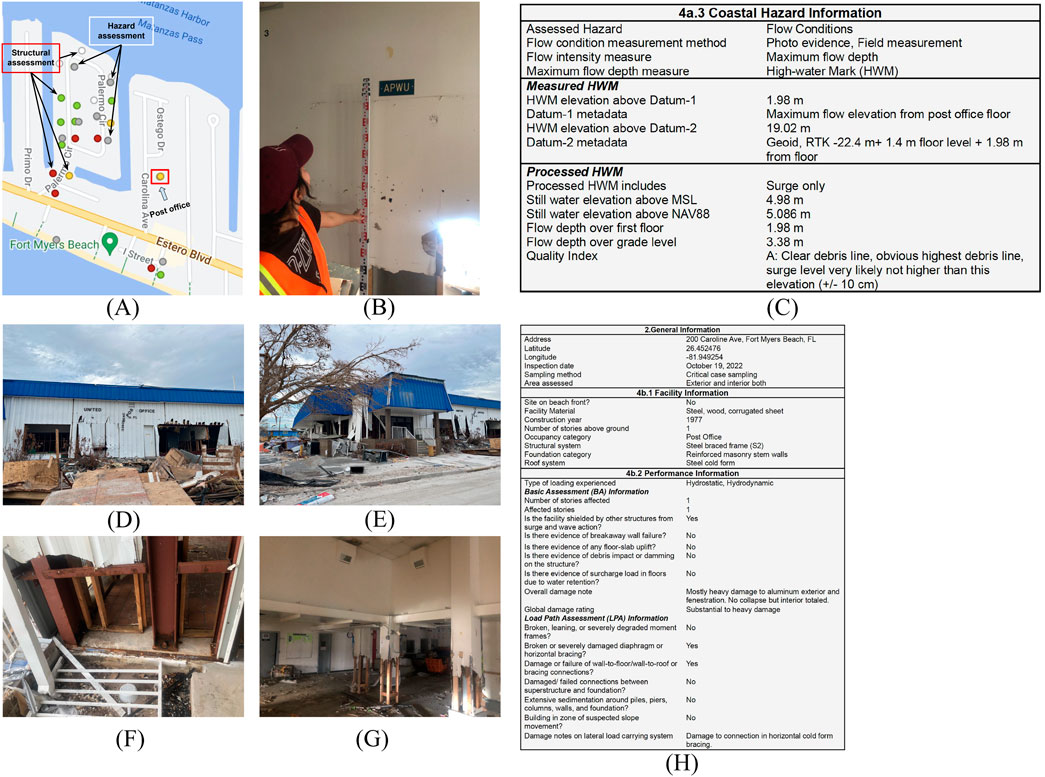
Figure 7. Example of hazard and performance assessments for multiple buildings in close proximity from Hurricane Ian field investigation. The figure includes (A) a map showing the locations of the assessments, (B) a photo of a High-Water Mark (HWM) measurement taken inside a critical case structure (a post office) relative to the floor level, along with (C) relevant metadata of the measured and processed HWM recorded in Fulcrum. Additionally, (D, E) show overall photos of the damage observed around the same structure, while close-up images (F, G) capture damage to load path elements. Lastly, (H) shows a sample feature set of data recorded as part of Basic Assessment (BA) and Load Path (LPA) assessments.
Figure 8A,B represent histograms showing the duration of LPAs and HWMs as assessed by Hurricane Ian FASTs. The mean duration for LPAs is 18.5 min, with a standard deviation of 55.3 min, while HWMs have a mean of 6.5 min and a standard deviation of 17.9 min. In both assessment types, the standard deviation is approximately three times the mean. The LPA assessments involved a larger number of questions compared to HWM assessments, which is reflected in their longer response duration. Figures 8C,D illustrate the completeness of data for two assessment types with increasing fidelity levels, BA and LPA, respectively. Figure 8C shows that for the BA, the mean response rate is 77.9%, with a standard deviation of 18.5%. Notably, two questions—the global damage rating of the structure and the hazard present on-site—achieved a 100% response rate, as they were required fields (RFs) in the app. In contrast, the response rates for field priority fields (FPs) varied between 49% and 97%. The lowest rate, 49%, pertains to the overall damage note, a text input field for additional observations, while the highest rate corresponds to documenting evidence of debris impact on the structure. Other questions related to the number of stories affected and details about affected stories had lower response rates due to the need for access to all floors in multi-story buildings, which the FAST often could not access to. Figure 8D shows that for the LPA, the mean response rate is 47.6%, with a standard deviation of 18.1%. The response rates ranged from 5% to 66%, with the lowest rate corresponding to overall damage notes on lateral load-carrying systems like BA, and the highest related to damage at the connections between the foundation and superstructure. The LPA questionnaire requires considerably more effort, access, and scrutiny to identify damage along load path elements, justifying the lower response rate compared to the BA. Since none of the LPA questions are required fields, no questions reached a 100% response rate. Overall, the differences in data completeness between BA and LPA underscore the varying levels of access, effort, and expertise needed for these different fidelity assessments.
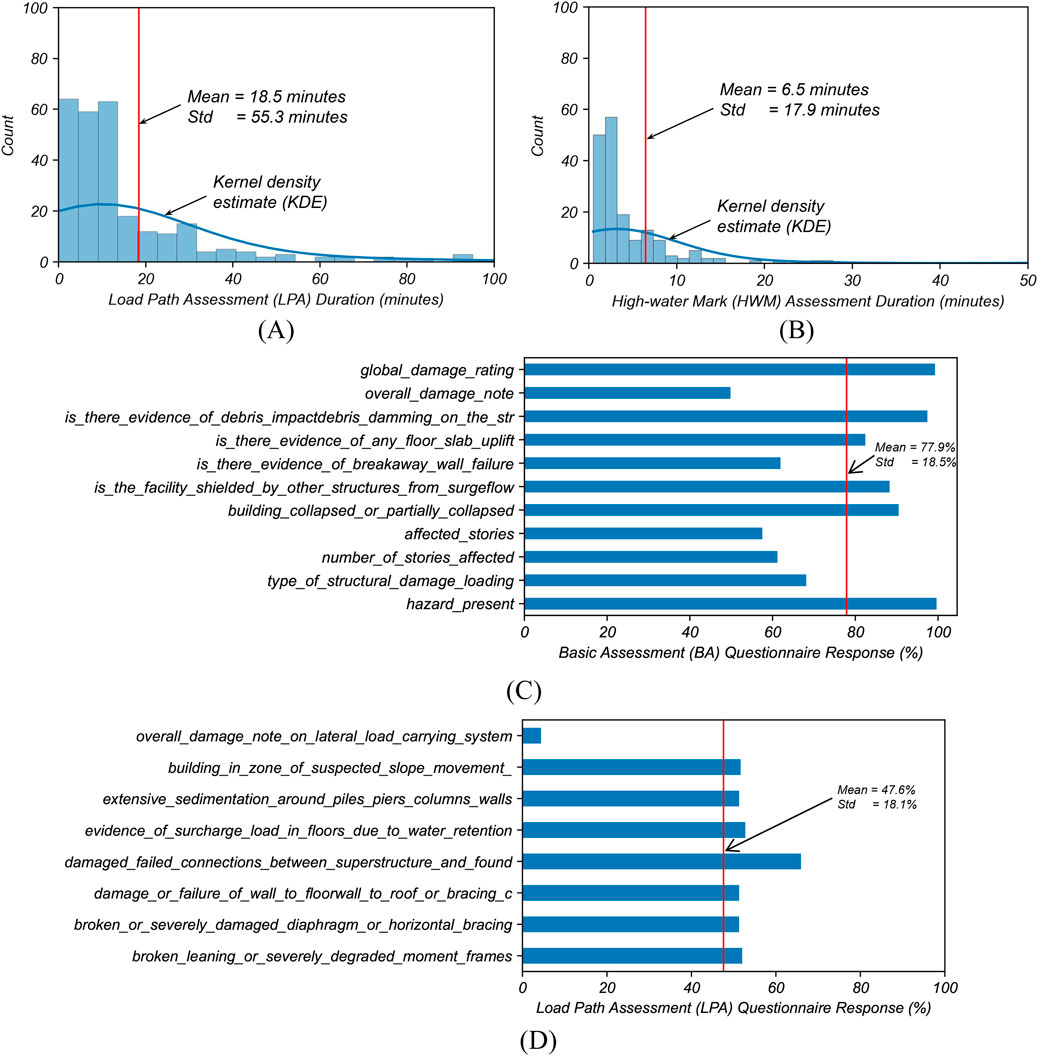
Figure 8. Histograms showing the duration of assessments for (A) Load Path Assessment (LPA) and (B) High-Water Mark (HWM) surveys conducted by the StEER FAST during the 2022 Hurricane Ian deployment. The red vertical lines in these figures represent the mean duration. The completeness of the sample set from questionnaires recorded by the assessment team is shown for (C) Basic Assessment (BA) and (D) Load Path Assessment (LPA). Note the nested nature of the performance assessment process (see Figure 3), where higher-fidelity assessments, such as LPA, involve completing both BA and LPA questionnaires sequentially.
5.2 2023 Turkey earthquake sequence
On 6 February 2023, southeastern Turkey (Türkiye) was devastated by two large-magnitude earthquakes. The first, with a magnitude (Mw) of 7.8 and a focal depth of 17.9 km, occurred along the Eastern Anatolian Fault (USGS 2023a). Nine hours later, a second earthquake of Mw 7.5 and a focal depth of 10 km occurred on the Sürgü-Çardak Fault, located approximately 95 km north-northeast of the initial epicenter (USGS 2023b). The shallow depth of the Mw 7.8 earthquake, combined with a bilateral rupture that extended both southwest and northeast across an area of 100 km by 75 km, impacted 10 provinces in Türkiye—Kahramanmaraş, Gaziantep, Şanlıurfa, Diyarbakır, Adana, Adıyaman, Osmaniye, Hatay, Kilis, and Malatya—which together have a population of approximately 13.5 million people (AFAD, 2023). The seismic activity also affected parts of northwestern Syria. The devastation was particularly severe due to the high population density and the vulnerability of the infrastructure in the impacted areas. As a result of this sequence of earthquakes and aftershocks, around 36,932 buildings partially or completely collapsed, while another 311,000 buildings were severely damaged rendering them unusable in Türkiye (IBC, 2023). In northwest Syria, more than 10,600 buildings were partially/completely collapsed (OCHA, 2023).
Deferring to local engineers to lead the performance assessments, StEER elevated only to a Level 2 response for this event, issuing a joint Preliminary Virtual Reconnaissance Report (PVRR) with the Earthquake Engineering Research Institute (EERI) Learning From Earthquakes (LFE) program (Dilsiz et al., 2023). StEER formed a collaboration with other responding groups to hire local contractors to rapidly image the epicentral region using SLP camera systems, collecting over 250 km of panoramic imagery hosted on an interactive dashboard to support responding teams. When possible, StEER equipped responding local engineers with the StEER Earthquake App_v2 and technical guidance; chief among these was the Earthquake Engineering Field Investigation Team (EEFIT), who utilized the app to conduct BA of structures. In total, a five-member EEFIT team assessed 322 structures between March 13-17, 2023 (see Figure 9) (Aktaş et al., 2024). Figure 10 shows example assessment conducted to document a Church performance.
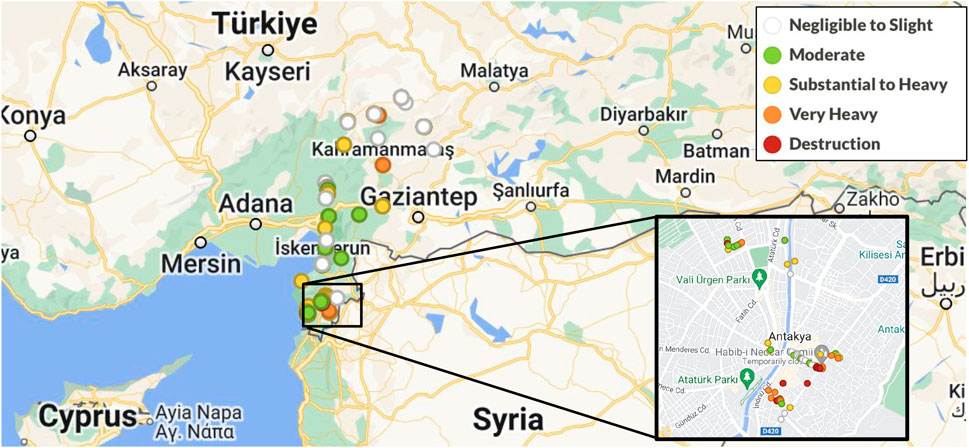
Figure 9. Locations of performance assessments conducted by the Earthquake Engineering Field Investigation Team (EEFIT) using the StEER Unified App in the aftermath of the 2023 Turkey earthquake sequence.
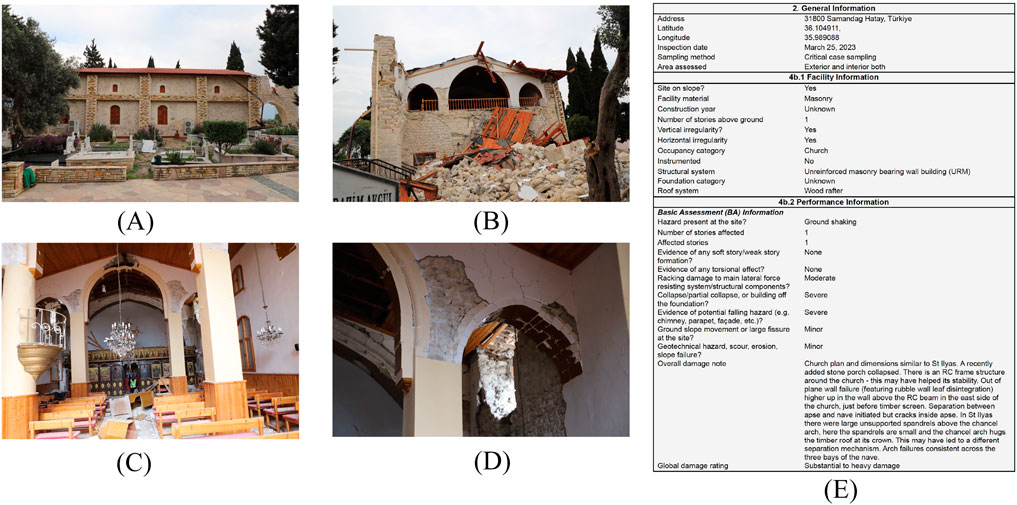
Figure 10. Example of a performance assessment of a church damaged during the 2023 Turkey Earthquake Sequence (A, B) show overview photos taken around the church, while (C, D) provide close-up views of damage to the arch with (E) a sample feature set of data recorded as part of the Basic assessment (BA).
Figure 11A displays the histogram of BA duration of EEFIT team during the Turkey earthquake reconnaissance. The mean duration is 6.2 min, and standard deviation is 16.5 min, which is considerably lower than the corresponding statistic for the LPA during 2022 Hurricane Ian. Figure 11B illustrates the completeness of data in the BA. The mean response rate for BA is 37.9%, with a standard deviation of 33.3%. Like the Hurricane Ian response, the required fields (RFs)—specifically the global damage rating of the structure and the hazard present on-site—achieved a 100% response rate. However, the response rates for the remaining field priority fields (FPs) varied between 10.3% and 30.8%. The lowest rate of 10.3% pertains to the affected stories, while the highest rate of 30.8% is associated with whether the building has collapsed or partially collapsed. Overall, the level of data completeness in the unsupervised BA for the Turkey earthquake is much lower compared to that achieved in the supervised LPA assessments during Hurricane Ian. This discrepancy largely reflects the EEFIT team’s lack of familiarity with the StEER app’s structure during the Turkey response, in contrast to the supervised LPA assessment by the StEER FAST during Hurricane Ian. Additionally, factors such as the need to cover large geographical areas and the nature of the hazard may further contribute to this disparity. Importantly, these findings are not viewed as limitations of the framework itself, but rather as expected outcomes in early-stage, high-pressure field conditions with varying levels of pre-deployment user training and data collection demands, particularly when hybrid (on-site with remote follow-up) assessments are feasible.
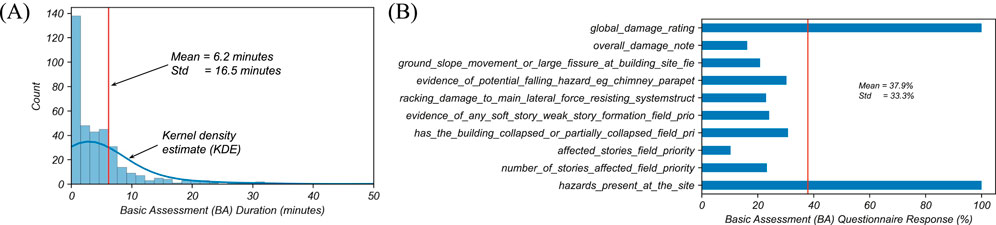
Figure 11. Histograms showing (A) the duration of Basic Assessments (BA) conducted by the EEFIT team during the 2023 Turkey Earthquake Sequence, and (B) the completeness of the sample questionnaire set related to BA.
Drawing on the feedback and user experience data from the use of hazard-specific apps, as well as data completeness statistics from the questionnaires in these two use cases, the performance assessment section of the Unified App has been further streamlined. The app logic was refined to prioritize key fields (RFs, FPs, Media), ensuring they are more prominently displayed than other standard fields, thereby enhancing usability. To further support users in navigating the StEER Unified App, a condensed version of the detailed handbook has been created as a quick reference sheet, along with multiple video tutorials for guidance. These refinements to the app interface, targeted onboarding, and improved pre-deployment training are already yielding higher completion rates in more recent deployments. Ongoing efforts will continue to focus on optimizing form usability and streamlining field workflows to maximize data quality without compromising speed or safety.
As demonstrated by the two use cases, the framework’s tiered structure affords investigators the flexibility to select the depth of assessment appropriate for their scientific questions and mission constraints. Broad, rapid assessments (BA) are often the preferred modality for large-scale reconnaissance due to time efficiencies; however, the framework still can support detailed, time-intensive follow-up investigations when conditions and resources permit. In such cases, LPA and DCA tiers support more granular documentation of damage, making them especially valuable for case studies focused on specific failure modes, structural systems, or multi-hazard interactions. Though less frequently deployed to date, these higher-resolution tiers offer a robust foundation for targeted investigations and in-depth engineering analysis. As field team training advances and deployment strategies become more modular, broader adoption of LPA and DCA is expected. Elements of the LPA and DCA in previous apps, particularly those tailored to wind and coastal hazards, have already been deployed successfully and supported subsequent forensic analyses (Kijewski-Correa et al., 2022; Marshall et al., 2022; Roueche et al., 2024), lending confidence in the approach, but will require more widespread application across all hazards.
6 Summary and conclusion
Post disaster structural assessment and hazard data collection efforts remain fragmented across hazard types and infrastructure systems due to varying objectives, methodologies, protocols, and standards among investigators and organizations. This limits our ability to fully understand hazard interactions with the built environment and community resilience across events. To address this barrier to knowledge discovery and diverse data reuse, a hazard-agnostic unified framework has been developed to standardize post-disaster data and metadata collection across multiple natural hazards (earthquake, windstorm, coastal) and infrastructure typologies.
The framework’s architecture was shaped through consensus among StEER leadership, guided by a review of existing framework and data collection practices. Input from the 2018 StEER Cross-Hazard Workshop at UC Berkeley further informed its design, highlighting synergies in structural assessment across diverse hazards and structural types, particularly in multi- and cascading hazard contexts. These efforts culminated in the creation of the Unified Assessment Framework. The Framework is structured with three data classes: (1) Unified Assessment, (2) Hazard Survey, and (3) Performance Assessment Survey to organize and store the collected data with similar attributes associated with the survey parameters, observed hazards, and the assessed structure, respectively. Within each data class, data subclasses are defined to further structure the data for improved backend data storage, sorting, discovery, and unification. Finally, at the lowest level, data fields describe attributes of surveys, hazards, and structures that are stored within these data subclasses.
Efforts have been made to unify attributes across the three hazard types (earthquake, windstorm, coastal) to minimize the number of data fields in the framework. Unification of attributes is achieved at the data class and subclass hierarchy level across hazards in the Unified Assessment data class, whereas unification is generally achieved at the data field level, typically across two hazards rather than all three in the Performance Assessment Survey data class. In the Hazard Survey data class, attributes are unique to each specific hazard, so unification is achieved only within individual hazard survey subclasses. The Performance Assessment Survey data class of the framework encompasses a tiered performance assessment approach with increasing rigor and fidelity levels: Basic Assessment (BA), Load Path Assessment (LPA), and Detailed Component Assessment (DCA), which enable in-depth analysis of infrastructure performance, correlating infrastructure performance to site-specific hazards, or understanding the complex interactions of factors affecting structural performance under multi-hazard scenarios aiding in the development of targeted response, recovery, and mitigation strategies.
The framework is implemented as an open-access mobile application, the StEER Unified App, hosted on Fulcrum, a commercial form-builder and data collection platform developed by Spatial Networks Inc. The app features nested menus that intelligently display relevant sections and data fields based on the hazard type, assessment class, and infrastructure type under investigation, minimizing the burden on field investigators to input irrelevant data. Along with unification of data fields, preliminary mapping rules were developed to map out existing hazard-specific damage rating scales (e.g., wind, surge/flood rainwater ingress) to the European Macroseismic Scale (EMS-98) compatible unified damage scale. This enabled consolidation of global damage ratings into a common data field, facilitating the unification of multiple hazards within a single app. In consolidating damage ratings to a common scale for the app’s data structure, care was taken to retain the overarching level definitions (e.g., slight, moderate, severe damage) while customizing the specific descriptors to reflect hazard-specific damage mechanisms.
To ensure effective use of the app by the StEER Field Assessment Structural Team (FAST) and other users, a comprehensive set of training materials has been developed. These include a detailed handbook, quick reference sheet, and instructional videos. The resources are integrated into the app itself and incorporated into the pre-deployment briefing during active missions. They are also publicly available on the StEER website under the Resources section. Two use cases are presented to demonstrate the application of this Unified Assessment Framework through the StEER Unified App: a supervised pilot during 2022 Hurricane Ian, Florida and an unsupervised deployment for the 2023 Turkey earthquake sequence. Following conclusions are drawn based on the work presented.
• The Unified Assessment Framework provides a foundational step toward harmonizing post-disaster structural reconnaissance across hazards and infrastructure types, resolving long-standing fragmentation in field data collection caused by divergent objectives, protocols, and standards.
• By enabling consistent, high-fidelity data collection across diverse hazard contexts, the framework advances the integration of engineering evidence into resilience-focused public policy, recovery prioritization, and adaptation planning—making it a critical tool for evidence-based decision-making at local, national, and international levels.
• The framework’s implementation through the StEER Unified App open to any member in StEERʻs Fulcrum account, operationalizes scalable, hazard-agnostic assessment protocols, lowering barriers to participation while improving consistency and completeness of structural damage data collection in the field.
• A tiered performance assessment structure (BA, LPA, DCA) enables flexible deployment of engineering rigor, allowing investigators to pick the assessment most appropriate to the research and response constraints. This approach supports both immediate disaster response and development of intermediate-to long-term targeted response, recovery, and mitigation strategies.
• Initial deployments during Hurricane Ian (2022) and the Türkiye earthquake sequence (2023) demonstrate the feasibility of standardized assessments and offer insights into how data collection is influenced by assessor pre-deployment training and assessment tier, especially in more demanding tasks like load path evaluation.
• The initial mapping of damage states consistent with European Macroseismic Scale (EMS-98) provides consistent data structure to enable compounding and cascading hazard assessments and cross-event comparability. However, refinement is still needed—especially in flood and moisture-related damage domains—to balance structural and non-structural impacts more accurately.
• Future validation efforts can focus on benchmarking LPA and DCA field data against detailed engineering analyses and repair estimates, critical for improving the accuracy of field definitions, damage states, and uncertainty quantification.
• To support reproducibility and interoperability, the framework incorporates a version control system and changelog for all forms and backend schemas, preserving compatibility across datasets and enabling structured updates as knowledge and methods evolve.
• Mapping historical StEER event data into the Unified App and accepting community-contributed data will create a dynamic, growing dataset, establishing a long-term testbed for machine learning models, policy simulations, and resilience research.
Data availability statement
All StEER products, resources and policies are available at www.steer.network; App-based structural assessments of the two use cases presented in this study are available on the StEER Fulcrum account at https://web.fulcrumapp.com; Curated datasets and published reports are available at DesignSafe: https://www.designsafe-ci.org/data/browser/public/ (search keyword StEER).
Author contributions
MA: Conceptualization, Formal Analysis, Investigation, Methodology, Resources, Software, Visualization, Writing – original draft, Writing – review and editing. TK-C: Conceptualization, Funding acquisition, Methodology, Project administration, Resources, Validation, Writing – review and editing, Supervision. DR: Data curation, Funding acquisition, Project administration, Software, Validation, Writing – review and editing. KM: Funding acquisition, Project administration, Validation, Writing – review and editing. DP: Funding acquisition, Project administration, Validation, Writing – review and editing. IR: Funding acquisition, Project administration, Validation, Writing – review and editing.
Funding
The author(s) declare that financial support was received for the research and/or publication of this article. The research presented herein is supported by the National Science Foundation under Grant No. CMMI 2103550.
Acknowledgments
Any opinions, findings, and conclusions or recommendations expressed in this article are those of authors and do not necessarily reflect the views of the National Science Foundation.
Conflict of interest
The authors declare that the research was conducted in the absence of any commercial or financial relationships that could be construed as a potential conflict of interest.
Generative AI statement
The author(s) declare that no Generative AI was used in the creation of this manuscript.
Publisher’s note
All claims expressed in this article are solely those of the authors and do not necessarily represent those of their affiliated organizations, or those of the publisher, the editors and the reviewers. Any product that may be evaluated in this article, or claim that may be made by its manufacturer, is not guaranteed or endorsed by the publisher.
Supplementary material
The Supplementary Material for this article can be found online at: https://www.frontiersin.org/articles/10.3389/fbuil.2025.1546616/full#supplementary-material
SUPPLEMENTARY FILE S1 | Unified App: Master Data Sheet.
SUPPLEMENTARY FILE S2 | Unified App: Required Fields.
SUPPLEMENTARY FILE S3 | Unified App: Field Priority Fields.
SUPPLEMENTARY FILE S4 | Unified App: Multi-Hazard Fields.
SUPPLEMENTARY FILE S5 | Quick Reference Sheets: Global Damage Ratings Mapping.
References
AFAD (2023). Pazarcık (Kahramanmaras MW 7.7) and Elbistan (Kahramanmaras MW 7.6) earthquakes preliminary report. Available online at: https://deprem.afad.gov.tr/assets/pdf/Kahramanmaras%20%20Depremleri_%20On%20Degerlendirme%20Raporu.pdf (Accessed November 10, 2023).
Aktaş, Y. D., So, E., Johnson, C., Dönmez, K., Özden, A. T., Vatteri, A. P., et al. (2024). The Türkiye earthquake sequence of February 2023: a longitudinal study report by EEFIT. Earthquake Engineering Field Investigation Team (EEFIT). Institution Struct. Eng. (IStructE), 1–330. doi:10.13140/RG.2.2.15906.40641
Alam, B. (2024). “Multi-hazard earthquake-tsunami structural risk assessment framework,” in Proceedings of the 18th World Conference on Earthquake Engineering (WCEE2024). International Association of Earthquake Engineering (IAEE). Milan, Italy. June 30–July 5, 2024. 1–12.
Alam, M. S., Pinelli, J. P., Do, T., Wolohan, K., Kijewski-Correa, T., Prevatt, D. O., and Roueche, D. (2025). “StEER: Hurricane Helene early access reconnaissance report (EARR),” in StEER - Hurricane Helene (DesignSafe-CI). doi:10.17603/ds2-nqev-2171
Anagnostopoulos, S., and Moretti, M. (2008). Post-earthquake emergency assessment of building damage, safety and usability—Part 1: technical issues. Soil Dyn. Earthq. Eng. 28 (3), 223–232. doi:10.1016/j.soildyn.2006.05.007
ATC 20 (1989). ATC 20, procedure for post-earthquake safety evaluation of buildings. Redwood City, CA: Applied Technology Council.
ATC 20-2 (1995). ATC 20-2, addendum to the ATC 20 post-earthquake safety evaluation of buildings. Redwood City, CA: Applied Technology Council.
ATC 20-3 (1996). ATC 20-3, case studies in rapid post-earthquake safety evaluation of buildings. Redwood City, CA: Applied Technology Council.
ATC 45 (2004). ATC-45: field manual: safety evaluation of buildings after windstorms and floods. Red Wood City, CA: Applied Technology Council.
Baggio, C., Bernardini, A., Colozza, R., Corazza, L., Della Bella, M., Di Pasquale, G., et al. (2007). Field manual for post-earthquake damage and safety assessment and short-term countermeasures (AeDES). EUR: European Commission—Joint Research Centre—Institute for the Protection and Security of the Citizen, 22868.
Barbosa, A. R., Fahnestock, L. A., Fick, D. R., Gautam, D., Soti, R., Wood, R., et al. (2017). Performance of medium-to-high rise reinforced concrete frame buildings with masonry infill in the 2015 Gorkha, Nepal, earthquake. Earthq. Spectra 33 (1_Suppl. l), 197–218. doi:10.1193/051017eqs087m
BCH (2019). British Columbia post-disaster building assessment framework and recommendations. BC: BC Housing, Justice Institute of British Columbia. Available online at: https://www.bchousing.org/publications/PDBA-Framework-Recommendations.pdf
Brando, G., Rapone, D., Spacone, E., O'Banion, M. S., Olsen, M. J., Barbosa, A. R., et al. (2017). Damage reconnaissance of unreinforced masonry bearing wall buildings after the 2015 Gorkha, Nepal, earthquake. Earthq. spectra 33 (1_Suppl. l), 243–273. doi:10.1193/010817eqs009m
Charleson, A., Goded, T., Wald, D., Lin, S., Beattie, G., Ingham, J., et al. (2024). “Development of a Macroseismic scale for new Zealandd: Aligning with EMS-98 and the developing of IMS,” in Proceedings of the 18th World Conference on Earthquake Engineering (WCEE2024). International Association of Earthquake Engineering (IAEE). Milan, Italy. June 30–July 5, 2024. 1–12.
Chock, G., Robertson, I., Kriebel, D., Francis, M., and Nistor, I. (2013). Tohoku, Japan, earthquake and tsunami of 2011: performance of structures under tsunami loads. Reston, VA: American Society of Civil Engineers.
Cortes, M., Arora, P., Ceferino, L., Ibrahim, H., Istrati, D., Reed, D., et al. (2022). “StEER: hurricane ian preliminary virtual reconnaissance report (PVRR),” in StEER - Hurricane Ian. DesignSafe-CI. doi:10.17603/ds2-kc9k-s242
Cox, D., Arikawa, T., Barbosa, A., Guannel, G., Inazu, D., Kennedy, A., et al. (2019). Hurricanes irma and Maria post-event survey in US Virgin Islands. Coast. Eng. J. 61 (2), 121–134. doi:10.1080/21664250.2018.1558920
CUREE (2010). General guidelines for the assessment and repair of earthquake damage in residential wood frame buildings. CUREE Publication No. EDA-02. Richmond, CA: Consortium of Universities for Research in Earthquake Engineering CUREE.
Delatte, N. J. (2008). Beyond failure: forensic case studies for civil engineers. Reston, VA: ASCE. doi:10.1061/9780784409732
Demir, A., Günay, S., Marinković, M., Dilsiz, A., Bektaş, N., Khalil, Z., et al. (2024). 2022 Düzce, Türkiye earthquake: advances in the past 2 decades, lessons learned, and future projections. Bull. Earthq. Eng. 22, 5835–5862. doi:10.1007/s10518-024-01984-z
Dilsiz, A., Gunay, S., Mosalam, K., Prevatt, D., Gerczak, E., Miranda, E., et al. (2023). “StEER: 2023 Mw 7.8 Kahramanmaras, Türkiye earthquake sequence preliminary virtual reconnaissance report (PVRR), in StEER- February 6, 2023, Kahramanmaras, Türkiye, Mw 7.8 Earthquake. DesignSafe-CI. doi:10.17603/ds2-7ry2-gv66
EEFIT (2005). The Indian ocean Tsunami of 26th December 2004. Earthquake engineering field investigation team (EEFIT) report. London: Thomas Telford.
EEFIT (2011). “The MW 9.0 Tōhoku earthquake and Tsunami of 11th March 2011,” in Earthquake engineering field investigation team (EEFIT) report. London: Thomas Telford.
EERI (1971). Preliminary engineering findings from Los Angeles earthquake of February 9, 1971. Oakland, CA: Earthquake Engineering Research Institute.
EERI (1996). Post-earthquake investigation field guide. Oakland, CA: Earthquake Engineering Research Institute EERILearning from Earthquake Program, Revised in 2000. 2004.
EERI (2010). The MW 8.8 Chile earthquake of 27 February 2010, EERI special earthquake report, Oakland, CA: Earthquake Engineering Research Institute EERI Learning from Earthquake Program, 20. June 2010 Newsletter.
Egnew, A. C., Roueche, D. B., and Prevatt, D. O. (2018). Linking building attributes and Tornado vulnerability using a logistic regression model. Nat. Hazards Rev. 19 (4), 04018017. doi:10.1061/(asce)nh.1527-6996.0000305
Elwood, K. J. (2013). Performance of concrete buildings in the 22 February 2011 Christchurch earthquake and implications for Canadian codes. Can. J. Civ. Eng. 40 (3), 759–776. doi:10.1139/cjce-2011-0564
FEMA (2020). FEMA preliminary damage assessment guide. Washington, DC: Federal Emergency Management Agency FEMA. Department of Homeland Security, Department of Homeland Security.
FEMA (2021). Seismic performance assessment of buildings volume 8 – methodology for assessment of functional recovery time (ATC 138-3). Washington, DC: Federal Emergency Management Agency FEMA. Department of Homeland Security, Department of Homeland Security.
FEMA (2022a). HAZUS hurricane model technical manual: HAZUS 5.1. Washington, DC: Federal Emergency Management Agency FEMA, Department of Homeland Security, Department of Homeland Security.
FEMA (2022b). HAZUS tsunami model technical manual: HAZUS 5.1. Washington, DC: Federal Emergency Management Agency FEMA. Department of Homeland Security, Department of Homeland Security.
FEMA (2023). Hurricane Ian in Florida. Building performance observations, recommendations, and technical guidance. mitigation assessment team report-FEMA P-2342. Washington, DC: Department of Homeland Security.
FEMA (2024). HAZUS earthquake model technical manual: HAZUS 6.1. Washington, DC: Federal Emergency Management Agency FEMA. Department of Homeland Security, Department of Homeland Security.
FEMA 306 (1998). Evaluation of Earthquake damaged concrete and masonry wall buildings, basic procedure manual. Washington, DC: Federal Emergency Management Agency (FEMA). Department of Homeland Security, Department of Homeland Security.
FEMA 310 (1998). Handbook for the seismic evaluation of buildings. Washington, DC: Federal Emergency Management Agency FEMA. Department of Homeland Security, Department of Homeland Security.
FEMA 352 (2000). Recommended post-earthquake evaluation and repair criteria for Welded steel moment-frame buildings. Washington, DC: Federal Emergency Management Agency (FEMA). Department of Homeland Security.
Fikri, R., Dizhur, D., Walsh, K., and Ingham, J. (2019). Seismic performance of reinforced concrete frame with masonry Infill buildings in the 2010/2011 Canterbury, New Zealand earthquakes. Bull. Earthq. Eng. 17, 737–757. doi:10.1007/s10518-018-0476-8
Franco, G., Green, R., Khazai, B., Smyth, A., and Deodatis, G. (2010). Field damage survey of New Orleans Homes in the aftermath of Hurricane Katrina. Nat. Hazards Rev. 11 (1), 7–18. doi:10.1061/(asce)1527-6988(2010)11:1(7)
Friedland, C. J. (2009). Residential building damage from hurricane storm surge: proposed methodologies to describe, assess and model building damage. PhD Thesis. Louisiana, USA: Louisiana State University.
Friedland, C. J., and Levitan, M. L. (2011). “Development of a loss-consistent wind and flood damage scale for residential buildings,” in In the Proceedings of the Solution to Coastal Disasters Conference, Anchorage, Alaska, June 25–29, 2011, (Reston, VA: American Society of Civil Engineers), 666–677.
G. Grünthal (1998). “European Macroseismic scale 1998 EMS-98: Luxembourg, v. 15,” (Cahiers du Centre Européen de Géodynamique et de Séismologie), 99. Available online at: https://www.franceseisme.fr/EMS98_Original_english.pdf
Hatzikyriakou, A., Lin, N., Gong, J., Xian, S., Hu, X., and Kennedy, A. (2016). Component-based vulnerability analysis for residential structures subjected to storm surge impact from Hurricane Sandy. Nat. Hazards Rev. 17 (1), 05015005. doi:10.1061/(asce)nh.1527-6996.0000205
Hortacsu, A., Porter, K. A., Osteraas, J., Harris, S. K., Goded, T., Lin, S., et al. (2024). “Development of a Macroseismic intensity scale for the United States: Aligning with EMS-98 and developing IMS,” in Proceedings of the 18th World Conference on Earthquake Engineering (WCEE2024). International Association of Earthquake Engineering (IAEE). Milan, Italy. June 30–July 5, 2024. 1–12.
Hughes, R., and Lubkowski, Z. A. (1999). The survey of earthquake damaged non-engineered structures. A field guide by EEFIT. London: Earthquake Engineering Field Investigation Team. Institution of Structural Engineers.
IBC (2023). Devastating Earthquakein southern Türkiye and north Syria. International Blue Crescent Relief and development foundation (IBC). Situation Report 30. Available online at: https://reliefweb.int/report/turkiye/devastating-earthquakes-southern-turkiye-and-northern-syria-december-15th-2023-situation-report-30-entr (Accessed November 7, 2024).
JBDPA (1991). Guideline for post earthquake damage evaluation and rehabilitation. The Japan Building Disaster Prevention Association JBDPA, Revised in 2001 and 2015. (in Japanese).
Kaminosono, T., Kumazawa, F., and Nakano, Y. (2002). Quick inspection manual for damaged reinforced concrete buildings due to earthquake. Japan: National Institute of Land and Infrastructure Management, Ministry of Land, Infrastructure, and Transport.
Kennedy, A., Rogers, S., Sallenger, A., Gravois, U., Zachry, B., Dosa, M., et al. (2011). Building destruction from waves and surge on the Bolivar Peninsula during Hurricane Ike. J. Waterw. Port, Coast. Ocean Eng. 137 (3), 132–141. doi:10.1061/(asce)ww.1943-5460.0000061
Kijewski-Correa, T., Canales, E., Hamburger, R., Lochhead, M., Mbabazi, A., and Presuma, L. (2024). A hybrid model for post-earthquake performance assessments in challenging contexts. Bull. Earthq. Eng, 1–24. doi:10.1007/s10518-024-01927-8
Kijewski-Correa, T., Roueche, D., Kennedy, A., Allen, D., Marshall, J., Kaihatu, J., et al. (2022). Impacts of hurricane Dorian on the Bahamas: field observations of hazard intensity and performance of the built environment. Coast. Eng. J. 64 (1), 3–23. doi:10.1080/21664250.2021.1958613
Kijewski-Correa, T., Roueche, D. B., Mosalam, K. M., Prevatt, D. O., and Robertson, I. (2021). StEER: a community-centered approach to assessing the performance of the built environment after natural hazard events. Front. Built Environ. 7, 636197. doi:10.3389/fbuil.2021.636197
Kijewski-Correa, T. L., Kennedy, A. B., Taflanidis, A. A., and Prevatt, D. O. (2018). Field reconnaissance and overview of the impact of Hurricane Matthew on Haiti’s Tiburon Peninsula. Nat. Hazards 94, 627–653. doi:10.1007/s11069-018-3410-0
Kopp, G. A., and Fewless, Y. (2014). “Basic hurricane wind principles,” in Engineering investigations of hurricane damage: wind versus water (Reston, VA: American Society of Civil Engineer ASCE), 1–21.
Kyprioti, A., Yuzbasi, J., Dang, H., Jana, A., Kameshwar, S., Diekmann, A., et al. (2024). “StEER: Hurricane Helene annotated media repository,” in StEER - hurricane Helene (DesignSafe-CI). doi:10.17603/ds2-mxeh-7712
LaFave, J. M., Gao, Z., Holder, D. E., Kuo, M. J., and Fahnestock, L. A. (2014). Commercial and residential building performance during the May 20, 2013, Tornado in Moore, Oklahoma. J. Perform. Constr. Facil. 30 (2), 04014210. doi:10.1061/(asce)cf.1943-5509.0000722
Loos, S., Levitt, J., Tomozawa, K., Baker, J., and Lallemant, D. (2022). Efficacy of damage data integration: a comparative analysis of four major earthquakes. Nat. Hazards Rev. 23 (4), 1–18. doi:10.1061/(asce)nh.1527-6996.0000581
Maeda, M., and Matsukawa, K. (2019). An overview of post-earthquake damage and residual capacity evaluation for reinforced concrete buildings in Japan. Proc. 2019 Pac. Conf. Earthq. Eng. Annu. NZSEE Conf. COMPDYN Proc. 1, 930–943. doi:10.7712/120119.6969.19228
Marshall, J. D., Roueche, D. B., Berman, J. W., Roberts, J., and Blue, C. (2022). “Forensic investigations into the performance of large-volume, low-rise buildings affected by Hurricane Michael,” in Proceedings of the Ninth Congress on Forensic Engineering, Denver, Colorado, November 4–7, 2022. 362–372. doi:10.1061/9780784484548.038
NHC (2022). Hurricane Ian discussion number 25. National hurricane Center Forecast Discussions. Available online at: https://www.nhc.noaa.gov/archive/2022/al09/al092022.discus.025.shtml? (Accessed April 15, 2023).
NRC (2007). Tools and methods for estimating populations at risk from natural disasters and complex humanitarian crises. Washington, DC: National Research Council, The National Academies Press.
NZMBIE (2014a). Field guide: rapid post disaster building usability assessment - flooding. Wellington: New Zealand Ministry of Business, Innovation and Employment. Available online at: https://www.building.govt.nz/assets/Uploads/managing-buildings/post-emergency-building-assessment/flooding-field-guide-1-1.pdf
NZMBIE (2014b). Field guide: rapid post disaster building usability assessment-earthquakes. Wellington: New Zealand Ministry of Business, Innovation and Employment. Available online at: https://www.building.govt.nz/assets/Uploads/managing-buildings/post-emergency-building-assessment/earthquake-field-guide-1-1.pdf
OCHA (2023). Earthquakes: North-west Syria. UN Office of the Coordination of Humanitarian Affairs. Situation Report No. 1. As of 7 March 2023. Available online at: https://reliefweb.int/report/syrian-arab-republic/earthquakes-north-west-syria-situation-report-no-1-7-march-2023.
Peek, L., Tobin, J., Adams, R. M., Wu, H., and Mathews, M. C. (2020). A framework for Convergence research in the hazards and disaster field: the natural hazards engineering research infrastructure CONVERGE facility. Front. Built Environ. 6, 110. doi:10.3389/fbuil.2020.00110
Pilkington, S., Roueche, D., Mosalam, K., Gutierrez Soto, M., Alam, M., et al. (2021). “StEER: 10 December 2021 Midwest Tornado outbreak joint preliminary virtual reconnaissance report and early access reconnaissance report (PVRR-EARR),” in StEER - 10 December 2021 Midwest Tornado Outbreak (DesignSafe-CI). doi:10.17603/ds2-2b2k-ws96
Prevatt, D., Agdas, D., Faraone, D., Lafontaine, O., Micali, J., Nofal, O., et al. (2022). “StEER: Hurricane ian early access reconnaissance report (EARR),” in StEER - hurricane ian. DesignSafe-CI.
Prevatt, D. O., Coulbourne, W., Graettinger, A. J., Pei, S., Gupta, R., and Grau, D. (2012a). Joplin, Missouri, Tornado of may 22, 2011: structural damage survey and case for Tornado-resilient building codes. Reston, VA: American Society of Civil Engineers ASCE.
Prevatt, D. O., van de Lindt, J. W., Back, E. W., Graettinger, A. J., Pei, S., Coulbourne, W., et al. (2012b). Making the case for improved structural design: Tornado Outbreaks of 2011. Leadersh. Manag. Eng. 12 (4), 254–270. doi:10.1061/(asce)lm.1943-5630.0000192
Robertson, I., Chock, G., and Morla, J. (2012). Structural analysis of selected failures caused by the 27 February 2010 Chile tsunami. Earthq. Spectra 28 (1_Suppl. 1), 215–243. doi:10.1193/1.4000035
Robertson, I. N., Riggs, H. R., Yim, S. C., and Young, Y. L. (2007). Lessons from hurricane Katrina storm surge on bridges and buildings. J. Waterw. Port, Coast. Ocean Eng. 133 (6), 463–483. doi:10.1061/(asce)0733-950x(2007)133:6(463)
Roueche, D. B., Chen, G., Soto, M. G., Kameshwar, S., Safiey, A., Do, T., et al. (2024). Performance of Hurricane-resistant housing during the 2022 Arabi, Louisiana, Tornado. J. Struct. Eng. 150 (5), 04024029. doi:10.1061/JSENDH.STENG-12986
Roueche, D. B., Nakayama, J. O., Kijewski-Correa, T., and Prevatt, D. O. (2023). A unified multi-event windstorm performance testbed for single-family residential buildings. Nat. Hazards Rev. 25 (2), 04023060. doi:10.1061/nhrefo.nheng-1796
Roueche, D. B., and Prevatt, D. O. (2013). Residential damage patterns following the 2011 Tuscaloosa, AL and Joplin, MO Tornadoes. J. Disaster Res. 8 (6), 1061–1067. doi:10.20965/jdr.2013.p1061
Saatcioglu, M., Ghobarah, A., and Nistor, I. (2005). Effects of the December 26, 2004, Sumatra earthquake and Tsunami on physical infrastructure. ISET J. Earthq. Technol. 42 (4), 79–94. doi:10.63898/ODYI3392
Stolle, J., Krautwald, C., Robertson, I., Achiari, H., Mikami, T., Nakamura, R., et al. (2020). Engineering lessons from the 28 September 2018 Indonesian Tsunami: debris loading. Can. J. Civ. Eng. 47 (1), 1–12. doi:10.1139/cjce-2019-0049
Suppasri, A., Shuto, N., Imamura, F., Koshimura, S., Mas, E., and Yalciner, A. C. (2013). Lessons learned from the 2011 Great East Japan tSunami: performance of Tsunami countermeasures, coastal buildings, and Tsunami evacuation in Japan. Pure Appl. Geophys. 170, 993–1018. doi:10.1007/s00024-012-0511-7
Tomiczek, T., Kennedy, A., Zhang, Y., Owensby, M., Hope, M. E., Lin, N., et al. (2017). Hurricane damage classification methodology and fragility functions derived from Hurricane Sandy’s effects in coastal New Jersey. J. Waterw. Port, Coast. Ocean Eng. 143 (5), 04017027. doi:10.1061/(asce)ww.1943-5460.0000409
Tomiczek, T., O’Donnell, K., Furman, K., Webbmartin, B., and Scyphers, S. (2020). Rapid damage assessments of Shorelines and structures in the Florida keys after Hurricane Irma. Nat. Hazards Rev. 21 (1), 05019006. doi:10.1061/(asce)nh.1527-6996.0000349
Uroš, M., Šavor Novak, M., Atalić, J., Sigmund, Z., Baniček, M., Demšić, M., et al. (2020). Post-earthquake damage assessment of buildings–procedure for conducting building inspections. Građevinar 72 (12), 1089–1115. doi:10.14256/JCE.2969.2020
USACE (2006). Post-event damage survey (PEDS) data requirement white paper, Shore protection assessment. Vicksburg, Mississippi: U.S. Army Corps of Engineers.
USGS (2023a). M 7.5 - Elbistan earthquake, Kahramanmaras earthquake sequence. United States Geological Survey. Available online at: https://earthquake.usgs.gov/earthquakes/eventpage/us6000jlqa/executive (Accessed Auguest 15, 2024).
USGS (2023b). M 7.8 - Pazarcik earthquake, Kahramanmaras earthquake sequence. United States Geological Survey. Available online at: https://earthquake.usgs.gov/earthquakes/eventpage/us6000jllz/executive (Accessed Auguest 15, 2024).
Vickery, P. J., Skerlj, P. F., Lin, J., Twisdale Jr, L. A., Young, M. A., and Lavelle, F. M. (2006). HAZUS-MH hurricane model methodology. II: damage and loss estimation. Nat. Hazards Rev. 7 (2), 94–103. doi:10.1061/(asce)1527-6988(2006)7:2(94)
Wald, D., Goded, T., Charleson, A., Grünthal, G., Lin, S., Musson, R., et al. (2024). “Developing and implementing an international Macroseismic scale (IMS) for earthquake engineering, earthquake science, and rapid damage assessment,” in Proceedings of the 18th world Conference on earthquake engineering. Milan, Italy.
Wartman, J., Berman, J. W., Bostrom, A., Miles, S., Olsen, M., Gurley, K., et al. (2020). Research needs, challenges, and strategic Approaches for natural hazards and disaster reconnaissance. Front. Built Environ. 6. doi:10.3389/fbuil.2020.573068
Wilkinson, S., Grant, D., Williams, E., Paganoni, S., Fraser, S., Boon, D., et al. (2013). Observations and implications of damage from the magnitude Mw 6.3 Christchurch, New Zealand earthquake of 22 February 2011. Bull. Earthq. Eng. 11, 107–140. doi:10.1007/s10518-012-9384-5
Keywords: damage rating, earthquakes, hurricanes, reconnaissance, StEER, structural assessment, Tsunamis, Tornadoes
Citation: Alam MS, Kijewski-Correa T, Roueche DB, Mosalam KM, Prevatt DO and Robertson I (2025) A unified framework for post-disaster hazard and structural assessment data collection across hazards and infrastructure typologies. Front. Built Environ. 11:1546616. doi: 10.3389/fbuil.2025.1546616
Received: 17 December 2024; Accepted: 14 May 2025;
Published: 21 July 2025.
Edited by:
Rebecca Napolitano, The Pennsylvania State University (PSU), United StatesReviewed by:
Ram Krishna Mazumder, Arcadis, U.S., Inc., United StatesXavier Romão, University of Porto, Portugal
Copyright © 2025 Alam, Kijewski-Correa, Roueche, Mosalam, Prevatt and Robertson. This is an open-access article distributed under the terms of the Creative Commons Attribution License (CC BY). The use, distribution or reproduction in other forums is permitted, provided the original author(s) and the copyright owner(s) are credited and that the original publication in this journal is cited, in accordance with accepted academic practice. No use, distribution or reproduction is permitted which does not comply with these terms.
*Correspondence: Mohammad S. Alam, bW9oYW1tYWQuYWxhbUBoYXdhaWkuZWR1