 Sherif Mohamed Sabry Elattar
 Ibrahim Dosoki Abdullah
 Amr Abbas Saleh Gebriel
- 1Faculty of Engineering, Fayoum University, Giza, Egypt
- 2Architecture Department, Faculty of Engineering, Fayoum University, Giza, Egypt
This study evaluates indoor air quality in university lecture halls, focusing on the impact of interior finishes on air pollutant levels. Key pollutants monitored included Particulate Matter (PM2.5 and PM10), Carbon Dioxide (CO2), Sulphur Dioxide (SO2), Nitrogen Dioxide (NO2), formaldehyde (HCHO), and total volatile organic compounds (TVOCs), with sources identified as industrial emissions and traffic. Measurements were conducted in three distinct indoor environments at an Egyptian university during July 2024. Results showed that PM2.5 and PM10 concentrations remained within the World Health Organization (WHO) guidelines, whereas CO2 levels varied notably, with Lecture Hall 1 recording 713 ppm and Lecture Hall 2 reaching 1,071 ppm, indicating inadequate ventilation in the latter. Notably, NO2 and HCHO concentrations exceeded WHO recommended limits, with Lecture Hall 1 measuring 160 μg/m3 for NO2 and formaldehyde levels ranging between 430 μg/m3 and 1,380 μg/m3 across the halls. Based on these findings, we recommend that indoor air quality assessments follow the evaluation framework outlined in this study. Furthermore, we advocate for the enhancement of educational buildings through the implementation of design codes aimed at preserving and improving indoor air quality in lecture halls. Additionally, the study underscores the importance of raising awareness among students and faculty to foster healthier educational environments.
1 Introduction
Industrial and technological advancements have significantly contributed to environmental pollution, leading to imbalances within ecosystems. One major consequence is the decline in indoor air quality (IAQ), a global concern that negatively affects human health and comfort—particularly within educational settings. Research indicates that poor IAQ is associated with various non-specific symptoms, including coughing, headaches, eye irritation, fatigue, and exhaustion. These symptoms can impair students’ learning experiences and overall wellbeing (Mata et al., 2022; Sadrizadeh et al., 2022). Consequently, this may result in reduced academic performance, increased absenteeism, and diminished satisfaction within educational institutions (Bluyssen et al., 2018; Zhang et al., 2019).
In Egypt, the annual concentration of Particulate Matter with a diameter of 2.5 μm (PM2.5) is approximately 70 μg/m3, both indoors and outdoors environments—over seven times higher than the limit recommended by the World Health Organization (WHO) (Larsen, 2019). This alarming figure highlights the urgent need to address IAQ, particularly in learning environments where students spend extended periods indoors.
This study aims to examine the relationship between IAQ and environmental factors in Egyptian universities, with a focus on aligning with sustainability and public health goals. By developing a comprehensive methodology to improve indoor air quality in educational spaces, this research seeks to enhance both student health and the overall quality of education.
1.1 The research problem
The research problem stems from the ongoing deterioration of IAQ within university educational facilities in Egypt, which raises significant concerns regarding environmental pollution and its detrimental effects on public health.
According to the WHO, indoor air pollution represents one of the most critical health risks worldwide, contributing to approximately seven million deaths annually due to exposure to fine particulate matter (WHO, 2018). Multiple studies have revealed that indoor pollutant concentrations can be two to five times higher than outdoor levels—and sometimes up to 100 times higher. Given that individuals spend nearly 90% of their time indoors, IAQ profoundly influences overall health outcomes. Despite this, there is a noticeable scarcity of localized research addressing current IAQ conditions in Egyptian higher education institutions, limiting the contextual understanding for both national and international audiences (Mannan and Al-Ghamdi, 2021).
Assessing IAQ in university lecture halls is particularly important, as students and faculty typically spend four to 8 hours per day in these environments (Goyal and Khare, 2009); where optimal air quality is essential for maintaining concentration and cognitive performance (Singh et al., 2019). Existing literature emphasizes the strong correlation between IAQ exposure and adverse health outcomes, underscoring the critical need to expand local investigations and enrich the current literature to address this pressing issue effectively.
1.2 Objective of the study
The study aims to assess indoor air quality (IAQ) in university settings by monitoring and identifying pollutant types and concentrations. Specifically, it seeks to determine pollution levels in three lecture halls through systematic measurement and analytical evaluation. Based on the findings, a coding framework is developed to classify air quality levels, which can be integrated into design strategies for lecture halls. These classifications are framed within applicable indoor air quality standards to guide the implementation of effective environmental controls in lecture hall design.
1.3 The primary air pollutants
The major primary air pollutants examined in this study include particulate matter PM2.5 and PM10, carbon dioxide (CO2), nitrogen Dioxide (NO2), sulphur dioxide (SO2) and total Volatile organic compounds (TVOCs) (Gul and Das, 2023), Table 1 presents both global and local indoor air quality guidelines (Fikry and Elsayed, 2021; EEAA, 2023).
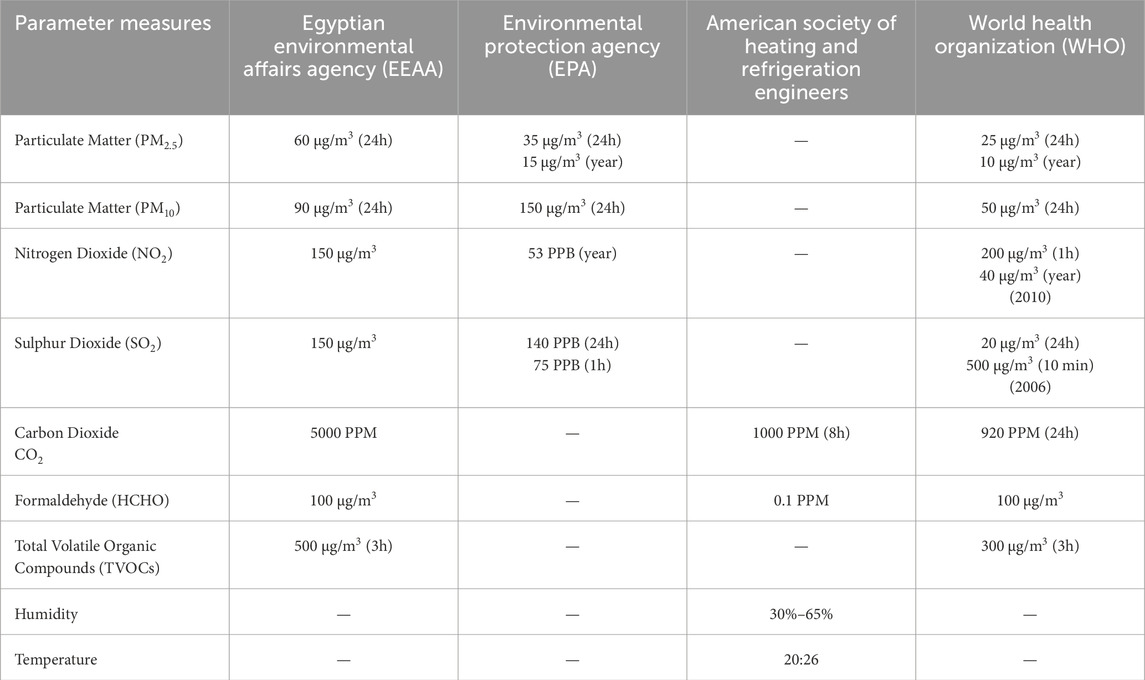
Table 1. Global and Local Standards for Indoor Air Quality based on WHO, EPA, and EEAA guidelines. (Source: authors).
1.4 The indoor air quality index (IAQI)
The Indoor Air Quality Index (IAQI) is used internationally to facilitate public understanding of air quality conditions. It is based on guidelines from organizations such as the World Health Organization (WHO) and the U.S. Environmental Protection Agency (EPA) and represents pollution levels using a color-coded scale (e.g., green for clean air, red for hazardous conditions). The IAQI assigns numerical values from 0 to 500, with lower values indicating better air quality. To enhance interpretability, this study integrates percentage-based classification schemes that reflect the relative concentration of each pollutant, helping to contextualize IAQ more effectively. Table 2 outlines the parameters and thresholds associated with the IAQI system (Saad et al., 2017).
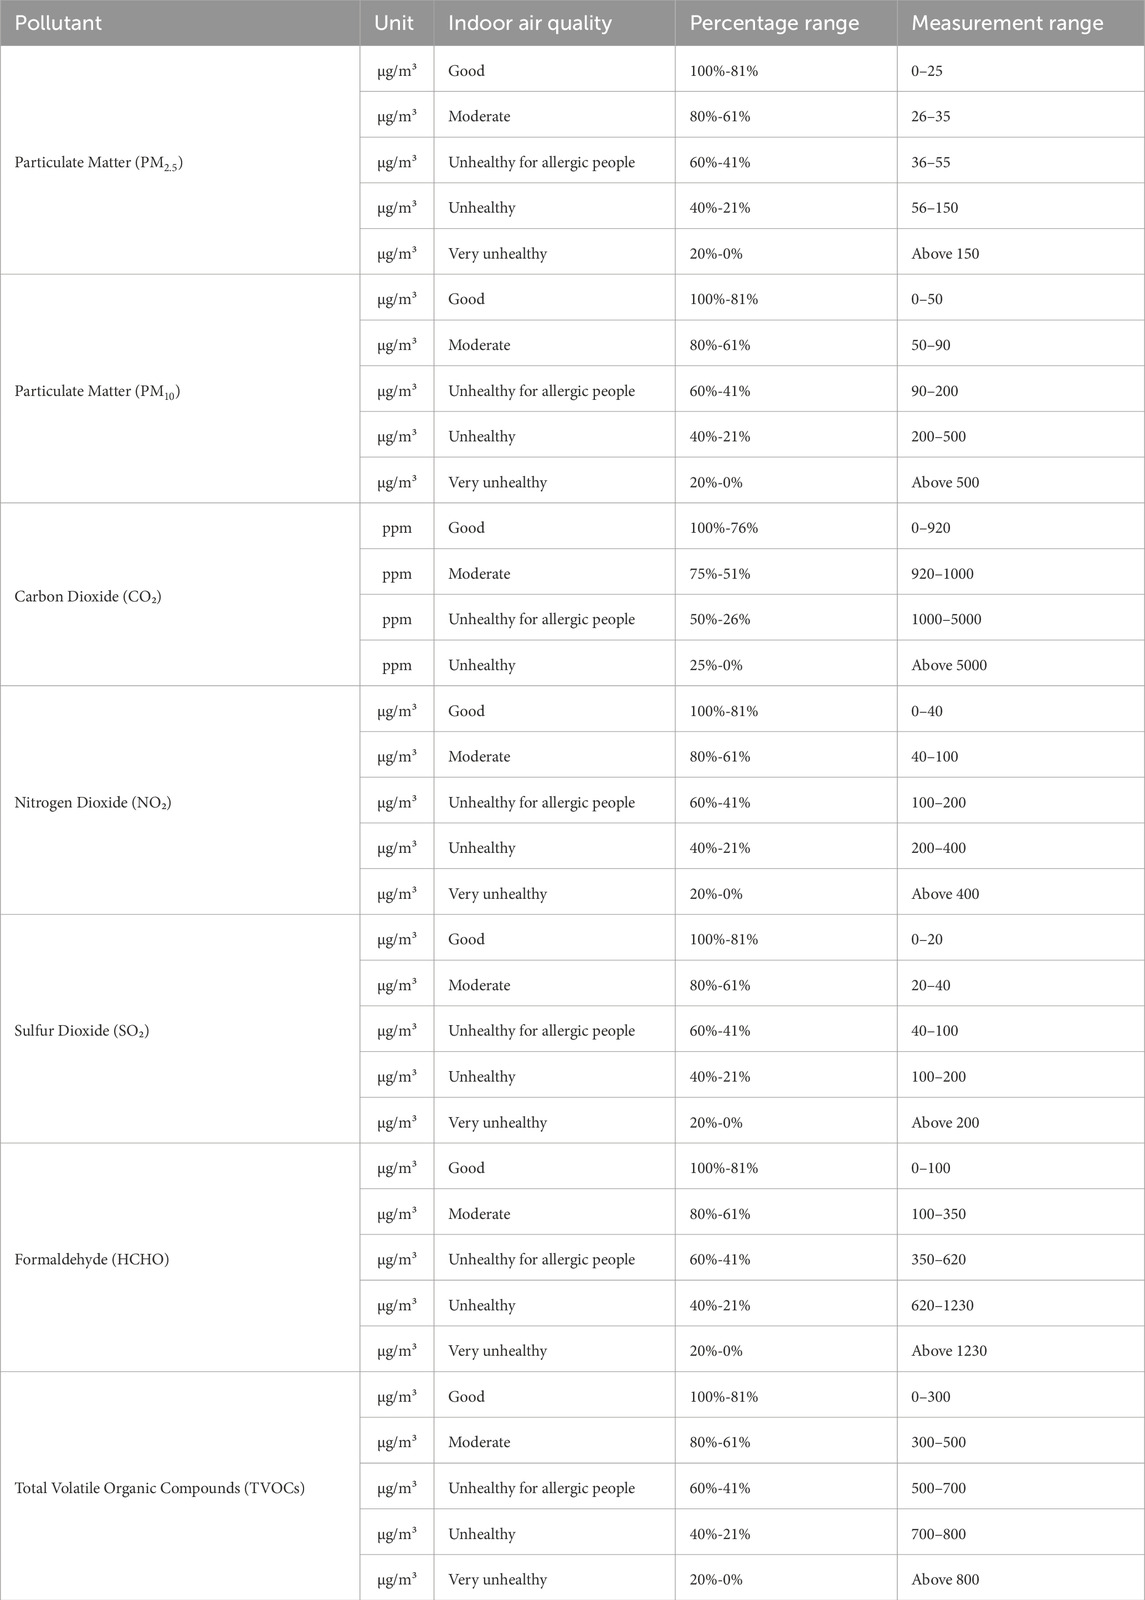
Table 2. Parameters and thresholds of the Indoor Air Quality Index (IAQI) used to categorize pollutants (Saad et al., 2017).
2 Methodology
2.1 Materials and methods
The case study building was selected on the campus of Al-Ahram Canadian University (ACU), located in the sixth of October City’s industrial zone in Egypt. The measures were conducted in July 2024 - one of the hottest and most polluted months of the year (Ali and Ibrahim, 2023). This period also coincides with the presence of students attending summer courses. To eliminate confounding effects from human activity, such as body emissions or clothing, the study focused exclusively on environmental parameters. Indoor temperatures, regulated by central air conditioning systems, ranged between 22°C and 25°C. Figure 1 illustrates the layout of the university and the case study buildings. The surrounding area experiences elevated pollution due to proximity to factories and heavy traffic, which may adversely impact students' health.
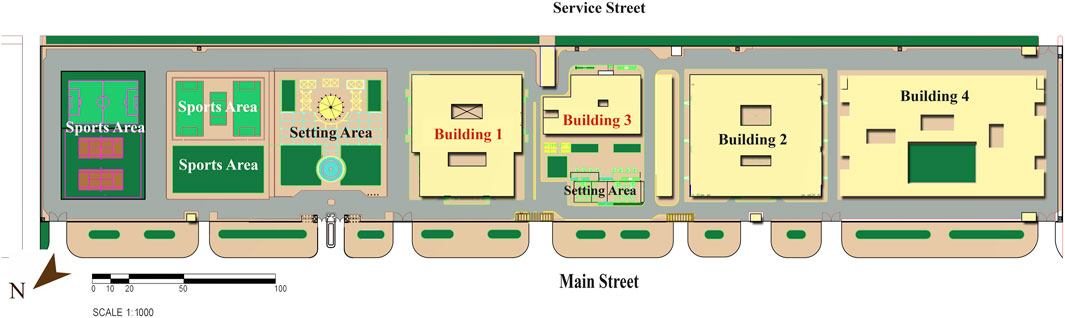
Figure 1. Layout of Al-Ahram Canadian University, Egypt, showing the case study buildings (Buildings 1 and 3). (Source: Authors).
This study focused on three distinct lecture halls within the university, each characterized by different interior finishes and architectural features. These halls collectively serve approximately 10,000 students and staff daily. Both objective (instrumental) and subjective (environmental) measurement methods were applied during the summer season, where ambient temperatures averaged 37°C, contributing to increased atmospheric pollutant levels. Figure 2 provides layout plans and interior photographs of the lecture halls.
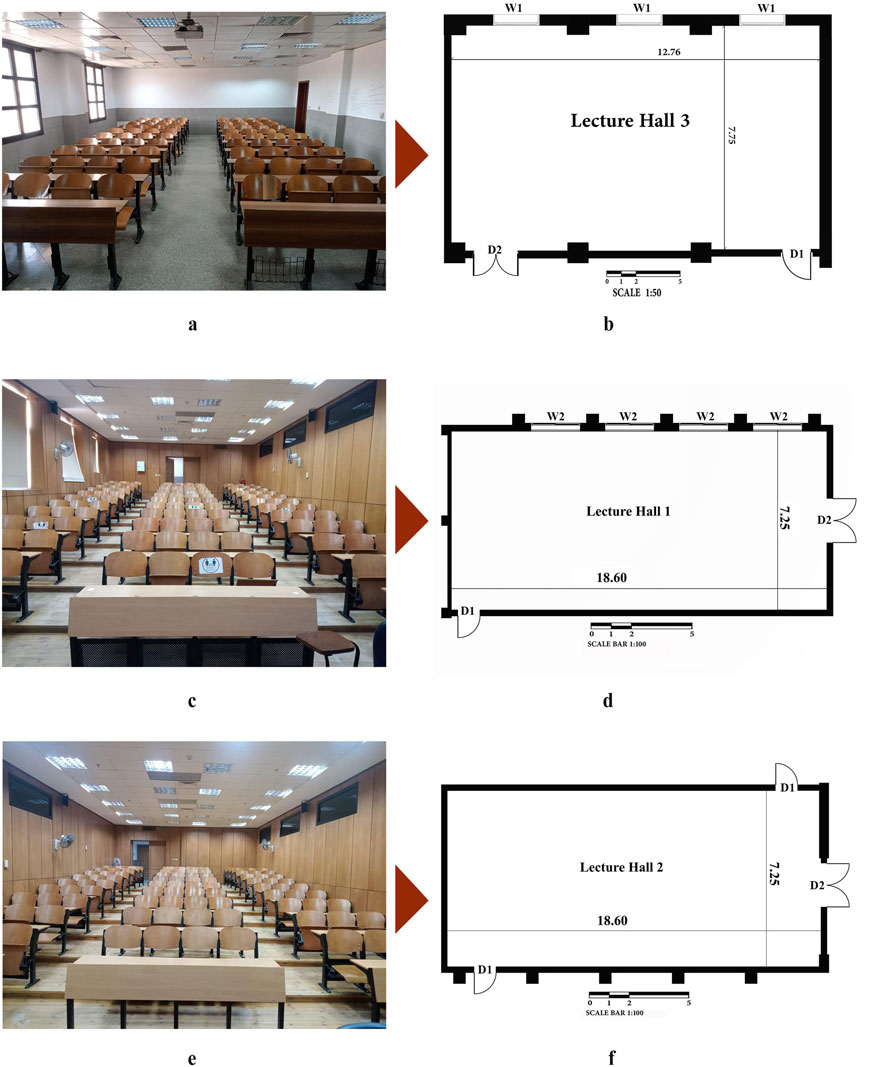
Figure 2. Floor plans and photographs of the selected lecture halls used in the case study. (Source: Authors). (a) Photogaraph of Lecture Hall 3 SCALE 150. (b) Plan of Lecture Hall 3 (Building 1). (c) Photogaraph of Lecture Hall 1. (d) Plan of Lecture Hall 1 (Building 3). (e) Photogaraph of Lecture Hall 2. (f) Plan of Lecture Hall 2 (Building 3).
2.1.1 Lecture hall descriptions
• Building 1, covering a total area of 3,400 m2 over four identical floors, includes Lecture Hall 3, used as the third study sample. Lecture Hall 3 which accommodates 80 students, spans 98 m2, and has a volume of 281 m3. The finishes include granite tile flooring, painted and porcelain walls, gypsum tile ceilings (60 × 60 cm), three aluminum windows on the western side, wooden doors with varnish, and benches made of plywood layers supported by an iron structure (Figure 2a).
• Building 3, with a basement and four similar floors, covers a total area of 1,500 m2. It houses Lecture Halls 1 and 2, used as the first and second study samples, respectively. Each accommodates 120 students, with an area of 135 m2 and a volume of 405 m3. The finishes include varnished parquet flooring, MDF wood cladding on the walls, gypsum ceilings (60 × 60 cm), and plywood benches supported by iron frames. Lecture Hall 1 includes windows, while Lecture Hall 2 does not, which influences ventilation patterns (Figure 2b).
2.2 Methodological considerations and limitations
In this study, several potential confounding factors were deliberately minimized to maintain measurement consistency and focus on the impact of interior finishes on indoor air quality (IAQ). These factors include.
2.2.1 Occupancy variations
Human presence and activities can significantly influence IAQ, particularly CO2 and TVOC levels, due to respiration, movement, clothing and the use of personal items (Niza et al., 2024). To control for this, measurements were conducted during periods of minimal or stable occupancy. This strategy was intentionally adopted to evaluate the space under controlled conditions prior to student use, isolating the influence of interior finishes on pollutant levels. To identify design-related sources and mitigation strategies before the halls are used by students. While this approach may not fully reflect real-life conditions during peak academic hours, it aligns with the study’s objective of preparing the environment for optimal student use.
2.2.2 HVAC cycles
Heating, ventilation, and air conditioning (HVAC) systems play a crucial role in regulating indoor pollutant levels. Fluctuations caused by HVAC cycling (e.g., on/off patterns or inconsistent temperature settings) may introduce variability in air quality (Bluyssen et al., 2018; Sadrizadeh et al., 2022). Although HVAC settings were kept constant during data collection, this does not replicate actual lecture hall conditions where usage varies throughout the day.
2.2.3 Outdoor environmental influences and weather conditions
Given the university’s proximity to industrial zones and major traffic routes, outdoor pollutants and weather conditions (e.g., temperature, humidity, wind) can infiltrate indoor spaces and influence IAQ (Mata et al., 2022). Measurements were taken during July to reduce variability; however, this approach limits the representation of seasonal and daily environmental changes.
2.2.4 Justification for control or exclusion
These factors were controlled or excluded to isolate the effects of interior finishes and reduce measurement variability. While this strengthens internal validity, it also limits the generalizability of the findings to real-world scenarios where such variables are dynamic and often interact.
2.3 Instruments and methods
Measurements of CO2, SO2, NO2, and particulate matter were collected using the Aeroqual Series 500 device, while formaldehyde and TVOCs were assessed using the certified JSM Air Quality Detector, approved and calibrated according to Egyptian Environmental Affairs Agency (EEAA) standards. Table 3 presents detailed instrumentation specifications.
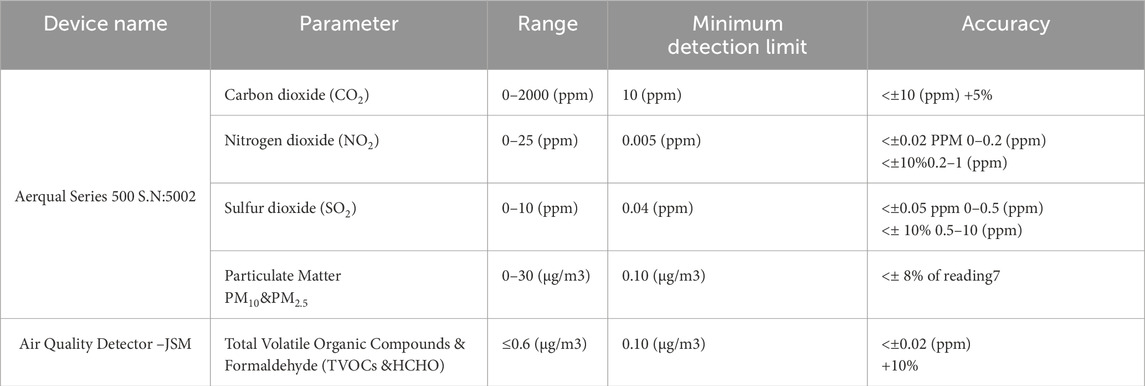
Table 3. Technical specifications of devices used to measure indoor air pollutants (Source: authors).
Field data were collected at fixed points in each lecture hall, specifically 1.2 m above the floor and 1 m away from walls or windows, to ensure consistent sampling. These measurements were compared to IAQ thresholds outlined by the WHO and the EEAA to evaluate air quality compliance.
2.4 Data analysis
Data analysis involved graphical interpretation and systematic modeling to evaluate the relationship between environmental conditions and pollutant levels. The study assessed how differences in building materials and finishes-especially post-maintenance-affected IAQ. Lecture Halls 1 (with windows), 2 (without windows), and 3 were compared to identify specific factors influencing pollutant concentrations.
The findings helped formulate practical recommendations for improving IAQ in university buildings, as well as a broader methodological framework for sustainable design and ventilation planning. Table 4 summarizes the average pollutant concentrations measured across the three lecture halls.
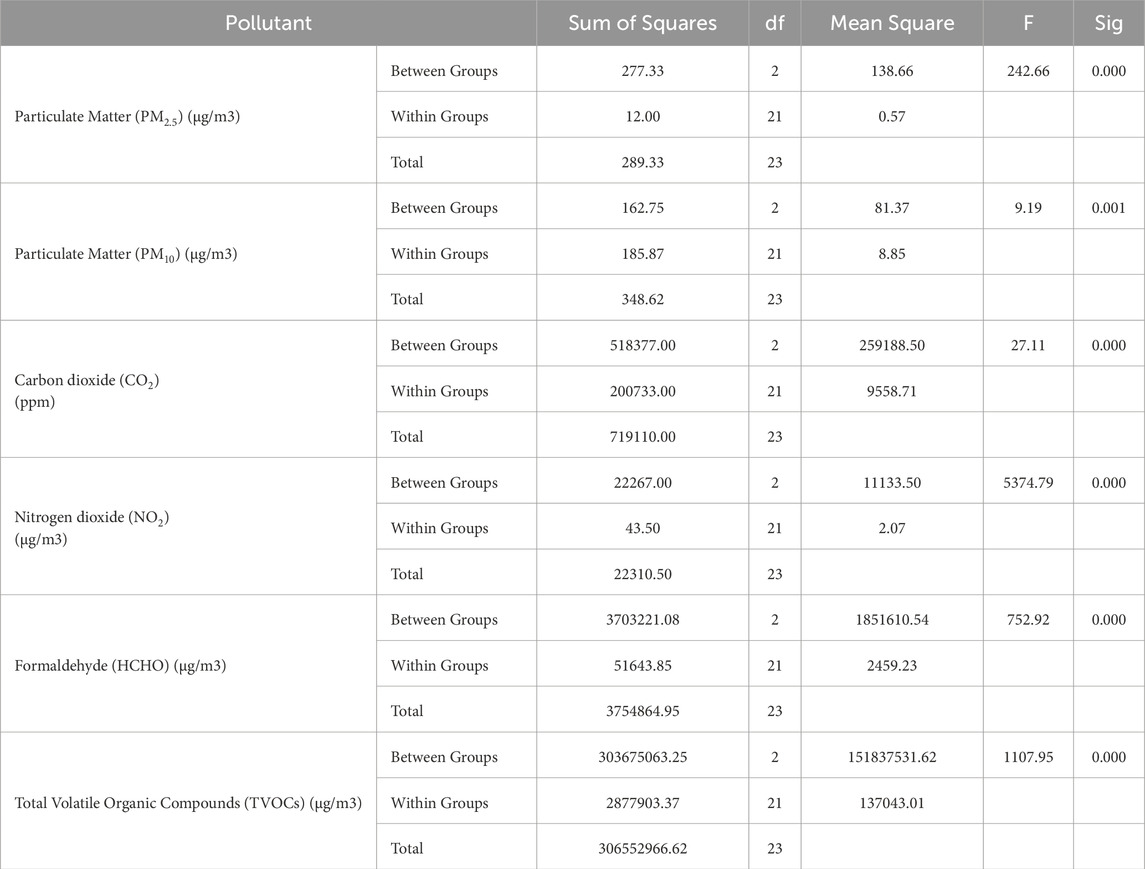
Table 4. One-way ANOVA results comparing pollutant concentrations across lecture halls, including F-values and significance (p). (Source: authors).
3 Results
Researchers assessed indoor air quality by recording spot measurements of PM2.5, PM10, CO2, NO2, SO2, HCHO, and TVOC concentrations in the air. The analytical plots in Figures 3a–f represent the recorded measurements for each variable across the three lecture halls, reflecting variations in finishes and environmental conditions, along with overall averages. Detailed pollutant measurements are provided in Supplementary Appendix A.
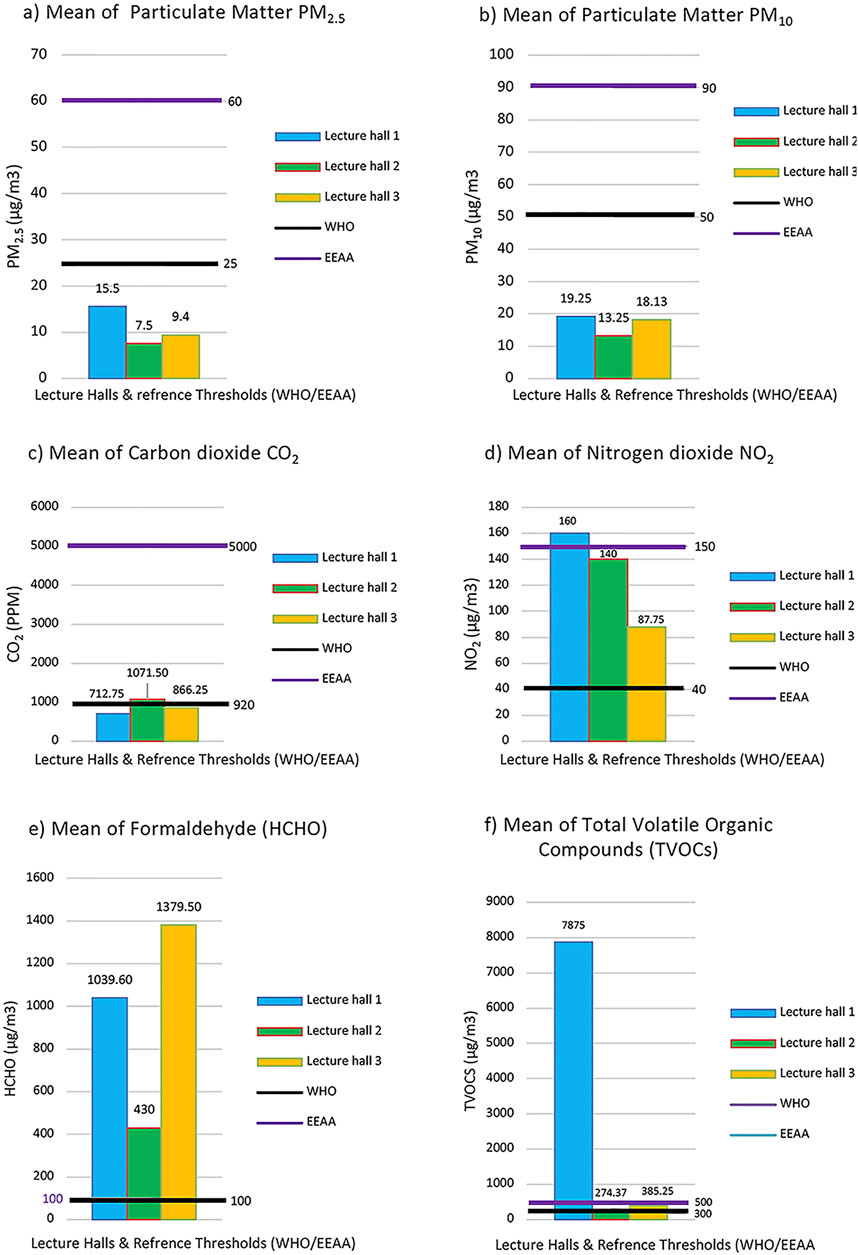
Figure 3. (a–f) Represent the comparative analysis of six key air pollutants across three different conditions and finishes of the studied (lecture halls 1, 2, 3) vs World Health Organization (WHO) Egyptian Environmental Affairs Agency (EEAA) guidelines. (The figures indicated are average values after analysis and measurements during eight hours from 8 am to 3 pm, (Source authors).
To enhance the statistical rigor of the analysis, one-way ANOVA tests were performed using SPSS (version 26) to compare pollutant levels across the three lecture halls. The results, summarized in Table 4, showed statistically significant differences (p < 0.001), for all measured pollutants, confirming that pollutant concentrations vary depending on the lecture hall characteristics.
Following the ANOVA, Tukey HSD post-hoc tests were conducted to explore specific pairwise differences. The results, shown in Table 5, highlight the most significant differences in pollutant concentrations between lecture halls.
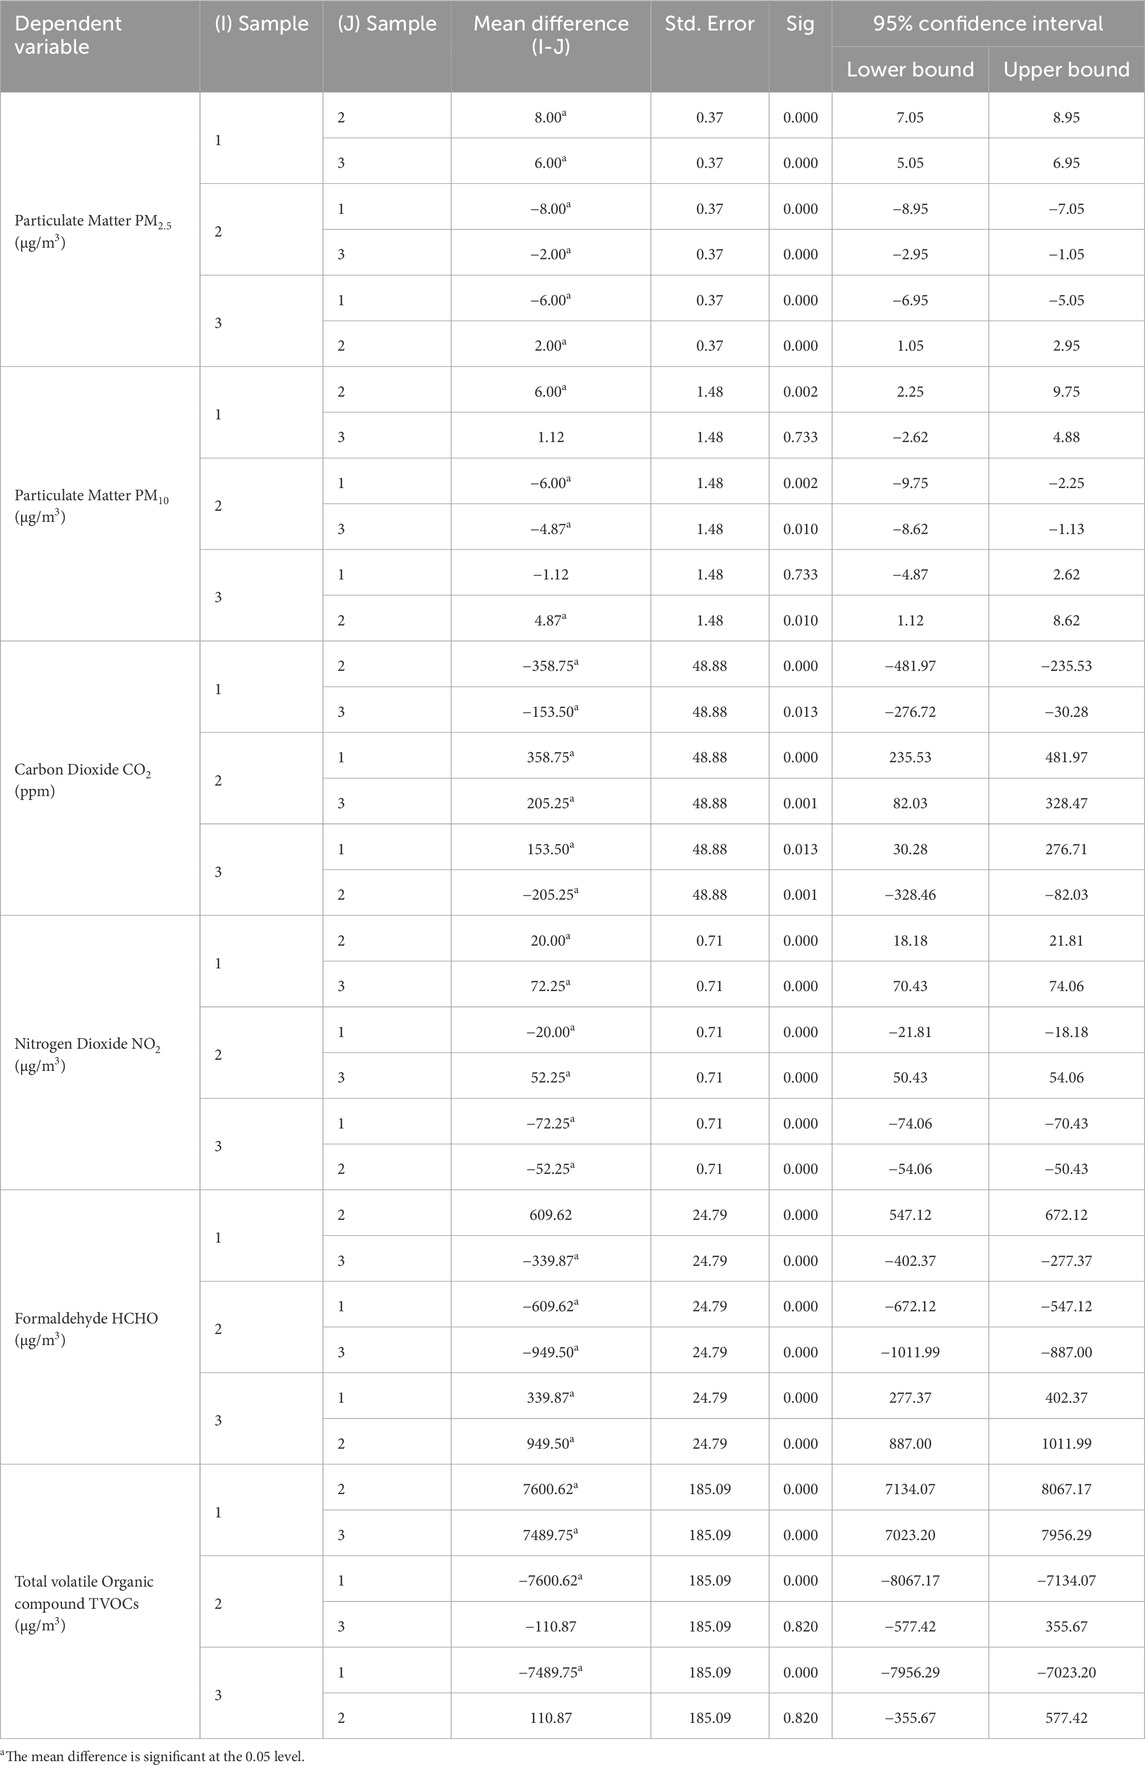
Table 5. Tukey HSD post-hoc test showing significant pairwise comparisons of pollutant concentrations between lecture halls (Source: authors).
Table 6 presents mean concentrations and standard deviations (±SD) of each pollutant across the three halls, with error bars representing ±1 SD to illustrate within-group variability. Effect sizes (η2) were also calculated to quantify the strength of the relationship between lecture hall features and pollutant levels, provided in Supplementary Appendix A (Supplementary Table B1).
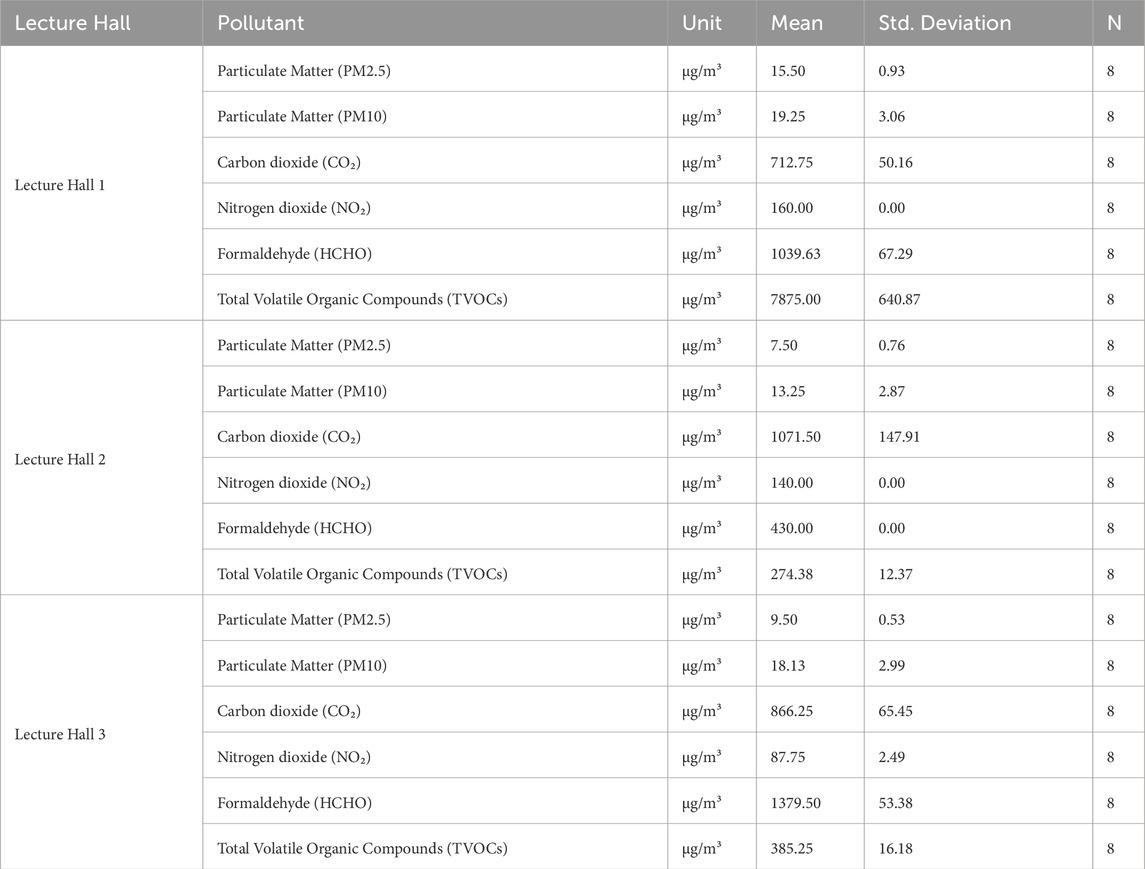
Table 6. Mean Concentrations and Standard Deviations (±SD) of Pollutants in Lecture Halls (Source: authors).
3.1 Key findings
• PM2.5 and PM10:
All PM2.5 and PM10 values were within WHO and EEAA guideline limits. PM2.5 ranged from 7.5 to 15.5 μg/m3 (Figure 3a), while PM10 ranged from 13.25 to 19.25 μg/m3 (Figure 3b). Lecture Hall 2 recorded the lowest concentrations, likely due to its enclosed design and limited exposure to outdoor sources. Tukey’s HSD showed significant differences for PM2.5 between Hall 2 and the others, with a strong effect size (η2 = 0.959). For PM10, the effect size was moderate (η2 = 0.467).
• CO2 Concentration:
As shown in Figure 3c, Lecture Hall 1 recorded the lowest average CO2 at 713 ppm, followed by Hall 3 at 866 ppm—both below the WHO limit of 920 ppm. These values likely reflect effective natural ventilation. Lecture Hall 2, lacking windows and reliant on mechanical ventilation, recorded the highest average at 1,071 ppm. Tukey’s HSD revealed significant differences with a substantial effect size (η2 = 0.721).
• NO2 Concentration:
Figure 3d shows that NO2 levels in all halls exceeded the WHO guideline of 40 μg/m3. Hall 1 recorded the highest at 160 μg/m3, followed by Hall 2 at 140 μg/m3, and Hall 3 at 88 μg/m3. These values indicate significant pollution exposure. Differences were o statistically significant with a very strong effect size (η2 = 0.998).
• Formaldehyde (HCHO) Concentrations:
HCHO levels ranged from 430 μg/m3 to 1,380 μg/m3 (Figure 3e), far exceeding the WHO and EEAA guideline of 100 μg/m3. These elevated levels likely stem from recent renovations. Hall 1 showed the highest levels, with Tukey’s HSD test confirming significant differences and a strong effect size (η2 = 0.986).
• TVOCs Concentration:
TVOC values varied widely (Figure 3f). Hall 2 remained within both WHO and EEAA limits at 274 μg/m3. Hall 3 slightly exceeded WHO limits at 385 μg/m3 but complied with EEAA standards. Hall 1 recorded an exceptionally high 7,875 μg/m3, attributed to emissions from synthetic finishes and ongoing maintenance. Tukey’s HSD test confirmed significant differences, with a very strong effect size (η2 = 0.991).
4 Discussion
This section analyzes the air quality data collected in July 2024 to determine which lecture hall exhibited the best indoor air quality (IAQ). Table 7 presents the average pollutant percentages across the three halls and evaluates IAQ based on EEAA and WHO standards.
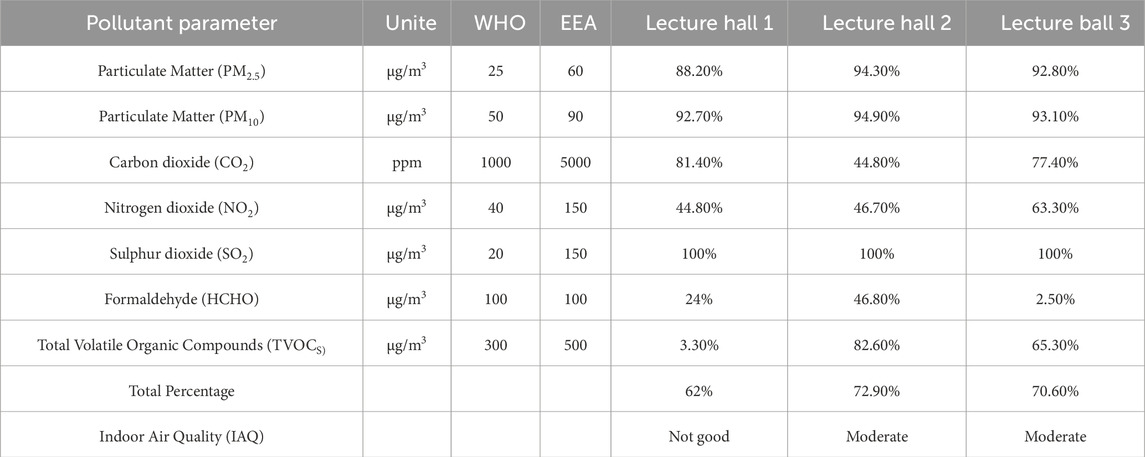
Table 7. Average pollutant percentages and IAQ assessments for lecture halls based on World Health Organization (WHO) and Egyptian Environmental Affairs Agency (EEAA) guidelines, (Source: authors).
To calculate indoor air quality (IAQ) percentages, a linear gradient formula (Equation 1) was applied. This formula positions each measured pollutant concentration within a defined index range, based on the assumption of a linear relationship between pollutant levels and health effects within established threshold limits. This methodological approach is consistent with the U.S. Environmental Protection Agency (EPA)’s Air Quality Index (AQI) interpolation technique, which employs linear interpolation between pollutant-specific breakpoint concentrations to convert raw pollutant levels into a standardized index scale (U.S. Environmental Protection Agency (EPA), 2018), and it aligns with the framework established by the World Health Organization (WHO) (WHO, 2006). Additionally, the use of normalized pollutant indices is endorsed by international standards such as ASHRAE 62.1 (Liu, 2022) and the WELL Building Standard (Ebbini, 2024), both of which support quantitative, index-based approaches for evaluating and communicating IAQ performance in built environments.
- PC: Percentage of current Measurement.
- PIndex High: Percentage index high.
- C: Current Measurement.
- PIndex Low: Percentage index low.
- BpLo: Baseline Pollution low.
- BpHi: Baseline Pollution high.
This formula enables real-time IAQ assessment and comparison between indoor environments. Future studies may benefit from exploring nonlinear models that reflect pollutant-specific dose-response curves for more accurate health risk estimation.
Example:
Researchers apply the percentage of The PM2.5 measurements in Lecture Hall 1, showing an average reading of 15.5 μg/m3.
Table 7 lists the percentage results for each pollutant and an overall IAQ score per halls.
- Particulate Matter (PM) levels were similar across all halls; Hall 2 slightly favored.
- CO2: Hall 1 performed best, followed by Hall 3, likely due to natural ventilation.
- NO2, HCHO, and TVOC: Hall 2 had the lowest concentrations, followed by Hall 3, while Hall 1 showed the highest pollutant levels.
These results translated into overall IAQ percentages.
- Hall 2: 73% (Good).
- Hall 3: 71% (moderate).
- Hall 1: 62% (poor).
The superior performance of Hall 2 is likely due to lower pollutant levels and minimal external contamination. However, there is no conclusive evidence that air filtration systems, particularly in Hall 2 which lacks windows, are the cause of these results. This suggests that other factors, such as spatial design, may contribute to maintaining lower pollutant concentrations. In contrast, Halls 1 and 3 require targeted improvements to their air quality. The presence or absence of openings in these spaces influences pollutant levels differently, necessitating specific interventions to reduce contaminants while managing ventilation effectively.
The identified pollutant sources include building materials and furnishings, each contributing various VOCs and formaldehyde emissions. For example, adhesives used in furniture and synthetic materials in seating and flooring can continuously emit VOCs. Environmental factors such as ventilation rates, temperature, and humidity also significantly affect pollutant concentrations, with emissions typically increasing under warmer and more humid conditions.
Based on these findings, several strategies are recommended to improve IAQ in educational settings. These include selecting low-emission materials for future renovations and maintaining consistent control of temperature and humidity. Enhancing ventilation systems, especially in halls with poorer air quality, is also crucial. Future research should focus on quantifying emission rates of specific materials under controlled conditions and expanding monitoring to include seasonal and long-term variations to better inform mitigation strategies.
4.1 Impact of excluded confounding factors
The intentional control or exclusion of potential confounding variables—such as occupancy fluctuations, HVAC operation, and outdoor environmental influences—was essential for conducting a focused evaluation of how interior finishing materials affect indoor air quality (IAQ). This methodological choice allowed the study to isolate the effects of material-related emissions without interference from external dynamic factors. However, it is acknowledged that this approach may limit the direct applicability of findings to real-life university settings, where such factors are continuously changing. For instance, higher occupancy levels during regular lecture hours, variable HVAC operation, and fluctuating outdoor environmental conditions could lead to increased pollutant concentrations and more dynamic IAQ profiles than those recorded in this study.
These limitations do not diminish the study’s objectives; rather, they reflect the necessary trade-offs made to achieve experimental control. The results provide a valuable baseline for understanding how interior design choices influence IAQ prior to student occupancy, supporting the proactive design of healthier learning environments.
4.2 Future research recommendations
Future studies are encouraged to incorporate real-time occupancy tracking, continuous HVAC system monitoring, and parallel measurements of outdoor air quality and meteorological data. Such an integrated approach would enhance the ecological validity of IAQ studies and guide the development of more responsive and sustainable indoor environmental strategies for educational facilities.
5 Conclusions and future scope
This study highlights the critical importance of maintaining healthy indoor air quality (IAQ) in educational environments, particularly in university lecture halls, where students and staff spend approximately 90% of their time indoors. The results confirm that IAQ is closely linked to the materials and finishes used in lecture halls, as well as the availability of natural or mechanical ventilation.
Although the study demonstrates strong correlations between pollutant levels and interior finishes, a direct causal relationship between specific material types and IAQ remains to be fully validated. For instance, the study titled “Effect of Building Materials on Indoor Air Quality in Residential Buildings in Egypt: A Pre-Occupancy Assessment” found strong correlations between material choice and pollutant levels—supporting the notion that materials significantly influence IAQ.
Poor IAQ has been shown to adversely affect student health, cognitive focus, and academic outcomes (Mannan and Al-Ghamdi, 2021), in addition to increasing the likelihood of Sick Building Syndrome (SBS) symptoms (Niza et al., 2024).
The investigation conducted at Al-Ahram Canadian University revealed that pollutant levels were shaped by both the types of interior materials and the presence or absence of windows. These findings underscore the need for further investigation into how finishes, ventilation strategies, and external environmental factors interact to influence student health and learning.
5.1 Recommendations for improving IAQ in lecture Hall design
(1) Ventilation System Improvements:
- Ensure a minimum of 6 air changes per hour in line with ASHRAE Standard 62.1 (ASHRAE, 2022).
- Install HEPA or equivalent high-efficiency air filters in all HVAC systems (Dubey et al., 2021).
- Maintain indoor temperature between 20°C and 25.5°C and relative humidity between 40% and 60% (Singh, 2019).
(2) Material Selection and Emission Standards:
- Keep Total Volatile Organic Compounds (TVOCs) concentrations within 300–500 μg/m3 over an 8-h exposure (Saffell and Nehr, 2023).
- Ensure formaldehyde levels remain below 100 μg/m3, (WHO guideline).
- Use only certified low-emission materials in educational buildings.
(3) Biophilic Design and Indoor Plants:
- Incorporate air-purifying plants such as Golden Pothos, Rubber Plant, and Aloe Vera (Polk, 2018) to support passive air filtration.
(4) Natural Lighting:
- Design lecture halls with minimum window-to-wall ratio of 30% to enhance daylighting, reducing dependency on artificial lighting and minimizing energy consumption.
(5) Air Quality Monitoring:
- Install IAQ sensors and automate HVAC systems to dynamically respond to real-time pollutant levels.
5.2 Impact of confounding factors
While this study intentionally excluded variables such as occupancy, HVAC fluctuations, and outdoor air quality to isolate the impact of interior finishes, this choice reduces the direct applicability of the findings to active academic settings. Real-life conditions would likely result in higher pollutant concentrations and more dynamic IAQ patterns. Nevertheless, by focusing on a controlled pre-occupancy phase, this research identifies critical design considerations for future renovations and constructions in educational spaces.
5.3 Future research directions
- Integrate building occupancy and HVAC cycling into predictive IAQ models.
- Use machine learning to analyze large-scale pollutant behavior and IAQ patterns.
- Include external weather and pollution data in long-term monitoring frameworks.
- Assess long-term pollutant accumulation and off-gassing trends in newly renovated buildings.
- Evaluate intervention outcomes (e.g., changes in student performance or health) following design improvements.
5.4 Suggested areas for exploration
- Enhanced Understanding: Machine learning can be used to analyze large, complex IAQ datasets and improve prediction models for pollutant dynamics.
- Better Design Decisions: Use predictive modeling to guide architectural and material choices.
- Integration of External Variables: Future IAQ models should include ambient weather and outdoor pollution data for more accurate and adaptable building strategies.
Moreover, integrating external environmental conditions into IAQ prediction models represents an integrated approach that will enable architects, engineers, and designers to develop more adaptive and sustainable building solutions, fostering healthier and more resilient learning environments.
5.5 Conclusion
Advancing indoor air quality management in Egypt requires an interdisciplinary approach that connects architectural design, environmental science, and smart monitoring systems. Currently, IAQ management frameworks in Egypt do not formally include architects or interior designers in policymaking—despite their critical role in shaping the built environment. This study highlights the urgent need to revise national standards and include architectural perspectives in IAQ policy development. Doing so will enable the creation of healthier, more resilient, and academically supportive learning environments.
Data availability statement
The original contributions presented in the study are included in the article/supplementary material, further inquiries can be directed to the corresponding author.
Author contributions
SS: Formal Analysis, Methodology, Supervision, Visualization, Writing – review and editing. IA: Formal Analysis, Methodology, Supervision, Visualization, Writing – review and editing. AA: Conceptualization, Data curation, Formal Analysis, Funding acquisition, Methodology, Resources, Writing – original draft, Writing – review and editing.
Funding
The author(s) declare that no financial support was received for the research and/or publication of this article.
Acknowledgments
We sincerely thank the Department of Architecture, Faculty of Engineering, Fayoum University, for their academic support, and the International Environmental Services Company (IES) for facilitating the equipment and access needed to complete this research.
Conflict of interest
The authors declare that the research was conducted in the absence of any commercial or financial relationships that could be construed as a potential conflict of interest.
Generative AI statement
The author(s) declare that no Generative AI was used in the creation of this manuscript.
Publisher’s note
All claims expressed in this article are solely those of the authors and do not necessarily represent those of their affiliated organizations, or those of the publisher, the editors and the reviewers. Any product that may be evaluated in this article, or claim that may be made by its manufacturer, is not guaranteed or endorsed by the publisher.
Supplementary material
The Supplementary Material for this article can be found online at: https://www.frontiersin.org/articles/10.3389/fbuil.2025.1552679/full#supplementary-material
References
Ali, W. A. A. I., and Ibrahim, A. (2023). The Problem of Air Pollution in the Cities of Sixth of October and Obour. Arab Geographical Journal 54 (176), 1–92. doi:10.21608/agj.2023.294995
ASHRAE (2022). Ventilation and acceptable indoor air quality. Peachtree Corners, GA: American Society of Heating, Refrigerating and Air-Conditioning Engineers (ASHRAE). Available online at: https://www.ashrae.org/file%20library/technical%20resources/standards%20and%20guidelines/standards%20addenda/62_1_2022_x_20221108.pdf (Accessed December, 2024).
Bluyssen, P. M., Zhang, D., Kurvers, S., Overtoom, M., and Ortiz-Sanchez, M. (2018). Self-reported health and comfort of school children in 54 classrooms of 21 Dutch school buildings. Build. Environ. 138, 106–123. doi:10.1016/j.buildenv.2018.04.032
Dubey, S., Rohra, H., and Taneja, A. (2021). Assessing effectiveness of air purifiers (HEPA) for controlling indoor particulate pollution. Heliyon 7 (9), e07976. doi:10.1016/j.heliyon.2021.e07976
Ebbini, G. W. (2024). Transforming health: The WELL Building Standard’s role in sustainable development. Cell Rep. Sustain. Amsterdam, Netherlands: Elsevier. 1 (5). doi:10.1016/j.crsus.2024.100100
EEAA (2023). Egyptian environmental Affairs agency laws. Available online at: https://www.eeaa.gov.eg/Laws/55/index (Accessed October 15, 2024).
Fikry, A., and Elsayed, A. (2021). Improving the indoor air quality (IAQ) in naturally ventilated lecture hall with a single facade by solar chimneys. J. Eng. Appl. Sci. 68, 29–18. doi:10.1186/s44147-021-00027-7
Goyal, R., and Khare, M. (2009). Indoor–outdoor concentrations of RSPM in classroom of a naturally ventilated school building near an urban traffic roadway. Atmos. Environ. 43 (38), 6026–6038. doi:10.1016/j.atmosenv.2009.08.031
Gul, H., and Das, B. K. (2023). The impacts of air pollution on human health and well-being: a comprehensive review. J. Environ. Impact Manag. Policy (36), 1–11. doi:10.55529/jeimp.36.1.11
Liu, X. (2022). “ASTM and ASHRAE standards for the assessment of indoor air quality,” in Handbook of indoor air quality (Springer), 1511–1545.
Mannan, M., and Al-Ghamdi, S. G. (2021). Indoor air quality in buildings: a comprehensive review on the factors influencing air pollution in residential and commercial structure. Int. J. Environ. Res. public health 18 (6), 3276. doi:10.3390/ijerph18063276
Mata, T. M., Felgueiras, F., Martins, A. A., Monteiro, H., Ferraz, M. P., Oliveira, G. M., et al. (2022). Indoor air quality in elderly centers: pollutants emission and health effects. Environments 9 (7), 86. doi:10.3390/environments9070086
Niza, I. L., de Souza, M. P., da Luz, I. M., and Broday, E. E. (2024). Sick building syndrome and its impacts on health, well-being and productivity: a systematic literature review. Indoor Built Environ. 33 (2), 218–236. doi:10.1177/1420326X231191079
Polk, M. (2018). Healing houseplants: how to Keep plants indoors for clean air, healthier skin, improved focus, and a happier life!. Simon & Schuster.
Saad, S. M., Shakaff, A. Y. M., Saad, A. R. M., Yusof, A. M., Andrew, A. M., Zakaria, A., et al. (2017). “Development of indoor environmental index: air quality index and thermal comfort index”.).
Sadrizadeh, S., Yao, R., Yuan, F., Awbi, H., Bahnfleth, W., Bi, Y., et al. (2022). Indoor air quality and health in schools: a critical review for developing the roadmap for the future school environment. J. Build. Eng. 57, 104908. doi:10.1016/j.jobe.2022.104908
Saffell, J., and Nehr, S. (2023). Improving indoor air quality through standardization. Standards 3 (3), 240–267. doi:10.3390/standards3030019
Singh, M. K., Ooka, R., Rijal, H. B., Kumar, S., Kumar, A., and Mahapatra, S. (2019). Progress in thermal comfort studies in classrooms over last 50 years and way forward. Energy Build. 188, 149–174. doi:10.1016/j.enbuild.2019.01.051
U.S. Environmental Protection Agency (EPA) (2018). Technical assistance document for the reporting of daily air quality–The Air Quality Index (AQI). Research Triangle Park, NC: U.S. EPA, Office of Air Quality Planning and Standards, Air Quality Assessment Division. Available online at: https://www.airnow.gov/sites/default/files/2020-05/aqi-technical-assistance-document-sept2018.pdf (Accessed December 2024).
WHO (2006). Air quality guidelines: global update 2005: particulate matter, ozone, nitrogen dioxide, and sulfur dioxide. Geneva, Switzerland: World Health Organization. Available online at: https://www.who.int/publications/i/item/WHO-SDE-PHE-OEH-06.02 (Accessed October 2025).
WHO (2018). 9 out of 10 people worldwide breathe polluted air, but more countries are taking action. Geneva, Switzerland: World Health Organization. Available online at: https://www.who.int/ar/news/item/16-08-1439-9-out-of-10-people-worldwide-breathe-polluted-air-but-more-countries-are-taking-action (Accessed October 2024).
Keywords: indoor air quality, student health, lecture hall assessment, global and local index, indoor air pollutants, educational environment
Citation: Sabry Elattar SM, Abdullah ID and Abbas Saleh Gebriel A (2025) Evaluation of the impact of air pollutants on university indoor air quality: a case study. Front. Built Environ. 11:1552679. doi: 10.3389/fbuil.2025.1552679
Received: 28 December 2024; Accepted: 14 May 2025;
Published: 29 July 2025.
Edited by:
Giuseppe La Verde, University of Naples Federico II, ItalyReviewed by:
Yacouba Moumouni, Higher Colleges of Technology, United Arab EmiratesEsther Kyere Andoh-Acquah, Takoradi Technical University, Ghana
Bhagyashree Ambore, RNS Institute of Technology, India
Copyright © 2025 Sabry Elattar, Abdullah and Abbas Saleh Gebriel. This is an open-access article distributed under the terms of the Creative Commons Attribution License (CC BY). The use, distribution or reproduction in other forums is permitted, provided the original author(s) and the copyright owner(s) are credited and that the original publication in this journal is cited, in accordance with accepted academic practice. No use, distribution or reproduction is permitted which does not comply with these terms.
*Correspondence: Amr Abbas Saleh Gebriel, YW1yZ2hlYnJlZWxAeWFob28uY29t, YWE3NTg2QGZheW91bS5lZHUuZWc=
†ORCID: Amr Abbas Saleh Gebriel, orcid.org/0009-0009-1690-4008