 Benito A. Berlanga
 Ioannis Zisis
 Manuel Matus
 Ziad Azzi
 Peter I. Irwin1
- 1Civil and Environmental Engineering, Florida International University, Miami, FL, United States
- 2DDA Forensics, Miami, FL, United States
In Florida, many highway intersections use span-wire systems to support traffic signals, making their ability to withstand extreme wind events, like hurricanes, crucial for safety. These systems’ responses can be significantly influenced by installation parameters such as wire sag and tension, which vary across intersections. The goal of this research was to better understand how these factors impact the system’s wind response. To achieve this, an experimental program was developed to measure the effects of catenary cable sag, messenger cable pretension, and the location of cable end supports using load cells, accelerometers, and inclinometers. These data were then used to calibrate numerical models to assess the system’s response with more refined setup parameter modifications. Experimental results showed a strong correlation between installation parameters and the system’s performance under wind loading. For instance, increasing the value of catenary sag (from 5% to 7%) reduced drag forces and the root mean square (RMS) of accelerations, giving the system a more advantageous aerodynamic response to wind forces. Numerical models for long- and short-span-with-springs models were developed to quantify and evaluate span-wire assemblies, comparing them with full-scale experimental results. First, long- and short-span-with-springs model results (i.e., total mean drag, total mean lift forces, mean inclinations, and wire deflections) were compared and were similar. This proved that the short-span-with-springs model can be used to get comparable results to long spans. The short-span with-springs model can simulate various span lengths found in the field by adjusting the longitudinal spring stiffness that corresponds to a particular lateral flexibility, normal to the plane of cables. In addition, results obtained experimentally from long- and short-span full-scale assemblies were compared to each other and to their corresponding model results and were similar as well. Similarly, the short-span full-scale assembly was installed with coil springs at both ends of the catenary and messenger cables. This facilitated the simulation of various span lengths by attaining the same lateral stiffness properties of span lengths found in the field. Comparison of experimental and model results served as a validation for the numerical models. These models helped to assess forces, inclinations, and wire deflections undergone by span-wire systems. A theoretical buffeting analysis of a span-wire traffic signal system was also performed. This analysis evaluated the signal assembly’s response to fluctuating wind speeds, providing RMS, mean, and peak values for acceleration and deflection in the along-wind direction. This analysis was conducted for a one 5-section and two 3-section configuration span-wire traffic signal assembly and carried out for winds that are perpendicular to the frontal area of the traffic signal system. The mass and frontal area of this system was taken as one lump mass and area. These analytical results were compared to the full-scale experimental data, providing a good agreement between experimental results and numerically obtained estimations. However, there were some deviations between analytical and experimental results. For instance, experimental values for rms of acceleration and deflection are a bit lower than the analytical values in the lower wind speeds. This is because some cross-wind response took place at lower wind speeds during testing of the assembly which decreased some response in the along-wind direction. Buffeting analysis does not reproduce the effect of cross-wind response.
1 Introduction
Traffic signals are an important part of the civil infrastructure that assists in the traffic management of metropolitan areas. These systems are susceptible to extreme wind events, as was observed during the hurricane seasons of 2004–2005 (Cook et al., 2012; Florida Department of Transportation, 2005), which placed significant stress on and damaged the signal hangers and connections to the disconnect box/signal. Various studies have been performed to understand the response of these systems using different configurations with different components (e.g., hangers and signal housing) (Zisis et al., 2019a; Zisis et al., 2019b). However, there is no investigation to understand the response of the system when the standard installation procedures, defined by the Florida Department of Transportation Standard Specifications for Road and Bridge Construction–January 2017, are not followed. There is limited information on the safe design of these systems. More research is required to better understand the response of these systems under wind-induced loads (Cook et al., 2012) as the failure of these systems may impose life-threatening conditions on motorists (Sivarao et al., 2010). The installations of the span-wire traffic signal systems follow detailed specifications (e.g., cable tensions, and catenary sag) depending on the physical properties of the intersections; however, there are uncertainties introduced to the system due to human error and/or other inconsistencies.
In the current research project, a parametric study was carried out to have a better understanding of the effect these variations pose on the overall response of the system, thus showing the importance and effect of the standardized installation procedures and specifications. More specifically, this research studied the effects of 1) messenger wire tension, 2) catenary wire sag, and 3) distance between catenary and messenger wire anchorage. This study solely focused on span-wire systems. Other common types of traffic signal support systems, such as mast-arm structures (rigid-based), were not part of this study and, therefore, are not discussed here. In addition, a numerical model was developed per Florida Department of Transportation (FDOT) standard specifications that allows the investigation of span-wire traffic signal assemblies. This model can be modified to different applied wind forces or pressures, span lengths, and wire cable diameters. It reproduces the forces, stresses, strains, deformations, inclinations, accelerations, etc., sustained by the signal assembly. It can also assist in analyzing the behavior of these systems to better understand their performance and subsequently develop safer, more resilient, and reliable span-wire traffic signal assemblies. Finally, a theoretical buffeting analysis was also performed to analyze the traffic signal assembly’s response to changing wind speeds.
2 Literature review
Limited research has been carried out on the performance of span-wire traffic signal systems. Cook et al. (2012) performed a full-scale experiment using span-wire traffic signal systems to assess the performance of different types of hangers. For this investigation, a span-wire traffic signal system was installed in an open field, and a movable wind turbine that could generate wind speeds of approximately 120 mph was used to test the traffic signals installed in a span-wire traffic signal system. This investigation provided information on the overall performance of the system depending on the type of hanger used. Among other findings, the study found that the inclination of the signals due to wind could impose a visibility issue on the motorist when the signals inclined 12.5° forward or 27.5° backward. This investigation also found that during the 2003–2004 hurricane season, a considerable number of traffic signals were damaged. Based on the findings of this investigation, along with previous studies and post-hurricane field assessment reports (Florida Department of Transportation, 2005), span-wire signal assemblies have been observed to experience significant stress on the signal hanger component and damage at the interface of the hanger to the top face of the disconnect box/signal, making it a crucial element for maintaining system integrity and preventing catastrophic failure. Additionally, damage to cables (such as cable snapping and/or loss of tension) and the detachment of visors and/or backplates can compromise visibility and create hazardous driving conditions for motorists, indicating the importance of such systems (Figure 1). This investigation has played a part in assessing damage in existing span-wire traffic signal systems affected by tropical storms. This investigation has also lessened the chance of damage on span-wire systems affected by future tropical storms (Deng et al., 2025; Balaguru et al., 2024) by helping to identify areas that are vulnerable to high concentrations of stress and where damage can potentially occur during tropical storms. This, in turn, has led to the manufacture of sturdier span-wire system hanger components.
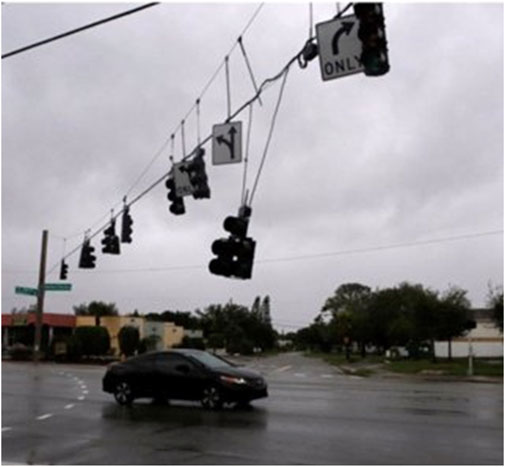
Figure 1. Wind-induced damage to the span-wire traffic signal system (Azzi et al., 2020).
The typical lengths of span-wire traffic signal systems may range from 50 ft to 200 ft (Irwin et al., 2016) depending on the physical properties of the intersection. They are used at intersections where the physical properties of the intersection do not permit the installation of mast arms or for temporary traffic controls during an intersection’s construction. Other studies carried out by McDonald et al. (1995) and Zuo and Letchford, 2010 have focused on mast-arm structures (rigid systems).
Due to the considerable size of these systems, a special short-span rig of approximately 22 ft was designed to simulate a long span by means of adding coil springs to the end of either cable. It achieved the same lateral force to deflection properties of a typical installation. This special rig allowed a long-span-wire traffic signal system to be tested in an atmospheric boundary layer (ABL) wind tunnel at different wind angles of attack.
Making use of the advantages of the short-span rig design, Zisis et al., 2016 investigated the performance of two different span-wire traffic signal system configurations, one consisting of one 5-section and two 3-section signals and the other consisting of one 4-section and two 3-section signals. The results of this investigation concluded that the most vulnerable configuration was the configuration with the 5-section and 3-section signals, making it a benchmark to study the performance of the system under extreme wind events.
The previously mentioned short-span rig was a useful tool for testing different configurations of a typical long span using a short span. The rig allowed the rotation of the entire system to test the performance at different wind angles of attack; however, it was deemed critical to verify the accuracy of the short-span rig against the behavior of an actual long-span rig. For this, Zisis et al. (2017) tested a long-span system (72 ft long–the entire width of the wind tunnel) installed inside the Wall of Wind Experimental Facility and compared the results of the short span vs. the long span. This investigation compared a configuration installed in both rigs, short span (22 ft) and a long span (72 ft), and concluded that the results showed a satisfactory agreement, therefore validating the short-span rig utilization. A very important finding was the development of aerodynamic instability at 70 mph in both rigs. The same instability was observed in the investigation carried out by Zisis et al. (2016) and Irwin et al. (2016).
Azzi et al. (2018), Azzi et al. (2019), and Azzi et al. (2020) investigated the performance of an aeroelastic model of 1:10 scale of a full-scale span-wire assembly. The results of the 1:10 aeroelastic model messenger cable tensions and the rms of accelerations were compared with the results obtained by Matus (2018a). It was concluded that both models’ results compared well, thus providing more insight into the efficacy of the short span used for this current investigation to replicate a typical span-wire system found in the field.
3 Test method and full-scale experimental results
The experiments for this investigation were carried out at the Wall of Wind Experimental Facility (WOW-EF) located at Florida International University (FIU) in Miami, FL. This experimental facility has distinctive capabilities that allow testing full/large-scale structures (Chowdhury et al., 2017). This facility consists of 12 fans with a total power of 8400 horsepower, which can achieve wind speeds of up to 157 mph. A conditioning chamber is responsible for managing the wind flow to achieve the different exposures typically found in the atmospheric boundary layer (ABL). In this case, the traffic signals in this experiment were tested under an open terrain condition. The 16-foot-diameter turntable of this facility enables testing of large models at various wind angles of attack (see Figure 2).
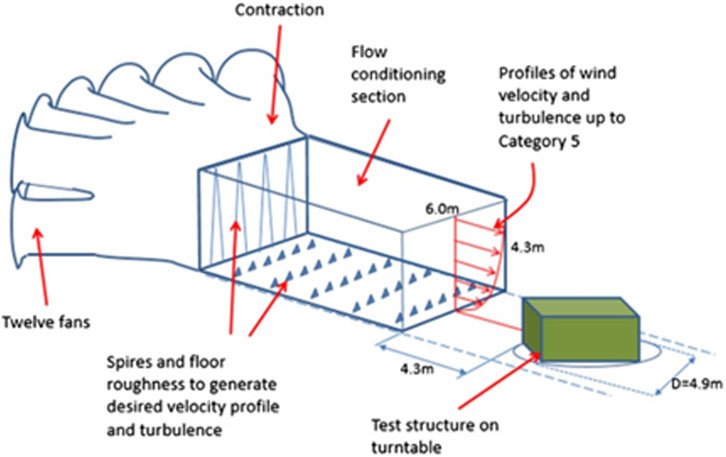
Figure 2. WOW-EF schematic (Chowdhury et al., 2017).
A full-scale short-span rig with coil springs was used to install the span-wire traffic signal system. The configuration consisted of one 5-section signal and two 3-section signals (see Figures 3A,B). The 5-section (54 inches × 40 inches) and 3-section (54 inches × 26 inches) signal housing weighed 76 lbs and 94 lbs., respectively. As previously mentioned, this short-span rig (21.9 ft) was used to test the system at different wind angles of attack (Matus, 2018c). All tests were carried out in an open terrain exposure, and wind speed measurements were obtained using a Cobra Probe installed at 111 inches height at the center of the turntable.

Figure 3. (A) Short-span test rig and (B) test setup with the traffic signal system installed.
For the different cases tested, a seven-wire strand class A zinc-coated cable of 3/8 in diameter was used for the messenger and catenary wires. A standard case was tested to serve as a baseline. This case was installed according to the specifications found in the FDOT Standard Specifications for Road and Bridge Construction, Section 634-3 (Standard Specifications for Road and Bridge Construction, 2017). The standard installation parameters were chosen for a typical 80 ft long-span-wire traffic signal system with the standard messenger wire pretension and 5% sag for catenary wire, and the distance between the end support of the catenary and the messenger wires (although not standardized) was 7 ft apart. The messenger wire pretension was set to 80 lbs (Irwin et al., 2016). From the different standard installation procedures, eight cases were developed by modifying one single installation parameter at a time (i.e., catenary sag, messenger tension, and distance of cable support) while keeping all others unaltered. A certified contractor authorized by the FDOT installed the signals according to the specifications and made the modifications as requested. Eight different cases were developed for this investigation (see Table 1).
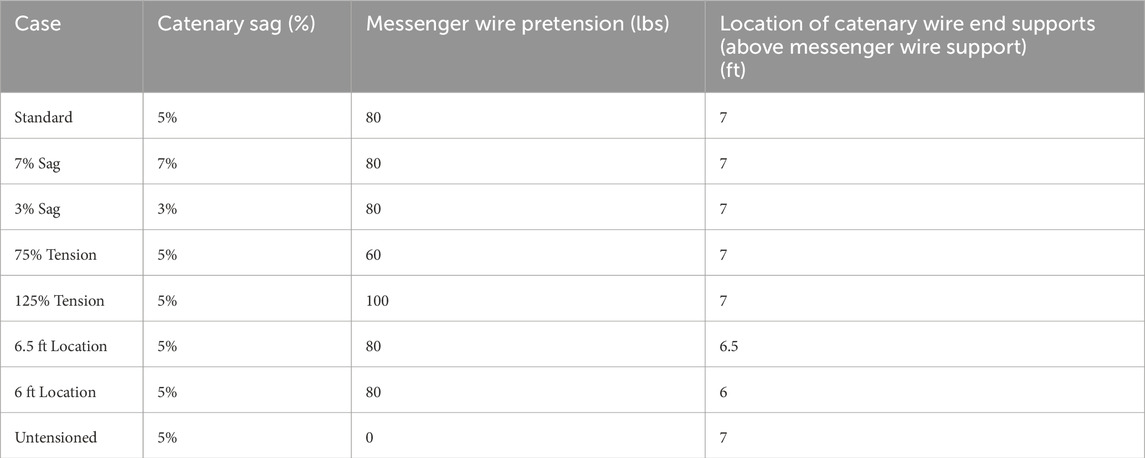
Table 1. Test cases.
The overall performance of the system was assessed by the installation of 6-degree of freedom loadcells at either end of the seven-strand zinc-coated cables (messenger and catenary cables) to measure tension, drag, and lift forces. Inside the 5-section and outermost 3-section signals, inclinometers and tri-axial accelerometers were installed to measure signal inclinations (along- and across-wind) and accelerations. The installation locations of the inclinometers and accelerometers were determined to capture the expected critical structural responses of the signal housings. The field observations from the available FDOT reports also served as input into the selection of these locations. Figure 4 shows the orientation of the loadcell components (cable forces), that is, lift (x), drag (y), and tension (z), as well as the location of inclinometers and accelerometers.
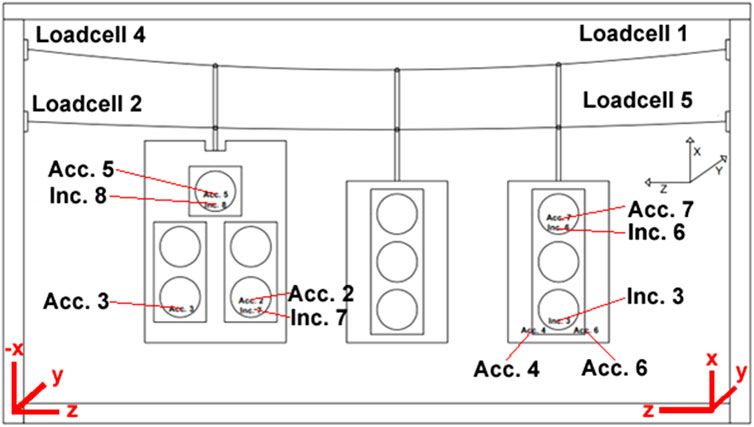
Figure 4. Instrumentation locations.
All cases were tested at 30 mph, 45 mph, 60 mph, and 75 mph from 0° to 180° every 45°. The testing protocol did not include higher wind speeds as Irwin et al. (2016), Zisis et al. (2016), and Zisis et al. (2017) found that aerodynamic instabilities are observed at speeds of 70 mph and higher. Such aerodynamic instabilities would contaminate the acquired data and would bring uncertainties to any result presented due to the large oscillations and amplification of wind-induced forces.
The system was instrumented to measure the wind-induced forces (drag, lift, and cable tension) by means of 6-degree of freedom loadcells installed at the end of the catenary and messenger cables, as well as inclinometers and accelerometers (see Figure 4). The results presented in this investigation for forces, accelerations, inclinations, and aerodynamic coefficients are as follows:
1) Force results are presented in the form of mean values as well as observed peak values.
2) Inclination results are presented in the form of mean values as well as observed peak values.
3) Acceleration results are presented in the form of rms of acceleration values.
4) Aerodynamic coefficients are presented in the form of mean values (i.e., mean drag coefficient and mean lift coefficient).
3.1 Cable forces
As wind speed increased, the drag forces experienced by the messenger cable were observed to increase in all cases. However, the configuration that underwent higher mean and peak drag forces was the case with a sag set at 3%, being 294.5 lbs and 328 lbs, respectively, at wind speeds of 75 mph. When the configuration was set to have a 7% sag, it was observed that the messenger cable drag mean and peak forces were lower than all other cases, attaining values of 236.1 lbs and 275.3 lbs at wind velocities of 75 mph (Figure 5A). The messenger wire lift forces were also observed to increase as wind speed increased. The case that was observed to experience higher messenger wire mean and peak lift forces was the case with untensioned messenger wire, attaining values of 72.5 lbs and 94 lbs at 75 mph wind speeds while, on the other hand, the cases that attained lower values for messenger wire mean and peak lift forces were the cases in which the end support of the catenary wire was lowered to 6.5 ft and 6 ft and attained values of 66 lbs and 87 lbs (refer to Figure 5B). The messenger tension, as well as the drag and lift forces, experienced an increase in force at any given wind speed. The configuration with a 7% sag was observed to be the most effective in reducing the messenger wire tension and attained a value of 401 lbs and 442 lbs for mean and peak messenger wire tension forces, respectively. Interestingly, the cases in which the messenger wire pretension was partially or completely reduced underwent higher messenger wire mean and peak tension forces as the wind speed increased from 30 mph to 75 mph (Figure 5C).
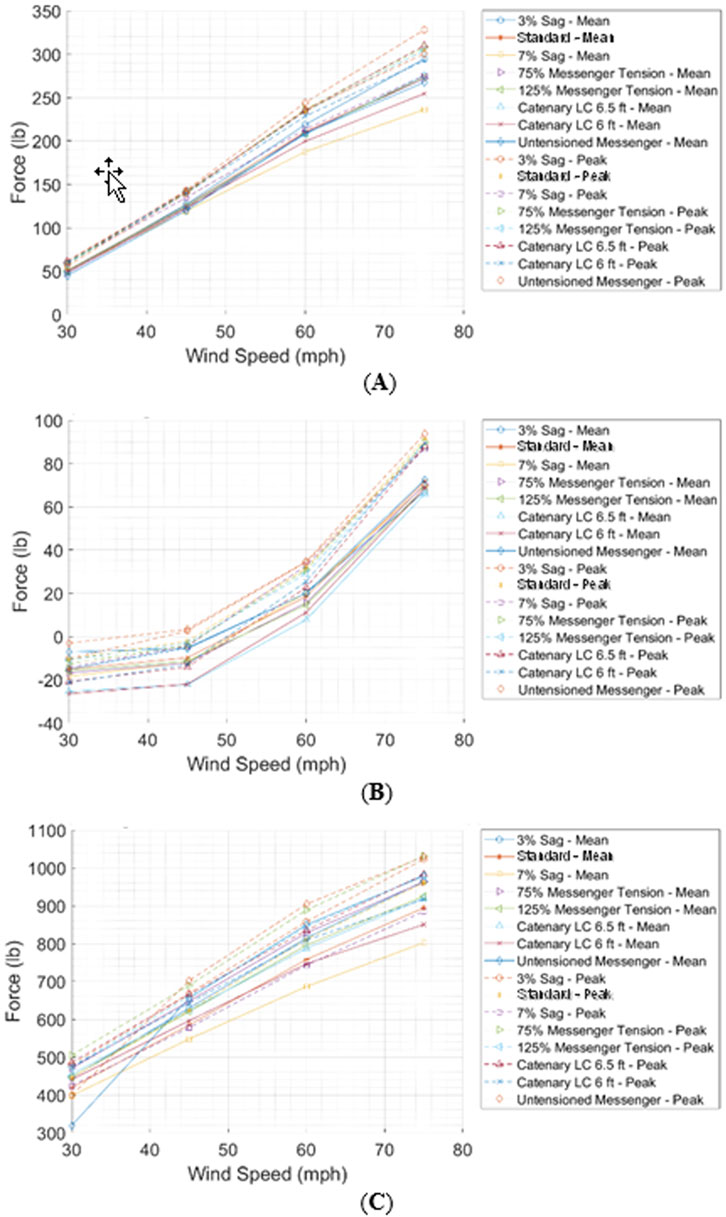
Figure 5. (A) Messenger cable drag forces, (B) lift forces, and (C) tension forces.
The drag forces induced on the catenary cable were observed to be significantly lower than those experienced by the messenger wire. At low wind speeds, the wind pushed the signals backward and induced, although small, a drag force on the catenary wire that remained constant up to wind speeds between 45 mph and 60 mph and then reversed at speeds higher than 60 mph. This can be because the messenger wire deflects in the along-wind direction until a certain point, at which it then acts as a lever point inducing the hangers to push the catenary cable forward. In the positive range of forces experienced by the catenary wire, the case that experienced higher mean and peak drag forces was the case with an untensioned messenger wire. On the other hand, the case that was observed to experience the highest drag forces in the negative range of the graph was the case set with a 3% sag. The case that was observed to generate the lowest catenary mean and peak drag forces was the case with a 7% sag (Figure 6A). The catenary cable mean and peak lift forces increased as the wind speed increased. The cases observed to experience the highest and lowest mean and peak catenary cable lift forces were the 3% sag and 7% sag, which attained values of 142 lbs and 175 lbs (mean and peak for 3% sag) and 121 lbs and 143 lbs (mean and peak for 7% sag) (Figure 6B). The tension forces experienced by the catenary wire are shown in Figure 6C. Though an increase in tension can be observed, it is not a tensional force that is experienced by the cable but the rate at which the tension of the cable is reduced. Because the lift is observed to increase as wind speed increases (Figure 6B), a release of tension forces is exerted on the catenary cable. In this case, the values increase with wind speed due to the significantly higher value of the self-weight of the signal assemblies taken as a baseline to carry the zero-drift-removal process (Figure 6C).

Figure 6. (A) Catenary cable drag forces, (B) lift forces, and (C) tension forces.
The configuration with a 7% sag was the most effective in reducing messenger wire tension. This setup resulted in the lowest mean and peak messenger wire drag compared to other configurations. Additionally, it minimized the catenary cable’s mean and peak drag forces and reduced lift forces, further contributing to lower overall tension. In contrast, configurations with lower sag (such as 3%) or reduced pre-tensioning led to higher messenger wire tensions as wind speeds increased. Therefore, a 7% sag configuration is the most effective choice for minimizing messenger wire stresses while maintaining stability under high winds.
3.2 Signal inclinations
Inclinations of two traffic signals housing were recorded using four inclinometers. The along-wind and across-wind inclinations were measured. The location of the inclinometers is shown in Figure 4.
The outermost 3-section signal inclinations were observed to substantially increase as tests progressed. At a wind speed of 30 mph, the 3-section signal mean and peak inclinations attained values of approximately 10° and 15° along-wind (backward inclinations), respectively. At lower wind speeds, the inclinations among all cases were substantially similar; however, the deviation of the mean and peak inclinations became considerable as wind speed increased. Cook et al. (2012) stated a cut-off limit for the backward inclination of the traffic signal as 27.5°. At wind speeds of 60 mph, this limit is completely surpassed, thus indicating the vulnerability of the traffic signal assemblies to inclinations due to low wind speeds, which could potentially impose dangerous traffic conditions on motorists. The case observed to experience the highest mean and peak along-wind inclinations was the case configured with a 7% sag, reaching values of 52° and 62° while the 125% Messenger case underwent the lowest mean and peak along-wind inclinations of 47° and 56.5°, respectively. The across-wind inclinations were negligible (Figure 7).
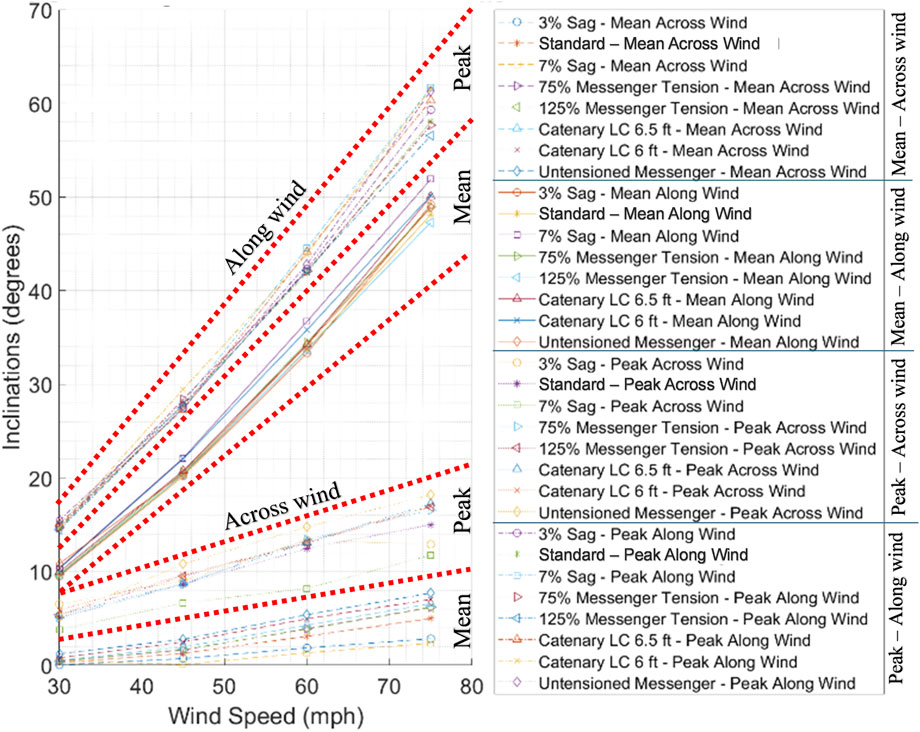
Figure 7. 3-Section signal inclinations.
The 5-section signal mean and peak along-wind inclinations increased as wind speed increased. The deviation among all cases was considerably smaller at lower wind speeds; however, a difference was noticed as testing progressed. At 30 mph wind speed, the mean and peak inclinations in all configurations were approximately 10–12° and 14–16° (backward). The case that inclined the least at 75 mph was the 3% Sag case, and it attained a mean inclination of 50.5°. The case that was observed to experience the worst mean and peak along-wind inclination was the Catenary LC 6 ft case, reaching inclinations of 54° and 65°, respectively. As was observed in the 3-section signal, the across-wind inclinations were not critical and remained low during all wind speeds (Figure 8). The optimal configuration for minimizing signal inclinations is the case with an increased messenger wire tension and the 3% Sag case. On the other hand, the Catenary LC 6 ft case demonstrated the poorest performance. These findings highlight the importance of optimizing messenger wire tension and sag to reduce excessive signal inclinations and enhance system stability under high wind conditions.

Figure 8. 5-Section signal inclinations.
3.3 Signal accelerations
The acceleration values presented in this report are the root mean square (rms) of acceleration. The accelerations of two traffic signals were measured by six accelerometers. The location of the accelerometers is shown in Figure 4. The rms of each accelerometer component (that is, x, y, and z) were obtained, and the highest value of each component was used for this report. It must be noted that during the tests, the signals inclined following a semi-circular path as the entire assembly pivoted at the messenger wire fixation. For this reason, the accelerations reported are tangential, radial, and across-wind.
The rms of accelerations in the 3-section signal were observed to increase with increasing wind speed. At the lowest wind speed, the radial accelerations were observed to be approximately 15 in/s2 for all cases. The tangential accelerations did not deviate among all cases and attained values of approximately 25 in/s2; however, as wind speeds increased, the values started diverging. The across-wind accelerations were observed to increase with the progression of the tests, and a greater deviation among cases was observed throughout the entirety of the tests. The cases observed to undergo higher across, tangential, and radial accelerations were the Standard and 75% Messenger Tension cases with a value of 85.5 in/s2, the Catenary LC 6.5 ft case with a value of 121 in/s2, and the Untensioned Messenger case with a value of 50.5 in/s2. The cases with the lowest across, tangential, and radial accelerations at 75 mph were the 7% and 3% Sag cases with a value of 76 in/s2, the 75% Messenger Tension case with a value of 110 in/s2, and the 125% Messenger Tension with a value of 39 in/s2 (Figure 9).
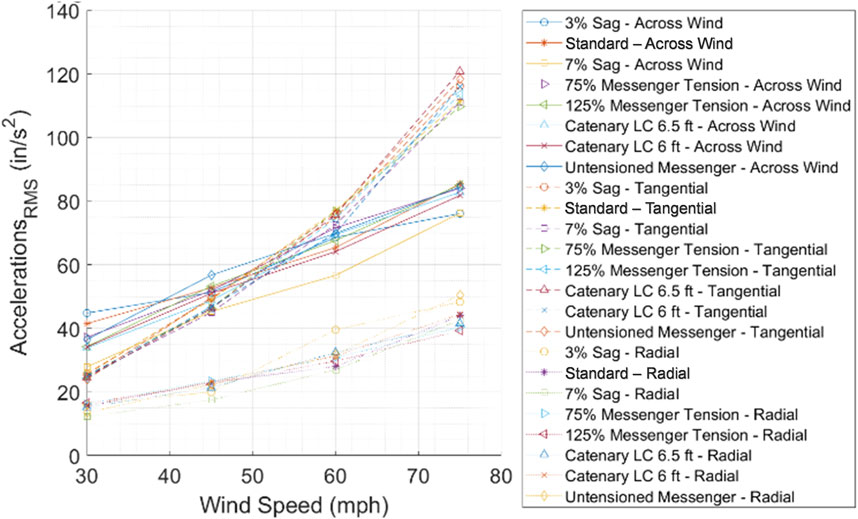
Figure 9. 3-Section signal rms of accelerations.
The 5-section signal underwent a similar response as the above-mentioned 3-section signal. At 30 mph wind speeds, the across, tangential, and radial accelerations were similar and ranged between 10 in/s2 and 25 in/s2. The tangential acceleration was observed to be the most significant of the three accelerations, reaching values of 132 in/s2 in the Catenary LC 6.5 ft case. The across and radial accelerations increased at a lower rate and attained similar values. At the highest wind speed, the case that experienced the lowest tangential acceleration was the case with a 7% Sag and attained a value of 113 in/s2 (Figure 10).
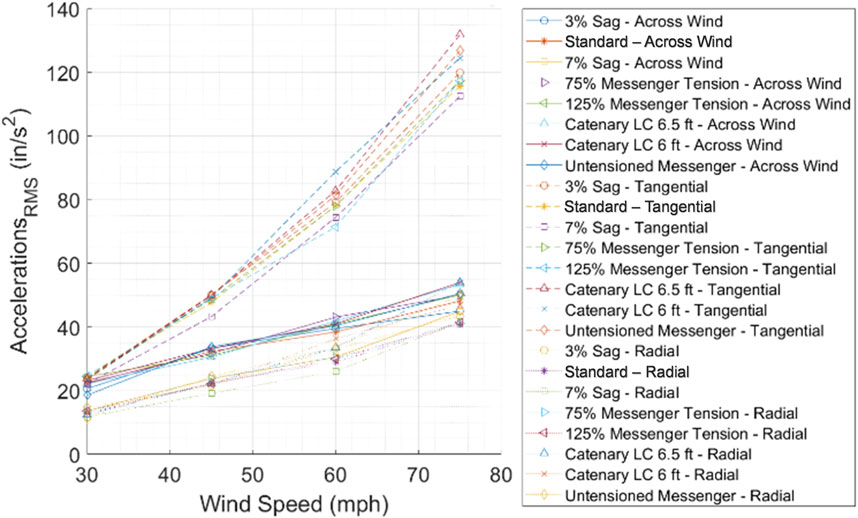
Figure 10. 5-Section signal rms of accelerations.
3.4 Drag and lift coefficients
The drag and lift coefficients were calculated by using the formula Cx = Fx/(1.5 × ρ × V2 × Afrontal), where Cx is the coefficient to be calculated, Fx is the mean total force of the coefficient to be calculated, ρ is the air density, V is the wind speed at the signal mean height, and Afrontal is the frontal area of the traffic signal assembly. The total drag forces were obtained by adding the mean drag component of all loadcells, and the total lift forces were obtained similarly.
The drag forces obtained for these experiments were observed to decrease as wind speed increased. At 30 mph, the drag coefficients attained values between 0.96 and 1.1 and decreased to values between 0.64 and 0.78 at 75 mph wind speed. Among all cases, the 7% Sag case yielded lower drag coefficients, and surprisingly, the standard case resulted in higher drag coefficients (Figure 11). It must be noted that the reduction of the drag coefficient as wind speed increases is expected. The traffic signal inclination increases as wind speed increases (Figures 6C, 7); the signal becomes more aerodynamic, and the drag is reduced.
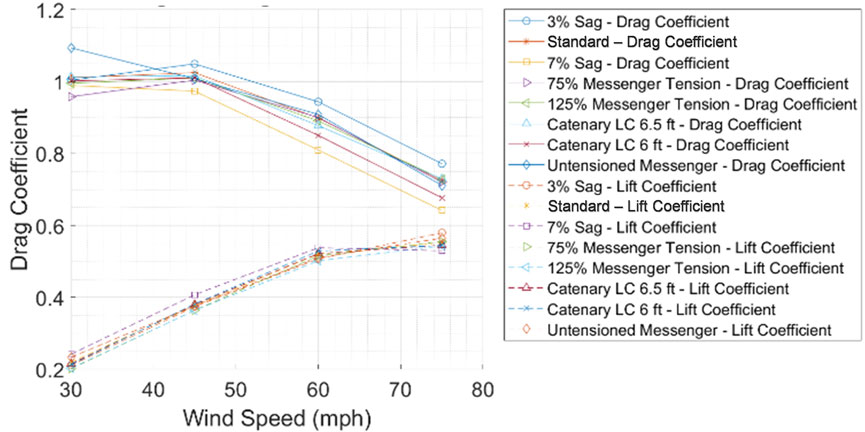
Figure 11. Drag and lift coefficients.
The lift coefficient was observed to increase at any given wind speed, which resulted in values between 0.2 and 0.45 at 30 mph. At 75 mph, the lift coefficients resulted in values between 0.55 and 0.58 (Figure 11). The increase of lift coefficients as wind speed increases is expected. The higher the inclination of the signals, the lesser the bluff-body behavior of the traffic assemblies, and thus, the effect of the lift coefficient is reduced.
The reduction in drag coefficients aligns with the expectation that increasing signal inclination enhances aerodynamics, thus reducing the drag forces. Among the tested configurations, the 7% Sag case demonstrated the lowest drag coefficients, whereas the standard case exhibited the highest. Conversely, lift coefficients increased with wind speed, aligning with the reduced bluff-body behavior of inclined signals.
4 Development and use of numerical models
Two numerical models were also developed, a long- and short-span-wire traffic signal assembly, which can be used to evaluate forces, signal inclinations, and wire deflections under the effects of wind forces before aerodynamic instability occurs at wind speeds between 20 mph and 60 mph.
The values obtained from the numerical models were compared to data collected from experimentally tested full-scale assemblies for validation. The models support the evaluation and enhancement of span-wire traffic signal assemblies to help reduce the chance of damage in the future. The models were developed depicting long- and short-span-wire traffic signal assemblies that were tested at the Florida International University (FIU) Wall of Wind (WOW) wind research facility. The support structures for the full-scale long- and short-span-wire traffic signal assemblies were modeled by assuming a fixed boundary condition at the outer end of each spring (Figures 12A,B). This location corresponds to where the outer end of each spring was attached to its corresponding load cell, and the load cell, in turn, is attached to the inner face of the HSS column on the full-scale span-wire signal assemblies tested at the WOW (Figures 13A,B). A fixed boundary condition assumption was made because of an independent HSS column deflection experimental study conducted at WOW-EF. The results of the study indicated that the column deflections of the support structure were negligible.

Figure 12. (A) Long- and (B) short-span models of span-wire traffic signal assemblies.
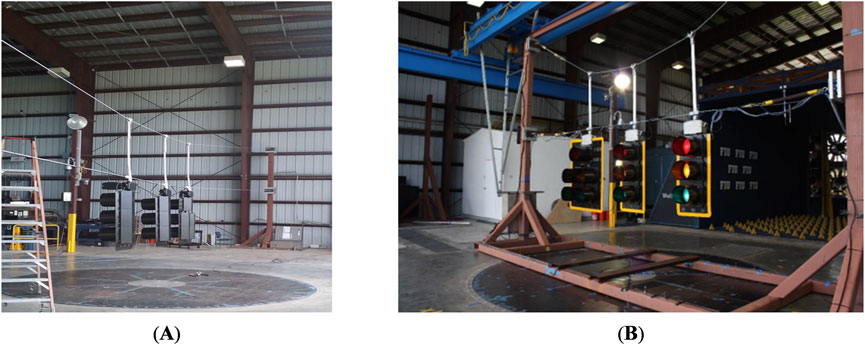
Figure 13. (A) Long- and (B) short-span full-scale span-wire traffic signal assemblies (Matus, 2018b).
An iterative approach was used to zero in on a final inclination and drag and lift coefficients. Inclinations were calculated using the numerical models (short and long spans) until the inclinations converged to a constant value. This approach requires aerodynamic data, inclinations vs. CD and CL from test measurements, in order to obtain new values of CD and CL from the newly calculated inclinations using the numerical models. Afterward, new aerodynamic forces were calculated to be used as input forces in the numerical models for a subsequent run. This approach was repeated until inclination was a constant value. Therefore, this approach can be used to predict signal inclinations per corresponding CD and CL values and can be used to study the behavior of various hangers, signal geometries, and span lengths using the short-span-with-springs numerical model before aerodynamic instability occurs. The aerodynamic forces that were applied to the numerical models were calculated using the final CD and CL values that were generated from the iterative approach.
4.1 Load application
Drag and lift aerodynamic forces were calculated using equations FD = 0.00256 × V2 × A × CD and FL = 0.00256 × V2 × A × CL, respectively, where FD and FL are the drag and lift forces (lbs), respectively, V is the wind speed at the mean height of the traffic signals (mph), A is the total frontal and bottom area (ft2) of the traffic signal assemblies, for drag and lift force, respectively, and CD and CL are the drag and lift coefficients, respectively. The wind speeds and wind angle used to calculate forces that were applied to the numerical models were 20 mph, 30 mph, 45 mph, and 60 mph at 0°.
Force or pressure can be an input load on the numerical models at an angle of 0° or 180°. However, analysis of test data from experimental full-scale test studies conducted in the past revealed that the highest wind force reactions took place when wind approached the front face of the traffic signals (0°).
4.2 Results
Various span lengths seen in the field can be simulated using the short-span-with-springs numerical model prior to aerodynamic instability occurring. The required longitudinal spring stiffness that corresponds to a specific lateral flexibility (perpendicular to the plane of cables) of a span length in the field is calculated with an independent spring stiffness spreadsheet developed and embedded within ANSYS Workbench. The corresponding longitudinal spring stiffness is automatically populated in the longitudinal spring detail box within ANSYS Mechanical. This spreadsheet was developed based on calculations that were contained in wind testing of span-wire traffic signal systems (Irwin et al., 2016).
The solution types that were specified for the long- and short-span numerical models were selected to allow for direct comparison of the results from each model and also for comparison with the results that were obtained from the tests performed at the WOW on long- and short-span full-scale span-wire traffic signal assemblies. Solution probes were placed in the numerical models, such as force reaction probes at the end of the line elements that represent the catenary and messenger cables and inclination and acceleration probes placed on the body elements representing the traffic signals. The location of the force reaction, inclination, and acceleration probes are the same in both models.
The short-span model results (i.e., total mean drag, total mean lift forces, mean inclinations, and wire deflections) were compared with the corresponding results obtained from the long-span model that represents a 72.6 ft span-wire traffic signal assembly. There was good agreement of total mean forces, mean inclinations, and wire deflections from each model, which serves as validation and reason for the use of the short-span-with-springs model to obtain comparable results to long spans.
Graphs for total mean drag and total mean lift forces versus wind speed for long- and short-span numerical models are displayed in Figures 14A,B. As expected, drag and lift forces for the long- and short-span models increase as wind speed increases.

Figure 14. Total mean (A) drag and (B) lift forces vs. wind speed for long- and short-span models.
Figure 15 exhibits a graph for signal inclinations versus wind speed for short- and long-span numerical models. As expected, signal inclination for short- and long-span models increases as wind speed increases. Data sets for forces and signal inclinations versus wind speed for both models show good agreement. Therefore, this verifies that the short-span-with-springs model can be used to obtain behavior similar to that of the long span. The short-span-with-springs model can simulate various span lengths found in the field before aerodynamic instability occurs.
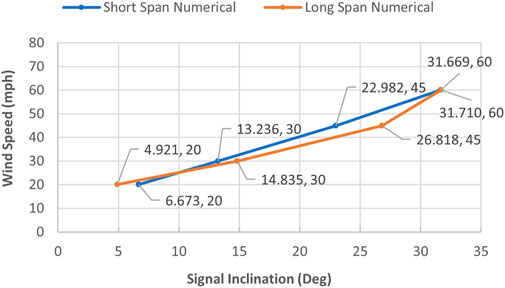
Figure 15. Signal inclinations vs. wind speed for short- and long-span models.
Graphs for inclination versus drag and lift coefficients per corresponding wind speed for short and long span models, respectively, are shown in Figures 16A,B. Drag coefficient CD decreases as signal inclination angle increases and lift coefficient CL increases as signal inclination angle increases up to a certain point. CD and CL vary based on inclination angle of the signals. Therefore, when designing span wire assemblies, it cannot be assumed that either CD or CL remain constant as the signal inclination angle changes. Drag coefficient CD decreases as the signal inclination angle increases, and lift coefficient CL increases as the signal inclination angle increases up to a certain point. CD and CL vary based on the inclination angle of the signals. Therefore, when designing span-wire assemblies, it cannot be assumed that either CD or CL remain constant as the signal inclination angle changes.
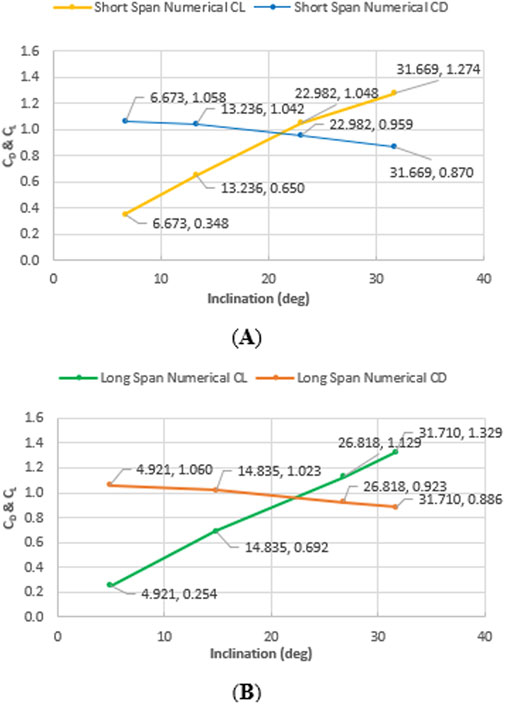
Figure 16. Inclination vs. drag and lift coefficients per wind speed for (A) short- and (B) long-span models.
Figures 17A,B displays two graphs for inclination versus CD and CL for long- and short-span numerical models and for the long- and short-span full-scale span-wire traffic signal assemblies tested at the WOW, respectively. The drag CD and lift CL coefficients for the numerical models (long and short) show good agreement with the CD and CL values for the full-scale span-wire traffic signal assemblies (long and short), respectively.
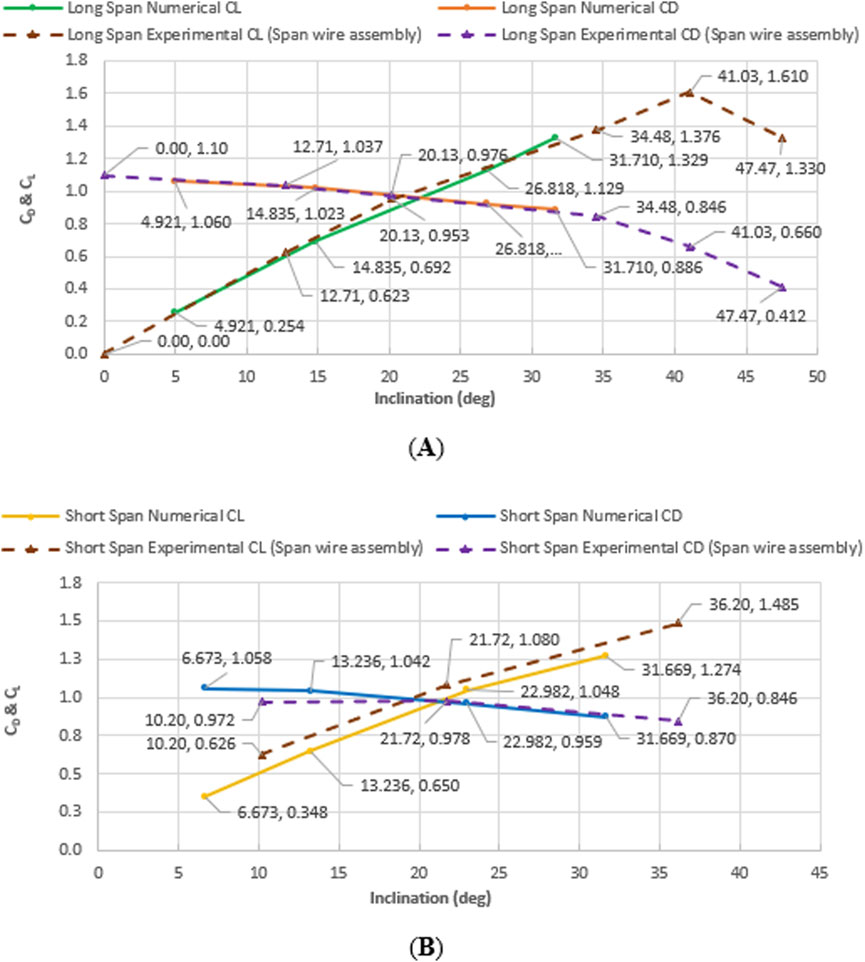
Figure 17. Inclination vs. drag and lift coefficients per wind speed for (A) long- and (B) short-span models and full-scale span-wire assemblies.
Figures 18A,B displays two graphs for inclination versus CD and CL values for long- and short-span numerical models and for a full-scale special rig with a single 3-section traffic signal firmly attached to a horizontal post, pre-set to a specific inclination angle, and tested at the WOW. The drag CD and lift CL coefficients for the numerical models (long and short) and the CD and CL values for the full-scale special rig show that CD decreases as inclination increases, and CL increases as inclination increases. However, the level of agreement of the data sets between the long- and short-span numerical models and the full-scale special rig is not comparable to the level of agreement between the long- and short-span numerical models and the long- and short-span full-scale span-wire assemblies. A reason for this could be that the long- and short-span numerical models and long- and short-span full-scale span-wire assemblies contained the same signal configuration: two 3-section signals and one 5-section signal attached to the catenary and messenger cables. In addition, the traffic signals that were attached to the cables would tend to move backward and forward with the applied wind, changing the total frontal area exposed to oncoming wind. However, the full-scale pre-set inclination setup only contained one 3-section signal that was firmly attached to a horizontal bar and pre-set to an inclination angle (Figure 19; Matus, 2018b).
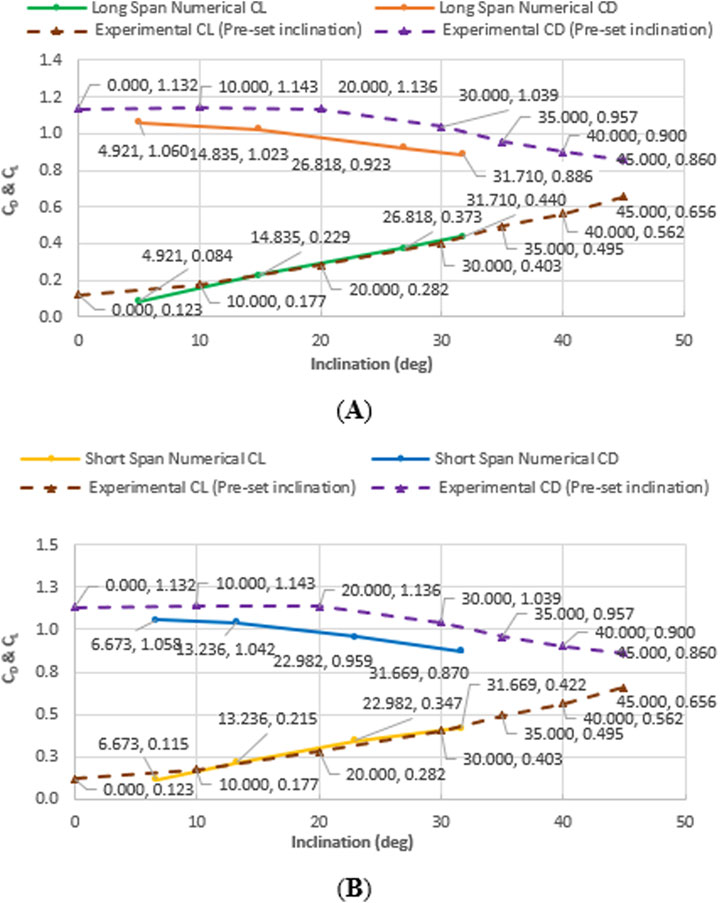
Figure 18. Inclination vs. drag and lift coefficients per wind speed for (A) long- and (B) short-span models and full-scale special rig [pre-set inclination (Matus, 2018a)].
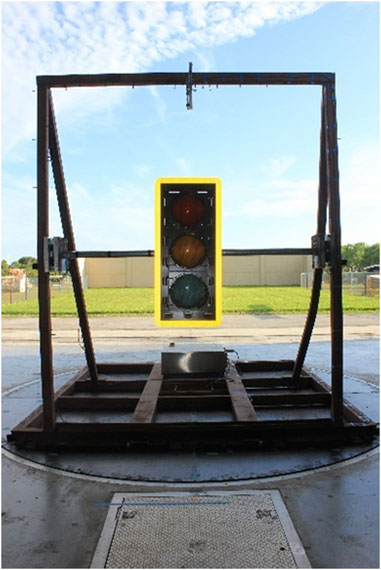
Figure 19. Full-scale special rig [pre-set inclination (Matus, 2018b)].
In addition, the total frontal area (frontal area of 3-section signal only, not including the frontal area of the horizontal bar) exposed to oncoming wind for the full-scale pre-set inclination setup remained constant. However, the full-scale pre-set inclination setup did not contribute to major differences in lift values compared to the long- and short-span models.
Figure 20 shows a graph for messenger wire deflections versus wind speed for short- and long-span numerical models. The wire deflections from each model show good agreement. As expected, wire deflections for short- and long-span models increase as wind speed increases.
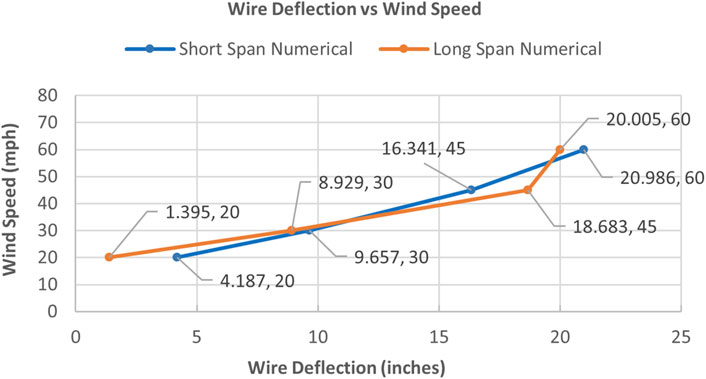
Figure 20. Wire deflections vs. wind speed for short- and long-span models.
The numerical models that were developed can evaluate span-wire traffic signal assemblies exposed to wind forces before aerodynamic instability occurs. The models allow for the evaluation of forces, inclinations, and wire deflections. The features of the numerical models are listed below.
1. Wind forces or pressures can be applied to the models from the front (0°) or from the back (180°).
2. Different magnitudes of wind force or pressure can be applied.
3. Various span lengths found in the field can be accurately simulated and evaluated prior to aerodynamic instability occurring. Note that this feature only applies to the short-span-with-springs model.
4. Various hangers can be evaluated.
5. Various signal geometries can be evaluated.
6. Different cable diameters can be inputted.
7. An iterative approach using the long- and short-span models was used to zero in on a new inclination. This approach can predict signal inclinations per corresponding CD and CL values.
Note: The numerical models presented are limited in that they are not able to evaluate the effects of aerodynamic instability that typically occurs with span-wire traffic signal assemblies that are exposed to wind-induced forces from wind speeds between 70 mph and 120 mph (Zisis et al., 2019a).
5 Buffeting theory analysis
A theoretical buffeting analysis of a span-wire traffic signal assembly was also performed. This analysis evaluated the signal assembly’s buffeting response caused by fluctuating wind velocity and generated the root mean square (rms) of the acceleration and deflection in the along-wind direction (wind approaching the front face of signals) as well as the mean and peak values for accelerations and deflections. This analysis was performed for wind speeds ranging from 30 mph to 130 mph. The analytical results were compared to experimental results obtained from full-scale tests conducted at the Wall of Wind (WOW). The results are compared in the following sections.
5.1 Analysis input parameters
Listed below are a few bullet points with some of the input parameters for this analysis and a short description of each, including assumptions and limitations:
1. The buffeting analysis was conducted for a one 5-section and two 3-section configuration span-wire traffic signal assembly. The typical signal housing, visor, backplate, disconnect box, and hanger were assumed for purposes of mass and frontal area.
2. The buffeting analysis was carried out for normal winds to the frontal area of the span-wire assembly (or an approach angle of 0°).
3. Wind speeds utilized for the analysis were 30 mph, 40 mph, 55 mph, 70 mph, 100 mph, and 130 mph, which represent the mean wind speed considered at the mean height of the traffic signals.
4. The mass and frontal area of one 5-section, two 3-section signals, disconnect boxes, backplates, and hangers were considered as one lump mass and one lump area, respectively.
5. The wind turbulence was assumed to be the same throughout the frontal area of the signal assembly.
6. The mass and natural frequency of the span-wire signal assembly were kept constant for the range of wind speeds analyzed.
5.2 Analysis formulations
The buffeting analysis generated the variance and standard deviation (rms) of acceleration and deflection. The mean and peak of acceleration and deflection were also determined as part of this analysis. The first step in determining the rms values is to consider the power spectrum of deflection Sq in its simplest form, as represented by Equation 1 (Irwin, 2016). The density of air ρ is in lb/ft3, Cxo is the drag coefficient, A is the frontal area in ft2, U is the mean wind speed in ft/s, MG is the total mass of the traffic signal assembly in lbf, ωo is the angular natural frequency in rad/s, n is the load or forcing frequency, and no is the natural frequency of the traffic signal assembly in Hz. The total damping ratio of the traffic signal assembly (sum of structural and aerodynamic damping) is ζtot, and H (n/no, ζtot) is the mechanical admittance function. The mechanical admittance function can be expressed in terms of angular or linear frequencies and is expanded and shown in Equation 2. The lateral aerodynamic admittance function with respect to load frequency is χy(n), and the two-dimensional aerodynamic admittance function with respect to load frequency is χ2D(n). Finally, Su(n) is the power spectrum of wind speed (Irwin et al., 1996; Azzi et al., 2021; 2022)
The variance of deflection σ2q is computed by integrating the power spectrum of deflection Sq throughout all relevant frequencies. The rms of deflection σq is then computed by taking the square root of the variance of deflection σ2q. Equation 3 and Equation 4 present the variance of deflection σ2q and the rms of deflection σq, respectively.
The background B and resonant R responses are presented in Equations 5, 6, respectively. All terms in the equations below have been previously described, except Iu, which is the magnitude of the wind turbulence in the longitudinal direction, and σu2 is the variance of wind speed in the longitudinal direction.
The product of the lateral aerodynamic admittance function χy(n) and the two-dimensional aerodynamic admittance function χ2D(n) is expressed in Equation 7. The ratios ηb, ηd, and ηL are related to the width b, depth d, and length L of the span-wire traffic signal assembly, respectively. In this analysis, θ was equal to 0.85. They are expressed in Equations 8–10.
The longitudinal integral length scales of turbulence are xLu, yLu, and zLu, along the x, y, and z-axis, respectively. That is to say, xLu is along width b (horizontal dimension parallel to incoming wind), yLu is along length L (horizontal dimension normal to incoming wind), and zLu is along depth d (vertical dimension normal to incoming wind) of the span-wire traffic signal assembly.
The von Karman spectrum term located in the background and resonant response equations above is expanded and displayed in Equation 11. In the buffeting analysis performed, this equation was in terms of n forcing frequency and no natural frequency of the span-wire traffic signal assembly for the background and resonant response equations, respectively.
The total damping ratio of the span-wire traffic signal assembly is expressed as the sum of the structural damping ratio and the aerodynamic damping ratio. It is displayed in Equation 12.
The rms of acceleration σacc can be derived from the rms of deflection fluctuations σq (Equation 4) by multiplying σq by ωo2. This is based on the relationship of acceleration and displacement, q = accel./(2πn)2 (How to compute Random acceleration, velocity, and displacement values from a breakpoint table, 2018). The rms of acceleration σacc is displayed in Equation 13.
Mean and total peak acceleration values were generated. The mean acceleration ā is in ft/s2, converted to in/s2, and displayed in Equation 14. The mean force
The mean force
Mean and total peak deflection values were also generated. The mean deflection q̄ is in ft, converted to degrees, and displayed in Equation 19. The mean force
The mean force
5.3 Calculation of RMS of deflection and acceleration
The calculations for the theoretical buffeting analysis were carried out using MATLAB. A script was developed utilizing the input parameters and the formulations described in Section 5.1, Section 5.2, respectively. The script was written to integrate six sections; each section of the script represents the analysis for one of the six wind speeds (i.e., 30 mph, 40 mph, 55 mph, 70 mph, 100 mph, and 130 mph) plus the input parameter changes that accompany changes in wind speed, (i.e., drag coefficient Cd, aerodynamic damping ζa, and turbulence intensity Iu). The format of each section of the script is relatively the same and presents the input parameters pertaining to its corresponding wind speed at the beginning of the section script.
After the input parameters, the background response equations were written into the script using Equations 5, 7–11. The background response calculations used a for-loop to cycle through forcing frequencies from 0.1 Hz through 3 Hz at a step increase of 0.01 Hz. The control statement of the for-loop is the range of forcing frequencies. The body of the for-loop consists of the Von Karman spectrum, the equations for the ratios ηb, ηd, ηL (which was used for the computations of the lateral aerodynamic admittance function χy(n), and the two-dimensional aerodynamic admittance function χ2D(n)) and the background response equation, which is the product of the previous terms. When the for-loop ends, the range of frequencies n is cleared. The same range of frequencies is defined again for n and then followed by the trapz function (trapezoidal numerical integration), which was then used to integrate the background response expression.
The resonant response equations were then written in a manner similar to that of the background response equations, except for the natural frequency no of the span-wire assembly used in these calculations. The natural frequency no remains constant through all wind velocities. Thus, no for-loop needs to be included in the code for these calculations because no cycling through of frequencies is required, as was the case in the background response calculations. Equations 6, 7 through Equation 11 were written into the script for the resonant response calculations. After the background and resonant response equations are written in the script, the rms of acceleration σacc and deflection σq equations were written in the script accounting for the resonant and background responses (B and R). The rms of acceleration σacc and the rms of deflection σq are calculated by including Equations 13, 4, respectively, in the script.
The mean and total peak acceleration and deflection values were also generated by the script. The mean acceleration ā was generated by Equation 14, and the total peak acceleration was generated by Equation 15. The mean and total peak deflection were generated by using Equations 19, 21, respectively.
5.4 Results
The analytical results that were generated were compared to the results obtained from experimental testing of a full-scale span-wire traffic signal assembly. Comparisons of the along-wind analytical and experimental rms of acceleration and the rms of deflection are displayed in Figures 21A,B, respectively.
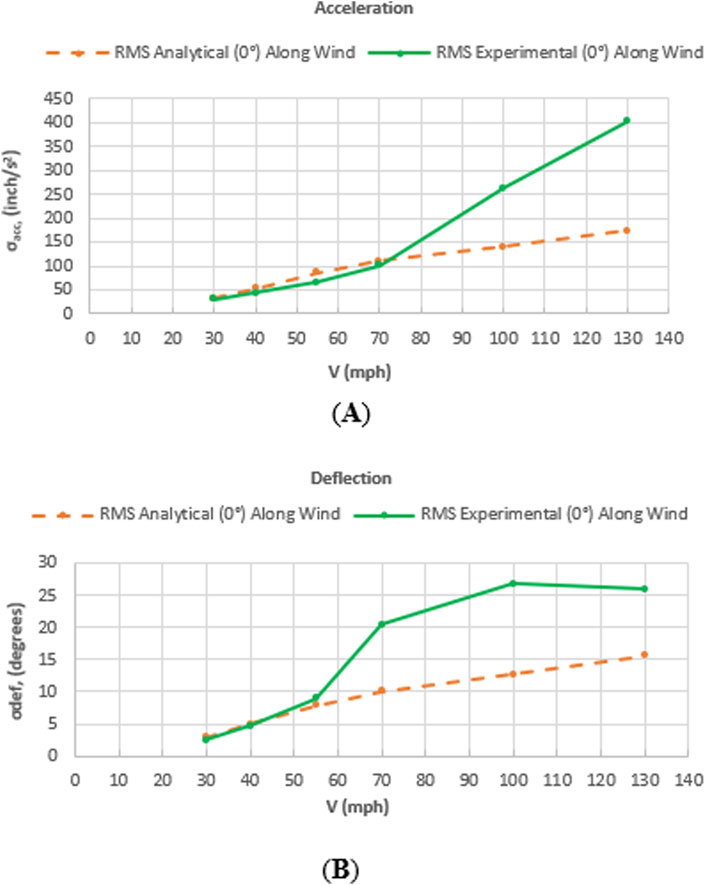
Figure 21. (A) Analytical and experimental rms of acceleration and (B) deflection at 0°.
As can be seen in both figures, the experimental values for both the rms of acceleration and the rms of deflection are slightly lower than the analytical values up to a certain point as wind speed increases. A reason for this could be the slight amount of cross-wind response that occurred at the lower wind velocities during the experimental testing of the full-scale assembly, which decreased some of the response in the along-wind direction. In addition, the buffeting theory analysis only captures the along-wind response and does not capture the effect of the cross-wind response.
However, beyond the lower wind speeds, the full-scale assembly was noticed to experience aerodynamic instability during the experimental test, increasing acceleration and deflection, which offers one reason for which the experimental rms of acceleration and the rms of deflection values can be seen to increase, overtaking the analytical values. An item to note is that the rate of increase of the experimental rms of the acceleration graph lags slightly behind the rate of increase of the experimental rms of the deflection graph. The reason is that as aerodynamic instability of the signal assembly takes place, the deflection response increases first, quickly followed by the acceleration response of the signal assembly.
In addition, buffeting theory analysis does not capture the effect of aerodynamic instability of structures when wind speed increases, as was observed in full-scale assembly testing. This can generate lower analytical acceleration and deflection results. Another item to note is that buffeting theory analysis does not capture turbulence that is created by the full-scale assembly when subjected to wind. This would also produce lower analytical acceleration and deflection results. These are other reasons why the experimental values are higher at higher wind speeds, as seen in the graphs below.
In addition, the along-wind analytical and experimental mean and peak values for acceleration and deflection were computed and are displayed along with the rms values in Figures 22A,B, respectively. As can be expected, mean, peak, and rms acceleration and deflection values increase linearly as wind speed increases. An item to note with the mean and peak results, as was the case with the rms results, is that the rate of increase of the experimental acceleration graph lags slightly behind the rate of increase of the experimental deflection graph. The reason is that, as aerodynamic instability of the signal assembly takes place, deflection increases first, quickly followed by the acceleration of the signal assembly.
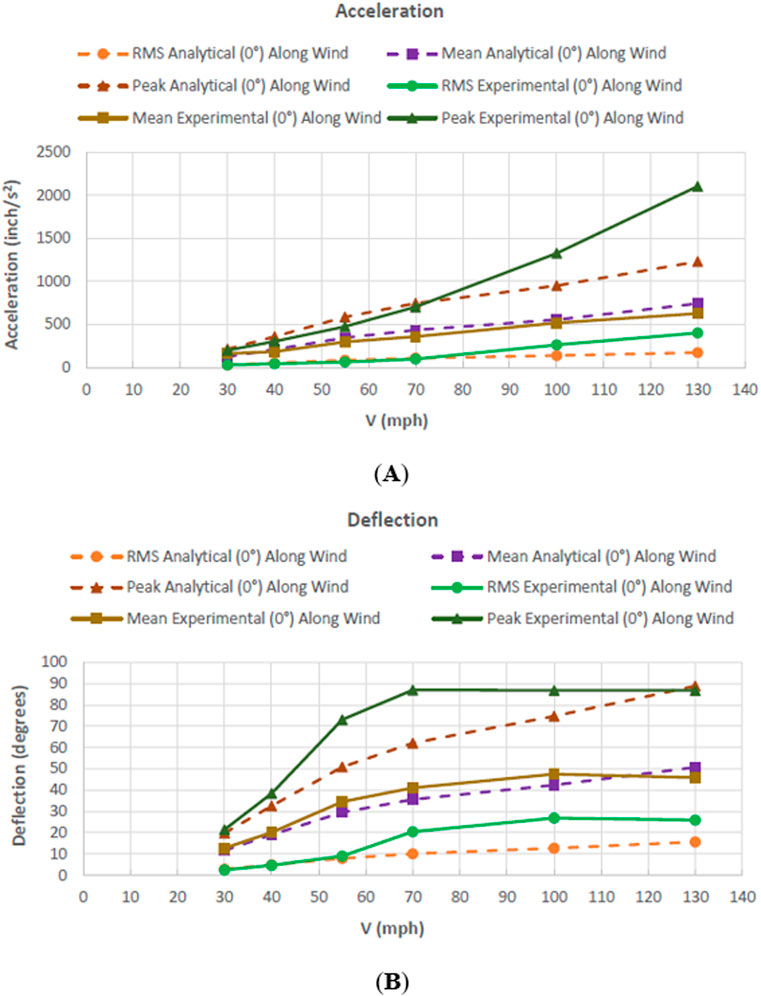
Figure 22. (A) Analytical and experimental mean, peak and rms acceleration and (B) deflection values at 0°.
Moreover, as was expected, rms acceleration and deflection values are lower than both mean and peak acceleration and deflection values. Peak values are the highest at each corresponding wind speed.
6 Conclusions
This investigation was carried out to better understand the effect of the standard installation procedures and properties on the overall response of the span-wire traffic signal assemblies. The different parameters (cable forces, signal accelerations, and inclinations) were measured by load cells, accelerometers, and inclinometers (Figure 4). The cable forces (drag, lift, and tension) were observed to increase with increasing wind speed. It can be concluded that the cable that experiences the highest drag, lift, and tension forces is the messenger cable. The configuration that yielded lower cable drag forces, lift forces, and tension forces was the case set with a 7% Sag. Counterintuitively, the case with a relaxed messenger cable tension resulted in higher cable forces. Signal assembly inclinations were also observed to increase as wind speed increased. The across-wind inclinations were negligible; however, at wind speeds of 60 mph, the limit of inclination of 27.5° (Cook et al., 2012) was exceeded. Although there is an effect on the mean and peak inclinations experienced by the traffic signals induced by the changes in installation parameters, the deviation in inclinations is not significant, being approximately 6°. The rms of accelerations experienced by the traffic signals increased as tests progressed. The signals experience considerably higher tangential accelerations than radial and across-wind. The 7% Sag case was observed to induce lower accelerations on both traffic signals. The drag forces decreased at any given wind speed, while the opposite was observed for lift coefficients. As there is limited information on the safe design of these systems (Cook et al., 2012), these results aim to provide more insight into increasing the survivability and resiliency of these systems to diminish dangerous situations for motorists (Sivarao et al., 2010). The numerical models (long span and short span) that were also developed can provide a chance to evaluate reaction forces, signal inclinations, and wire deflections at any user-defined location on the span-wire signal assembly prior to aerodynamic instability taking place.
The buffeting theory analysis that was performed showed that at lower wind speeds, the analytical rms of acceleration and deflection values were a bit higher than their experimental counterparts. This was due to the cross-wind response that the full-scale assembly underwent. The cross-wind response tends to activate multiple modes of vibration, which reduces the response captured in the along-wind direction. Moreover, buffeting theory analysis does not factor in the cross-wind response, producing somewhat higher along-wind analytical values. However, at higher wind speeds, aerodynamic instability takes place during the test. As this takes place, experimental acceleration and deflection increased at a higher rate than the analytical values. Buffeting theory analysis does not factor in aerodynamic instability as wind speed increases, producing lower analytical results. The benefit of performing a buffeting analysis is that it provides important information (rms, mean, and peak values for acceleration and deflection) on the behavior of span-wire traffic signal assemblies to fluctuating wind speed. It assesses the intensity of vibration that these assemblies sustain.
Data availability statement
The original contributions presented in the study are included in the article/supplementary material; further inquiries can be directed to the corresponding author.
Author contributions
BB: formal analysis, investigation, software, validation, visualization, writing – original draft, and writing – review and editing. IZ: project administration, resources, supervision, and writing – review and editing. MM: formal analysis, investigation, software, validation, visualization, writing – original draft, and writing – review and editing. ZA: software and writing – review and editing. PI: supervision and writing – review and editing.
Funding
The author(s) declare that financial support was received for the research and/or publication of this article. The authors would like to acknowledge the financial support provided by the Florida Department of Transportation (FDOT) and the U.S. Department of Transportation–Federal Highway Administration, which provided the doctoral degree (Ph.D.) candidate MM with the Dwight David Eisenhower Transportation Fellowship Program Fellowship under the grant agreement 693JJ32045135.
Acknowledgments
The opinions, findings, and conclusions expressed in this publication are those of the authors and not necessarily those of the State of Florida Department of Transportation nor the U.S. Federal Highway Administration.
Conflict of interest
Author ZA was employed by DDA Forensics.
The remaining authors declare that the research was conducted in the absence of any commercial or financial relationships that could be construed as a potential conflict of interest.
Generative AI statement
The author(s) declare that no Generative AI was used in the creation of this manuscript.
Publisher’s note
All claims expressed in this article are solely those of the authors and do not necessarily represent those of their affiliated organizations, or those of the publisher, the editors and the reviewers. Any product that may be evaluated in this article, or claim that may be made by its manufacturer, is not guaranteed or endorsed by the publisher.
References
Azzi, Z., Elawady, A., Irwin, P., Chowdhury, A. G., and Abi Shdid, C. (2021). Aeroelastic modeling to study the wind-induced response of a self-supported lattice tower. Eng. Struct. 245, 112885. doi:10.1016/j.engstruct.2021.112885
Azzi, Z., Elawady, A., Irwin, P., Chowdhury, A. G., and Abi Shdid, C. (2022). “Aeroelastic modeling to investigate the wind-induced response of a multi-span transmission lines system.” special issue, mitigation of wind-induced disaster of transmission tower and line structures under extreme loading conditions. Wind Struct. 34 (2), 231–257. doi:10.12989/was.2022.34.2.231
Azzi, Z., Elawady, A., Matus, M., Zisis, I., and Irwin, P. (2019). Buffeting response of span-wire traffic signals using large-scale aeroelastic wind testing. Beijing, China: 15th International Conference on Wind Engineering.
Azzi, Z., Matus, M., Elawady, A., Zisis, I., and Irwin, P. (2018). Large-scale aeroelastic testing to investigate the performance of span-wire traffic signals. Miami, FL: 5th American Association for Wind Engineering Workshop.
Azzi, Z., Matus, M., Elawady, A., Zisis, I., Irwin, P., and Chowdhury, A. G. (2020). Aeroelastic Testing of span-wire traffic signal systems. Front. Built Environ. 6. doi:10.3389/fbuil.2020.00111
Balaguru, K., Chang, C.-C., Leung, L. R., Foltz, G. R., Hagos, S. M., Wehner, M. F., et al. (2024). A global increase in nearshore tropical cyclone intensification. Earth’s Future 12, e2023EF004230. doi:10.1029/2023EF004230
Chowdhury, A. G., Zisis, I., Irwin, P., Bitsuamlak, G., Pinelli, J.-P., Hajra, B., et al. (2017). Large-scale experimentation using the 12-fan wall of wind to assess and mitigate hurricane wind and rain impacts on buildings and infrastructure systems. J. Struct. Eng. 143. doi:10.1061/(asce)st.1943-541x.0001785
Cook, R. A., Masters, F., Rigdon, J., and Tillander, T. (2012). Evaluation of dual cable signal support systems with pivotal hanger assemblies. Final Rep. Contract No BDK75 977-1037.
Deng, E., Xiang, Q., Chan, J. C. L., Dong, Y., Tu, S., Chan, P. W., et al. (2025). Increasing temporal stability of global tropical cyclone precipitation. npj Clim. Atmos. Sci. 8, 11. doi:10.1038/s41612-025-00896-2
Florida Department of Transportation (FDOT) (2005). Hurricane response evaluation and recommendations. Version 5.
Holmes, J. D. (2007). Chapter 6 Dynamic Response of Structures to Wind Loading. Wind Loading of Structures (2nd ed.). Taylor & Francis.
How to compute Random acceleration, velocity, and displacement values from a breakpoint table (2018). Retrieved from: https://vibrationresearch.com/wp-content/uploads/2018/04/RandomRMSCalculation.pdf.
Irwin, P., Zisis, I., Berlanga, B., Hajra, B., and Chowdhury, A. G. (2016). “Wind testing of span-wire traffic signal systems,” in Resilient infrastructure.
Matus, M. (2018b). “Experimental investigation of wind-induced response of span-wire traffic signal systems.” doi:10.25148/etd.FIDC006546
Matus, M. (2018c). Special rig with fixed inclination [Photograph]. Miami, FL: Florida International University.
McDonald, J. R., Mehta, K. C., Oler, W., and Pulipaka, N. (1995). Wind load effects on signs, luminaires and traffic signal structures. Lubbock, TX: Department of Transportation.
Sivarao, S. K., Esro, M., and Anand, T. J. (2010). Electrical and mechanical fault alert traffic light system using wireless technology. Int. J. Mech. Mechatronics Eng.
Zisis, I., Irwin, P., Berlanga, B., and Chowdhury, A. G. (2016). “Assessing the performance of vehicular traffic signal assemblies during hurricane-force winds,” in International conference on natural hazards and infrastructure. Greece: Chania.
Zisis, I., Irwin, P., Chowdhury, A. G., Matus, M., Azzi, Z., Estephan, J., et al. (2019a). Assessment of the performance of vehicular traffic signal assemblies during hurricane force winds. Final Rep. Contract No BDV29 977-1027.
Zisis, I., Irwin, P., Chowdhury, A. G., Matus, M., Azzi, Z., Estephan, J., et al. (2019b). Development of a test method for assessing the performance of vehicular traffic signal assemblies during hurricane force winds. Final Rep. Contract No BDV29 977-1020.
Zisis, I., Irwin, P., Hajra, B., Chowdhury, A. G., and Matus, M. (2017). “Experimental assessment of wind loads on span-wire traffic signals,” in The 13th Americas Conference on wind Engineering. Gainesville: FL.
Keywords: span-wire traffic signal, wind tunnel, tropical storm, wind response, buffeting analysis, numerical model
Citation: Berlanga BA, Zisis I, Matus M, Azzi Z and Irwin PI (2025) Parametric study to investigate span-wire traffic signal system performance during tropical storms. Front. Built Environ. 11:1558829. doi: 10.3389/fbuil.2025.1558829
Received: 11 January 2025; Accepted: 04 April 2025;
Published: 02 June 2025.
Edited by:
E. Deng, Hong Kong Polytechnic University, Hong Kong SAR, ChinaReviewed by:
Yuncheng He, Guangzhou University, ChinaYue Dong, Hong Kong Polytechnic University, Hong Kong SAR, China
Copyright © 2025 Berlanga, Zisis, Matus, Azzi and Irwin. This is an open-access article distributed under the terms of the Creative Commons Attribution License (CC BY). The use, distribution or reproduction in other forums is permitted, provided the original author(s) and the copyright owner(s) are credited and that the original publication in this journal is cited, in accordance with accepted academic practice. No use, distribution or reproduction is permitted which does not comply with these terms.
*Correspondence: Ioannis Zisis, aXppc2lzQGZpdS5lZHU=