 Iolanda-Gabriela Craifaleanu
- 1Department of Reinforced Concrete Structures, Technical University of Civil Engineering Bucharest, Bucharest, Romania
- 2National Institute for Research and Development in Constructions, Urbanism and Sustainable Spatial Development, URBAN-INCERC, Department “National Network for the Seismic Monitoring and Protection of Building Stock (I.O.S.I.N.)”, Bucharest, Romania
A significant number of studies on seismic jerk have been performed worldwide in the past few years, dealing with its various features and applications in the assessment and mitigation of earthquake effects on buildings. However, there are only a few studies based on a regional approach, aimed to investigate jerk characteristics and impact for a particular seismic source, geological setting and local built environment features. The present research focuses on the Vrancea seismogenic source in Romania. Characterized by a very peculiar subduction mechanism, with a seismic activity unique in Europe and rarely found in other parts of the world, Vrancea has generated, only in the past half century, four destructive earthquakes with moment magnitudes greater than 6, that affected large areas, including some within the neighboring countries. By using a database of over 300 accelerograms, a detailed study of ground jerk characteristics, including their mapping, was conducted. Special consideration was given to the Mw = 7.4 4 March 1977, earthquake, the strongest of all analyzed. The only complete three-component accelerogram that is available from this event led to a radical revision of the national seismic code, due to its unexpected features. The results of the current research, to the author’s knowledge the first one on this topic addressing the Vrancea source, are meant to shed a new light on some less-known characteristics of ground motions recorded from strong earthquakes that hit Romania during the past 5 decades and to provide information that would further substantiate, on a more extensive scientific basis, the seismic risk assessment of the entire region. This first phase of the study is planned to be continued with an analysis of jerk impacts at structure level, as well as with the investigation of other related topics, addressing current challenges in the field, as presented in the final section of the article.
1 Introduction
The time derivative of acceleration, commonly known as jerk, or jolt, and measured in m/s3, is largely used at present in various fields, among which mechanical engineering, biomechanics, transportation systems, robotics and earthquake engineering. A significant number of studies on jerk have been performed worldwide in the past few years, and provisions on jerk, especially concerning mechanical systems, are already implemented in several ISO standards (Hayati et al., 2020), and also in some European and national standards, such as (CEN, 2024) or (ANSI, 2022). The standard ISO 2041:2018 (ISO, 2018) designates jerk as “rate of change of acceleration”. Given the generally adverse effects of jerk on mechanical systems and its negative impact on the comfort of passengers of buses, lifts, escalators, moving walkways, ships, etc., the standards provide specific upper thresholds for this parameter.
A systematic overview on jerk in science and engineering (Hayati et al., 2020) identifies 21 categories of jerk applications, mentioning, among others, those in seismic analysis, shock response spectra and structural health monitoring. In earthquake engineering, jerk represents a point of interest for many applications. A comprehensive review performed by Vukobratović and Ruggieri (2022), focusing on this field, identifies four main directions of study: a) structures and non-structural components, b) structural control, isolation and dampers, c) ground motions and acceleration data, and d) sensors and monitoring, with the third direction being of particular interest to the work presented in the next sections this article. As resulting from the cited reviews and from the author’s own literature screening, work in this field covers a large variety of topics, among which: numerical aspects of jerk computation and accelerogram correction (Boore and Bommer, 2005; Nakazawa et al., 2003; Steiner, 2021), use of ground motion jerk, together with other parameters, in earthquake early warning systems (Oh et al., 2008; Horiuchi et al., 2009) or as a seismic intensity measure (Yaseen et al., 2020), complex characterization of ground motion for significant earthquakes (Dai et al., 2009; Tong et al., 2005), prediction, based on jerk, of relative velocity spectra from pseudo velocity spectra (Malushte, 1987), and influence on large seismic accelerations and jerks on the malfunctioning of high-rate GPS units mounted on buildings for structural health monitoring (Wang et al., 2012). A significant number of works are dedicated to elastic and inelastic jerk response spectra and floor spectra, given their importance in establishing the global and local seismic effects on structures (Vukobratović, 2015; 2022; Taushanov 2018; 2019; Papandreou and Papagiannopoulos, 2019; He et al., 2015). Jerk is also used, in various approaches, in the identification and localization of seismic damage in buildings and other structures (An et al., 2013; Mohamed and Tahar, 2017; Mehboob and Zaman, 2021; Segawa et al., 2000) and in assessing impulsive actions due to jerk, with proposals for better detailing of masonry structures, aimed at resisting these actions (Mariani and Pugi, 2023). A special challenge for the studies in the field is to discern between the damaging effects of seismic jerk and, respectively, seismic acceleration. Generally, jerk affects structures in a lower measure than acceleration and its effects are significant only for particular types of structures. However, it is important that these specific situations are identified and studied.
The effects on buildings of jerk resulting from strong earthquakes, especially those generated in the Vrancea area, has gained significant research attention in recent years in Romania. However, several studies on the effects of earthquakes on buildings, as well as on jerk, were published much earlier. A recent reference work, highlighting historical information, theoretical bases of jerk and two study cases (Sofronie, 2017) reveals that the earliest scientific Romanian publication on jerk was authored by Beleș (1936), focusing on the role of this parameter in dynamics. More recently, studies highlighting the effects on historical monuments of jerk induced by earthquakes that hit Romania in the past were conducted, with particular focus on seismic damage in Orthodox churches (Sofronie et al., 2018; Irimia and Sofronie, 2021; Irimia, 2021 etc.), but also in buildings with ornamental rooftop appendages. With a peculiar three-lobed shape and one or more steeples, many Orthodox churches have suffered serious damage from Vrancea earthquakes. The referenced works document the cases of some landmark churches located in various Romanian cities, assessing the dynamic characteristics resulting from their specific shape, proportions and construction and highlighting the sensitivity of steeples to jerk effects, based on damage recorded in historical archives. The lessons learned from the past damage were applied in the design of a landmark cathedral, recently erected in Bucharest. Yet, the approach did not include analytical computations of the effective jerk response, based on recorded ground motions.
While extensive research has been conducted on seismic jerk, at present, to the author’s knowledge, there are only a few studies based on a regional approach, i.e., aimed to investigate jerk characteristics and impact for a particular seismic source, geological setting and local built environment features. Vrancea earthquakes are generated by a very peculiar subduction mechanism, with a seismic activity unique in Europe and rarely found in other parts of the world. Propagation patterns are strongly asymmetrical, and directivity varies from one event to another. For Romania, an earthquake-prone country, a deeper knowledge on the jerk characteristics of ground motions induced by strong Vrancea earthquakes would provide essential information for better understanding the effects of past earthquakes and for a more extensive scientific basis for the seismic risk assessment of the entire region. Such research would contribute to the general knowledge about seismic jerk as well.
This article presents the first phase of a larger research program, based on the processing and interpretation of a database of over 300 ground motions recorded from the strongest four Vrancea earthquakes that hit Romania during the past 5 decades. The current investigation explores ground motion jerk, its correlations with other key ground motion parameters (peak ground acceleration, Arias intensity, frequency bandwidth indicators), as well as its spatial distribution. Special consideration is given to the analysis of the single available complete record 4 March 1977, earthquake, which practically reset the national seismic code provisions, due to its unexpected features. Additionally, other related aspects are revealed and discussed, such as the relationship between the time of occurrence of peak ground jerk and peak ground acceleration and the influence of site conditions. As far as the author is aware, no other study on these topics has been conducted to date for the Vrancea source. Given that, since 1990, no larger magnitude event has occurred in Romania, the analysis of the mentioned records represents the only source of information for assessing the specific seismic context and preparing for the next strong earthquake.
2 Materials and methods
2.1 Seismicity of the Vrancea zone
Romania is affected by earthquakes originating from various seismogenic zones, of which Vrancea, the subject of this study, is the one with the highest destructive potential, representing a potential hazard not only for Romania, but also for some broader areas of Eastern and Southeastern Europe (Mäntyniemi et al., 2003). Situated at the Carpathian Arc bend, at the intersection of three tectonic units, the East European Plate, the Intra-Alpine subplate and the Moesian subplate (Constantinescu et al., 1976), the zone is characterized by a specific subduction mechanism, generally described like a relic slab sinking into the mantle (Oncescu, 1984; Wenzel et al., 1999; Petrescu and Enescu, 2025). The epicenters are located in a very small area, with the size of about 30 km by 70 km, representing the projection on Earth’s surface of an almost vertical narrow lithospheric body (Zaharia et al., 2009; Bala et al., 2021). Vrancea is one of the few so-called earthquake nests on the globe, i.e., zones of intermediate-depth seismicity concentration, characterized by high rates of occurrence and isolated from adjacent seismic activity (Prieto et al., 2012). Other observed and studied earthquake nests are those located in Hindu Kush, Afghanistan, and Bucaramanga, Columbia.
Vrancea is known historically for generating destructive earthquakes every few decades, the strongest seismic activity being concentrated at intermediate depths, i.e., between 60 and 200 km (Radulian et al., 2000). During the 20th century, Vrancea generated 21 earthquakes with moment magnitudes, Mw, larger than 6 (INCDFP, 2025), with four of them, which are the object of the studies presented in the following, occurring in the past half-century, between 1977 and 1990 (Table 1). The Mw = 7.4 4 March 1977, earthquake led to the death of 1,578 people - of which about 1,400 only in Bucharest, 11,321 injured, 32,900 strongly damaged or collapsed buildings, and incurred economic losses valued at two billion dollars (Georgescu and Pomonis, 2011). According to Georgescu and Pomonis (2012), the Mw = 7.1 30 August 1986, earthquake caused 8 deaths and 317 injuries, while the Mw = 6.9 May 30, 1990, seismic event caused 9 deaths and 296 injuries (in the latter case, predominantly from nonstructural element failures). Significant loss of life, injured people and building damage from the 1977, 1986 and 1990 earthquakes were also reported, according to the same source, in Bulgaria (mostly affected in 1977) and the Republic of Moldova (particularly during the 1986 seismic event).
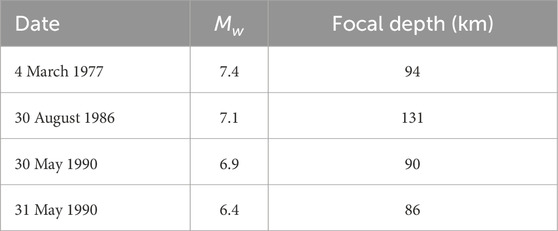
Table 1. Mw > 6 Vrancea earthquakes that occurred in the past half century (INCDFP, 2025).
It is important to note that no other event of comparable magnitude has been recorded since 1990, even though several moderate earthquakes have occurred not only in the Vrancea zone, but also in other seismogenic zones of Romania (Radulian et al., 2000; Enescu et al., 2023; INCDFP, 2025).
Given the very specific characteristics of Vrancea earthquakes, the extent of the areas affected by their occurrence and the lack of more recent records from large-magnitude earthquakes generated by this source, it is essential that existing data is analyzed in depth, to extract as much information as possible, in preparation for the future strong Vrancea earthquake. The studies reported in this article are aligned to this endeavor.
2.2 Ground motion database
A dataset of 316 ground motions was employed in the study, with the distribution by earthquake shown in Figure 1. The ground motion records primarily originate from a database compiled within a joint research project (Seismic Database for Romanian Earthquakes, 2001). The database was later revised (Borcia et al., 2015), and additional ground motion parameters were computed for the existing records, among which the corner (control) period, TC, and the Arias intensity, IA, used in the study as shown in Section 2.3.2.2 of the article. Other ground motion parameters, as those considered for the definition of the frequency bandwidth, were computed for the studies presented in (Craifaleanu, 2011).
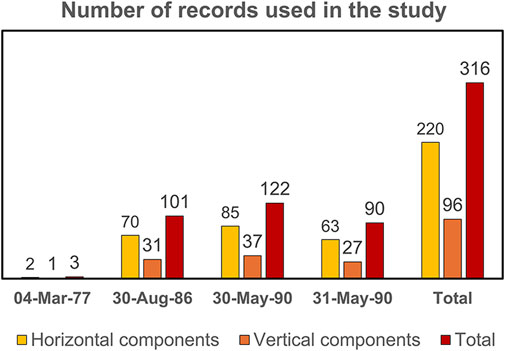
Figure 1. Number of ground motion records used in the study.
Most of the records were obtained from the seismic networks of the National Institute for Building Research, INCERC, at present URBAN-INCERC (61%) and of the National Research and Development Institute for Earth Physics, INCDFP (25%), while the rest was obtained from other networks in Romania and abroad (Republic of Moldova and Bulgaria). A review of the seismic networks in Romania is presented in (Craifaleanu et al., 2011).
As one could notice, a single record was available for the destructive seismic event on 4 March 1977. Even though, at the time of the earthquake, a total of nine strong-motion accelerographs and two seismoscopes were installed in Bucharest and other cities of Romania (Berg et al., 1980; Balan et al., 1982), the only complete accelerometric record was obtained from the Japanese SMAC-B instrument located in the basement of the one-story main building of the National Institute for Building Research, INCERC, in Bucharest. Unfortunately, the other accelerographs either malfunctioned or were not triggered. This event remains, to date, the strongest and the most destructive Vrancea earthquake recorded by modern instruments.
2.3 Jerk computation and data processing
2.3.1 Jerk computation
The employed dataset consists of pre-filtered accelerograms, where the filtering was generally performed using an Ormsby bandpass filter, defined by corner frequencies at 0.15, 0.35, 25, and 28 Hz. A verification of signal-to-noise ratios revealed excellent, good or acceptable values for most of the records. However, given that numerical differentiation of acceleration, used in the computation of jerk, is prone to significant noise introduction, the accelerograms were additionally denoised by applying multi-level wavelet decomposition. This was done using the WaveletDenoising Python class (Detorakis, 2020), based on the open source PyWavelets Python package (Lee et al., 2019). Various wavelets, threshold determination methods and decomposition levels were tested, to eliminate noise while preserving important signal characteristics. The analysis focused on absolute jerk, determined by differentiation of the absolute acceleration.
2.3.2 Directions of investigation
The investigation was structured into five major directions, in the order of their presentation:
‒ An in-depth analysis of the unique complete accelerometric record available from the 4 March 1977, earthquake, to reveal its jerk and jerk-related characteristics, such as impulsive forces.
‒ A study of the correlation of peak ground jerk (PGJ) with some key parameters of ground motion intensity and frequency content and an analysis of other potential factors of influence.
‒ An investigation on the relationship between the times of PGJ and PGA occurrence.
‒ The mapping of PGJ values for the earthquakes on 30 August 1986, and on May 30 and 31, 1990, to investigate their spatial distribution patterns.
‒ An analysis of PGJ directivity, based on a simplified approach.
Details on the prerequisites and methods used in the study are presented in the following.
2.3.2.1 The single complete accelerogram of the 4 March 1977, earthquake
The study of the single complete record available from the Mw = 7.4 4 March 1977, Vrancea earthquake, was considered of a particular importance, as this was the strongest and most destructive of the studied seismic events. This unique record provided the basis for a radical revision of the Romanian seismic design code, as it revealed very large differences between its response spectra and the previously used design spectra, explained the catastrophic effects of the earthquake on specific categories of buildings and highlighted the influence of local site conditions on ground motion spectral content. The jerk characteristics for all three components were analyzed, as well as their relationship with other basic ground motion parameters. In addition, the impulsive content of the record was assessed, based on the computed jerk values.
Supplementary information on the impact of the 4 March 1977, earthquake on the evolution of the Romanian earthquake regulatory framework is available in (Lungu and Craifaleanu, 2010; Georgescu and Pomonis, 2011; Craifaleanu, 2013; Georgescu and Pomonis, 2018).
2.3.2.2 Correlations with other ground motion parameters
Further on, correlations between the peak ground jerk (PGJ) and other ground motion parameters were investigated. The parameters considered were the peak ground acceleration (PGA), the Arias intensity, IA, the corner (control) period, TC, the predominant period of ground motion, T1, and two frequency bandwidth classification parameters.
The ideas behind the correlation investigations were: 1) to analyze the relation of PGJ with two largely used ground motion intensity measures (PGA and IA), 2) to assess the role of large acceleration amplitude variations in the occurrence of large ground jerk values, and 3) to assess a possible relation between the short period (high frequency) ground motion components and the occurrence of large PGJs.
The corner (control) period (Equation 1) was computed as proposed by Lungu (Lungu et al., 1995), by using modified expressions of the effective peak ground acceleration (EPA) and effective peak ground velocity (EPV):
where EPV and EPA are defined by Equations 2, 3:
In Equations 2, 3,
The predominant period, T1, was determined as the one corresponding to the highest peak of the power spectrum.
The conventional criteria for ground motion records classification according to their bandwidth were those used in (Craifaleanu, 2011), being based on the three parameters below. The classification criteria were derived, with some minor changes, from those used by Lungu et al. (1992), Dubină and Lungu (2003).
a) The parameter ε (Cartwright and Longuet-Higgins, 1956), defined by Equation 4:
where λ0, λ2 and λ4 are the 0th second and fourth spectral moments of the one-sided spectral density of the stationary process of ground acceleration. According to (JCSS, 2001), narrowband seismic processes are characterized by ε values larger than 0.95, while broadband seismic processes are characterized by ε values smaller than 0.85 and, in general, situated close to 2/3. Ground motions with ε values between these limits were categorized as “intermediate”.
b) The f50 fractile frequency below which 50% of the total cumulative power of PSD occurs (Kennedy and Shinozuka, 1989; JCSS, 2001).
c) The corner (control) period, TC, previously defined.
With these three parameters, the classification resulted as shown in Table 2, with the corresponding number of ground motions in each category being given in the last column.
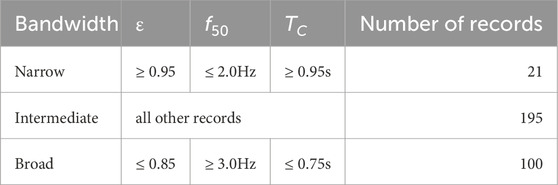
Table 2. Classification of seismic records used in this study according to their bandwidth and number of records in each category.
For PGA and IA, regression lines were determined, to assess the correlation of PGJ with each of these parameters. All linear regressions were checked for significance.
2.3.2.3 Jerk maps
Differences between the directivity and radiation patterns of the analyzed earthquakes are documented in literature (Sandi and Borcia, 2010a; Sandi and Borcia, 2010b). Thus, it is expected that they will be reflected, in a certain measure, also in the ground jerk distribution patterns. Peak ground jerks (PGJ) were mapped, for the earthquakes of 1986 and 1990, separately for horizontal and vertical components. For the horizontal components, the maximum value of the two components in a station was considered. Interpolation surfaces were generated, using the Inverse Distance Weighted (IDW) technique. Corresponding maps for the peak ground acceleration (PGA) were developed using the same methodology and displayed in parallel with the PGJ maps, to reveal similarities and differences between the resulting spatial distribution patterns.
2.3.2.4 Directivity analysis
In addition to the patterns reflected by the maps, to assess the directivity distribution of PGJ, the maximum values recorded for each station were plotted as a function of the azimuth (angle with respect to north of the line connecting earthquake epicenter and station, measured clockwise). Charts using a polar reference system were generated for the horizontal components of the 1986 and 1990 earthquakes.
3 Results and discussion
3.1 Analysis of the ground motion record of the 4 March 1977, earthquake
The only complete ground motion record obtained on 4 March 1977, recorded in the soft soil conditions of Bucharest, has been the subject of numerous analyses throughout the years. The highest peak ground acceleration for this record reached 0.21 g for the N-S pulse-like component and 0.19 g for the E-W component, both showing typical spectral content for narrowband ground motions, a characteristic related to the soft soil conditions of Bucharest. The vertical component, a broadband motion, reached a PGA of 0.12 g. One of the most significant features of this record is the high velocity pulse, noticeable in Figure 2G, which occurred around seconds 15–17 of the N-S component, when also the peak ground acceleration was reached. This, together with its peculiar narrowband spectral content, showing a clear predominant period of 1.6 s, was considered responsible for the strong damage and collapse of several multistory buildings in Bucharest. Detailed analyses of this record, highlighting its long-period characteristics, were performed, among others, by (Ambraseys, 1978; Ifrim, 1979; Hartzell, 1979). A comprehensive analysis, made in the broader context of the seismicity of Romania, can be found in the monography (Bălan et al., 1982). More recently, the impact of long-period ground motions on structural design, with particular reference to the case of Bucharest, was analyzed in (Pavel, Popa, and Văcăreanu, 2018). The pulse-like characteristics of the N-S component of the 4 March 1977, accelerogram were highlighted and analyzed also in a study dedicated to this type of ground motions (Pavel, 2021) and focused on records from strong Vrancea intermediate-depth earthquakes. It was shown that this component, with a peak ground velocity larger than 0.3 m/s2, complies with the criterion proposed by Baker (2007) to identify damaging pulse-like ground motions. This highly damaging potential is consistent with the documented effects of the earthquake in Bucharest.
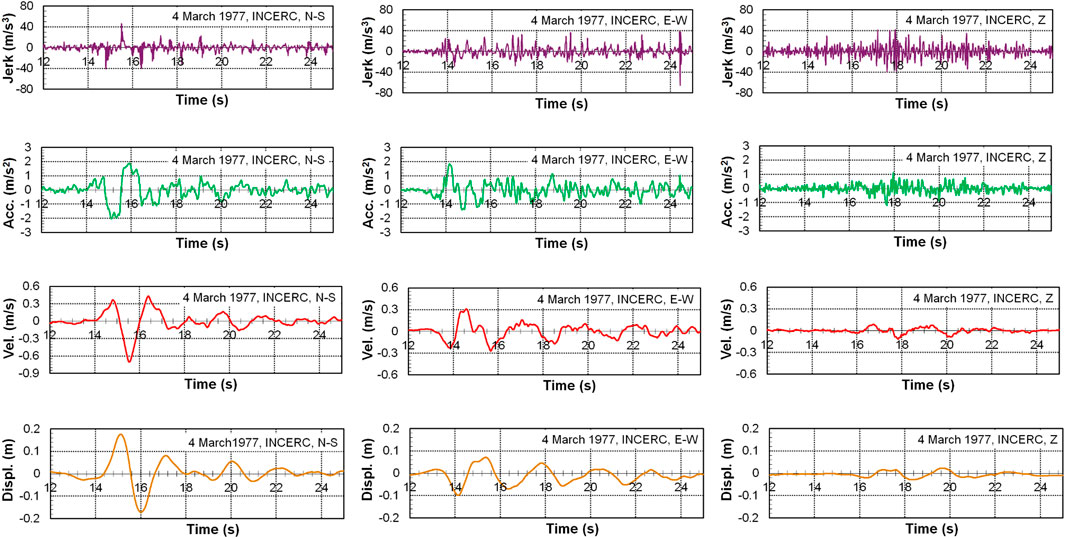
Figure 2. Jerk, acceleration, velocity and displacement time-histories for the three components of the Bucharest INCERC, 4 March 1977, accelerogram (12 … 25 s).
Figure 2 shows the jerk, acceleration, velocity and displacement time-histories of the three components, for a characteristic sequence (12 … 25 s) of the accelerogram.
Furthermore, to facilitate comparison, the above quantities were normalized with respect to their maxima and displayed for a narrower time interval (14 … 17s), as shown in Figure 3. The points of maximum values for each quantity are marked with squares. The plots reveal, on one side, the almost harmonic variation patterns of acceleration, velocity and displacement, with the effect of smoothing due to integration, and, on the other side, the characteristic short period/high frequency variation of the jerk, as well as the positioning of larger jerk values, including the maximum value, near the points of acceleration reversals, i.e., where the acceleration graph intersects the abscissa. All these features, in line with the theoretical relationships between the quantities analyzed, are very clearly illustrated in Figure 3, highlighting the peculiarities of this accelerogram.
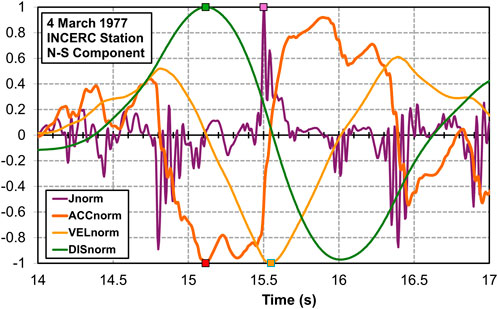
Figure 3. Detail of a sequence of INCERC 4 March 1977, N-S, accelerogram, containing normalized jerk, acceleration, velocity and displacement maxima. Peak normalized values for each quantity are marked with squares.
To acquire further insights into the damage potential of the analyzed record, an assessment of its impulsive content was conducted. Impulsive forces per unit mass, generated by the three accelerogram components, were computed, as proposed by (Mariani and Pugi, 2023), from the integral of the jerk function, j(t), within the bounds of two consecutive zero crossings (Equation 5):
As pointed out by the cited authors, the impulsive hammering actions generated during the earthquakes can be particularly damaging in the case of structures with insufficient robustness, among which masonry buildings, especially those made of rubble stone masonry with poor quality mortar. Vertical impulsive forces can play an important role in the damage of those buildings, with connections between load-bearing walls and internal floor slabs representing a critical point.
Figure 4 displays comparatively the time histories of the impulsive forces per unit mass and of the acceleration time-histories, for a sequence of 4 March 1977, record containing the peak values of both quantities. Jerk variation was not plotted, for a clearer display, given that its variation is shown in Figure 2.
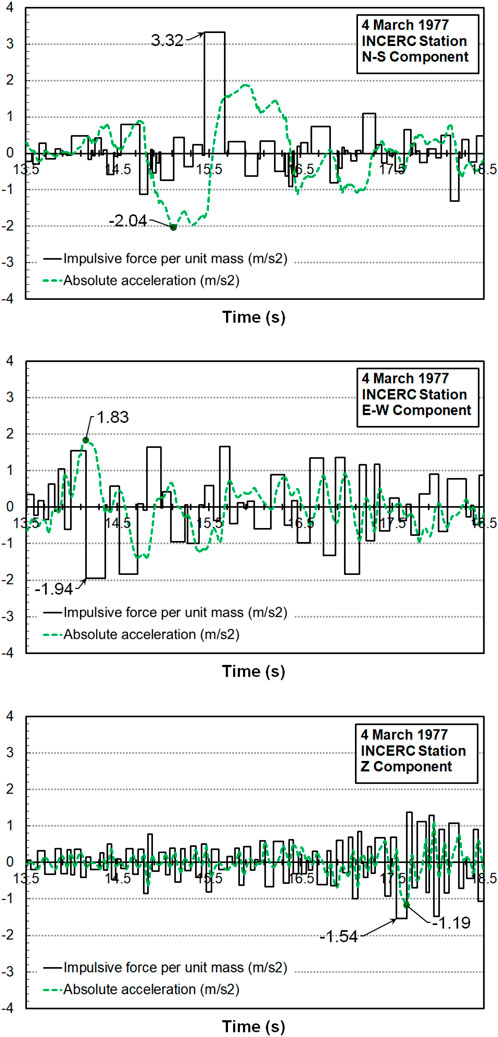
Figure 4. Time-histories of impulsive forces per unit mass and of accelerations, for a characteristic sequence of the 4 March 1977, record containing the peak values of both quantities.
From Figure 4 it can be noticed that the largest impulsive forces per unit mass (Fimp/m = 3.32 m/s2) occurred for the N-S component. This is the one for which also the largest peak ground acceleration occurred (PGA = 2.04 m/s2), but whose peak ground jerk (PGJ = 46 m/s3) is ranked only second among the three components. For the E-W component, the one with the largest PGJ (65 m/s3), and for which PGA (1.83 m/s2) is only 10% lower than for the N-S component, the largest impulsive force per unit mass reached, however, a 42% lower value (Fimp/m = 1.94 m/s2). Finally, the vertical (Z) component, with the lowest PGA (1.19 m/s2) and PGJ (42 m/s3), generated also the lowest impulsive forces per unit mass (Fimp/m = 1.54 m/s2). These results can be easily explained by the different waveform configurations of the three components, which define jerk amplitudes and intervals between zero crossings, as shown in Figure 4.
From the same figure, it can be noticed that the interval of maximum Fimp/m value occurs quite nearly to the time of PGA occurrence, for all components of the accelerogram. This was not observed, however, regarding the PGJ values.
Concerning the damage potential of the vertical component, pointed out by Mariani and Pugi (2023), no concluding evidence exists that damage in masonry buildings, recorded from the 4 March 1977, earthquake, was due to vertical impulsive forces. A more detailed study on this subject, incorporating data from other significant Vrancea earthquakes as well as specific information on the recorded damage to masonry and heritage buildings, would be necessary to draw a definitive conclusion.
3.2 Correlations with other ground motion parameters
3.2.1 Correlation between peak ground jerk and peak ground acceleration
The correlation between peak ground jerk (PGJ) and peak ground acceleration (PGA) was investigated separately for each earthquake considered. In addition, within each seismic event, correlations between the two quantities were sought for horizontal and, respectively, vertical components. It should be mentioned that, after testing several regression laws, the linear one resulted in the largest coefficients of determination. The results are shown in Figure 5.
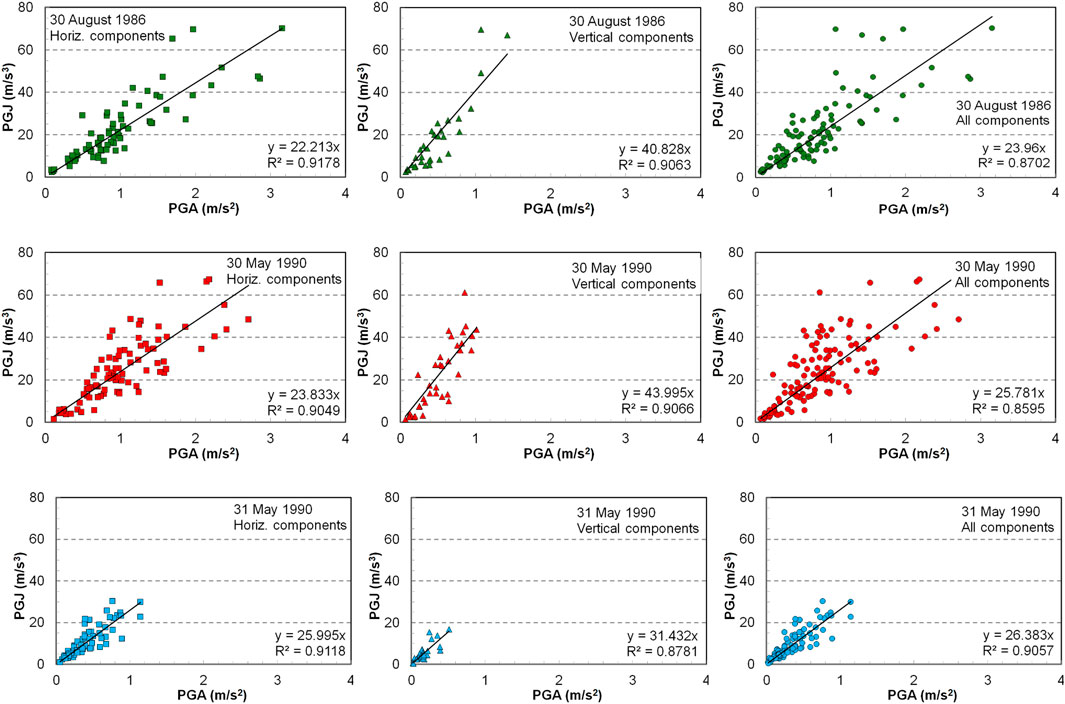
Figure 5. Correlations between PGJ and PGA for individual earthquakes.
The charts show a good correlation between PGJ and PGA, which is well fitted by linear regression, with coefficients of determination, R2, ranging between 0.86 and 0.92 for all ground motion categories considered. However, it can be noticed that, especially in the case of horizontal components, as PGA increases, the spreading of points about the trendline, on both sides, increases as well. This suggests, on one hand, that there is a relation of direct proportionality between PGJ and PGA but, on the other hand, that this relation becomes less stable with the increase of PGA. The regression coefficient differs significantly for the horizontal and, respectively, the vertical components, being larger in the latter case. Accordingly, the rounded values of the regression coefficient range between 22 and 26 for the first category, and between 31 and 44 for the second category. For horizontal and vertical components taken together, the regression coefficient ranges between 24 and 26, which was to be expected, as the horizontal components prevail in number.
The above tendencies can be noticed as well when all the records from the analyzed earthquakes are plotted together, as in Figure 6, where data points are drawn with different markers, according to the earthquake to which they refer. Another element to notice is the rather similar value range of PGA and PGJ for the earthquakes of 30 August 1986, and 30 May 1990. Moreover, for these two earthquakes it is also remarkable that, while PGA values for vertical components are lower and confined into a narrower range, their corresponding PGJ values are overall comparable to those for horizontal components, except for a few stations.
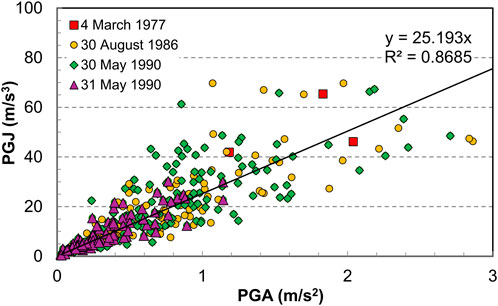
Figure 6. Correlations between PGJ and PGA (all records).
The largest three PGA values occurred for horizontal records of the 1986 earthquake, from stations located in the city of Focșani (station codes FOC3 and FOC1), in the epicentral zone. The largest three PGJ values occurred, in order, for a component of the 1986 FOC3 record (70 m/s3), for a component of the 1986 CHS record in Chișinău, Republic of Moldova (70 m/s3) - where surprisingly large values of PGA (1.97 m/s2), given the large distance from the epicenter, were also recorded, and for a component of the 30 May 1990, BLV1 (Bolintin Vale, near Bucharest, in the south-east of Romania) record (67 m/s3). Given that large jerk values seem to be independent of epicentral distance, an explanation could reside in local amplification due to specific site conditions, as Chișinău lies upon a sedimentary basin (Zaicenco et al., 2007), Focșani is located on sedimentary soil (Pavel, 2021), and Bolintin Vale is also located on this type of soil. Other stations following on the list are also located on sediments. However, this preliminary conclusion should be further supported by additional studies.
The values for the three components of the single accelerogram available from the Mw = 7.4 4 March 1977, earthquake are marked with red squares in Figure 6. The smallest values, both in terms of PGJ and PGA, occur, as shown previously, for the vertical component, while the E-W component has the largest PGJ. It is worth noting that there are several data points from the smaller magnitude Aug. 30, 1986, and 30 May 1990, earthquakes, with PGJ and/or PGA values larger than those of 1977. These stations can be easily identified on the maps in Section 3.3 of this paper.
3.2.2 Correlation between peak ground jerk and Arias intensity
Another investigated correlation was the one between PGJ and Arias intensity, defined as the integral with respect to time of the square of the ground acceleration (Equation 6):
where g is the gravitational acceleration and Td is the significant duration of the accelerogram. The investigation was deemed of interest given the various applications of Arias intensity in estimating seismic damage potential (Travasarou et al., 2003), and to its superior capacity of reflecting it, as compared with PGA-based damage assessments.
The same grouping of ground motions according to seismic event and direction (horizontal/vertical) was used, as in the case of the PGJ-PGA correlation study. Here, as in the previous case, the linear fit resulted in the largest coefficients of determination. The results are shown in Figure 7.
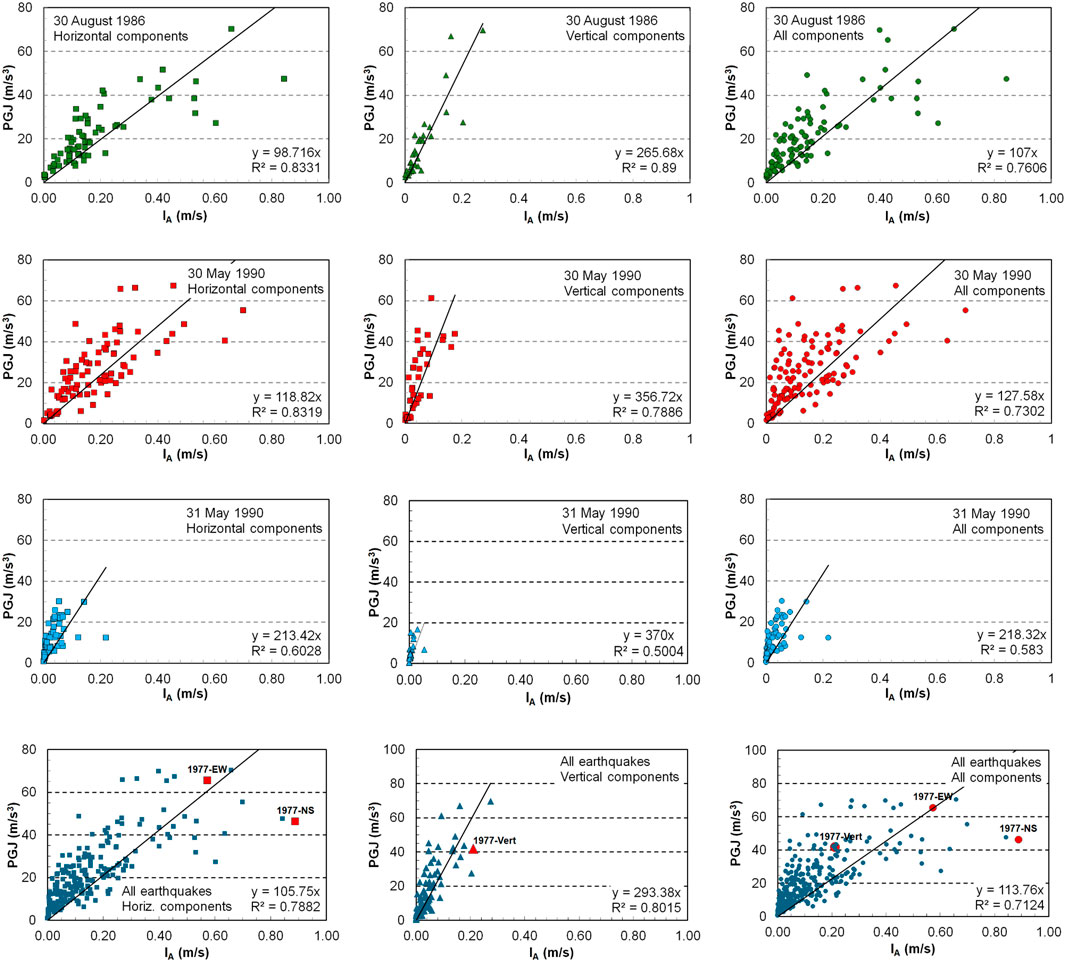
Figure 7. Correlation between PGJ and Arias intensity, IA, for the considered earthquakes.
The analysis of the plots shows a good correlation between PGJ and Arias intensity, even though weaker than the one observed for PGA. Like in the previous study, the correlation becomes less stable for larger IA values. The coefficients of determination, R2, range from 0.60 to 0.83 for the horizontal records and from 0.50 to 0.89 for the vertical records. When both horizontal and vertical records are considered, the coefficient of determination ranges between 0.58 and 0.76. By considering all records for the four analyzed earthquakes, coefficients of determination of 0.78, 0.80, and 0.71 were obtained for horizontal, vertical and all components, respectively. When considering all earthquakes (Figure 7K–M), the regression coefficients are, in order, 106, 293, and 114. One could notice, from Figure 7A–J, that regression coefficients differ significantly for horizontal and, respectively, vertical components, as well as between events.
The data points corresponding to the components of the INCERC, 4 March 1977, accelerogram were marked explicitly in Figure 7K–M. It is worth noting that comparable values of PGJ and IA occurred also in the case of the smaller magnitude earthquakes of Aug. 30, 1986, and 30 May 1990. The same observation as in the case of the PGJ-PGA correlation can be made, for these two earthquakes, about the very close range of PGJ values for horizontal and vertical components, respectively.
3.2.3 Correlation between peak ground jerk and frequency content parameters
As mentioned in Section 2.3.2 of the paper, the investigated frequency content parameters were the corner (control) period,TC, the Cartwright and Longuet-Higgins ε coefficient and the fractile period below which 50% of the total cumulative power of PSD occurs, f50. In addition, given that TC was computed, as shown previously, with a modified formula, the correlation with the largely used predominant period of ground motion, T1, was also investigated. For the coherence of interpretation, since two period-type parameters were already considered, the inverse of the f50 frequency (i.e., the T50 period) was plotted on the abscissa of the third chart type.
Results for the first three parameters are presented in parallel in Figure 8, while results for T1 are shown in Figure 9, both representations referring to horizontal components.
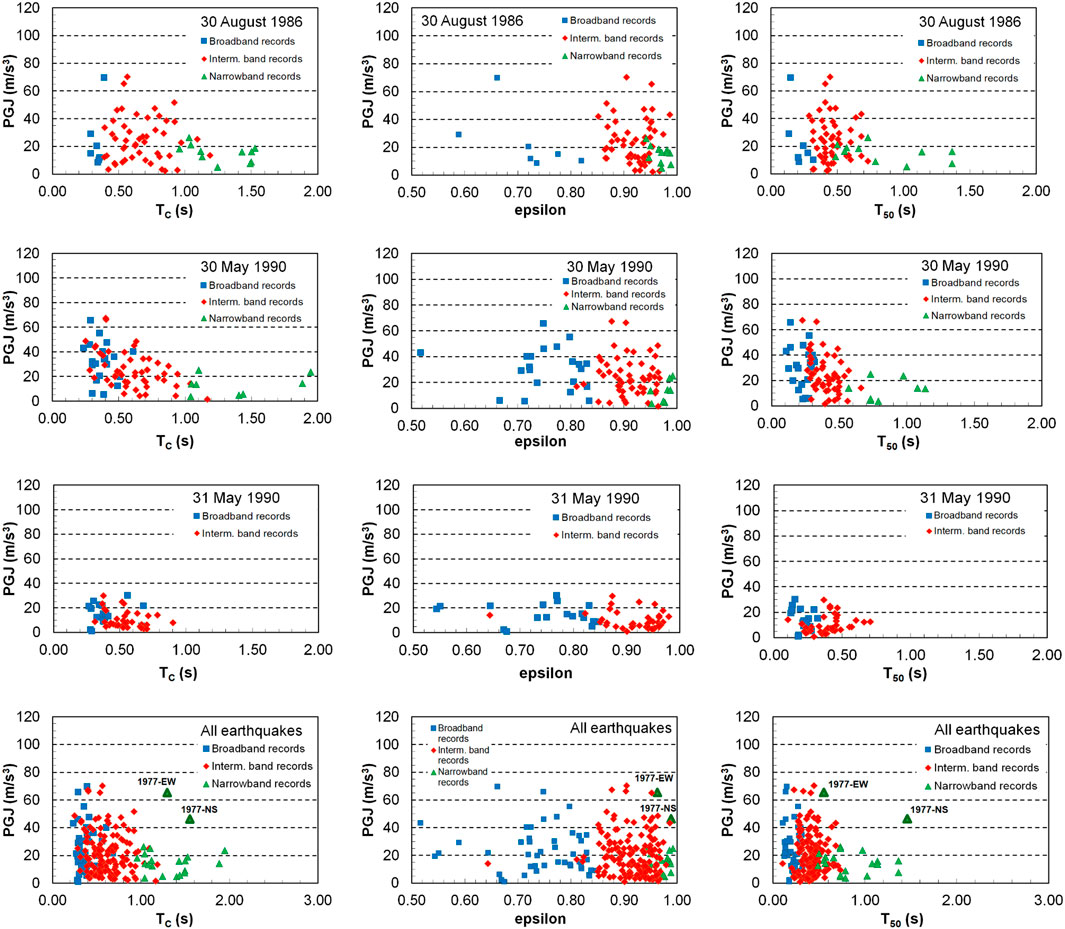
Figure 8. PGJ vs. frequency content parameters (TC, ε and T50), for the horizontal records of the 1986 and 1990 earthquakes considered in the study and for all horizontal records.
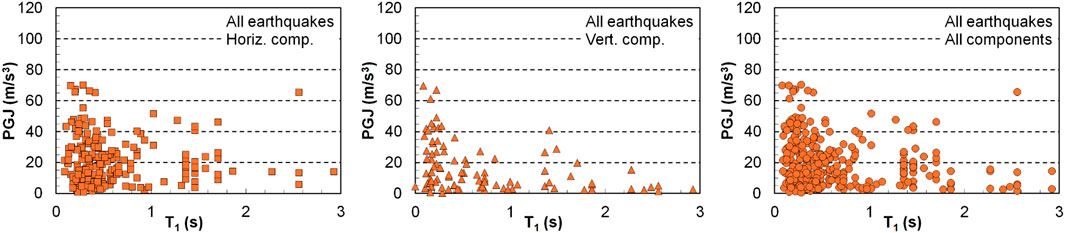
Figure 9. PGJ vs. T1, for the records of all four earthquakes considered.
Different colors and markers were used in Figure 8 for each of the frequency band categories (i.e., blue squares for broadband records, red diamonds for intermediate band records and green triangles for narrowband records), to facilitate the identification of data points. Since matching of three distinct criteria was required for characterization, a certain interweave exists between data points bordering the different categories. As it results from the plots in Figure 8, there is a large spread of PGJ values within each frequency band category, for all three frequency content parameters, which makes it difficult to find a simple analytical relationship between PGJ and them. However, it can be noticed that there is a clear decrease in PGJ as the values of the frequency content parameters evolve from the broadband to the narrowband category. The explanation could reside in the fact that, for broadband ground motions, which have a richer content and amplitudes of high frequency (low period) components, acceleration amplitude variations occur in a shorter time interval for these components, which could lead to larger PGJ values.
However, an exception from this tendency occurs in the case of the INCERC, 4 March 1977, record, whose components are marked in Figure 8J–L. Despite being typical narrowband ground motions, with corner periods, TC, of 1.56 s and 1.30 s, respectively, their PGJ values are much higher than those of other ground motions in the same group. This could be explained by considering the higher magnitude of the 1977 earthquake, as compared to the other analyzed seismic events, and the high PGA values recorded at this single recording station: 2.04 m/s2 and 1.83 m/s2 for the N-S and, respectively, E-W components, i.e., about 2–3 times greater than those recorded for the Aug. 30, 1986, and 30 May 1990, earthquakes, at the same station. (No record was obtained at this station for the 31 May 1990, earthquake, because the accelerometer was not triggered).
The observations based on Figure 8 are reflected also by the charts in Figure 9, drawn with respect to T1, for all earthquakes considered. The results, especially for the first two earthquakes in Figure 8, for which more records are available, lead to the conclusion that both PGA and ground motion frequency content have significant influence on PGJ values.
3.2.4 Time of peak ground jerk occurrence
The quite good correlation between PGJ and PGA, shown previously, would suggest, at first approximation, that the time of occurrence of PGJ during the ground motion should be close to the time when PGA occurs. A more detailed investigation on this subject, performed on the analyzed earthquakes, showed that actually there is a large variation in the times elapsed between PGJ and PGA occurrences, for different ground motions. The time interval between the two maxima is expressed in the following by the difference Δt(J-A) = tPGJ-tPGA.
Figure 10 shows the variation of PGJ with Δt(J-A). Points with negative abscissa values correspond to ground motions for which PGJ occurred before PGA, while points with positive abscissas correspond to those motions for which the PGJ was attained after the occurrence of PGA. From the 316 data points, 205 (about 65%) are situated in the Δt(J-A) interval [-1s, +1s]. However, by analyzing components of the same accelerogram, it can be noticed that there are still many stations in which Δt(J-A) differs largely between components, with PGJ occurring either before or after PGA. For instance, for the INCERC, 4 March 1977, accelerogram, Δt(J-A) values for the N-S, E-W and vertical components are 0.385 s, 10.285 s and 0.275 s, respectively. Given this large variability, a reliable estimate cannot be made regarding the relation between the time of PGJ occurrence and the time of PGA occurrence during the ground motion.
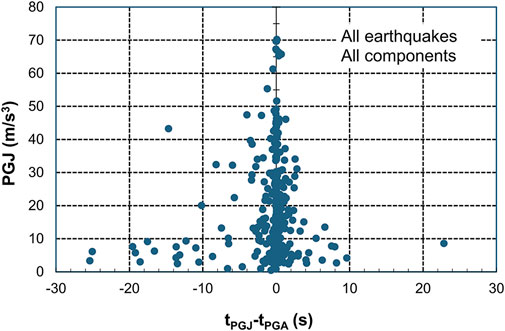
Figure 10. PGJ vs. the time difference between PGJ and PGA occurrences (all records considered in the study).
3.3 Peak ground jerk maps
The mapping of peak ground jerk values provided additional information on their spatial distribution during the 1986 and 1990 earthquakes. As mentioned, the single complete accelerometric record available from the 1977 earthquake provides no possibility of obtaining the spatial distribution of ground motion parameters for this seismic event. However, attempts were made in the years following the earthquake to estimate the spatial distributions of ground motion intensity based on damage induced to buildings (Sandi and Perlea, 1982).
The resulting maps are shown in Figures 11A, C, E, displaying the maximum PGJ values from the two horizontal components at each station, and in Figures 12A, C, E, for the vertical components. For comparison, the corresponding PGA maps are shown in Figures 11B, D, F, and, respectively, Figures 12B, D, F.
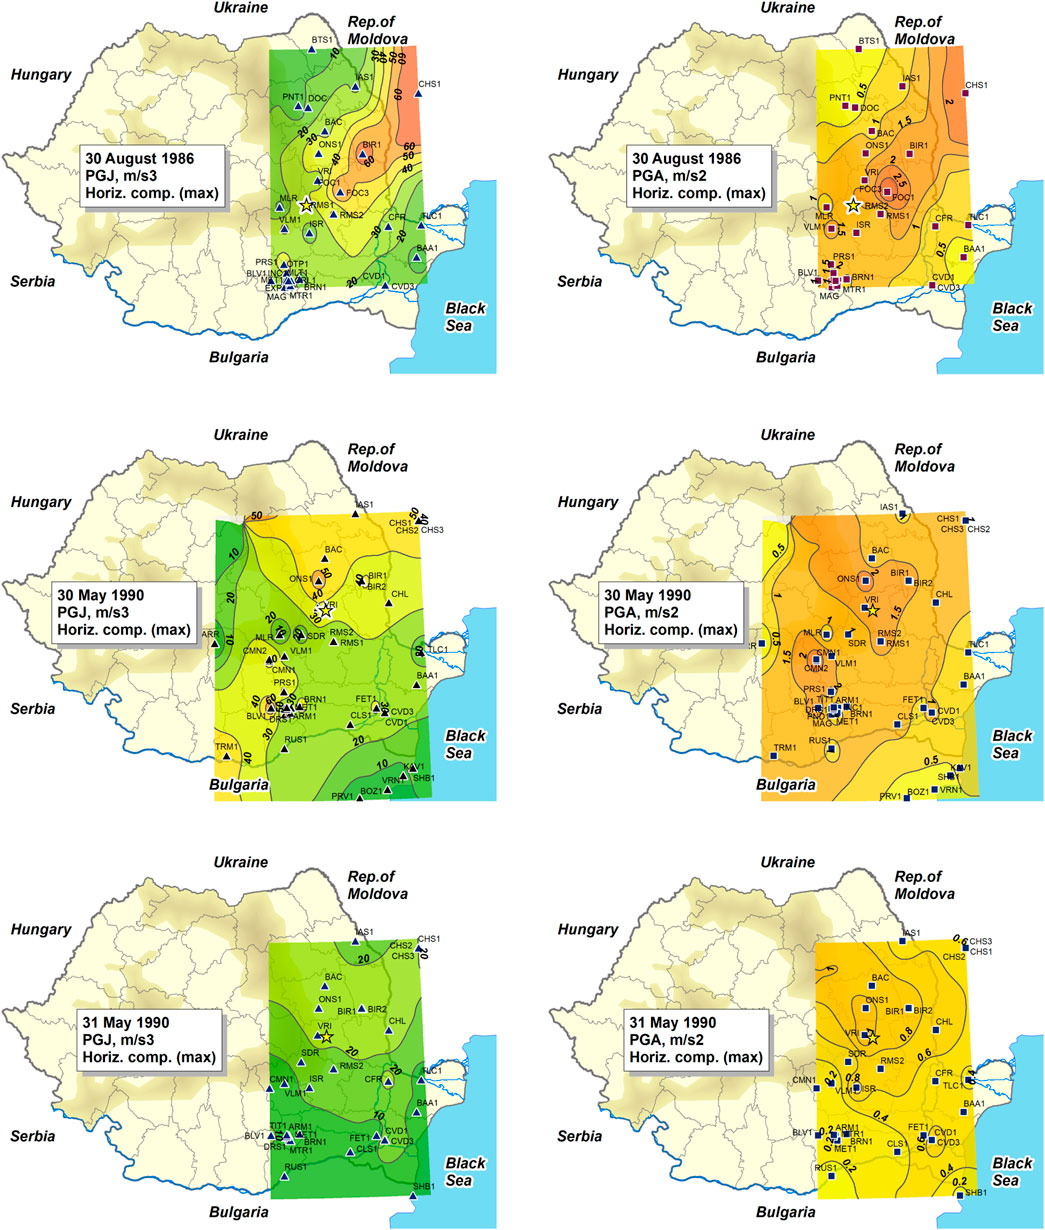
Figure 11. Maps of the maximum horizontal values of peak ground jerk (left) and peak ground acceleration (right), for the 1986 and 1990 earthquakes.
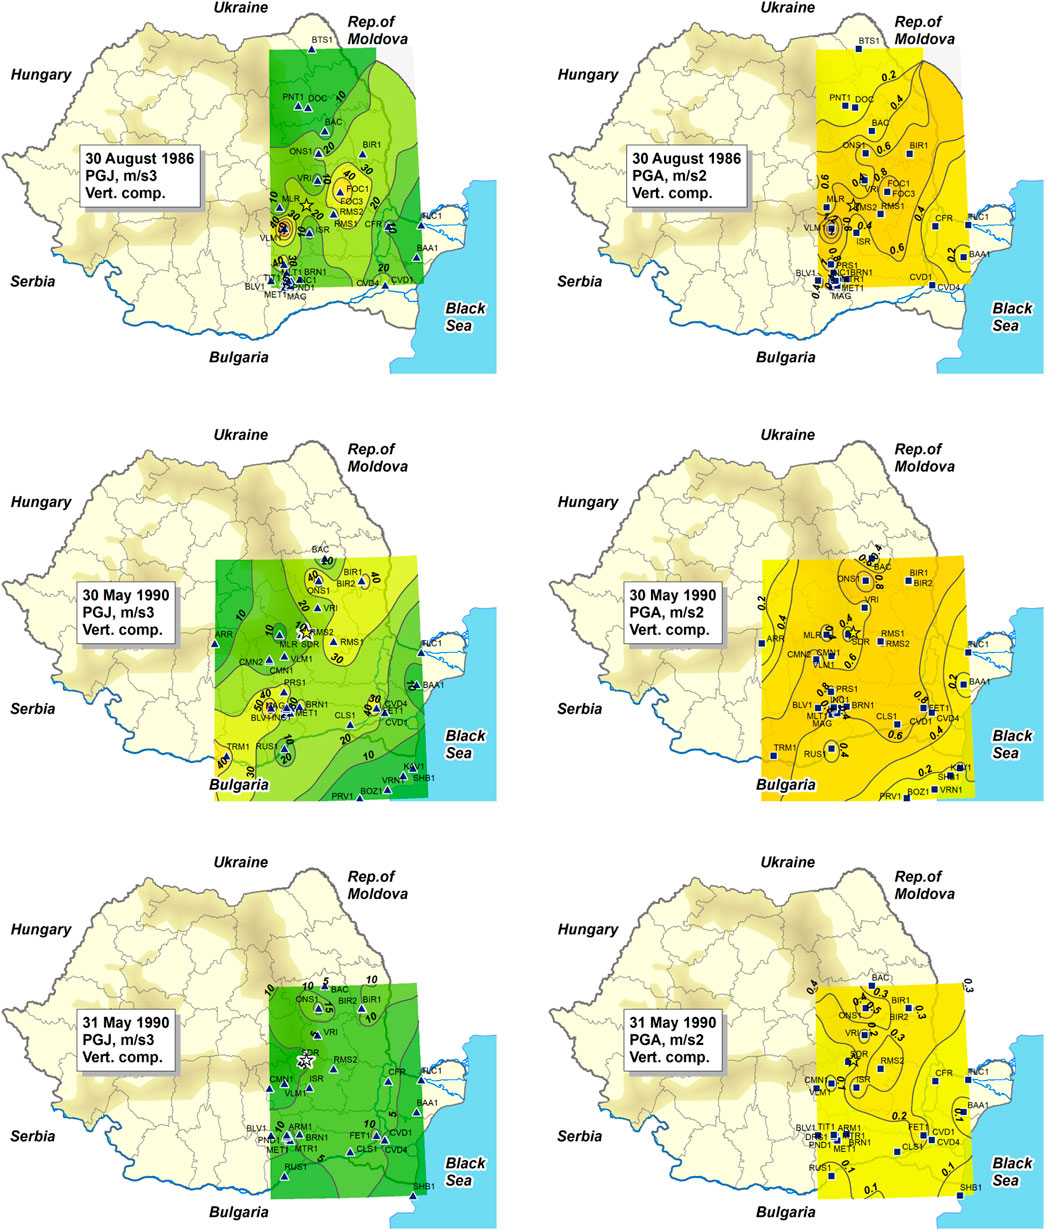
Figure 12. Maps of the vertical values of peak ground jerk, PGJ (left), and peak ground acceleration, PGA (right), for the 1986 and 1990 earthquakes.
The generated interpolation surfaces were limited to the extent defined by the positions of the extreme N-S and W-E seismic stations. The units of measure of values displayed on the maps are m/s3 for jerk and m/s2 for acceleration. The epicenter of the earthquake is marked with a star on each map.
It should be mentioned that the stations for which ground motion records are available differ from one earthquake to the other, due to, on one part, the evolution of the seismic networks in Romania and, on the other part, the absence of triggering or malfunction of instruments in some stations.
One of the most significant characteristics of the analyzed Vrancea earthquakes consists of the differences between their directivity patterns. These patterns, mainly discernible on the PGA maps, show roughly a SW-NE directivity for the 30 August 1986, earthquake, a NNE-SSW or even N-S directivity for the 30 May 1990, earthquake and a NNW-SSE directivity for the 31 May 1990, earthquake. Given the good correlation between PGJ and PGA, mentioned in Section 3.2.1 of the paper, these directivity patterns can be identified also on PGJ maps. The differences that appear, however, between the contour patterns on the two map categories are due to PGJ-PGA less correlated values in some stations and to IDW method characteristics. Additional details about the directivity and other peculiarities of the earthquakes analyzed can be found in (Sandi and Borcia, 2010b).
The maximum PGJ values for the horizontal components ranged between 2 and 70 m/s3 for the 30 August 1986, earthquake (Figure 11A), with the highest value at station Focșani (code FOC3 on the map)1 and the lowest value at station Botoșani (BTS1 on the map), located in north-eastern Romania. The PGJ value at CHS1 station is unexpectedly large, as it almost equals the value recorded at FOC3 station, close to the epicenter.
For the 30 May 1990, earthquake, the PGJ values ranged from 2 m/s3 (at station ARR), located in the Southern Carpathians, to 67 m/s3 (at station Bolintin Vale, BLV1, near Bucharest) (Figure 11C). Again, the stations in Chișinău have large PGJ values (the highest value is 66 m/s3), being followed, quite unexpectedly, by station Onești (ONS1), in the Moldavian Plateau. The spatial distribution differs significantly from that for the 1986 earthquake, both for PGJ and PGA.
For the 31 May 1990, earthquake, the largest PGJ values were recorded at stations Chișinău and Onești, 30 m/s3, while the smallest value, 0.9 m/s3, was recorded at station Shabla (SHB1), in Bulgaria (Figure 11E). The station with the maximum PGA (Vrâncioaia, VRI1), located near the epicenter (Figure 11F) recorded only the seventh largest PGJ max., i.e., 23 m/s3. In the case of this earthquake as well, the PGJ and PGA spatial distributions differ considerably from those determined for the two previous earthquakes.
The PGJ maps for the vertical components in Figures 12A, C, E reflect directivity patterns similar to those for the horizontal components. However, the NE-SW orientation is now present also for the 30 May 1990, earthquake, resembling more to the one for the 1986 event. A slightly improved correspondence with the PGA patterns can be noticed, as compared to that for the horizontal components, for all three earthquakes. This was previously revealed also by the PGJ-PGA correlation studies presented in Section 3.2.1 of this article.
For the 30 August 1986, earthquake (Figure 12A), the vertical PGJ values range from 3 m/s3 at station Botoșani (BTS1) to 70 m/s3 at station Focșani (FOC1), located in the epicentral zone. Station BTS1 recorded also the smallest vertical PGA (0.07 m/s2); however, the greatest PGA value, 1.42 m/s2, was recorded at Vălenii de Munte (VLM1) station (Figure 12B). Although the NE-SW directivity pattern is clearly visible on both PGJ and PGA maps, the missing vertical values for Chișinău stations do not allow obtaining a complete image of the propagation in this direction.
The PGJ maps for 30 May 1990, earthquake (Figure 12C) are also affected by the lack of data from some stations in the north-eastern part of the country. However, the availability of records from north-eastern Bulgaria makes it possible to have a better image for this area and for south-eastern Romania, as compared to that for the 1986 earthquake. The vertical PGJ values range from 1.5 m/s3, at station Argeș (ARR), located in the Southern Carpathians, to 61 m/s3, at station Bolintin Vale (BLV1). Station ARR also recorded the smallest vertical PGA (Figure 12D), 0.07 m/s2. However, the PGA value recorded at BLV1 (0.86 m/s2) was only the fifth largest one, while the largest vertical PGA (1.02 m/s2) was recorded at station Onești (ONS1).
For the 31 May 1990, earthquake, the vertical PGJ values (Figure 12E) range from 0.4 m/s3, at station Shabla (SHB1) in north-eastern Bulgaria, to 17 m/s3, at station Onești (ONS1). Station ONS1 also recorded the largest vertical PGA value (0.51 m/s2), while the smallest PGA values (0.03 m/s2) were recorded at stations Rousse (RUS1) and Shabla (SHB1), in north-eastern Bulgaria (Figure 12F). In this case, as well, the lack of records from the north-eastern part of Romania did not allow obtaining a complete image of the distribution patterns.
As a general observation, the study of the maps revealed that, despite the similarities between the distribution patterns of PGJ and PGA, the latter parameter cannot be used as a single reliable predictor for identifying locations or areas prone to large-PGJ ground motions. Additional information, such as frequency band parameters, site conditions, directivity and propagation, should be considered as well.
In the same context, the case of the near-field records could be brought into discussion. For this type or records, large velocity pulses and, frequently, large jerks are observed. Thus, this would raise the question of whether this is the case also for the ground motions considered in the current research. Several studies on this type of ground motions were conducted, based on earthquake records from different areas of the globe (Malhotra, 2009; Moustafa and Izuru, 2010; Gümüş and Cengizhan, 2022; Fujii, 2023; Majdi et al., 2024 etc.). For strong Vrancea earthquakes, even though the rather small number of records obtained from stations near the epicentral zone does not allow for a complete study, pulse-like ground motions were identified and analyzed in a recent work of Pavel (2021). According to this work, pulse-like ground motions, of which only a few with peak ground velocities larger than 0.3 m/s, were recorded in all strong Vrancea earthquakes considered, both in stiff and in soft soil conditions. However, most of them were not from stations in the epicentral area. The analysis of the PGJ values of these records, obtained within the current study, did not reveal a correlation between high seismic jerk values occurrence and the pulse-like characteristic of the ground motions considered.
3.4 Directivity analysis
To obtain a synthetic image of jerk directivity for each of the 1986 and 1990 earthquakes, the maximum horizontal PGJ values recorded for each station and ground motion component were represented on polar plots, as a function of station azimuth. The distance between the center of the circle and the data point represents the PGJ for a specific station and component, while the angle measured clockwise from the north direction of the plot represents the azimuth of the station with respect to the epicenter of the considered earthquake. The obtained plots are shown in Figure 13.
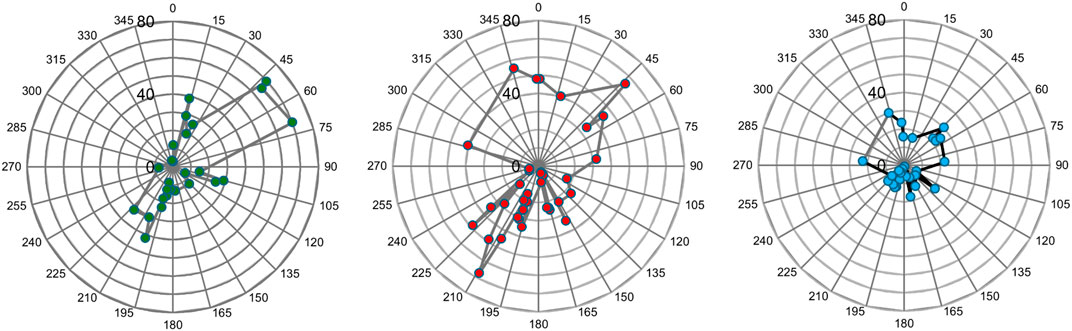
Figure 13. Maximum horizontal PGJ values for the 1986 and 1990 earthquakes, as a function of station azimuth with respect to epicenter. (A) 30 August 1986, (B) 30 May 1990, (C) 31 May 1990.
The plots in Figure 13 express in a simplified way the PGJ directivity patterns for each earthquake, highlighting the differences between the analyzed seismic events. It should be noted however that a more in-depth analysis would be needed for a complete image of this phenomenon. Moreover, the results are affected, in a certain measure, also by the fact that the sets of stations providing records were not identical for all earthquakes and by the multiple factors, including local site amplification, which influence PGJ values.
4 Conclusion
The study of ground jerk characteristics for the four strongest Vrancea earthquakes that occurred in the past half-century revealed some conclusions, of which the main are summarized in the following.
- Peak ground jerk (PGJ) has a good correlation with peak ground acceleration (PGA). However, for all earthquakes studied, the correlation tends to become less stable as PGA increases, meaning that stations with large PGA values do not necessarily have large PGJ values, and vice versa.
- The correlation of PGJ with Arias intensity, IA, even though resulting in good coefficients of determination, is weaker than the correlation with PGA.
- For the seismic conditions of the analyzed area, the largest jerks occurred for some broad and intermediate frequency band ground motions recorded on Aug. 30, 1986, and 30 May 1990, and for the strong narrowband ground motions recorded at INCERC station on 4 March 1977. Since ground jerk is defined by the time rate of ground acceleration, this conclusion is in line with its physical significance, as large values of this parameter occur both in case of very strong ground motions (large acceleration amplitude variations) and of broadband strong ground motions, rich in high frequency content (variations of acceleration over shorter time intervals).
- A primary investigation suggested that high PGJ values also could be more likely to occur at sites located on sedimentary strata. However, this conclusion should be verified by further research, given the multiple factors that influence ground motion characteristics.
- PGJ values are also influenced by source mechanism, directivity and propagation, and significant differences were identified, in this respect, between the analyzed earthquakes. Regarding the spatial distribution, a correlation of PGJ with epicentral distance is difficult to establish, given both the local variations of PGJ and the asymmetry of radiation patterns - the latter specific to Vrancea region, observed on the maps.
- For most of the records, the times of occurrence for PGJ and PGA values, respectively, are quite close to each other. Accordingly, PGJ and PGA occurred within ±1 s for 65% of all accelerograms. Nonetheless, there are still several accelerograms for which the time interval is much larger, up to 25 s, without an apparent feature that would explain the distinction.
- The PGJ directivity characteristics, obtained in a simplified approach by plotting maximum horizontal PGJ values vs station azimuth in a polar reference system, generally confirmed the observations made on the maps and highlighted in a synthetic way the differences between the analyzed earthquakes, differences that, as well, represent a characteristic feature of the Vrancea source.
- The analysis of the pulse-like, long-period N-S component of the Mw = 7.4 4 March 1977, earthquake showed the correlation between jerk, acceleration, velocity and displacement variations in the case of this particular type of ground motions.
- An investigation on available near-field/pulse-like ground motions from Vrancea earthquakes did not reveal a correlation between these characteristics and the occurrence of large PGJ values.
An overall conclusion of the above study is that high seismic jerk occurrences in ground motions cannot be predicted reliably by only considering its correlation with ground motion intensity measures and frequency content parameters. The epicentral distance is also seemingly irrelevant. In addition, the peculiarities of intermediate-depth strong Vrancea earthquakes (significant directivity and propagation differences between events, atypical source characteristics), as well as the very limited availability of records from the 4 March 1977, event, the strongest in Romania recorded by modern instruments, introduce further complexities. There are several challenges in the study of seismic jerk that require further research, and that should address both regional aspects, i.e., those that would add new information on the specific of strong intermediate-depth Vrancea earthquakes and on their impacts on the local built environment, and general aspects, that would provide broadly applicable insights into seismic jerk characteristics and effects. A non-exhaustive list, which could represent a framework for the next phases of the current study, is given below.
- A detailed investigation on seismic jerk effects on buildings, using the large ground motion dataset available from strong Vrancea earthquakes and substantiated by the documented damage reported on various building categories after these earthquakes. This investigation would include the examination of elastic and inelastic jerk response spectra, analyses conducted on structural models reproducing various categories of damaged buildings, and corroboration of observations with available data on local site conditions, and other factors. A significant challenge of this study would be establishing the measure in which seismic jerk actually contributed to the recorded damage and discerning its effects from those produced by seismic accelerations.
- An in-depth assessment of the influence of specific site conditions - for instance of the presence of sedimentary strata and basin or topographical effects - on the occurrence of large ground jerk values. Here, also other parameters of the propagation path could be considered.
- Studies on various applications in structural engineering, such as seismic jerk effects on buildings with base isolation (considering the recent expansion of this field in Romania), on rigid (short period) structures, on structural and non-structural components sensitive to vertical actions and on the jerk influence on building contents (jerk floor response spectra). Moreover, an analysis of impulsive forces would also provide additional understanding of jerk effects. The inclusion of provisions regarding jerk in seismic codes is considered as well as a point of interest for future research.
From a wider perspective, the exploration of the above aspects could provide novel insights into the characterization of seismicity and improve approaches to earthquake risk assessment on both regional and global levels.
Data availability statement
The datasets presented in this article are not readily available because Institutional restrictions apply. Requests to access the datasets should be directed to aW9sYW5kYUBpbmNkLnJv.
Author contributions
I-GC: Conceptualization, Data curation, Formal Analysis, Funding acquisition, Investigation, Methodology, Project administration, Resources, Software, Supervision, Validation, Visualization, Writing – original draft, Writing – review and editing.
Funding
The author(s) declare that financial support was received for the research and/or publication of this article. This work referred some of the results obtained at INCD URBAN-INCERC within the project PN 23–35 01 01 “Integrative concept of digital analysis of data from large-scale seismic monitoring of the national territory and the built environment, aimed for the rapid identification of the destructive potential of seismic events produced in Romania and in the adjacent regions”, funded by the Romanian Ministry of Education and Research in the framework of the “Nucleu” Programme PN 23-35 “ECODIGICONS”. The financial support for the publication of this work is gratefully acknowledged.
Conflict of interest
The author declares that the research was conducted in the absence of any commercial or financial relationships that could be construed as a potential conflict of interest.
Generative AI statement
The author(s) declare that no Generative AI was used in the creation of this manuscript.
Publisher’s note
All claims expressed in this article are solely those of the authors and do not necessarily represent those of their affiliated organizations, or those of the publisher, the editors and the reviewers. Any product that may be evaluated in this article, or claim that may be made by its manufacturer, is not guaranteed or endorsed by the publisher.
Footnotes
1Given that stations FOC1 and FOC3 are very close to each other, the interpolation surface was generated considering a weighted value
References
Ambraseys, N. (1978). Long-period effects in the Romanian earthquake of March 1977. Nature 268, 324–325. doi:10.1038/268324a0
An, Y., Jo, H., Spencer, Jr., and Ou, J. (2013). A damage localization method based on the jerk energy. Smart Mater. Struct. 23 (2), 025020–20. doi:10.1088/0964-1726/23/2/025020
Baker, J. W. (2007). Quantitative classification of near-fault ground motions using wavelet analysis. Bull. Seismol. Soc. Am. 97 (5), 1486–1501. doi:10.1785/0120060255
Bala, A., Radulian, M., and Toma-Danila, D. (2021). Present-day stress field pattern in the Vrancea seismic zone (Romania) deduced from earthquake focal mechanism inversion. Ann. Geophys. 64 (6), PE660. doi:10.4401/ag-8632
Bălan, S., Cristescu, V., and Cornea, I. (1982). The Romania earthquake of 4 March 1977. Bucharest: Editura Academiei.
Beleș, A. A. (1936). La notion de sécousse et son rôle dans la dynamique. Bul. Math.-Phys.de l’École Polytech. Bucar., 1936–1937.
Berg, G. V., Bolt, B. A., Sozen, M. A., and Rojahn, C. (1980). Earthquake in Romania, March 4, 1977. An engineering report. Washington D.C., USA: The National Academies Press. Available online at: https://nehrpsearch.nist.gov/static/files/NSF/PB82163114.pdf (Accessed January 25, 2025).
Boore, D. M., and Bommer, J. J. (2005). Processing of strong-motion accelerograms: needs, options and consequences. Soil Dyn. Earthq. Eng. 25 (2), 93–115. doi:10.1016/j.soildyn.2004.10.007
Borcia, I. S., Craifaleanu, I. G., Calarasu, E. A., Tanase, N. F., and Praun, I. C. (2015). SM-ROM-GL (strong motion Romania ground level) database. Construcţii 1, 3–10.
Cartwright, D. E., and Longuet-Higgins, M. S. (1956). The statistical distribution of the maxima of a random function. Proc. R. Soc. Lond. Ser. A, Math. Phys. Sci. 237 (1209), 212–232. doi:10.1098/rspa.1956.0173
CEN (2024). EN 12299:2024. Railway applications - ride comfort for passengers - measurement and evaluation. Brussels: European Committee for Standardization.
Constantinescu, L., Constantinescu, P., Cornea, I., and Lazarescu, V. (1976). Recent seismic information on the lithosphere in Romania. Rev. Roum. Geol. Geophys., Geogr. Ser. Geophys. 20, 33–40.
Craifaleanu, I. G. (2011). “Investigation of the frequency content of ground motions recorded during strong Vrancea earthquakes, based on deterministic and stochastic indices,” in Proceedings of the eighth international conference on structural dynamics. Editors G. De Roeck, G. Degrande, G. Lombaert, and G. Müller, 2893–2898.
Craifaleanu, I.-G. (2013). Standardized multiapartment blocks built in Romania before 1990: seismic design levels vs. Earthquake performance. Struct. Eng. Int. 23 (4), 519–527. doi:10.2749/101686613X13768348399593
Craifaleanu, I. G., Borcia, I. S., and Prăun, I. C. (2011). “Strong-motion networks in Romania and their efficient use in the structural engineering applications,” in Earthquake data in engineering seismology. Predictive models, data management and networks. Editors S. Akkar, P. Gülkan, and T. van Eck (Springer), 247–259. doi:10.1007/978-94-007-0152-6_17
Dai, J., Wang, Y., Guan, Q., Qi, X., Yang, X., Tong, M., et al. (2009). Three dimensional temporal characteristics of ground motions and building responses in wenchuan earthquake. Earthq. Eng. Eng. Vib. 8 (2), 287–299. doi:10.1007/s11803-009-9052-1
Detorakis, G.Is (2020). GitHub - gdetor/wavelet_denoising: a simple Python implementation of basic Wavelet denoising algorithms. Available online at: https://github.com/gdetor/wavelet_denoising.
D. Dubină, and D. (coords.) Lungu (2003). Clădiri în zone cu risc seismic. Partea I: Hazard, vulnerabilitate și risc seismic (Timisoara: Orizonturi Universitare).
Enescu, B., Ghita, C., Moldovan, I.-A., and Radulian, M. (2023). Revisiting Vrancea (Romania) intermediate-depth seismicity: some statistical characteristics and seismic quiescence testing. Geosciences 13 (7), 219–19. doi:10.3390/geosciences13070219
Fujii, K. (2023). Energy-based response prediction of reinforced concrete buildings with steel damper columns under pulse-like ground motions. Front. Built Environ. 9. doi:10.3389/fbuil.2023.1219740
Georgescu, E.-S., and Pomonis, A. (2011). A review of socio-economic consequences, losses and human casualties of the 1977 Vrancea, Romania earthquake. Constructii 2, 21–43.
Georgescu, E.-S., and Pomonis, A. (2012). “Building damage vs. Territorial casualty patterns during the Vrancea (Romania) earthquakes of 1940 and 1977,” in Proceedings of the 15th world conference on earthquake engineering. Available online at: https://www.iitk.ac.in/nicee/wcee/article/WCEE2012_2123.pdf.
Georgescu, E. S., and Pomonis, A. (2018). New archival evidence on the 1977 Vrancea, Romania earthquake and its impact on disaster management and seismic risk. Springer Nat. Hazards, 281–295. doi:10.1007/978-3-319-74724-8_19
Gümüş, M., and Cengizhan, D. (2022). Effects of pulse like ground motion records with and without acceleration pulses on the earthquake responses of structures with varying dynamic properties. Structures 45, 427–436. doi:10.1016/j.istruc.2022.09.042
Hartzell, S. (1979). Analysis of the bucharest strong ground motion record for the March 4, 1977 Romanian earthquake. Bull. Seismol. Soc. Am. 69 (2), 513–530. doi:10.1785/bssa0690020513
Hayati, H., Eager, D., Pendrill, A.-M., and Alberg, H. (2020). Jerk within the context of science and engineering—a systematic review. Vibration 3 (4), 371–409. doi:10.3390/vibration3040025
He, H., Li, R., and Chen, K. (2015). Characteristics of jerk response spectra for elastic and inelastic systems. Shock Vib. 2015 (January), 1–12. doi:10.1155/2015/782748
Horiuchi, S., Horiuchi, Y., Yamamoto, S., Nakamura, H., Wu, C., Rydelek, P. A., et al. (2009). Home seismometer for earthquake early warning. Geophys. Res. Lett. 36 (5). doi:10.1029/2008gl036572
Ifrim, M. (1979). “Earthquake of March 4, 1977, in Romania - damage and strengthening of structures,” in Proceedings of the 3rd Canadian conference on earthquake engineering, 1277–1306.
INCDFP (2025). INCDFP - catalog ROMPLUS. Available online at: https://www.infp.ro/index.php?i=romplus (Accessed January 23, 2025).
Irimia, C. M., and Sofronie, R. (2021). Reinforcing original masonry with polymer grids. IOP Conf. Ser. Earth Environ. Sci. 664 (1), 012077. doi:10.1088/1755-1315/664/1/012077
Irimia, M. (2021). Seismic response of three-lobed shape. Bul. Institutului Politehnic Gheorghe Asachi Din. Iaşi. Construcţii. Arhit. Sect. 67 (1), 31–46. doi:10.2478/bipca-2021-0003
ISO (2018). ISO 2041:2018. Mechanical vibration, shock and condition monitoring—vocabulary. Geneva, Switzerland: International Organization for Standardization.
JCSS (2001). JCSS probabilistic model code section 2.17: earthquake. Available online at: https://www.jcss-lc.org/publications/jcsspmc/earthquake1b.pdf (Accessed January 30, 2025).
Kennedy, R. P., and Shinozuka, M. (1989). Recommended minimum power spectral density functions compatible with NRC regulatory guide 1.60 response spectrum. Upton, NY, United States: Prepared for Brookhaven National Laboratory.
Lee, G. R., Ralf, G., Filip, W., Wohlfahrt, K., and O’Leary, A. (2019). PyWavelets: a Python package for wavelet analysis. J. Open Source Softw. 4 (36), 1237. doi:10.21105/joss.01237
Lungu, D., Aldea, A., Demetriu, S., Cornea, T., and Craifaleanu, I. (1995). “Uniform hazard response spectra in soft soil condition and EUROCODE 8,” in Proceedings of the seventh international conference on applications of statistics and probability in civil engineering. Editors M. Lemaire, J. L. Favre, and A. Mebarki (Rotterdam: A. A. Balkema), 619–626.
Lungu, D., Cornea, T., and Demetriu, S. (1992). “Frequency bandwidth of Vrancea earthquakes and the 1991 edition of seismic code in Romania,” in Tenth world conference on earthquake engineering (Rotterdam: AA Balkema), 5633–5638.
Lungu, D., and Craifaleanu, I. G. (2010). “Seismic assessment and retrofitting of existing structures in Romania: background, programs, regulatory basis,” in Safety and reliability of industrial products, systems and structures. Editor C. Guedes Soares (Boca Raton, FL: CRC Press), 245–259. doi:10.1201/b10572-27
Majdi, A., Kontoni, D.-P. N., and Almujibah, H. (2024). Correlation of the near-fault pulse-like ground motion characteristics with the vulnerability of buildings. Buildings 14 (9), 2801. doi:10.3390/buildings14092801
Malhotra, P. K. (2009). Response of buildings to near-field pulse-like ground motions. Earthq. Eng. and Struct. Dyn. 28 (11), 1309–1326. doi:10.1002/(sici)1096-9845(199911)28:11<1309::aid-eqe868>3.0.co;2-u
Malushte, S. (1987). Prediction of seismic design response spectra using ground characteristics. Masters Thesis. Blacksburg, VA, USA: Faculty of the Virginia Polytechnic Institute and State University.
Mäntyniemi, P., Mârza, V., Kijko, A., and Retief, P. (2003). Nat. Hazards 29 (3), 371–385. doi:10.1023/a:1024787621646
Mariani, M., and Pugi, F. (2023). Impulsive actions due to seismic jerk and design of reinforcements to counteract their effects in masonry buildings. COMPDYN 2023. Eccomas Proceedia, 2777–2805. doi:10.7712/120123.10600.21447
Mehboob, S., and Zaman, Q. U. (2021). Vibration-based method for story-level damage detection of the reinforced concrete structure. Comput. Concr. Int. J. 27 (1), 29–39. doi:10.12989/cac.2021.27.1.029
Mohamed, B., and Tahar, E. (2017). “Remote sensing of damage bridge structure of free vibration by using finite element method based on subspace fitting,” in 2017 IEEE/ACIS 16th international conference on computer and information science (ICIS) (Wuhan, China), 329–334. doi:10.1109/ICIS.2017.7960014
Moustafa, A., and Izuru, T. (2010). Deterministic and probabilistic representation of near-field pulse-like ground motion. Soil Dyn. Earthq. Eng. 30 (5), 412–422. doi:10.1016/j.soildyn.2009.12.013
Nakazawa, S., Ishihara, T., and Inooka, H. (2003). Real-time algorithms for estimating jerk signals from noisy acceleration data. Int. J. Appl. Electromagn. Mech. 18 (1-3), 149–163. doi:10.3233/jae-2003-282
Oh, C. K., Beck, J. L., and Yamada, M. (2008). Bayesian learning using automatic relevance determination prior with an application to earthquake early warning. J. Eng. Mech. 134 (12), 1013–1020. doi:10.1061/(asce)0733-9399(2008)134:12(1013)
Oncescu, M. C. (1984). Deep structure of the Vrancea region, Romania, inferred from simultaneous inversion for hypocenters and 3-D velocity structure. Ann. Geophys. 2, 23–28.
Papandreou, I. G., and Papagiannopoulos, G. A. (2019). On the jerk spectra of some inelastic systems subjected to seismic motions. Soil Dyn. Earthq. Eng. 126 (August), 105807–7. doi:10.1016/j.soildyn.2019.105807
Pavel, F. (2021). Analysis of pulse-like ground motion recordings from Vrancea intermediate-depth earthquakes. J. Seismol. 25 (2), 733–745. doi:10.1007/s10950-021-09988-x
Pavel, F., Popa, V., and Văcăreanu, R. (2018). Impact of long-period ground motions on structural design: a case study for bucharest, Romania. SpringerLink. doi:10.1007/978-3-319-73402-6
Petrescu, L., and Enescu, B. (2025). Seismicity of a relic slab: space–time cluster analysis in the Vrancea Seismic Zone. Earth, Planets Space 77 (1), 6. doi:10.1186/s40623-025-02136-6
Prieto, G. A., Beroza, G. C., Barrett, S. A., López, G. A., and Florez, M. (2012). Earthquake nests as natural laboratories for the study of intermediate-depth earthquake mechanics. Tectonophysics 570-571, 42–56. doi:10.1016/j.tecto.2012.07.019
Radulian, M., Mândrescu, N., Panza, G. F., Popescu, E., and Utale, A. (2000). Characterization of seismogenic zones of Romania. Pure Appl. Geophys. 157 (1), 57–77. doi:10.1007/pl00001100
Sandi, H., and Borcia, I. S. (2010a). Intensity spectra versus response spectra: basic concepts and applications. Pure Appl. Geophys. 168 (1-2), 261–287. doi:10.1007/s00024-010-0158-1
Sandi, H., and Borcia, I. S. (2010b). A summary of instrumental data on the recent strong Vrancea earthquakes, and implications for seismic hazard. Pure Appl. Geophys. 168 (3-4), 659–694. doi:10.1007/s00024-010-0157-2
Sandi, H., and Perlea, V. (1982). “Engineering studies on earthquake ground motion,” in The Romania earthquake of March 4, 1977. Editors St. Balan, V. Cristescu, and I. Cornea (Bucharest, Romania: Editura Academiei).
Segawa, R., Yamamoto, S., Sone, A., and Masuda, A. (2000). “Cumulative damage estimation using wavelet transform of structural response,” in Proceedings of the 12th world conference on earthquake engineering (Auckland, New Zealand).
Seismic Database for Romanian Earthquakes (2001). INFP-INCERC joint research project performed in the framework of the MENER Programme. Romanian Ministry Res. Technol.
Sofronie, R. (2017). On the seismic jerk. J. Geol. Resour. Eng. 5 (4). doi:10.17265/2328-2193/2017.04.001
Sofronie, R., Feodorov, V., Cazamir, R., and Gruia, L.-C. (2018). “Seismic response of vernacular buildings,” in Proceedings of the ICOMOS inter-ISC meeting and colloquium: anti-seismic vernacular Heritage of Anatolia and beyond, kastamonu (Turkey), 1–12.
Steiner, W. (2021). On the impact of the jerk on structural dynamics. PAMM 21 (1). doi:10.1002/pamm.202100202
Taushanov, A. (2018). Jerk response spectrum. Annu. Univ. Archit. Civ. Eng. Geodesy Sofia 51 (2), 39.
Taushanov, A. (2019). Jerk at the combined response spectrum graph. Annu. Univ. Archit. Civ. Eng. Geodesy Sofia 52 (3), 767.
Tong, M., Wang, G.-Q., and Lee, G. C. (2005). Time derivative of earthquake acceleration. Earthq. Eng. Eng. Vib. 4 (1), 1–16. doi:10.1007/s11803-005-0019-6
Travasarou, T., Bray, J. D., and Abrahamson, N. A. (2003). Empirical attenuation relationship for Arias intensity. Earthq. Eng. and Struct. Dyn. 32 (7), 1133–1155. doi:10.1002/eqe.270
Vukobratović, V. (2015). The Influence of Nonlinear Seismic Response of Structures on the Floor Acceleration Spectra. Uni-Lj.si, January. Available online at: https://repozitorij.uni-lj.si/Dokument.php?lang=eng&id=86170&dn= (Accessed January, 2025).
Vukobratović, V. (2022). “The influence of jerk on the seismic responses of rigid linear elastic and nonlinear SDOF systems,” in Proceedings of the 19th international symposium of Macedonian association of structural engineers, 558–566.
Vukobratović, V., and Ruggieri, S. (2022). Jerk in earthquake engineering: state-of-the-art. Buildings 12 (8), 1123–23. doi:10.3390/buildings12081123
Wang, G., Blume, F., Meertens, C., Ibanez, P., and Schulze, M. (2012). Performance of high-rate kinematic GPS during strong shaking: observations from shake table tests and the 2010 Chile earthquake. J. Geodetic Sci. 2 (1), 15–30. doi:10.2478/v10156-011-0020-0
Wenzel, F., Lorenz, F. P., Sperner, B., and Oncescu, M. C. (1999). Seismotectonics of the Romanian Vrancea area. Adv. Nat. Technol. Hazards Res., 15–25. doi:10.1007/978-94-011-4748-4_2
Yaseen, A., Ahmed, M., and Al-kamaki, Y. (2020). The possibility of using jerk parameters as seismic intensity measure. J. Univ. Duhok 23 (2), 254–277. doi:10.26682/csjuod.2020.23.2.21
Zaharia, B., Enescu, B., Radulian, M., Popa, M., Koulakov, I., and Parolai, S. (2009). Determination of the lithospheric structure from Carpathians Arc bend using local data. Romanian Rep. Phys. 61 (4), 748–764.
Zaicenco, A., Alcaz, V., and Sandu, I. (2007). “2D FEM simulation of earthquake ground motion in sedimentary basin,” in Paper presented at the 2007 international symposium on seismic risk reduction, bucharest, Romania. Available online at: https://www.researchgate.net/publication/272168123_2D_FEM_Simulation_of_Earthquake_Ground_Motion_in_Sedimentary_Basin (Accessed January 25, 2025).
Keywords: seismic jerk, Vrancea earthquakes, strong ground motion, seismic mapping, time derivative of acceleration, jolt
Citation: Craifaleanu I-G (2025) An in-depth investigation of ground jerk characteristics for the four strongest Vrancea (Romania) earthquakes in the past half-century. Front. Built Environ. 11:1569201. doi: 10.3389/fbuil.2025.1569201
Received: 31 January 2025; Accepted: 25 March 2025;
Published: 11 April 2025.
Edited by:
Izuru Takewaki, Kyoto Arts and Crafts University, JapanCopyright © 2025 Craifaleanu. This is an open-access article distributed under the terms of the Creative Commons Attribution License (CC BY). The use, distribution or reproduction in other forums is permitted, provided the original author(s) and the copyright owner(s) are credited and that the original publication in this journal is cited, in accordance with accepted academic practice. No use, distribution or reproduction is permitted which does not comply with these terms.
*Correspondence: Iolanda-Gabriela Craifaleanu, aW9sYW5kYS5jcmFpZmFsZWFudUB1dGNiLnJv, aW9sYW5kYUBpbmNkLnJv