 Lingjin Zhu1,2
 Qiang Yuan
 Mingtian Zhang
- 1Shanghai Datun Energy Resources Co., Ltd., Shanghai, China
- 2China National Coal Group Corporation, Beijing, China
- 3State Key Laboratory of Coal Mine Disaster Dynamics and Control, Chongqing University, Chongqing, China
- 4Information Institute, Ministry of Emergency Management of the PRC, Beijing, China
The effectiveness of roadway support in soft rock under high horizontal stress poses a critical technical challenge in underground engineering. It directly affects mine construction progress and mining safety. In response to support failures, such as significant deformation, sheet wall collapse, and roof fall, encountered during the high horizontal stress soft rock roadway support in coal mines, this study utilizes similar material model experiments to simulate actual roadway excavation processes, aiming to analyze the patterns of displacement, deformation, and failure in the surrounding rock during roadway excavation and assesses the effectiveness of different support methods. Simultaneously, FLAC3D was employed to simulate the working face to obtain the deformation and stress distribution patterns of the surrounding rock in the roadway. Field test verification was conducted using the fiber grating anchor monitoring system to validate the findings. The research findings demonstrate that the novel support design scheme effectively restricts the deformation and stress distribution in the surrounding rock, these research results not only provide a solid scientific foundation for selecting an appropriate support method for the soft rock roadways subjected to high horizontal stress, but also contribute to the enhancement of process safety risk control in coal mining.
1 Introduction
Coal, a finite mineral resource, serves as China’s primary energy source and industrial raw material (Qian, 2010; Xie et al., 2018; Zhang et al., 2024; AdebayoS, 2022; Li et al., 2023). Currently, the persistent energy shortage poses a long-term challenge to China’s economic and social development. Among various energy sources, coal occupies a dominant position in both production and consumption due to its reliable, affordable, and environmentally-friendly utilization methods (Pu, 2002; Yuan, 2021; Yang et al., 2025; Wang X. et al., 2025). With the continuous development of China’s economy, the demand for coal resources is increasing, and deep coal mining will inevitably continue to develop. However, with the depth increasing, the mining environment experiences notable changes as mining operations progress, leading to the emergence of increasingly complex gas occurrence conditions, these conditions are accompanied by elevated levels of ground stress, temperature, and karst water pressure, alongside the presence of strong mining disturbances. This combination of factors is commonly referred to as the “three highs and one disturbance” (Xie et al., 2012; Yuan et al., 2022; Zhu et al., 2022b; Rong et al., 2018; Wang et al., 2017). The safe extraction of deep coal resources is encountering significant challenges. The increasing demand for coal mining has led to a rise in soft rock mines due to greater mining depths. As a result, safety concerns regarding soft rock mine support have become more prominent, especially in high-stress soft rock roadways resulting from insufficient support design and engineering repairs. This not only leads to significant wastage of human and material resources but also poses a severe safety threat (Zhao et al., 2022a; Zhang and Yin, 2022; Hou et al., 2022). The deformation and failure mechanisms of soft rock roadways exhibit complex characteristics, posing significant and intricate challenges in providing effective support in underground engineering worldwide. Addressing these challenges is crucial for achieving both the objectives of “in-depth development” and “safe production” in the coal mining sector (Zhu et al., 2022a; Zhan et al., 2022; Wang et al., 2025a).
Currently, extensive research has been conducted by both domestic and international scholars on the support of soft rock roadways. In the realm of theoretical inquiry, He (2014) propose the theory of coupling and integrated support for critical components. Yu and Qiao, (1981) put forward the “theory of axis shift” and the “theory of system excavation control”. Dong et al. (1994), Dong. (2001) put forward “loose circle theory” and so on. In terms of mechanism research, Sun et al. (2023), Liu et al. (2022a), Yuan et al. (2022), Wang et al. (2022), Xi et al. (2022) and Zhu et al. (2022b) have carried out a lot of research on the stress evolution law, deformation and damage mechanism and support technology of soft rock roadway through numerical simulation. Li et al. (2023) explored the deformation mechanism of the extremely expanded soft rock roadway and established a mechanical model of the plastic zone. Yang et al. (2017) and Zhai et al. (2022) have carried out research on the drum bottom mechanism and floor failure characteristics and control of soft rock roadway with different geological conditions. Zhao et al. (2020) studied the surrounding rock control technology of deep soft rock roadway, including damage characteristics, roadway deformation mechanism and repair technology of surrounding rock. Li et al. (2020) conducted research on the damage mechanism and support technology for the large deformation and support problem of deep soft rock roadway. Ma et al. (2021) derived the theoretical solution of the optimal supporting pressure from the Drucker-Prager yield criterion and the steady-state creep criterion expressed as the third invariant of deviation stress. Cai et al. (2023) built a PPD model of the rock (body), by establishing the mechanical model of prestressed bolt support, Li et al. (2021) found that the initial deformation plastic area of soft rock roadway was mainly located in the left shoulder of the inclined shaft, among which the plastic area was mainly tensile failure. Jia et al. (2022) using theoretical analysis, field measurement, numerical simulation and other comprehensive research methods, the failure law of the roadway extreme soft roof of different top coal thickness under the action of mining is studied. Yu et al. (2020) studied the deformation characteristics and control factors of deep buried soft rock roadway under the influence of mining. Jiang et al. (2020) obtained the cooperative control principle of soft rock anchor in kilometer deep well. Wen et al. (2019) studied the bottom failure mechanism and support technology of soft rock mining roadway. Kang and Yi, (2023) established BVS model to solve the problems of deterioration, capacity expansion and rheological effect of surrounding rock in deep soft rock mining roadway. In the research aspect of supporting technology. Zhang et al. (2023) proposed the superposition community theoretical model and superposition joint support scheme of “anchor bolt (cable) + anchor net + anchor injection flexible bolt + shotcrete support”. Kang et al. (2015) studied the effectiveness and applicability of the bolt system in soft rock mass reinforcement. Wang et al. (2021) proposed a double-shell grouting technology for low-pressure grouting and high-pressure split grouting. Yuan et al. (2022) proposed a comprehensive surrounding rock management method of bolt-net-cable-serous coupling support, and analyzed the interaction mechanism between coupled support and surrounding rock through numerical simulation. Yang et al. (2019) proposed a new combination of“bolt-cable-net-shotcrete + shell”to support the ventilation roadway, and the new support design successfully controlled the large deformation of the roadway. Zeng et al. (2022) studied the deformation and failure characteristics of soft rock roadway, and proposed a comprehensive step by step joint support control strategy based on the numerical simulation results. Zhan et al. (2019) found that the convergence trend of omni-directional, strong rheological and large deformation is the essential characteristics of deep soft rock roadway deformation and the unreasonable design of support scheme and the destruction of support structure are the external factors that produce this influence. Zhao et al. (2022b) in view of the characteristics of large buried depth, high stress and low surrounding rock strength of Xinhu Coal Mine, proposed the joint support scheme of “concrete injection + grouting anchor bolt/anchor cable + ordinary anchor bolt/anchor cable”. Meng et al. (2016) analyzed the deformation and failure mechanism of deep high stress crushing soft rock roadway, and put forward the step-by-step joint support technical scheme of “anchor net cable spray + U-shaped steel bracket + grouting + bottom plate anchor injection”. Liu et al. (2022b) proposed the step-by-step combined support technology of deep weak broken roadway. Wu et al. (2024) proposed a new collaborative control strategy that combines anchoring, shotcrete, and grouting for supporting soft rock roadways. Zhu et al. (2023) determined the key parts of the surrounding rock that are prone to instability through numerical simulation, selected appropriate arrangements and parameters for side tunnel drilling pressure relief, floor grouting, floor trenching, and secondary support of floor anchor bolts.
Currently, a lot of research results have been made in terms of mechanism and technology, however, it is evident that numerous issues still require in-depth exploration. For instance, theoretical research in this field noticeably lags behind engineering application research. The predominant use of low anchorage force end anchors and full-anchor anchors, while the utilization of resin full-length anchorage anchors remains relatively minimal. Furthermore, there is no unified understanding of the anchor reinforcement mechanism, and the absence of effective and rational calculation methods hampers progress. Theoretical analysis and numerical simulation often exhibit significant discrepancies when compared to real-world scenarios. These challenges highlight the need for further investigation and development in these areas. Insufficient research on the support of high-stress soft rock roadways has resulted in poor support effectiveness for a significant number of coal mines. Wall caving, with the continuous development of coal mining, there is still insufficient research on high-stress soft rock roadway support. As a result, many soft rock roadways in coal mines exhibit poor support effectiveness, leading to wall caving and roof collapse during infrastructure construction and mining operations.
The inadequate safety reliability of these roadways fails to meet the demands of mine safety production, severely restricting the safety and efficiency of mining operations. Therefore, there is a critical need to focus on the support of soft rock roadways, including understanding the deformation and stress distribution laws of surrounding rocks, selecting appropriate support methods, studying the impact of mining on soft rock roadways, and developing effective support technologies. This research has significant theoretical implications and practical applications for ensuring safe coal mining operations, especially under high levels of stress. It plays a crucial role in future longitudinal development and production. Specifically, in this study, we examine the effects of high stress levels in coal mines on soft rock roadways, such as top subsidence, fractures, cracks, and the occurrence of the serious bottom drum phenomenon. Firstly, a comparative study was undertaken to optimize the support of mining roadways using similar model materials. The objective was to investigate the distribution of supporting pressure in the substrata. This paper presents a systematic examination of the surrounding rock deformation during roadway excavation, stress variations in two coal wall gangs, and changes in anchor tail forces. To validate the findings, a comprehensive application of FLAC3D numerical software was utilized for simulation verification, along with an industrial experiment using an optical fiber grating bolt monitoring system. The research results have important significance for understanding the failure mechanism of support in deep soft rock mining roadways, ensuring high efficiency and safety in the process of coal mining, and also offer valuable guidance for supporting deep and high-level stress soft rock roadways.
2 Project overview
2.1 Geological conditions of mining area
The study area is located in Majiata Town, Lingwu City, Ningxia Hui Autonomous Region, China. This area features complex geological structures, with coal-bearing strata belonging to the Jurassic Yan’an Formation. The location of mining area is shown in Figure 1. The main mining coal seam has an average thickness of 30.5 m. However, the roadway surrounding rock predominantly consists of interbedded mudstone and siltstone, locally intercalated with thin sandy mudstone layers, exhibiting typical soft rock characteristics: low compressive strength (uniaxial compressive strength generally <15 MPa) and water-induced softening (mudstone strength attenuation rate exceeds 50% after water immersion). Additionally, the regional in situ stress field is dominated by horizontal tectonic stress, with measured maximum horizontal principal stress reaching 25 MPa. Under superimposed mining-induced stress disturbances, soft rock roadways are prone to nonlinear large deformations such as floor heave, rib spalling, and roof subsidence. Particularly in fault zones and sandstone-mudstone interfaces, the surrounding rock exhibits significant rheological behavior, where time-dependent deformation can reach 2-3 times the initial deformation. These unique geographical and geological conditions impose higher demands on the support system.
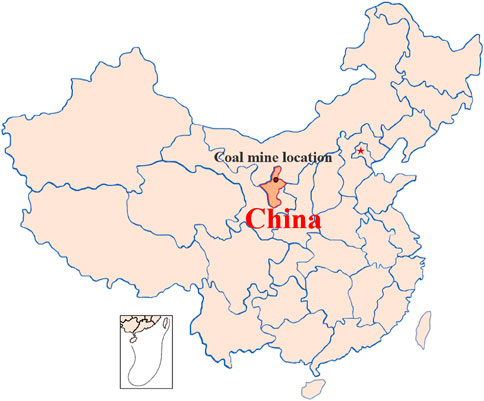
Figure 1. Location of mining area.
Based on the geological data obtained from the coal mine, the roof of coal seam consists of fine-grained sandstone characterized by rock pore development. This material is susceptible to weathering, has poor flooding resistance, and exhibits low strength, making it an unstable rock mass. It lacks firmness and easily collapses during coal seam mining, with a compressive strength of 0.4 MPa. The top plate experiences cyclic pressure and is prone to falling. The bottom plate, on the other hand, is composed of siltstone with low rock strength, poor water resistance, weathering resistance, and frost resistance. It is prone to softening and exhibits poor rock firmness, with a unidirectional compressive strength of 0.3 MPa, making it a very weak bottom plate. The coal strips within the coal seam display brown and black colors, with teski coefficient f < 1. They exhibit stepped, uneven, and flat fractures, with developed endogenous cracks. Some of these cracks are filled with calcite and pyrite, and pyrite tuberculosis is common in the coal. These characteristics collectively define the “three soft coal seams” - soft roof, soft bottom plate, and soft coal quality, indicating an overall loose rock structure that is prone to softening in water and weathering.
2.2 The current situation of roadway support
Currently, the functional face is in the mining phase. Based on the site investigation, the principal ore pressure on the roadway is the subsidence, fracture, and split of the roadway’s roof, and the bottom drum phenomenon is severe. The roadway is situated in a weak aquifer environment, where small water flow from the roof is common. The mudstone in the roof tends to disintegrate into sheets, making it highly susceptible to wind and water disturbances. Additionally, the water disturbance weakens the anchorage force at the end section of the anchor cable (rod), leading to accelerated deformation and significant deformations in the roadway roof layer and surrounding rock. As a result, the stability of the roadway is compromised, leading to an extended period of instability. Figure 2 illustrates the stratigraphic column and support status.
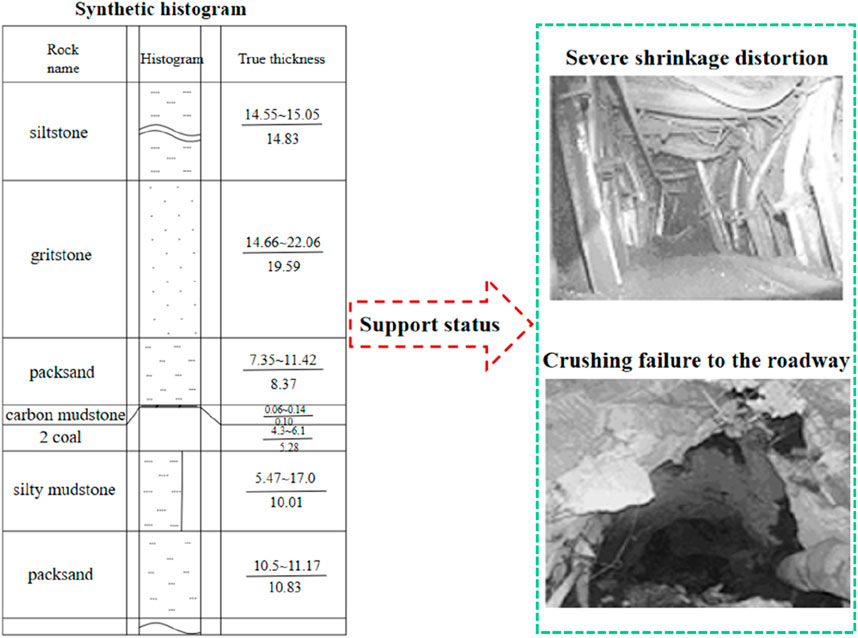
Figure 2. Stratigraphic column and support status.
3 Model test platform design
3.1 Model building
Based on field data, the field geological environment structure was simulated and a three-dimensional loadable experimental platform measuring 100 mm × 1,500 mm × 600 mm was utilized for the roadway similarity model experiment (Yuan et al., 2022; Yu et al., 2020; Ma et al., 2024). The experimental model size was set at 1,500 mm × 1,400 mm × 600 mm, with a laying height of 1,400 mm. The geometric ratio was set at 1:15, the time ratio at 1:3.87, the volume ratio at 1:1.6, and the similarity ratio for tension and intensity at 1:24. The prototype design is illustrated in Figure 3. In terms of comparable materials, the aggregate consists of river sand, quartz sand, and mica, while the cement is composed of large white particles, cement, and gypsum, as presented in Table 1. For the three-dimensional model frame, a hydraulic jack is employed as the top loading device to simulate mining depth and to apply lateral pressure loading at a specific moment. This approach enables a more accurate simulation of varying mining depths. To enhance the experiment’s precision, the model’s boundaries were reinforced with gypsum, and the front and back faces, except for the roadway excavation mouth, were fixed using plexiglass plates. This effectively constrains the boundary conditions.
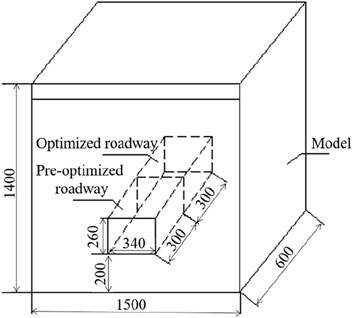
Figure 3. Pattern layout. (Unit: mm).
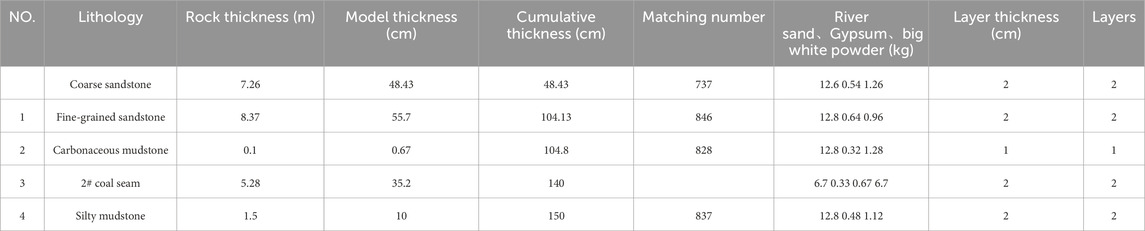
Table 1. Model-similar material ratio table Unit: mm.
3.2 Support and loading of roadway excavation
3.2.1 Excavation and support
The excavation was carried out based on the actual conditions. The average excavation speed of the working face roadway was 8 m/d. Considering the time and geometric similarity ratios, the excavation speed of the model was determined to be 0.14 cm/min. To ensure the integrity of the roadway section, three cuts were made according to the following specifications. In the first instance, the roadway had dimensions of 17 cm width and 13 cm height. In the second instance, the roadway was widened to 26 cm and its height increased to 26 cm. In the third instance, both sides of the roadway were further expanded to achieve the intended width of 34 cm.
In the model, the bolt length was set at 0.16 m, with a row distance of 53 mm × 53 mm between the bolts. The length of the two anchors was 0.13 m, and the row distance between the bolts was 83 mm × 53 mm. For support, wire mesh replaced the metal net, and a simple iron sheet was used instead of a steel belt. The support sequence involved the coal seam roof, followed by the coal belt, anchor rods, anchor nets, and steel belt. After excavation, the final 30 cm of the roadway in the model implemented the optimal support design strategy. As depicted in Figure 4, the two supports remained unchanged, the roof anchor length was 0.2 m, and the row spacing between the anchors was 53 mm × 53 mm.
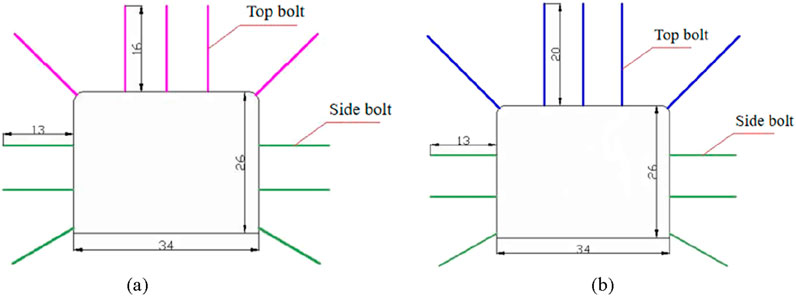
Figure 4. Section views of roadway anchor rod layout. (a) Section drawing of layout of original roadway bolt, (b) Optimize the layout of roadway anchor. (Unit: cm).
3.2.2 Model loading
At the top of the roadway, the measured vertical stress was 7.5 MPa, and the horizontal tension was 22.5 MPa. Based on the geometric similarity ratio, the vertical loading stress in the upper portion of the model was 0.31 MPa, while the lateral loading stress was 0.93 MPa. The loading device employs a 6-round hydraulic crane for uniform loading. The loading sequence began with vertical stress, followed by horizontal stress. Each round of loading applied a force of 1–2 tons vertically and laterally.
3.3 Monitoring point layout
In the experiment, equipment was positioned on top of the roadway’s roof to observe the displacement of the surrounding granite. The entire station was utilized for monitoring the measurement points. As shown in Figure 5a, a total of 70 measuring points were placed on the model frame to record the relationship between the position, size, and duration of the applied load. Additionally, high-precision percentage meters and micrometers were utilized to monitor the movement, deformation, and deterioration of the surrounding granite. Figure 5b illustrates the monitoring of internal displacements within the roadway. These meters measure the movement of the left and right sides, roof subsidence, and floor change.
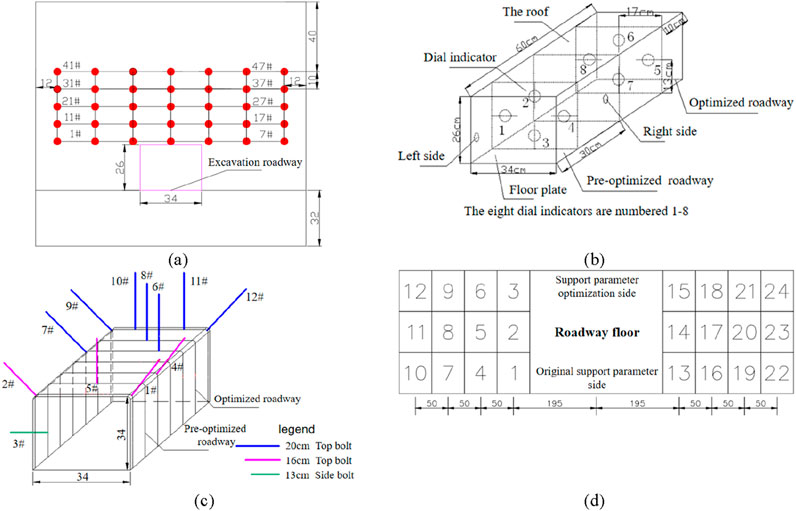
Figure 5. Measuring point layout. (a) Monitoring point arrangement, (b) Dial indicator erection diagram, (c) Bolt dynamometer layout, (d) Bottom sensor arrangement. (Unit: cm).
Force monitoring was conducted by attaching the tail of the anchor. As depicted in Figure 5c, a total of 12 micro anchor dynamometers were installed. The force exerted on the two coal walls of the roadway was monitored using a pressure sensor weighing one thousand kilograms at the model’s base. The installation of 24 pressure sensors, arranged in three rows and eight columns, enabled comprehensive data collection. The computer data acquisition system 108 was employed to collect data from the pressure sensors, with its specific position shown in Figure 5d. Figure 6 provides a visual representation of the instrument sampling.
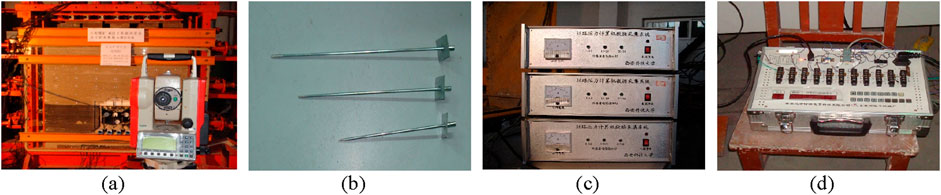
Figure 6. Experimental instrument diagram. (a) R series total station, (b) Anchor pole dynamometer, (c) 108 computer data acquisition system, (d) Strain gauge tester.
4 Experimentation project
4.1 Model building
The model measures 1,500 mm × 1,400 mm × 600 mm and is 1.4 m tall. After the model has been cured, the two free surfaces of the model are arranged, followed by the placement of measuring points above the roof of the original support design simulation roadway and the optimized support parameters. The two free faces of the model are reinforced with plexiglass plate in order to simulate the dynamic deformation of a roadway’s surrounding granite. The plate is 1,500 mm in length, 1,200 mm in height, and 20 mm in thickness. The building procedure is depicted in Figure 7.
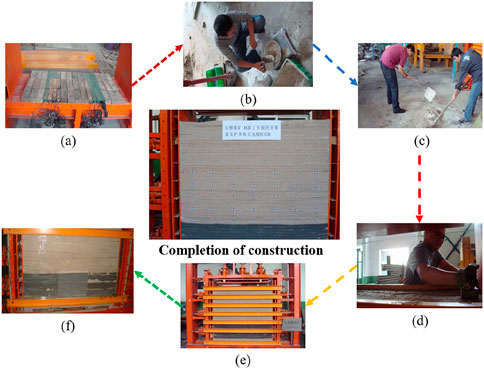
Figure 7. Model building process. (a) Pressure sensor laying, (b) Material weighing, (c) Material mixing, (d) Model stacking, (e) Natural withering, (f) Model reinforcement.
4.2 Experimentation
4.2.1 Model excavation
The model is subdivided into three excavations, and the bolt force measuring instrument and percentage meter are installed within the roadway. The method is illustrated in Figure 8.
(1) First excavation: the center of the excavated section of the carriageway aligns with the experimentally designed section, and the dimensions of the section are half the length and width of the designed section (17 mm × 130 mm). The roadway is excavated simultaneously from both the front and rear sides, passing through the center of the model. Prior excavation, each instrument must be calibrated, and data from both sides of the model and the top and bottom pressure of the model must be recorded. The excavation of the roadway segment is carried out once the data is stable.
(2) Second excavation: once the monitoring data approach stability, the width of the excavation roadway is expanded to 240 mm, and the height is adjusted to match the design height of the section. During the lane expansion, it is necessary to remove the charcoal mudstone above the roof, with a depth of 10 mm on the model. To prevent roof damage and crack formation, the roof is supported using an anchor-net-steel belt, and a bolt force measuring device is promptly installed.
(3) The third excavation: the left and right sides of the carriageway are expanded by 40 mm, followed by the installation of a double-gang support system and the erection of a percentage table.
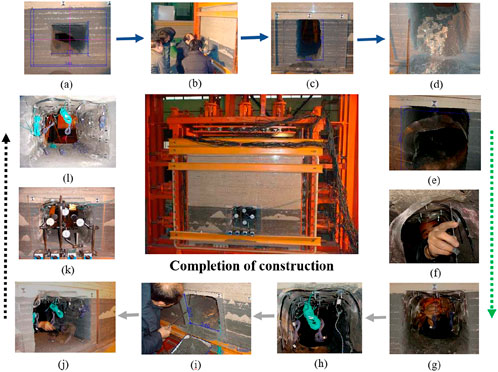
Figure 8. Model excavation process. (a) First excavation, (b) Roadway breakthrough, (c) Vertical expansion, (d) Falling mudstone, (e) Laying net, (f) Install the top bolt, (g) Force measuring device, (h) Expansion support, (i) Formed excavation, (j) Bolting with wire mesh, (k) Dial meter erection, (l) Support completed.
4.2.2 Model loading process
The model loading process continued for 8 days until the roof was completely destroyed, the top pressure was loaded with 10.25 t, while the side pressure was loaded with 8 t, divided into 10 increments. Upon completion, the loading pressure was maintained, and an additional 2 days were dedicated to collecting monitoring data to assess the final movement condition of the model’s rock strata. Data collection occurred before and after the loading of the model, with increased acquisition periods when significant changes were observed. Figure 9 provides a visual depiction of the loading process.
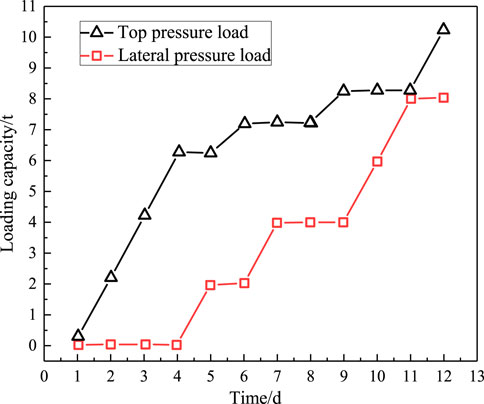
Figure 9. Model loading quantity-time curve.
During the initial to fifth longitudinal loadings of the model, with a cumulative top pressure loading of 7 t, the original support design simulation roadway exhibited various phenomena such as layer separation, fissures, cracks, roof collapse, and warping. On the other hand, the optimized design simulation roadway experienced only a minor roof collapse in a small area due to excavation, which was the only notable change observed. Prior to the sixth loading, with a top pressure of 7 t and a side pressure of 4 t, the optimized design simulated the emergence of side deformation and a small area of collapse at the edge of the roadway. To ensure the boundary effect of the experiment during the loading process, plastic foam was used to fill the landing points on both sides at the appropriate moment.
During the seventh to 10th loading stages, with a top pressure of 10 t and the side pressure unchanged, noticeable rock migration was observed around the original support design model roadway. The roof of the roadway suffered severe damage, with the eighth loading causing the extension of the roof layer on the roadway side to 23.3 cm and significant drumming phenomenon at the bottom. The roof layer on the roadway side experienced severe damage, exhibiting large cracks that almost spanned the entire roadway by the 10th loading. In contrast, the optimized design simulation showcased numerous fractures on the roadway side and longitudinal cracks throughout the entire model surface, while the roadway roof remained intact. After the final loading, it was determined that the original support design replicated the entire rock layer of the roadway’s roof, and the wooden support at the entrance resembled the actual site conditions. However, the optimized design simulation demonstrated that the roadway roof did not collapse and the roadway retained its original shape. Figure 10 illustrates the loading process.
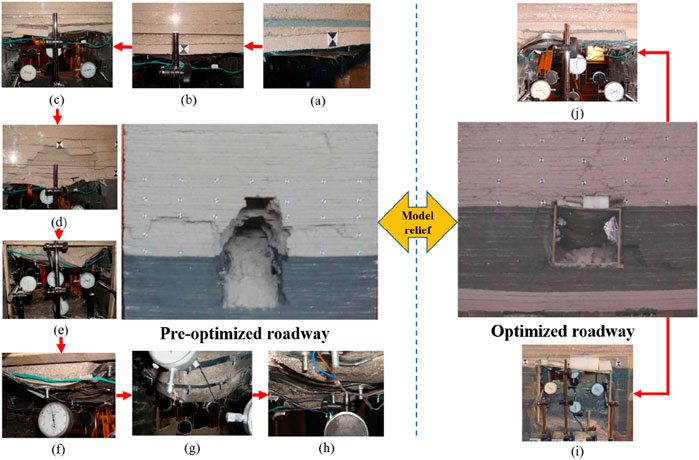
Figure 10. Roadway change diagram during model loading. (a) Roadway separation, (b) Separation at 4 cm, (c) Edge caving, (d) Roadway caving, (e) Roadway roof caved in, (f) Two sides moved in, (g) Caving back, (h) Severe roof damage, (i) Roadway support, (j) Roof of roadway.
5 Experimental analysis
5.1 Data processing and analysis of pressure sensor in roadway
With the longitudinal load of the model, two rows of pressure sensors were randomly selected to illustrate the variation in longitudinal loading pressure at the bottom sensor relative to its distance from the roadway, as shown in Figure 11.
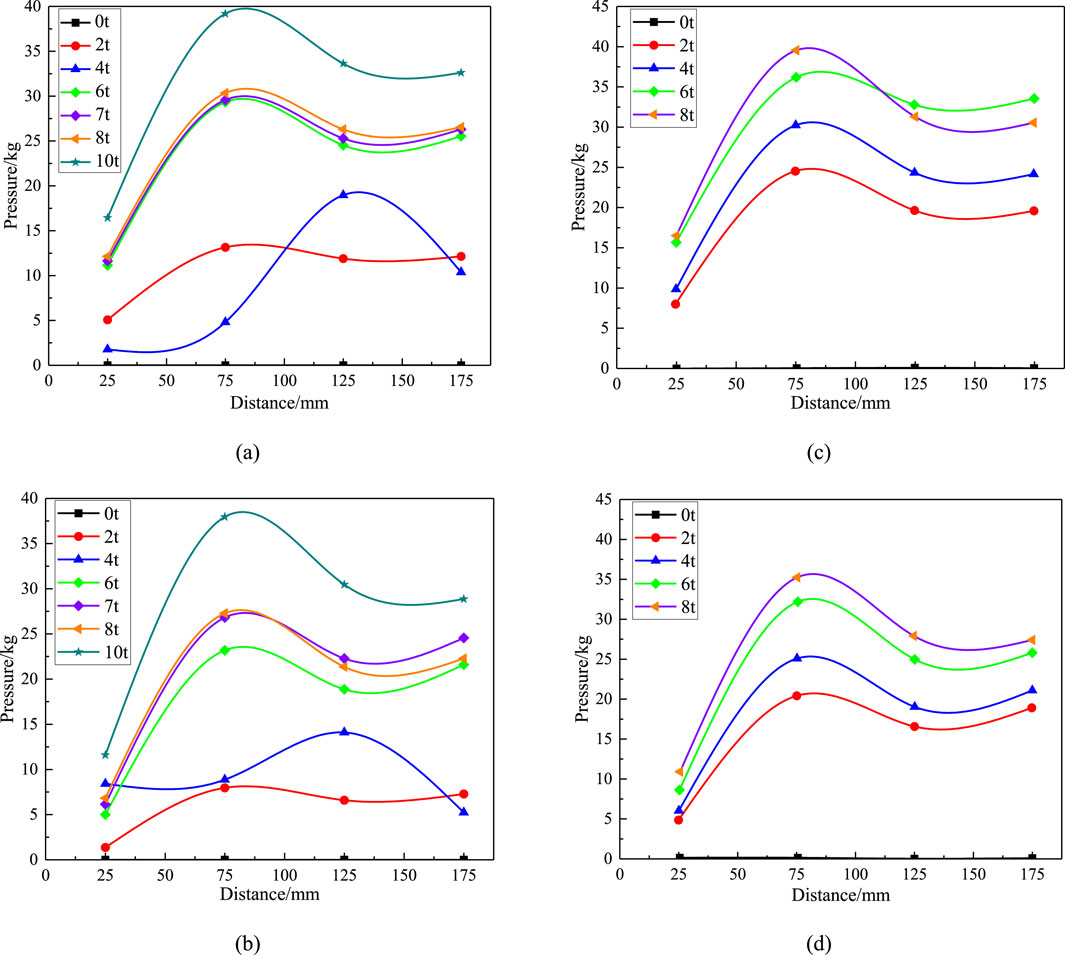
Figure 11. Change of load pressure-distance from roadway. (a) Longitudinal loading of row 1, (b) Longitudinal loading of row 3, (c) Horizontal loading of row 1, (d) Horizontal loading of row three.
As the longitudinal and transverse loads increase, the pressure change at the bottom sensor gradually increases. When the longitudinal load reaches 4 t, one end of the original support design of the model roadway collapses. The pressure at the bottom sensor located far from the roadway increases, while the pressure near the roadway decreases, indicating a transfer of pressure towards the far end of the roadway. Whether it is the longitudinal load or the transverse load applied to the model, the pressure is lowest in the two columns closest to the roadway, highest in the two columns of sensors next to the roadway, and intermediate in the other two columns of sensors. This distribution pattern adheres to the sustaining pressure distribution law on the roadway. When the longitudinal load reaches 10 t, the original support design simulation results in a significant collapse of the roof on one side of the roadway. The sensor pressure near the roadway undergoes minimal changes, while the sensor pressure far from the roadway experiences relatively greater changes, indicating that the pressure shifts towards the rock mass far from the roadway during this phase.
5.2 Dial indicator data analysis
Based on the data from the percentage table during loading, Figure 12 illustrates the corresponding change curves for different positions along the roadway. The analysis can be summarized as follows.
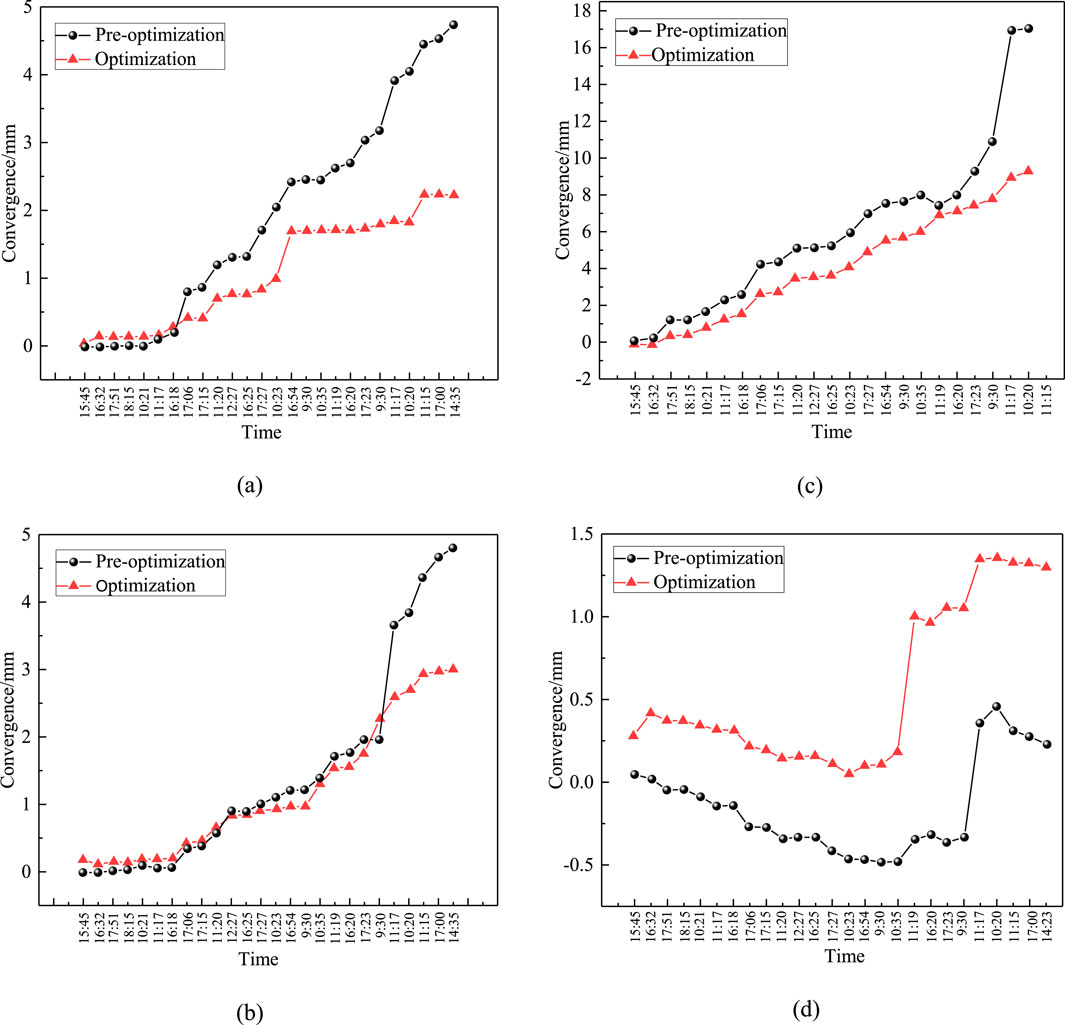
Figure 12. Dial indicator data change chart. (a) Quantity of left side, (b) Quantity of right side, (c) Quantity of roof, (d) Quantity of floor.
5.2.1 Analysis of deformation on both sides
The maximum amount of left-side displacement in the roadway simulation section of optimized support design is 2.240 mm. In comparison, the maximum left-side displacement in the simulation section of the original support design roadway is 4.741 mm. Additionally, the maximum right-side displacement in the simulation section of the original support design roadway is 3.010 mm. The analysis reveals that when the top pressure reaches 4.25 t, the model enters the compaction stage, leading to the closure of small gaps within the model. As the top pressure increases to 6 t, the support undergoes changes, and the overall trend approaches linearity, indicating elastic-plastic deformation of the rock mass. Continuing to increase the top pressure to 8.25 t and with a side pressure load of 4 t, the rock mass enters the destruction stage.
5.2.2 Analysis of the roof subsidence quantity
The maximum value of roof subsidence in the simulation section of the optimized support design is 9.258 mm, while the highest value for the roadway in the original support design is 17.075 mm. As the top pressure increases from 0 to 7.25 t, the side pressure exhibits nearly linear changes, reaching 4 t. When the top pressure reaches 8.25 t, and the side pressure simulates the original support design, the rock mass enters the destruction stage. Continuing to increase the top pressure to 10.25 t, with a side pressure load of 8 t, the roof reaches its maximum limit of 1 cm.
5.2.3 Analysis of the bottom plate deformation quantity
The maximum left bottom displacement in the optimized support design is 1.303 mm, while the maximum bottom displacement in the simulation of the original support design is 0.23 mm. Analysis reveals that since the beginning of loading, the floor data has shown a decreasing trend, indicated elastic compression of the floor while experienced roof sinking. Upon reaching a top pressure of 7.25 t and a side pressure of 4 t in the simulation of the original support design roadway, the floor undergoes significant changes, exhibiting increased deformation and entering the drumming stage at the bottom. As the top pressure reaches 10.25 t and the side pressure reaches 8 t, the roof ruptures. In the simulation of the optimized support design roadway section, the floor remains in an elastic compression state until a top pressure of 7.25 t is reached, resulting in compressive subsidence. At this stage, the optimized support design simulation section exhibits bottom drumming. As the top pressure continues to increase to 8.25 t and the side pressure reaches 8 t, the bottom undergoes drastic changes, entering the drumming stage, and ultimately reaching a destructible state.
5.3 Analysis of the anchor bolt dynamometer data
Observing the distinctive characteristics of the bolt dynamometer data in the upper left, upper right, and lower left corners of both the original support design section and the support design optimization section, as shown in Figure 13.
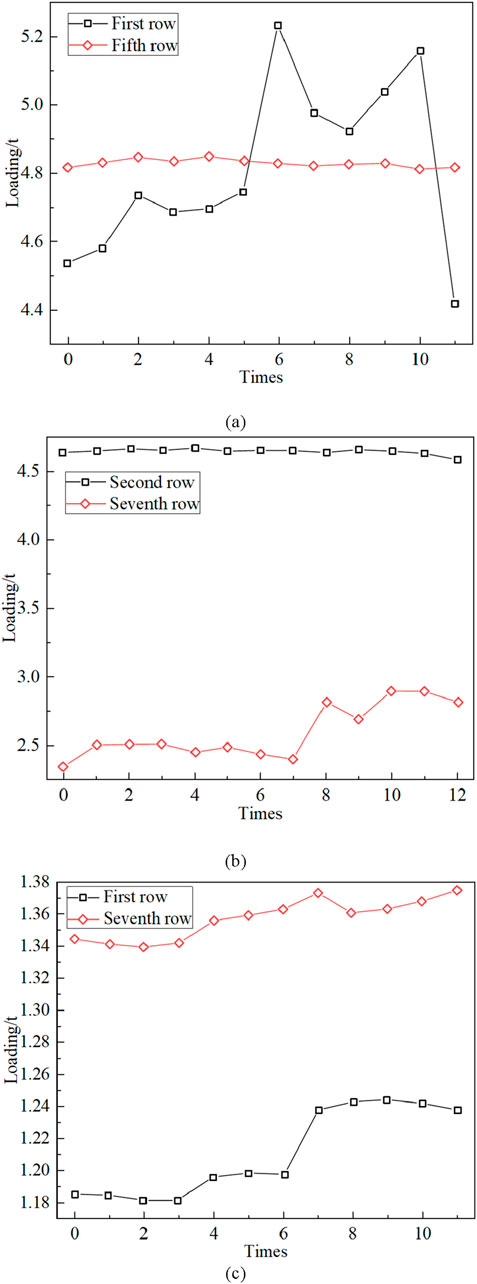
Figure 13. Change diagram of the bolt force. (a) Left side, (b) Roadway roof, (c) Right side.
In the first row, the left corner represents the roadway section of the original support design, while the left corner of the fifth row represents the roadway section of the optimized support design. The force of the bolt gradually reaches its maximum value of 5.303 t during the fourth longitudinal load (7 t) and lateral load (2 t), which corresponds to the first visible damage in the roadway model. The concentrated stress for the maximum force of the anchor ranges from 4.809 t to 4.849 t. At this point, the simulated roadway in the original support design section deforms, and the bolt restricts this deformation. Thus, the force change of the bolt is more pronounced under the original support conditions compared to the optimized support design.
In the second row, the roof position range represents the roadway section of the original support design, while the seventh row represents the roadway section of the optimized support design. The sinking of the roof causes the micro bolt to slide, resulting in a significant decrease in bolt force. The figure illustrates the fluctuation and abrupt decrease, even to negative values, of the bolt’s force. The minimum and maximum values for the top bolt in the second row are 4.59 t and 4.669 t, respectively, with a small change range. In contrast, the minimum force of the top bolt in the seventh row is 2.346 t, reaching its maximum value of 2.899 t during the fifth lateral load (8 t) and longitudinal load (8 t). The force change of the fastener on the roadway’s roof is more apparent than under the initial support conditions. This is due to the original support design simulating the sinking of the roadway anchor with the roof without providing a specific suspension effect and having a small tail force on the bolt. In contrast, the top anchor in the seventh row plays a hanging role on the roof, resulting in a more pronounced force change than under the original support conditions.
In the first row, the position range of the right corner represents the roadway section of the original support design, while the right corner of the seventh row represents the roadway section of the optimized support design. As the loading progresses, the force of the anchor at the right corner of the first row increases from 1.344 t to 1.374 t, and the force at the right end of the first row increases from 1.185 t to 1.244 t in the right corner of the roadway.
In both the first row and the seventh row, the force of the bolt gradually increases, with a more pronounced trend as the loading progresses. At the conclusion of the loading, the force in the first row reaches its maximum value of 1.344 t, starting from an initial value of up to 1.344 t, while the force at the right corner of the seventh row reaches its maximum value of 1.185 t, starting from an initial value of up to 1.244 t.
At the end of the loading, as the loading duration increases, the force at the right corner of the first row increases from the initial value of 1.344 t to 1.374 t, and the force at the right end of the seventh row increases from 1.185 t to 1.244 t in the right corner of the roadway. Overall, the bolt force changes more dramatically under the initial support conditions than after optimization, as indicated by the overall change trend.
5.4 Total station data analysis
The total station is utilized to monitor and collect data from each measuring point during the loading of the model, The second row of measuring points along the roadway is selected to generate the sinking curve, as depicted in Figure14.
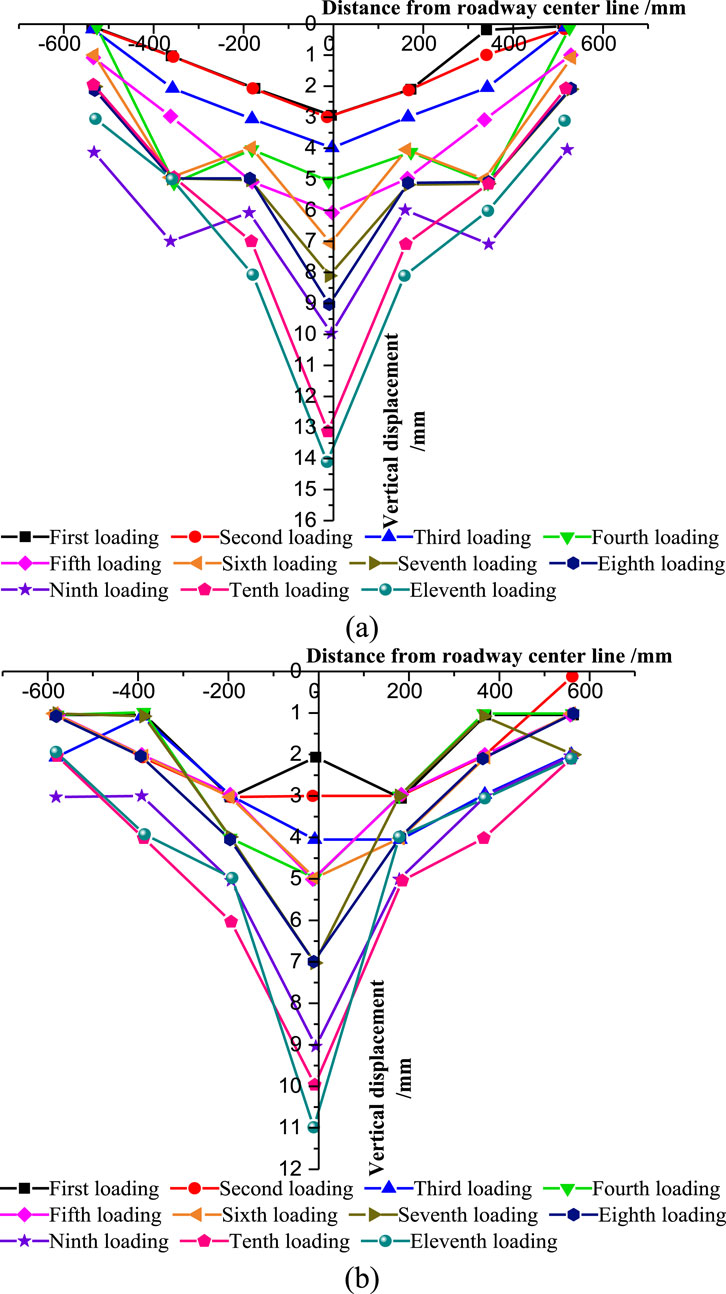
Figure 14. Sinking curve diagram. (a) Original 11-17 #, (b) Optimized after the 11-17 #.
As shown in Figure 14a, the minimum subsidence at the 14 # point in the stratum is 3 mm, while the maximum subsidence is 14 mm. The 11 # and 17 # points on both sides of the model exhibit a maximum subsidence of 5 mm, whereas the 14 # points in the middle have a maximum displacement difference of 9 mm. Notably, the 14 # point experienced a sudden subsidence of 3 mm between the ninth and 10th loading, indicating a relatively abrupt sinking amplitude. This comparison illustrates that the original surface bolt support is suboptimal for controlling roof stability in this particular stratum.
Figure 14b demonstrates that the minimum subsidence at the 14 # point is 2 mm, while the maximum subsidence is 11 mm. The maximum subsidence at points 11 # and 17 # on both sides of the model is 3 mm. Furthermore, the greatest displacement difference, originating from the 24 # point is 8 mm. The maximum subsidence at sites 11 # and 17 # on both sides of the original surface reached 8 mm. It is evident that surface optimization, specifically the implementation of anchor net cable support, positively influences subsidence control on both sides of the roof.
To compare the design surface settlement before and after optimization, the settlement measurements at points 14# to 44# were subjected to statistical analysis, as depicted in Figure 15. The northern 14# point experienced a maximum subsidence of 16 mm, while the southern 14# point exhibited a maximum subsidence of 8 mm, resulting in a relatively dense subsidence curve. This demonstrates that the anchor cable net support has provided adequate reinforcement. After the third longitudinal loading of 6 t, the model detached from the layer and a fracture appeared on the left side of the northern roadway. The vertical displacement of each point, from the top pressure of 6 t to the lateral pressure of 1 t, varies significantly, as shown in Figure 15a. During the control test procedure, when a lateral loading of 4 t was applied, stress redistribution occurred, the fissure became more pronounced, and the vertical displacement at the 14# point under a lateral pressure of 4 t reached 12 mm, which is 4 mm higher than the displacement under a lateral pressure of 2 t. This indicates that a lateral pressure of 4 t has a relatively significant impact on the model.
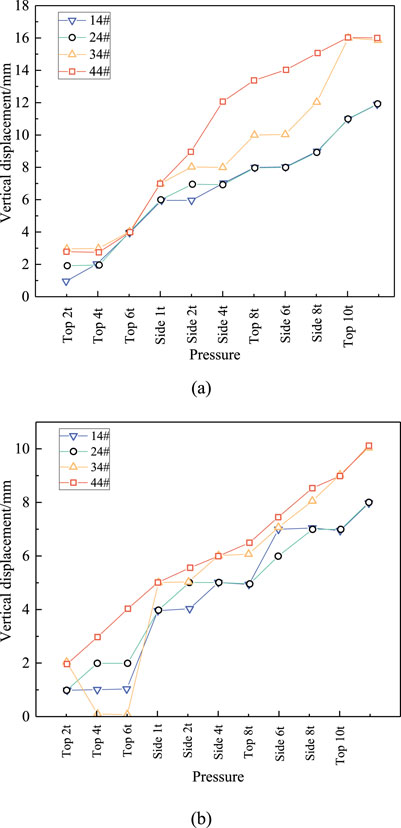
Figure 15. Settlement comparison diagram. (a) Original 14 # −44 #, (b) Optimized 14#-44#.
5.5 Discussion of similar model test results
A three-dimensional physical similarity material model experiment was conducted to investigate the effectiveness of various support forms in soft rock roadways. The study aimed to understand the detachment and collapse characteristics of the rock mass at different positions on the roof under different stress conditions. The specific analysis is presented as follows.
(1) The pressure supported by the bottom plate of the model gradually increased with the applied load. During the loading process, it was observed that the pressure change recorded by the pressure sensors was influenced by the distance from the roadway. The sensors closer to the roadway exhibited smaller pressure variations, indicating the transfer of pressure towards deeper parts of the surrounding rock. However, due to limitations in the model boundaries and sensor placement, the peak pressure values were not obtained in the experiment.
(2) The displacement of the left and right sides, as well as the top and bottom plates in the simulated section of the newly designed support roadway, was significantly smaller compared to that in the simulation section of the original support design roadway. The roof deformation in the original support design simulation roadway occurred earlier and was more severe compared to the new support design simulation roadway.
(3) The experiment revealed that the anchor rods in the simulated roadway of the original support design sank along with the movement of the rock layer. However, the anchor rods in the simulated roadway of the new support design experienced minimal changes due to mining activities and confining pressure. Further analysis indicated that the insufficient constraint length of the anchor rods in the original support design simulated roadway and their lack of suspension effect on the roof rock layer were the main contributing factors.
(4) During the loading process, as the applied pressure increased, the overlying rock layers in the roadway underwent various degrees of movement and deformation. Notably, significant changes were observed in a row of measurement points above the roadway’s centerline. However, the settlement of the first layer of the simulated roadway after loading in the new support design was significantly smaller compared to that of the original support design simulation roadway.
6 Numerical simulation of roadway support parameters
A three-dimensional physical simulation experiment was conducted to investigate the effect of different support forms on soft rock roadways. The experiment aimed to determine the supporting method, parameters, and the variation pattern of surrounding rock failure under different roof positions and stress environments. FLAC3D software was utilized to systematically simulate and analyze the deformation, stress distribution, changes in the plastic zone, and failure characteristics of the roadway’s surrounding rock. This analysis was performed before and after optimizing the parameters of the roadway support, with the objective of further validating the stability of the surrounding rock following the optimization of support parameters.
6.1 Model building
In conjunction with the field, the dimensions of final model were calculated to be X × Y × Z = 65 m × 20 m×58 m, comprising 160,320 units and 173,117 nodes. The model was designed to restrict horizontal movement on the sides. while the bottom was fixed. The upper surface of the model represented the stress boundary, with an applied load of 7.5 MPa and horizontal tension of 22.5 MPa. These values aimed to simulate the dead weight boundary of the overlying rock mass. The material failure governed by the Mohr-Coulomb strength criterion, and the physical and mechanical parameters of the engineering granite mass are presented in Table 2.
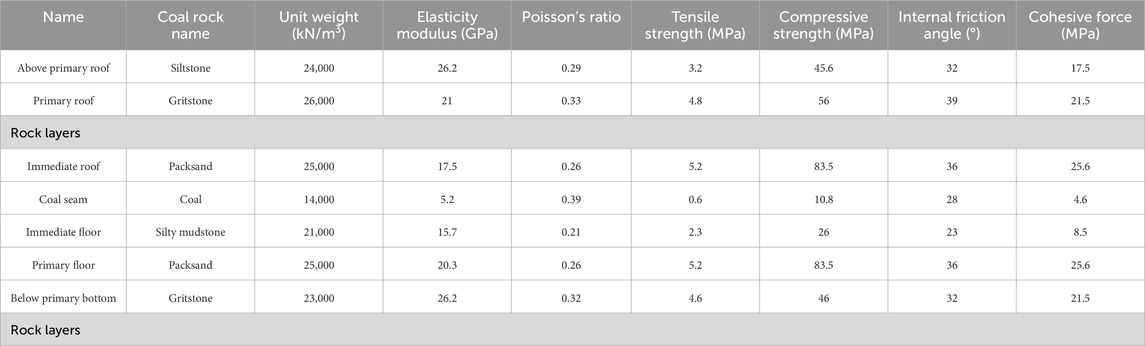
Table 2. Physical and mechanical parameters of the rock mass.
6.2 Analysis of numerical simulation results
Figure 16 illustrates the fastener (cable) layout for both the original support design and the optimized support design. The immediate bottom and immediate roof sections consist of dense grid cells with dimensions of 0.5 m × 0.5 m×0.5 m, while the primary top and primary bottom sections contain sparse grid cells with dimensions of 2.0 m × 2.0 m×2.0 m.
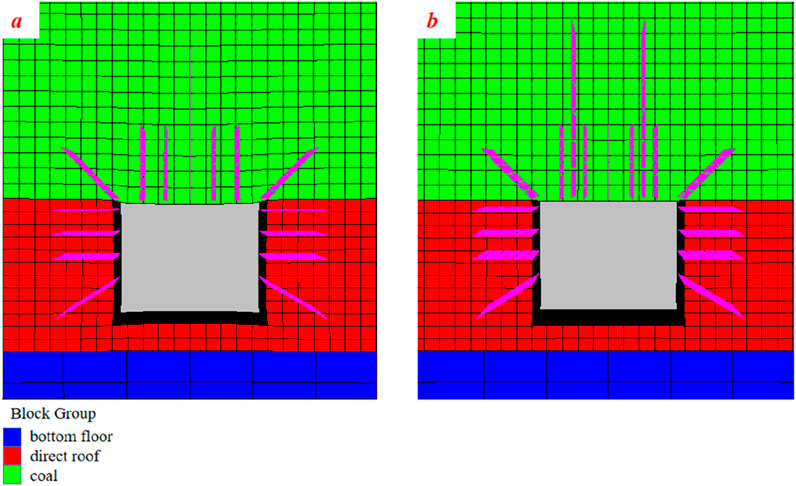
Figure 16. Layout drawing of the anchor bolt (cable). (a) Original support, (b) Optimized support.
6.2.1 Plastic zone distribution of surrounding rock before and after roadway optimization
As depicted in Figure 17, various plastic failure characteristics were calculated. The distribution of plastic zones around the roadway’s surrounding granite, before and after the optimization of the support design, exhibit the following characteristics.
(1) The distribution of the roadway’s plastic is symmetrical along its axis.
(2) The extent of the plastic zone on the roadway’s roof differs significantly from that on the two sides, with a greater depth of influence on the roof.
(3) The roadway-surrounding granite experiences greater shear damage, while the pilling force is relatively less pronounced.
(4) The optimized support design results in a smaller distribution range of the plastic zone compared to the original support design.
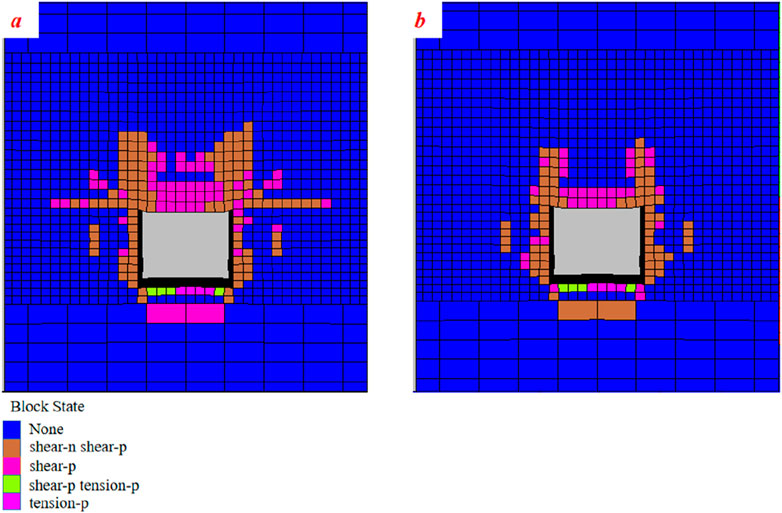
Figure 17. Different plastic failure characteristics. (a) Original support, (b) Optimized support.
6.2.2 Roof and floor settlement displacement before and after roadway optimization support
Figure 18 illustrates the displacement of the roof and floor of two different types of roadways support. In the original support design, the maximum subsidence and floor heave of the surrounding rock roof are 22.1 cm and 8.3 cm, respectively. In the optimized support design, the maximum subsidence and floor heave of the surrounding rock roof are 17 cm and 7.7 cm, respectively.
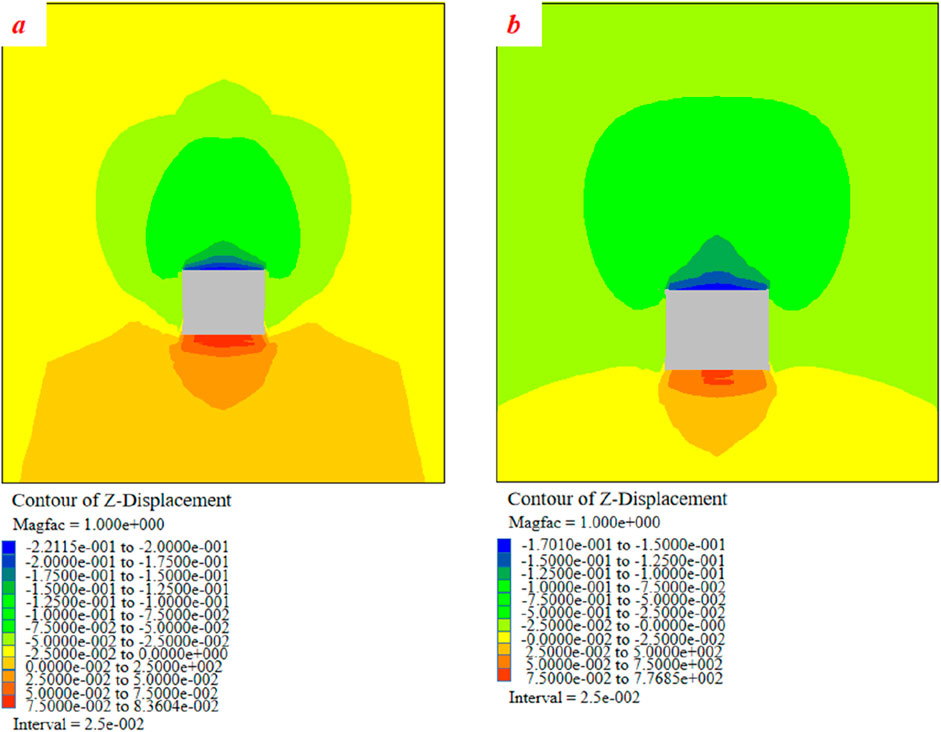
Figure 18. Displacement diagram of roof and floor. (a) Original support, (b) Optimized support.
6.2.3 Horizontal displacement before and after roadway optimization support
Figure 19 depicts the horizontal displacements of two different forms of roadway support. The original supporting design roadway exhibits horizontal displacements of 9.2 cm and 8.3 cm on the left and right sides, respectively. In contrast, the optimized supporting design roadway shows horizontal displacements of 4.83 cm and 4.84 cm on the left and right sides, respectively.
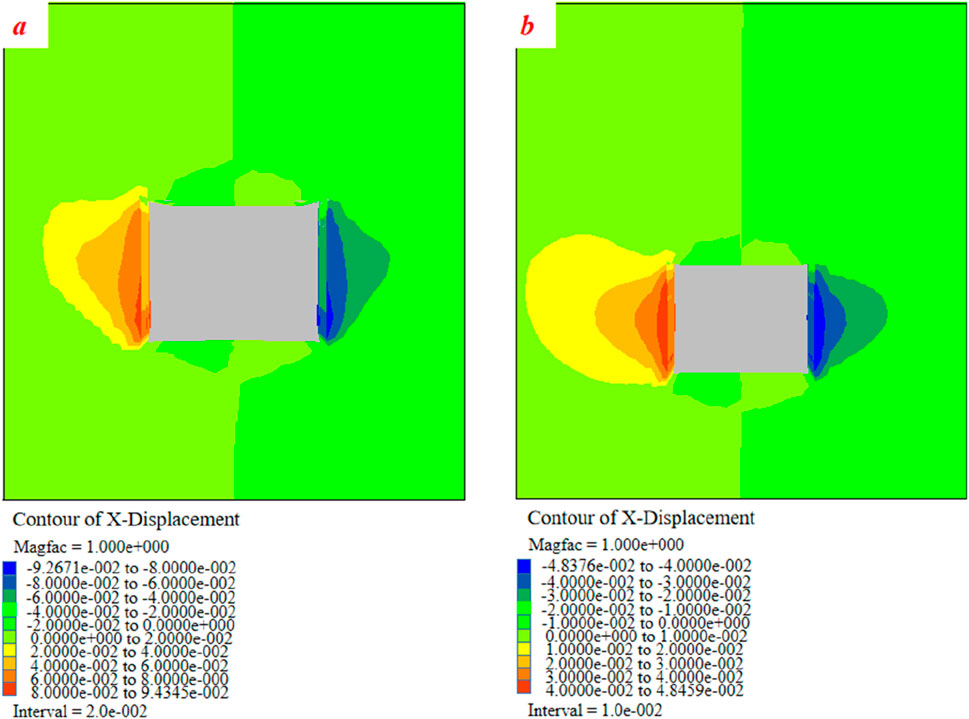
Figure 19. Horizontal displacement diagram. (a) Original support, (b) Optimized support.
6.2.4 Main stress of roadway surrounding rock before and after roadway optimization support
Figure 20 illustrates the cloud diagram displaying the principal stress distribution of the surrounding rock in a roadway with two different support forms. The stress distribution of the surrounding rock body reveals the following observations.
(1) The stress in the surrounding rock is symmetrical and exhibits a uniform distribution.
(2) The main stress in the surrounding rock is relatively low, ranging from 1 to 2 MPa, while the depth reaches 3 to4 MPa. The higher stress tends to shift towards greater depths.
(3) After optimizing the roadway support, there is an increase in shallow stress in the surrounding rock, with stress concentration occurring at the shoulder corner of the roadway.
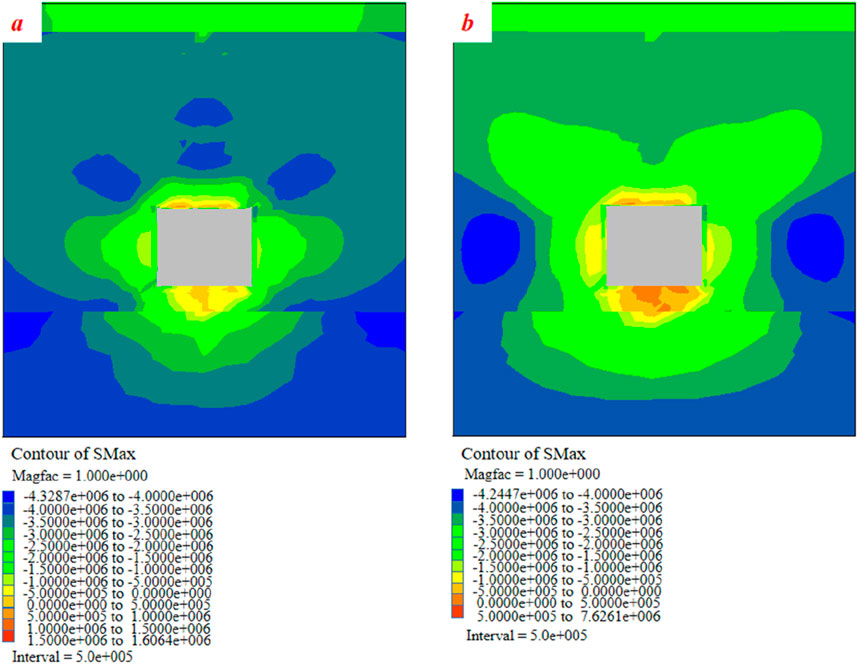
Figure 20. Cloud map of principal stress distribution. (a) Original support, (b) Optimized support.
7 Field monitoring and result analysis
7.1 Laboratory testing of monitoring systems
7.1.1 Monitoring system components
To enhance applicability in the field, five devices were connected to the laboratory system using long-distance fibre optic cables to test the strength of the reflected signals from each device.
7.1.1.1 Components of the monitoring system
The monitoring system mainly consists of a fibre grating anchor force measurement device, sensing fibre, fiber grating network demodulator and data acquisition computer.
Fibre gratings are characteristics such as temperature sensitivity, stress sensitivity, wavelength division multiplexing and more. By connecting gratings with different center wavelengths in series on a single optical fibre, stress, temperature, and other parameters can be simultaneously measured. The principle of fibre Bragg grating distribution measurement is illustrated in Figure 21.
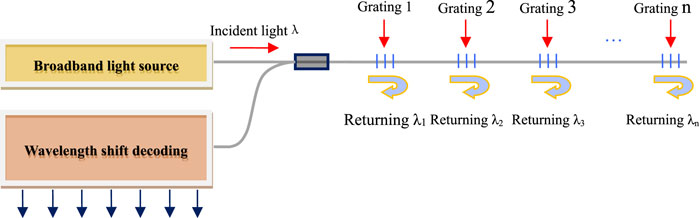
Figure 21. Principle of fibre Bragg grating distribution measurement.
Different reflected light wavelengths from FBGs (λ1, λ2, λ3, λn), correspond to different measurement points, enabling synchronous measurement and achieving the distribution of these points.
7.1.1.2 Monitoring system connection and signal testing
The total length of fibre used for the test was 4 km. Each force measuring device is connected in series within a 4 km optical fibre, which is then connected to a fibre grating network demodulator, connecting flanges are used between the optical fibres, and the demodulator is connected to a computer, forming a monitoring system. By demodulating the reflected light signal of each device through the demodulator, any device with no signal was cleaned and reconnected, resulting in normal reflection of the light signal for each device.
7.2 Monitoring system installation
Through physical similarity simulations and numerical simulations, the support scheme and supporting parameters of a porous rock roadway are determined with reasonable accuracy. Subsequently, an optical fiber sensing system is utilized to monitor the field ore pressure, enabling precise determination of the force acting on the anchor of the working face roadway.
The force measuring device is installed in the return airway of the working face, which has a rectangular section with a net width of 5 m and a net height of 3 m. The support method involves anchor (cable) rod + steel belt, and the net section measures 15 m2. The bolt row spacing is 800 mm × 800 mm, with a top bolt length of 2,500 mm and a side bolt length of 2000 mm. The anchoring force should be at least 50 kN. Additionally, the roof is equipped with two rows of anchor cables, each with a length of 6,000 mm and an inter-row spacing of 2,400 mm × 2,400 mm. The maximum anchoring force for each cable is 260 kN. The monitoring site is located 165.2 m from the cutting opening and 1,308.4 m from the entrance of the transport roadway. The ascending order of the numbered positions from the cutting opening is 1#, 2#, 5#, 3#, and 4#, with distances from the cutting opening of 165.2 m, 166.8 m, 168.4 m, 170 m, and 171.6 m, respectively. The total length of the line is 2,368 m. The installation of the device is depicted in Figure 22.
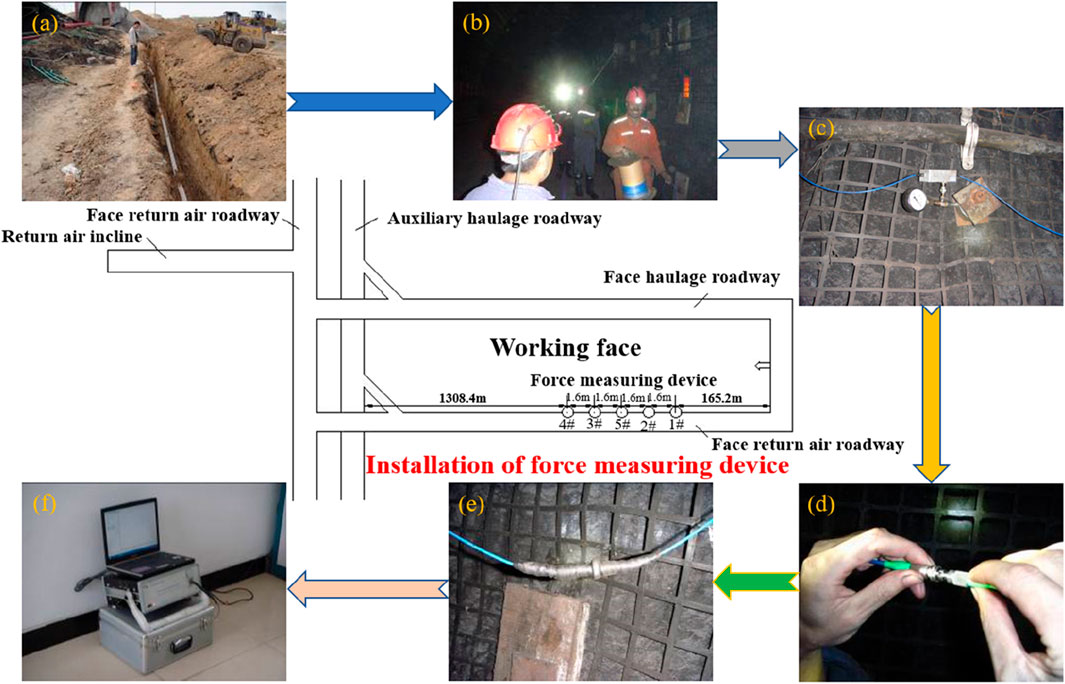
Figure 22. Design for optical fiber monitoring. (a) Optical fiber layout, (b) Roadway optical fiber installation, (c) Optical fiber installation, (d) Fiber optic connector connection, (e) Connector package, (f) Demodulator, computer.
7.3 Monitoring data processing and result analysis
7.3.1 Monitoring data processing
The fiber grating anchor (cable) monitoring system enables real-time monitoring of the anchor’s strain during mining operations. Automatic data saving is configured to occur every 30 min. The installation site maintains a relatively constant temperature, allowing us to disregard the impact of temperature on the fiber grating. It is believed that the wavelength drift is solely caused by changes in the axial force of the fastener. Figure 23 illustrates the advancing distance-time curve of the working face and the load-time curve of the monitoring device.
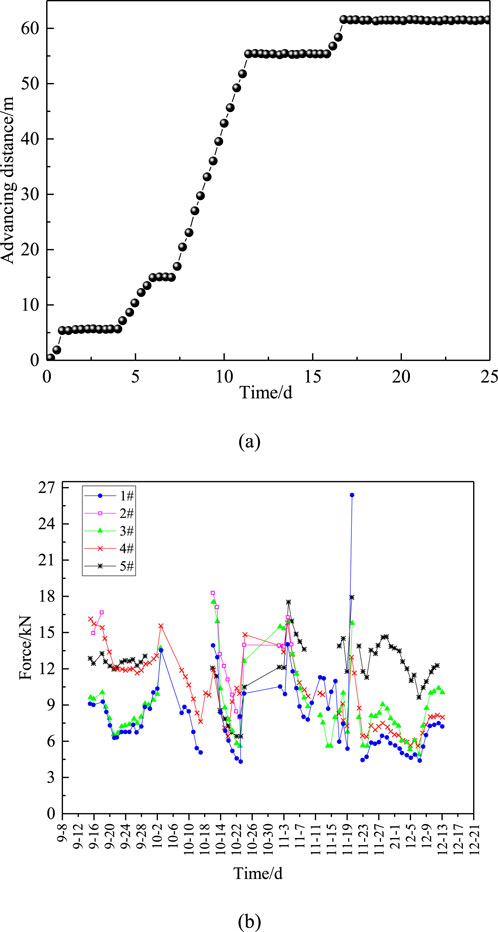
Figure 23. Monitoring data chart. (a) Working face progress, (b) Bolt load measuring device force-time curve.
7.3.2 Monitoring result analysis
Figure 23 demonstrates that when a specific preload is applied during the installation of the force measuring device, the force of the 1#, 3#, 4#, and 5# tends to decrease before the advancement of the working face. After a few days, when the total strain remains unchanged, the force of devices primarily decreases due to stress relaxation. The coal wall in contact with the pallet undergoes a partial transition from elastic to plastic strain. When the working face does not advance, the force of devices 1#, 3#, 4#, and 5# remains stable, along with the bolt’s preload. As the working face advances by 5.6 m, the devices are 159.6 m distant, the force of devices 1#, 3#, and 4# progressively increase. After 3 days, the forces of the three devices increased from 8.825 kN, 9.170 kN, and 12.583 kN–13.711 kN, 13.845 kN, and 15.470 kN, respectively, with force increments of 4.886 kN, 4.675 kN, and 2.887 kN, the force of each sensor device continuously varies as the working face advances over a greater distance. However, at an advancing distance of 61.8 m, the maximum force of each device ranges between 5.253 kN.
The analysis indicates that the sensor installation is in its initial stages, the working face has not yet advanced, and the data have not shown significant fluctuations. With each advancement of the working face by approximately 6 m, the roof undergoes a small compression range until stability is reached. However, when the working face reaches an advancement of 61.8 m, the force of the device significantly increases, and the force change of device 1# becomes abnormal, surpassing the previous peaks. The distance between the five monitoring devices and the working face ranges from 105 m to 165 m, and the maximum force change of the anchor rod is 20 kN, falling within the influence range of abutment pressure. The analysis demonstrates that the variation in anchor axial force, as monitored by the system, is a result of the activity of the strata above the working surface.
8 Discussion
Research has shown that three-dimensional physical similarity models offer significant advantages over planar models. However, achieving synchronous loading of top and side pressures in three-dimensional physical similarity models is challenging. Currently, only the top and side pressures can be loaded step by step. Based on comprehensive simulation results and on-site monitoring data, the consistency of the data has been verified, indicating the feasibility of this loading method.
The FLAC3D numerical simulation study on the original support design and the new support design scheme for the working face roadway provides insights into the deformation and stress distribution of the surrounding rock. Combining similar model experiments, numerical simulations, and comprehensive analysis of fiber optic on-site monitoring, the following new support scheme has been determined: roof mining using φ 20 mm × 3000 mm threaded steel anchor rods, while the two sides adopt 20 mm × 2000 mm threaded steel anchor rods. The spacing between anchor rods is 800 mm × 700 mm. A single row of anchor cables is arranged on the centerline of the top plate, using φ 17.8 mm steel stranded wire. The anchor cable length is 5000 mm, with a row spacing of 1400 mm. The maximum anchoring force is 260 kN, with a pre-tensioning force range of 120–230 kN.
Through indoor experiments, numerical simulations, and on-site engineering measurements, it has been discovered that the design of support schemes for soft rock roadways requires a comprehensive study of the address structure, water environment, stress distribution range of the surrounding rock, loosening zone, separation range, and physical and mechanical parameters of the rock. Regional dynamic joint support must be implemented.
9 Conclusion
Through similar material model experiment, comprehensive application of FLAC3D numerical software simulation and verification, industrial experiment conducted by fiber grating anchor monitoring system, etc., the study investigated the deformation of surrounding rock in roadway excavation, changes in stress on the coal sides and stress variations in bolt tail. Based on the findings, the study determined a reasonable support scheme and support parameters for soft rock roadways. The following conclusions were drawn.
(1) The similar material model experiments verified the propagation and distribution patterns of abutment pressure in the floor rock and indirectly established the relationship between abutment pressure and surrounding rock deformation. The optimized support situation exhibited superior support effectiveness and rationality. The optimized bolt layout parameters were found to be more reasonable, contributing to improved stability in the surrounding granite.
(2) Roadway surrounding rock primarily experienced failure shear with minor tensile forces. The plastic zone and stress distribution along the roadway axis were symmetrically distributed. Tension increased in the shallow portion of the surrounding rock, primarily concentrated at the shoulder angle, and tended to transfer to deeper areas.
(3) In-situ mine pressure monitoring enabled the initial determination of the direct roof caving step and the first pressing step of the primary roof. It was also observed that the working face did not undergo normal mining, making it difficult to comprehend the roof’s activity law. Accurate judgment of the primary roof’s pressing step requires long-term monitoring.
Data availability statement
The original contributions presented in the study are included in the article/supplementary material, further inquiries can be directed to the corresponding authors.
Ethics statement
Written informed consent was obtained from the individual(s) for the publication of any identifiable images or data included in this article.
Author contributions
LZ: Investigation, Writing – original draft. FM: Conceptualization, Supervision, Writing – original draft. QY: Conceptualization, Resources, Writing – review and editing. PW: Conceptualization, Supervision, Writing – original draft. FZ: Writing – original draft, Data curation, Visualization. GS: Formal Analysis, Software, Writing – original draft. MZ: Investigation, Software, Writing – review and editing.
Funding
The author(s) declare that financial support was received for the research and/or publication of this article. This work was funded by the Key Science and Technology Project of the China National Coal Group Corporation, grant number 20221CY001, and was funded in part by the National Natural Science Foundation of China, grant number 51804052; the Key Projects for Innovation and Application Development of Chongqing, grant number CSTB2022TIAD-KPX0105, CSTB2024NSCQ-MSX0173; the Open Science Foundation Project Funded by State Key Laboratory of Coal Mine Disaster Dynamics and Control, grant number 2011DA105287-MS202210 and the Scientific Research Fund Project of Chongqing Education Commission, grant number KJZD-K202303406.
Conflict of interest
Authors LZ, FM, and FZ were employed by Shanghai Datun Energy Resources Co., Ltd. Authors LZ, FM, and FZ were employed by China National Coal Group Corporation.
The remaining authors declare that the research was conducted in the absence of any commercial or financial relationships that could be construed as a potential conflict of interest.
Generative AI statement
The author(s) declare that no Generative AI was used in the creation of this manuscript.
Publisher’s note
All claims expressed in this article are solely those of the authors and do not necessarily represent those of their affiliated organizations, or those of the publisher, the editors and the reviewers. Any product that may be evaluated in this article, or claim that may be made by its manufacturer, is not guaranteed or endorsed by the publisher.
References
Adebayo, S. T. (2022). Trade-off between environmental sustainability and economic growth through coal consumption and natural resources exploitation in China: new policy insights from wavelet local multiple correlation. Geol. J. 58 (4), 1384–1400. doi:10.1002/gj.4664
Cai, W., Zhu, H., Liang, W., Wang, X., Su, C., and Wei, X. (2023). A post-peak dilatancy model for soft rock and its application in deep tunnel excavation. J. Rock Mech. Geotechnical Eng. 15 (3), 683–701. doi:10.1016/J.JRMGE.2022.05.014
Dong, F. (2001). The supporting theory based on broken rock zone and its application technology. Beijing: China Coal Industry Publishing House, 141.
Dong, F., Song, H., Guo, Z., Lu, S., and Liang, S. (1994). Support theory of loose zone of roadway surrounding rock. J. China Coal Soc. (01), 21–32. doi:10.13225/j.cnki.jccs.1994.01.004
He, M. (2014). Progress and challenges of soft rock engineering in depth. J. China Coal Soc. 39 (08), 1409–1417. doi:10.13225/j.cnki.jccs.2014.9044
Hou, G., Liang, J., and Li, X. (2022). Research on principles and methods of roadway support design under conventional conditions. Chin. J. Rock Mech. Eng. 41 (04), 691–711. doi:10.13722/j.cnki.jrme.2021.0250
Jia, H., Zhang, W., Liu, S., Guo, Z., Song, W., Wang, Y., et al. (2022). Failure law and classification control of extremely soft roof in mining roadway of unstable thickness coal seam. Chin. J. Rock Mech. Eng. 41 (S2), 3306–3316. doi:10.13722/j.cnki.jrme.2021.1137
Jiang, P., Kang, H., Wang, Z., Liu, Q., Yang, J., Gao, F., et al. (2020). Principle, technology and application of soft rock roadway strata control by means of “rock bolting, U-shaped yielding steel arches and back filling” in synergy in 1,000 m deep coal mines. J. China Coal Soc. 45 (03), 1020–1035. doi:10.13225/j.cnki.jccs.SJ20.0236
Kang, H., Lin, J., and Fan, M. (2015). Investigation on support pattern of a coal mine roadway within soft rocks-a case study. Int. J. Coal Geol. 140, 31–40. doi:10.1016/j.coal.2015.01.003
Kang, H., and Yi, K. (2023). Simulation study on dilatant and rheologic properties of soft rocks surrounding deep roadway and its application. J. China Coal Soc. 48 (01), 15–33. doi:10.13225/j.cnki.jccs.2022.1688
Li, G., Hu, Y., Tian, S., Ma, W., and Huang, H. (2021). Analysis of deformation control mechanism of prestressed anchor on jointed soft rock in large cross-section tunnel. Bull. Eng. Geol. Environ. 80 (12), 9089–9103. doi:10.1007/S10064-021-02470-5
Li, G., Ma, F., Guo, J., Zhao, H., and Liu, G. (2020). Study on deformation failure mechanism and support technology of deep soft rock roadway. Eng. Geol. 264 (C), 105262. doi:10.1016/j.enggeo.2019.105262
Li, Q., Shi, W., and Yang, R. (2016). Deformation mechanisms in a coal mine roadway in extremely swelling soft rock. SpringerPlus 5 (1), 1310. doi:10.1186/s40064-016-2942-6
Li, S., Qin, Y., Tang, D., Shen, J., Wang, J., and Chen, S. (2023). A comprehensive review of deep coalbed methane and recent developments in China. Int. J. Coal Geol. 279, 104369. doi:10.1016/j.coal.2023.104369
Liu, J., Mei, Y., Li, W., Guan, Q., Yan, J., Meng, Q., et al. (2022a). Numerical simulation study of the contact relationship between the external supporting arch and the surrounding rock in a soft rock roadway. Structures 45, 2080–2090. doi:10.1016/J.ISTRUC.2022.10.028
Liu, X., Liu, Q., Wang, Z., Liu, B., Kang, Y., and Wang, C. (2022b). Step by step and combined supporting technique with steel grid frame for soft and fractured rock roadway. Rock Soil Mech. 43 (S1), 469–478+489. doi:10.16285/j.rsm.2020.1951
Ma, M., Guo, Q., Pan, J., Ma, C., and Cai, M. (2021). Optimal support solution for a soft rock roadway based on the Drucker-Prager yield criteria. Minerals 12 (1), 1. doi:10.3390/MIN12010001
Ma, X., Zhai, Z., Xiang, J., Wei, M., Tian, Z., and Chen, L. (2024). Research on deformation and failure mechanism of surrounding rock in inclined strata with soft–hard interbedded roadways. Rock Mech. Rock Eng. 57, 11319–11332. doi:10.1007/s00603-024-04128-6
Meng, Q., Han, L., Zhang, J., Wen, S., Zhang, K., and Li, H. (2016). Research and application of supporting technology in deep high stress fractured soft-rock roadway. J. Central South Univ. Sci. Technol. 47 (11), 3861–3872. doi:10.11817/j.issn.1672-7207.2016.11.033
Pu, H. (2002). Industrialization of clean coal technology and optimization of China energy structure. J. China Coal Soc. (01), 1–5. doi:10.13225/j.cnki.jccs.2002.01.001
Qian, M. (2010). On sustainable coal mining in China. J. China Coal Soc. 35 (04), 529–534. doi:10.13225/j.cnki.jccs.2010.04.007
Rong, T., Zhou, H., Wang, L., Ren, W., and Guo, Y. (2018). A damage-based permeability models of deep coal under mining disturbance. Rock Soil Mech. 39 (11), 3983–3992. doi:10.16285/j.rsm.2018.0787
Sun, X., Zhao, W., Shen, F., Zhang, Y., and Jiang, M. (2023). Study on failure mechanism of deep soft rock roadway and high prestress compensation support countermeasure. Eng. Fail. Anal. 143 (PA), 106857. doi:10.1016/J.ENGFAILANAL.2022.106857
Wang, F., Chen, S., Gao, P., Guo, Z., and Tao, Z. (2021). Research on deformation mechanisms of a high geostress soft rock roadway and double-shell grouting technology. Geofluids 2021. doi:10.1155/2021/6215959
Wang, Q., Pan, R., Jiang, B., Li, S., He, M., Sun, H., et al. (2017). Study on failure mechanism of roadway with soft rock in deep coal mine and confined concrete support system. Eng. Fail. Anal. 81, 155–177. doi:10.1016/j.engfailanal.2017.08.003
Wang, T., Yan, C., Wang, G., Zheng, Y., Ke, W., and Jiao, Y. Y. (2022). Numerical study on the deformation and failure of soft rock roadway induced by humidity diffusion. Tunn. Undergr. Space Technol. incorporating Trenchless Technol. Res. 126, 104565. doi:10.1016/J.TUST.2022.104565
Wang, X., Zhang, C., Yuan, J., Sui, X., Di, S., and Wang, H. (2025a). Life cycle assessment of mine water resource utilization in China: a case study of xiegou coal mine in shanxi province. Sustainability 17, 229. doi:10.3390/su17010229
Wang, Z., Cao, H., Wang, S., Zhao, M., and Song, W. (2025b). Experimental study on slope consolidation sand tanks based on the artificial ground freezing method. Front. Built Environ. 10, 101508064–1508064. doi:10.3389/fbuil.2024.1508064
Wen, Z., Lu, J., Xiao, Q., Chen, G., Yang, T., Jiang, Y., et al. (2019). Failure mechanism of floor heave and supporting technology of soft rock roadway. J. China Coal Soc. 44 (07), 1991–1999. doi:10.13225/j.cnki.jccs.2019.0212
Wu, J., Jiao, J., and Zhou, S. (2024). Controlling large deformations in soft rock roadways with integrated anchor shotcrete and grouting techniques. Sci. Rep. 14 (1), 28339. doi:10.1038/S41598-024-80114-W
Xi, P., Zhu, D., Huo, Y., Xing, C., and Wang, Z. (2022). Numerical investigation of the failure mechanism and countermeasures of the roadway surrounding rockmass within deep soft rock. Int. J. Multi-scale Comput. Eng. 20 (4), 17–41. doi:10.1615/INTJMULTCOMPENG.2022041399
Xie, H., Ju, Y., Gao, M., Gao, F., Liu, J., Ren, H., et al. (2018). Theories and technologies for in-situ fluidized mining of deep underground coal resources. J. China Coal Soc. 43 (05), 1210–1219. doi:10.13225/j.cnki.jccs.2018.0519
Xie, H., Zhou, H., Xue, D., Wang, H., Zhang, R., and Gao, F. (2012). Research and consideration on deep coal mining and critical mining depth. J. China Coal Soc. 37 (04), 535–542. doi:10.13225/j.cnki.jccs.2012.04.011
Yang, J., Zhou, K., Cheng, Y., Gao, Y., Wei, Q., and Hu, Y. (2019). Mechanism and control of roadway floor heave in the paleogene soft rock surroundings. geotechnical Geol. Eng. 37 (6), 5167–5185. doi:10.1007/s10706-019-00970-6
Yang, S., Chen, M., Jing, H., Chen, K., and Meng, B. (2017). A case study on large deformation failure mechanism of deep soft rock roadway in Xin’An coal mine, China. Eng. Geol. 217, 89–101. doi:10.1016/j.enggeo.2016.12.012
Yang, S., Guo, Y., Liu, Q., Guo, R., and Xu, Y. (2025). Minimizing the damage of underground coal mining to a village through integrating room-and-pillar method with backfilling: a case study in weibei coalfield, China. Sustainability 17, 602. doi:10.3390/su17020602
Yang, X., Wang, E., Wang, Y., Gao, Y., and Wang, P. (2018). A study of the large deformation mechanism and control techniques for deep soft rock roadways. Sustainability 10 (4), 1100. doi:10.3390/su10041100
Yang, X., and Xu, Y. (2024). Pressure relief for drilling (trenching) and support technology in deep soft rock tunnels. Front. Earth Sci. 12, 121501420–1501420. doi:10.3389/feart.2024.1501420
Yu, W., Li, K., Zhang, J., Han, S., Liao, Z., and Zhang, Z. (2020). Deformation characteristics and control factors of the surrounding rock in the deep buried soft rock roadway under the influence of mining. Coal Sci. Technol. 48 (01), 125–135. doi:10.13199/j.cnki.cst.2020.01.016
Yu, X., and Qiao, D. (1981). Three laws of axial variation theory and stability axial ratio of surrounding rock. Nonferrous Met. Eng. 1981 (03), 8–15.
Yuan, L. (2016). Strategic thinking of simultaneous exploitation of coal and gas in deep mining. J. China Coal Soc. 41 (01), 1–6. doi:10.13225/j.cnki.jccs.2015.9027
Yuan, L. (2021). Research progress of mining response and disaster prevention and control in deep coal mines. J. China Coal Soc. 46 (03), 716–725. doi:10.13225/j.cnki.jccs.YT21.0158
Yuan, W., Hong, K., Liu, R., Ji, L., and Meng, L. (2022). Numerical simulation of coupling support for high-stress fractured soft rock roadway in deep mine. Adv. Civ. Eng. doi:10.1155/2022/7221168
Zeng, C., Zhou, Y., Xiao, Y., Zhou, X., Zhu, C., and Xu, Y. (2022). Research on soft rock damage softening model and roadway deformation and failure characteristics. Materials 15 (17), 5886. doi:10.3390/MA15175886
Zhai, W., He, F., Xu, X., Lv, K., Li, L., and Song, J. (2022). Floor heave mechanism in water-rich soft rock roadways and a DS-IBA control approach. Geomatics, Nat. Hazards Risk 13 (1), 2107–2123. doi:10.1080/19475705.2022.2107439
Zhan, Q., Muhammad, S., Zheng, X., Xue, Z., and He, Y. (2022). Instability mechanism and coupling support technology of full section strong convergence roadway with a depth of 1350 m. Eng. Fail. Anal. 139, 106374. doi:10.1016/J.ENGFAILANAL.2022.106374
Zhan, Q., Zheng, X., Du, J., and Tan, X. (2019). Coupling instability mechanism and joint control technology of soft-rock roadway with a buried depth of 1336 m. Rock Mech. Rock Eng. 53, 2233–2248. doi:10.1007/s00603-019-02027-9
Zhang, H., Li, Y., Wang, X., Yu, S., and Wang, Y. (2023). Study on stability control mechanism of deep soft rock roadway and active support technology of bolt-grouting flexible bolt. Minerals 13 (3), 409. doi:10.3390/MIN13030409
Zhang, M., Fan, J., Du, J., Jiang, D., Chen, J., Yuan, Q., et al. (2024). Experimental study on effects of load damage precursor information and response characteristic of gas-containing coal for mining safety based on acoustic emission. Process Saf. Environ. Prot. 184, 993–1010. doi:10.1016/j.psep.2024.01.057
Zhang, S., and Yin, S. (2022). Analytical approach based on full-space synergy technology to optimization support design of deep mining roadway. Minerals 12 (6), 746. doi:10.3390/MIN12060746
Zhao, C., Li, Y., Liu, G., and Huang, S. (2022b). Study on surrounding rock support technology of deep soft rock roadway. Coal Sci. Technol. 50 (04), 76–84. doi:10.13199/j.cnki.cst.2019-1024
Zhao, C., Li, Y., Liu, G., and Meng, X. (2020). Mechanism analysis and control technology of surrounding rock failure in deep soft rock roadway. Eng. Fail. Anal. 115, 104611. doi:10.1016/j.engfailanal.2020.104611
Zhao, X., Zeng, N., Deng, L., Zhu, Q., Zhao, Y., and Yang, S. (2022a). Optimization drift support design based on engineering geological and geotechnical analysis in deep hard-rock mine: a case study. Appl. Sci. 12 (20), 10224. doi:10.3390/APP122010224
Zhu, Q., Li, T., Du, Y., Zhang, H., Ran, J., Li, W., et al. (2022a). Failure and stability analysis of deep soft rock roadways based on true triaxial geomechanical model tests. Eng. Fail. Anal. 137, 106255. doi:10.1016/j.engfailanal.2022.106255
Zhu, Q., Li, T., Ran, J., Du, Y., Zhang, H., and Jiang, H. (2022b). Model test on creep deformation and failure characteristics of soft rock roadways. Eng. Fail. Anal. 141, 106670. doi:10.1016/J.ENGFAILANAL.2022.106670
Keywords: high horizontal stress, soft rock roadway, failure mechanism, similarity model, roadway support, anchor bolt
Citation: Zhu L, Ma F, Yuan Q, Wang P, Zhang F, Su G and Zhang M (2025) Experimental study on the failure mechanism and support optimization of deep soft rock roadway structures for coal mine safety. Front. Built Environ. 11:1577371. doi: 10.3389/fbuil.2025.1577371
Received: 15 February 2025; Accepted: 11 April 2025;
Published: 17 July 2025.
Edited by:
Zhen Zhang, Tongji University, ChinaReviewed by:
Pengfei Shan, Xi’an University of Science and Technology, ChinaNaveen B. P., National Institute of Technical Teachers’ Training & Research (NITTTR), India
Copyright © 2025 Zhu, Ma, Yuan, Wang, Zhang, Su and Zhang. This is an open-access article distributed under the terms of the Creative Commons Attribution License (CC BY). The use, distribution or reproduction in other forums is permitted, provided the original author(s) and the copyright owner(s) are credited and that the original publication in this journal is cited, in accordance with accepted academic practice. No use, distribution or reproduction is permitted which does not comply with these terms.
*Correspondence: Qiang Yuan, cWlhbmd5dWFuQGNxdS5lZHUuY24=; Mingtian Zhang, Y29rZXhpYW90aWFuQDEyNi5jb20=