 Xiao Guo1
 Jinfeng Zhang
- 1China Railway Engineering Design and Consulting Group Co., Ltd., Beijing, China
- 2School of Civil Engineering and Architecture, Linyi University, Linyi, China
- 3National Engineering Research Center of High-speed Railway Construction Technology, Changsha, China
Over the past 2 decades, China has witnessed remarkable advancements in rail transportation systems, encompassing municipal railways, intercity networks, and high-speed rail infrastructure. Nevertheless, the environmental implications of train-induced vibrations have emerged as a critical concern among engineers and scholars. This paper carries out a study on the prediction and evaluation of environmental vibration medium-to-high speed railways (120–250 km/h operation), utilizing a validated finite element model calibrated with field measurements. The critical distances to railway line were determined, at which the train-induced noise is reduced to acceptable levels in sound-sensitive areas, such as residential zones. This study specifically conducted an assessment of the vibrations experienced by various railway structures (subgrade, viaduct, and tunnel) at varying train speeds. The findings indicate that the traditional empirical formula cannot accurately predict the critical distance. Moreover, approximately 1,000 working conditions were calculated and a massive data analysis database was then established, which provides guidance for the railway location design, the avoidance of sound-sensitive locations, and the mitigation of track vibration and noise.
1 Introduction
In the planning and construction of railway lines, special attention must be given to analyzing train-induced noise, particularly in densely populated, sound-sensitive urban areas (Zhu et al., 2017; Ma et al., 2020; Li et al., 2021). The railways encompass a range of train speeds from 80 km/h to 250 km/h, involving urban rail transit (with operating speeds of approximately 100 km/h), suburban rail transit (speeds between 100–160 km/h), intercity rail transit (at 200 km/h), and high-speed rail (exceeding 250 km/h) (Yang et al., 2019; Ma et al., 2016; Chen et al., 2021). As train speeds vary, so do the levels of vibration and noise, necessitating further studies on estimating the critical distance (Qu et al., 2021). To characterize the train-induced vibration, many researchers have conducted relevant studies based on analytical/semi-analytical methods, numerical simulations and field measurements.
Analytical or semi-analytical analysis typically offers theoretical solutions describing the train-induced vibration. For instance, in (Metrikine and Vrouwenvelder, 2000), the ground vibration induced by underground metro trains was estimated through a 2D analytic model, where the tunnel is modelled as an infinitely long Euler-Bernoulli beam embedded in viscos-elastic soil layers. An further improvement on the embedded Euler-Bernoulli beam model was performed in (Koziol et al., 2008), where a half-space ground beneath the Euler-Bernoulli beam was added, and wavenumber-domain vibrations were transferred into spatial-domain vibrations via inverse Fourier wavelet transform. In another study by (He et al., 2018), a moving point load on the beam was applied to calculate the vibration response, while the beam was placed in a two-dimensional elastic layer with porosity. In these studies the 2D analytical embedded Euler-Bernoulli beam model predominantly utilized to examine tunnel vibrations. To take into account the model’s spatial properties, the analytical research has been advanced from a 2D to a 3D model. For example, a semi-analytical 3D model was built in (Forrest and Hunt, 2006) to investigate the dynamic responses of underground railway tunnels, where the circular tunnel is idealized as a pipe (tunnel) in another pipe (surrounding soil). Another improvement for this model was performed in (Di et al., 2016), by considering the soil as porous and elastic medium using the Biot’s saturated porous medium. Notably, the analytical or semi-analytical approaches typically have limitations, such as difficulties in accounting for the free ground surface boundary and the layer-wise soil strata, and therefore are not well-suited for modeling complex systems.
To enhance the precision of vibration analysis, numerous studies have employed numerical simulations utilizing both the finite element method (FEM) and the boundary element method (BEM). Advanced numerical models, such as the coupled FEM and BEM, as well as the 2.5D FEM-BEM, have been frequently adopted in the train-induced vibration studies. This indicates that numerical simulations have evolved into an effective tool for quantifying train-induced vibrations and noises in complex structures (e.g., tunnel, bridge), although it requires a stronger computation resource. In (Balendra et al., 1989; Vogiatzis and Kouroussis, 2015), a 2D FEM model was employed to analyze track-tunnel-ground vibrations, accommodating diverse geometries and material properties like soil and concrete. While this model is computationally efficient for parametric studies, it fails to capture wave propagation in the train’s direction, leading to notable discrepancies between simulations and actual measurements. To address this limitation, 2.5D and full 3D FEM/BEM models were developed to achieve more realistic results, as seen in studies (Yang et al., 2019; Gardien and Stuit, 2003; Sheng et al., 2005; Sheng et al., 2006; François et al., 2010; Galvín et al., 2010; Sheng and Li, 2007; Clouteau et al., 2005; Degrande et al., 2006; Chebli et al., 2008). However, this advancement comes at the cost of increased computational expenses. Furthermore, in 2.5D or 3D numerical models, the model parameters are difficult to determine accurately, leading to significant modelling errors. Recent research has explored alternative approaches to address these limitations, such as promoting the efficiency of train-track-subgrade interaction analysis without compromising accuracy (Xu et al., 2025). It is noteworthy that the prediction and assessment of train-induced vibration using deep learning methods are highly appealing (Liang et al., 2021; Liang et al., 2024).
Field measurements provide a more direct and explicit approach for evaluating train-induced vibrations compared to analytical studies or numerical simulations. For instance, in Xia et al. (2005), the train-induced vibration were studied through field measurements, where vibrations were measured at a bridge, and noises were recorded at two nearby buildings. The study revealed that ground-borne vibrations, including those on the building floors, intensify with the increase in train speed. However, these vibrations tend to diminish as the distance to the railway lines increases. In Vogiatzis et al. (2018), the noise generated at a railway tunnel construction site in Athens was measured to evaluate its impact on neighboring buildings and residents. Similarly, a study in Zou et al. (2017) documented metro train-induced vibrations at an underground transfer station in Shenzhen, China. The findings suggested that for over-track buildings, measurement locations should be positioned within 40 m on the platform to avoid excessive vertical vibrations and noise. In Jik Lee and Griffin (2013), an experimental test was conducted to examine the impact of high-speed train-induced noise on the annoyance experienced by residents. The study revealed that the primary cause of noise annoyance is not solely vibration, but rather the combination of noise and vibration.
In the field monitoring conducted by Zhai et al. (2015), vertical ground vibration acceleration was measured along Beijing-Shanghai high speed railway line, where trains travel at speeds ranging from 300 to 410 km/h. The findings indicate that these accelerations attenuates significantly at distances exceeding 50 m. Ref. Zhang et al. (2021) documents train-induced vibrations at a site where a metro line passes beneath a railway line. The results reveal that when two trains pass simultaneously, the ground acceleration ranges from 6 to 13 dB, which is higher than the levels (20–160 Hz) generated when the two trains pass independently. Similar monitoring studies are conducted by Qu et al. (2021), where vibrations were measured for a double metro line running beneath a bustling urban road in Shenzhen, China.
In summary, early analytical and numerical studies often overlooked the importance of calibrating models with field measurements, whereas pure field monitoring studies did not feedback the theoretical analysis very well. Therefore, it is essential to integrate these approaches to provide a more effective way for fast predicting vibration and noise attenuation properties in railway engineering. The concept of ‘critical distance’ refers to the distance to railway lines where vibrations and noise attenuate to acceptable levels. This parameter is crucial in determining the minimum separation between noise-sensitive areas and railway alignments during design and operation, as well as in assessing the need for additional noise-isolation measures. While previous research has predominantly focused on the general vibration characteristics of the train-track-substructure system, the topic of critical distance has received less attention. Addressing train-induced vibrations from the perspective of critical distance is highly relevant to the railway engineering community. However, this concept has been rarely explored in depth since it is usually based on parametric studies requiring extensive numerical computation work or a dense field monitoring data.
To address the research gaps, this study conducts a parametric study on the train-induced vibration, integrating field measurement data. It specifically investigates the critical distance of environmental vibration for railway operation, and three scenarios are taken into account, namely the train moving in underground tunnels, on viaducts and along ground embankments. For each scenario, the environmental vibration attenuation is calculated using a FEM model, and the influence of key model parameters is studied through parametric study. In the subsequent sections of this paper, the numerical models for the three scenarios are first built, including the vehicle-track-tunnel-soil model, the vehicle-track-viaduct model, and the vehicle-track-embankment model, in which the train speeds range from 120 to 250 km/h. The accuracy of the model is further verified through comparing the simulation results with field measurements. Secondly, an in-depth parametric study is conducted by varying the model parameters to investigate the vibration attenuation properties, and the critical distance for vibration control is analyzed. Finally, the conclusions are drawn. The findings contribute to addressing the gap in vibration and noise reduction technologies for rail transit operating at speeds of 120–250 km/h in the Guangdong-Hong Kong-Macao Greater Bay Area.
2 Methodology
2.1 Numerical model description
This paper considers several key factors: vehicle types, line conditions and civil structures corresponding to various train speeds. Two speed levels were incorporated into the numerical simulations and field measurements, namely level-1 with speed range of 120–160 km/h and level-2 of 160–250 km/h. The FEM models, comprising bridge, tunnel, soil, vehicle and track, were developed to analyze the dynamic interaction of these components and the train-induced noises.
Considering the symmetry, the vehicle-track-tunnel-soil dynamic interaction model by a train-structure dynamics theory and related software developed by Xu (2021) was constructed with a length of 120 m, a width of 70 m and a depth of 80 m, as shown in Figure 1. To simulate the tunnel and soil boundary, an infinite element boundary condition was used on the right end of the model, while a symmetric boundary was employed on the left side [more explanations in Bucinskas et al. (2021)]. The upper and bottom surface of ground soil was defined as a free and a fixed boundary, respectively. To optimize computational efficiency while maintaining accuracy, the mesh size for the tunnel structure was set at approximately 0.1 m, with soil mesh sizes ranging from 0.1 to 1 m.
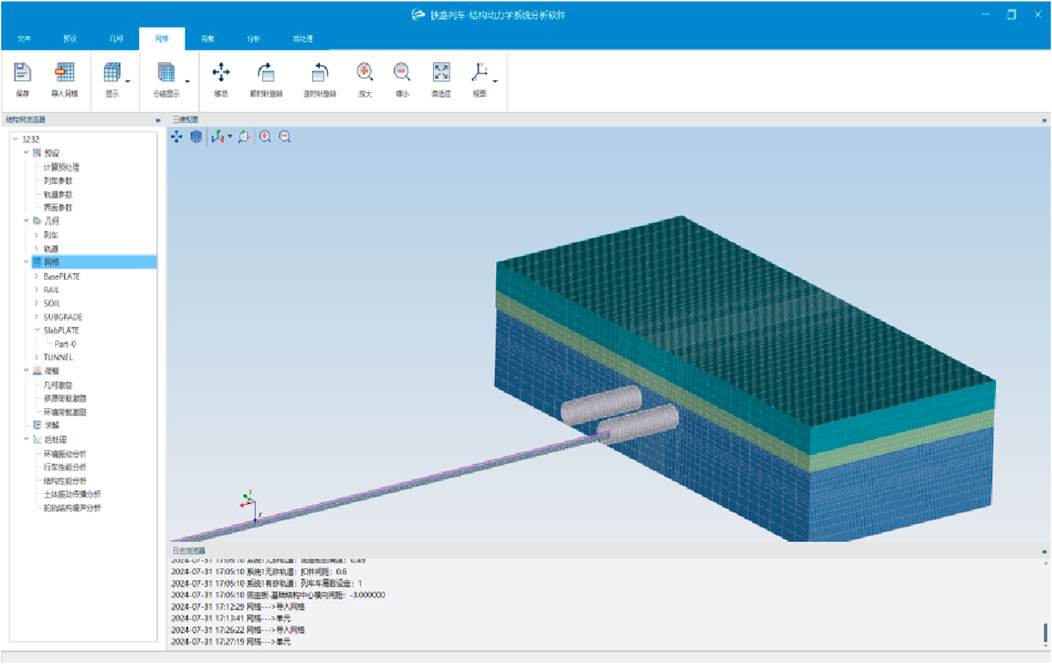
Figure 1. Vehicle-track-tunnel-soil model.
Notably, the dynamic impacts of vehicles on the tunnel are characterized by the time-history of fastener forces. The fastener forces, calculated by the vehicle-track-substructure spatial coupling model developed by Xu (2021), were utilized as inputs for the 3D tunnel-soil FEM model. The implicit dynamic integration method in the time domain was employed to solve the model. Concerning environmental vibrations, the frequency range of 1–80 or 1–200 Hz is of great interest, as it corresponds to the most significant level of disturbance (Lombaert et al., 2015). Consequently, an integration step of 0.001s was selected to ensure the solution of the vibration response up to 200 Hz.
For the train speed range of 120–160 km/h, the Metro Lines in China were used as engineering cases for parameter study. The tunnel structure was constructed with a circular cross-section, and its detailed structural information are presented in Table 1. This model comprises a 176 mm, 60 kg/m rail system with PANDROL fast clip (SFC) fasteners (static stiffness 40 kN/mm, dynamic/static stiffness ratio ≤1.4), designed for an 8-vehicle urban D-type train (17t axle load). The tunnel structure utilizes C50 concrete segments (400 mm thickness, 3850 mm inner radius), with the measurement from the rail to the ground surface ≥15 m. The viaduct structure was designed as a two-lane box girder, with the track itself mounted on a concrete base. The assembled prefabricated monolithic track slab was used, as shown in Figure 2.
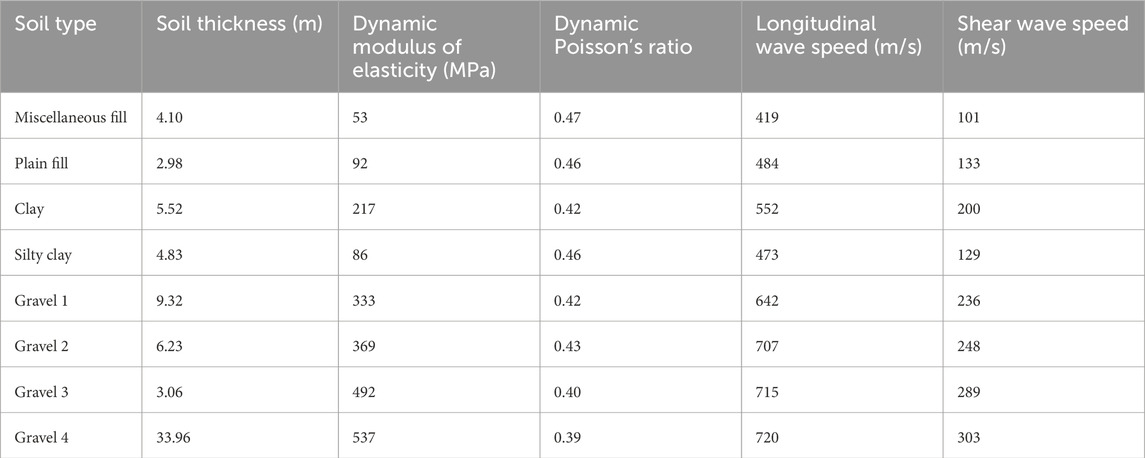
Table 1. Geological conditions of the Great Bay area.

Figure 2. Tunnel and viaduct structures of train speed at 120–160 km/h. (a) Tunnel cross section (b) Track-box girder FEM model.
For the train speed of 160–250 km/h, the new Baiguang Intercity Railway (operating at 160 km/h) and Guanghui Intercity Railway (operating at 200 km/h) in Guangdong province, China, were adopted as engineering cases for parameter study. The tunnel structure has a large cross-section with double tracks, which was constructed using the New Austrian Tunnelling Method (NATM). The FEM model for the Guanhui intercity railway features a 176 mm, 60 kg/m rail system with WJ-8B fasteners (static stiffness 30 kN/mm, dynamic/static stiffness ratio ≤1.5), tailored for an 8-segment CRH6 train as shown in Figure 3. The tunnel structure employs C50 concrete tube sheets with a thickness of 400 mm, and the measurement from the rail to the ground surface ≥15 m. The bridge uses double line box girder, while the roadbed section is set up with concrete base. Furthermore, the roadbed uses the assembled prefabricated track plate integral roadbed developed by the research team.
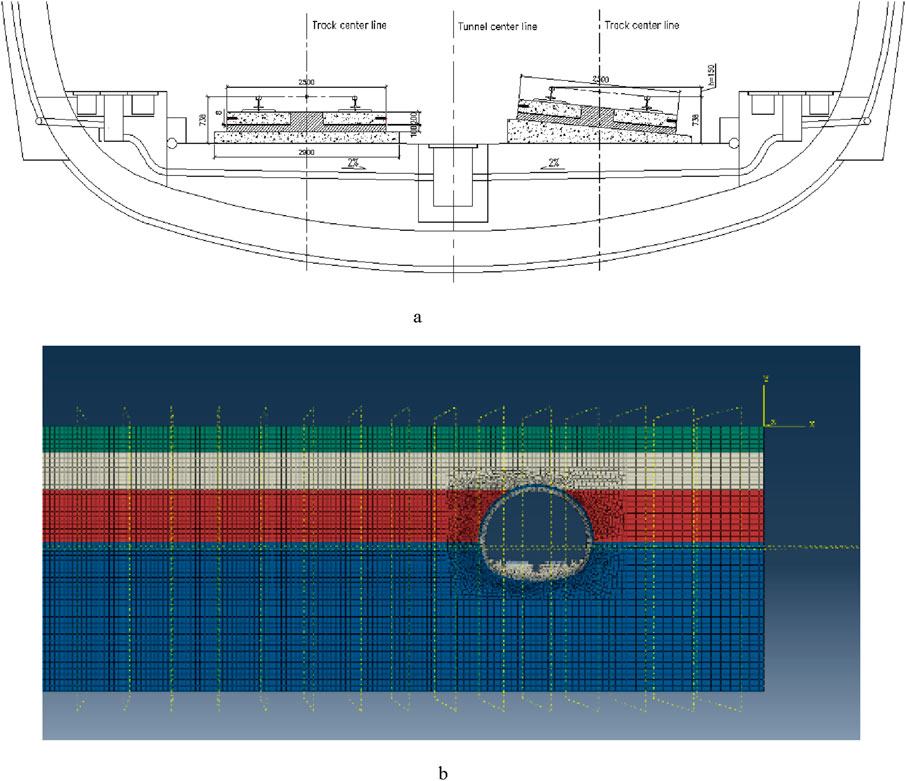
Figure 3. Tunnel and viaduct structures of train speed at 160–250 km/h. (a) Tunnel cross section (b) Tunnel model.
The assembled prefabricated monolithic track slab model includes a 200 mm-thick upper layer of C50 concrete, an 8 mm under-rail pad layer with a stiffness of 0.09 N/mm3, and self-compacting concrete (C40) with varying thicknesses: 300 mm for tunnel sections and 95 mm for viaduct/subgrade sections. Note that the same track slab parameters were employed for all the track parts in each model, i.e. tunnel, viaduct and subgrade, under the two train speed ranges of 120–160 km/h and 160–250 km/h.
The soil parameters were determined according to the typical geological conditions in the Great Bay area, as shown in Table 1, and each calculation condition was used as the base condition and adjusted according to the typical line alignment.
2.2 Field measurement
2.2.1 Summary
(1) Three railway lines were tested, including Guangqing intercity railway line, New Baiguang intercity railway line and Beijing Daxing New Airport Line. (2) The trackside noise and noise levels from open-air railway line sections were measured. (3) Three indicators, i.e., vibration, displacement and noise, were used to quantify the vibration and noise. (4) The testing instruments include vibration measurement instruments and noise measurement instruments the related parameters are shown in the Appendix. (5) Location of measurement points were selected according to the needs of the three indicators.
2.2.2 Railway line details
2.2.2.1 Guangqing intercity railway line
The Guangqing Intercity connects Huadu District of Guangzhou City with Qingyuan City, spanning a total length of 38.17 km. Designed for a train speed of 200 km/h, it utilizes 8-segment CRH6 rolling stock trains. The foundation of this railway line comprises bridges, tunnels and subgrades. The track is seamless inter-district line with CRTS double-block ballastless track.
2.2.2.2 New Baiguang intercity railway line
The New Baiguang Intercity connects Huadu District of Guangzhou City with Guangzhou Baiyun Airport, stretching over a distance of 20.13 km. Along this route, there are four stations: Huadu Station, Tiangui Road Station, Huashan Station and Airport T2 Station. Designed for a train speed of 160 km/h, it employs 8-segment CRH6 rolling stock trains and runs entirely through a tunnel section. The track is a seamless inter-district line with CRTS double-block ballastless track throughout the line. Additionally, CRTS double-block vibration-damping track was applied in some sections with vibration-damping requirements.
2.2.2.3 Beijing daxing new airport line
The first phase of this line is 41.36 km long, with a design speed of 160 km/h. The line includes Caoqiao Station, Daxing New Town Station and Daxing International Airport Station, and uses 8-segment trains with an axle weight of 17 t. As a seamless inter-district line, it incorporates a double block type monolithic bed for general sections, and a prefabricated slab type monolithic bed for areas prone to settlement. For sections that necessitate vibration damping, an isolated vibration damping pad floating plate track is implemented.
For the New Baiguang Intercity Railway Line, the intensity of vibration sources in intercity railway tunnels was measured. The vibration source intensity, as well as the acceleration and displacement of the primary track components in the tunnel (running CRH6 intercity rolling stock at a design speed of 160 km/h) were measured. For the Guangqing intercity railway line, the vibration source intensity and the acceleration and displacement of the main track components in the subgrade section at a design speed of 200 km/h were measured. Additionally, for the Beijing Daxing New Airport Line, the underground tunnel vibration induced by train was measured.
Through the installation of sensors on site, trackside noise was measured both inside the tunnel and at the metro station. For the open-air railway line section noise, the noise of CRH6 trains at high speed was measured.
2.2.3 Measurement indicators and instruments
Three key indicators are the vibration, displacement and noise. The vibration measurement include the tunnel (vertical acceleration of rails, slabs and tunnel walls) and the subgrade (vertical acceleration at specific measurement point). Displacement measurements focused on the displacement of rails and slabs. The noise is the train-induced environmental noises. The Equivalent A sound pressure level was applied (Nilsson, 2007). Tables 5 and 6 provide an overview of the instruments used for these measurements. Additionally, two examples of these instruments in use are shown in Figure 4.
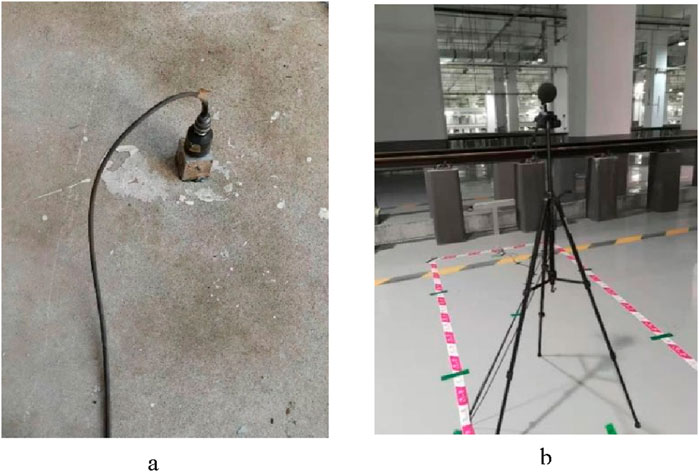
Figure 4. Examples of measurement instruments. (a) Vibration measurement instrument (b) Noise measurement instrument.
2.2.4 Location of measurement points
2.2.4.1 Acceleration measurement point arrangement
According to the standard (Environment, 2018),the measurement point for the underground line should be positioned at the tunnel wall (away from the tunnel side of another line), positioned 1.25 m ± 0.25 m above the top surface of the rail. For the placement of acceleration sensors, they should be installed at the bottom of the rail, on the outside of the ballastless track slab.
2.2.4.2 Displacement measurement points
The displacement measurement points contain the vertical deformation of both sides of the rail in relation to the track slab, the lateral deformation of the rail relative to the track slab, and the vertical deformation of the floating plates in relation to the tunnel wall.
2.2.4.3 Trackside noise testing points
The installation of the trackside noise testing instrument is depicted in Figure 5, ensuring that the sensor is located outside the track limits.
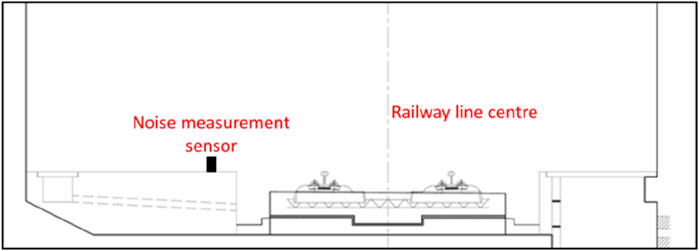
Figure 5. Trackside noise testing point.
2.3 Model precision validation
In order to ensure the accuracy of the model, we performed field measurements on the Beijing Daxing New Airport Line, the new Baiguang and Guangqing intercity railway lines. The analytical models were built based on the field measurement conditions. The comparison results, presented in Table 2, reveal that calculation errors of the simulation model are all within 2%. This indicates that the models possess enough accuracy, and the model parameters can be utilized for the subsequent stage of research work.

Table 2. Comparison results of field measurements and model simulations.
One example comparing the field measurement and simulation results is presented in Figure 6. The figure clearly demonstrates a close correspondence between the accelerations obtained from field measurements and simulation results, validating the model’s accuracy and suitability for further research studies.

Figure 6. Time and frequency domain result comparison of the simulation model against measured data. (a) Time domain data validation (b) Frequency domain data validation.
2.4 Simulation conditions
The study assessed the distribution of sound-sensitive areas along the operational urban express and intercity railway lines within the Guangdong-Hong Kong-Macao Greater Bay Area, using train speeds of 120–250 km/h (10 km/h increments). Horizontal distances from tracks were 0–100 m (5 m steps) for subgrade/tunnel sections and 0–50 m (5 m steps) for viaducts. Tunnel track depths varied by speed: 10/15/25 m at 120–160 km/h and 15/25/35 m at 160–250 km/h.
Approximately 1,000 simulations were performed to establish a massive data analysis database, ensuring the accuracy in determining the critical distance. This will provide theoretical and data support for the prediction and evaluation of environmental vibration and noise of urban express lines and intercity railways, and the design of track vibration and noise reduction.
3 Critical distance results
Based on the simulation results, the critical distances were obtained to guide the application of noise reduction measures. If the buildings (identified as sound-sensitive locations) fall outside the critical distances, the adoption of track vibration and noise reduction measures is deemed unnecessary. Conversely, if these buildings are within the critical distances, vibration and noise reduction measures should be implemented according to the EIA (environmental impact assessment) requirement. Furthermore, during the planning phase of railway lines, the critical distances can serve as a guide for selecting the line’s location, aiming to avoid sound-sensitive locations and reduce environmental vibration and noise pollution for residents.
3.1 Critical distance for track on subgrade
3.1.1 Vibration attenuation analysis for train speed at 120–160 km/h
Figure 7 illustrates the propagation and attenuation of environmental vibration within the subgrade, utilizing the maximum Z vibration level values as Y-axis. More explanations about the vibration level can be found in Organisation (1997). In the figure, the day and night environmental vibration limits were marked, which is based on the Chinese standard requirement (Environment, 1989). These two limits are marked in subsequent figures as well. As the distance to the railway line center increases, the vibration level at the ground decreases due to the attenuation by the soil. However, an area of vibration amplification was observed within the range of 80–95 m.
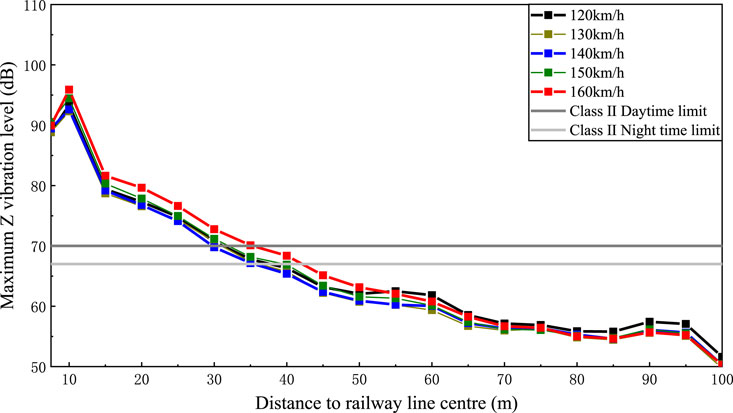
Figure 7. Maximum Z vibration level against distance to railway line centre (120–160 km/h).
The empirical formula given in Equation 1 (Environment, 2018) describes the attenuation of ambient vibration in both the subgrade and viaduct railway lines.
where, the coefficients are a = −8.6, b = −0.13, and c = 8.4 for subgrade sections, while viaduct sections use a = −3.2, b = −0.078, and c = 0. These values reflect vibration attenuation characteristics under medium soft soil conditions.
Based on the typical geological conditions in the Guangdong-Hong Kong-Macao Bay Area, the parameters in the empirical equation (Environment, 2018) were selected to depict the prediction curves (Figure 8).
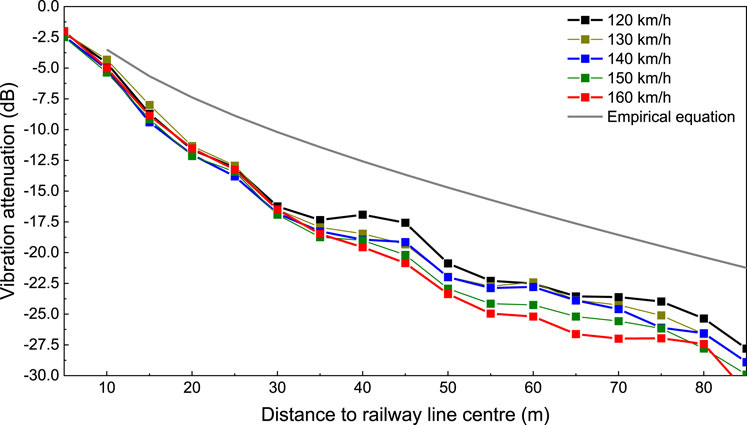
Figure 8. Vibration attenuation against distance to railway line centre (120–160 km/h).
Figure 8 shows the vibration attenuation against the distance to the railway line centre, with train speeds ranging from 120 to 160 km/h. The vibration attenuation obtained from the empirical equation was also shown in this figure for comparison. It can be found that the empirical results are generally larger than those obtained from the numerical simulation. Despite a minor decline in the vibration attenuation rate at a distance of 60–80 m from the railway line centre, the empirical results are still larger than numerical simulation results. Consequently, it is advisable to modify the empirical equations accordingly.
3.1.2 Vibration attenuation analysis for train speed at 160–250 km/h
Figure 9 presents the maximum Z vibration level in relation to distance to the railway line centre, highlighting a zone of vibration amplification between 70 and 85 m. Furthermore, Figure 10 shows the vibration attenuation against the distance to the railway line centre for train speeds ranging from 160 to 250 km/h. It is evident that the empirical results are generally larger than those obtained from the numerical simulation. This observation reinforces the necessity of refining the empirical equations.
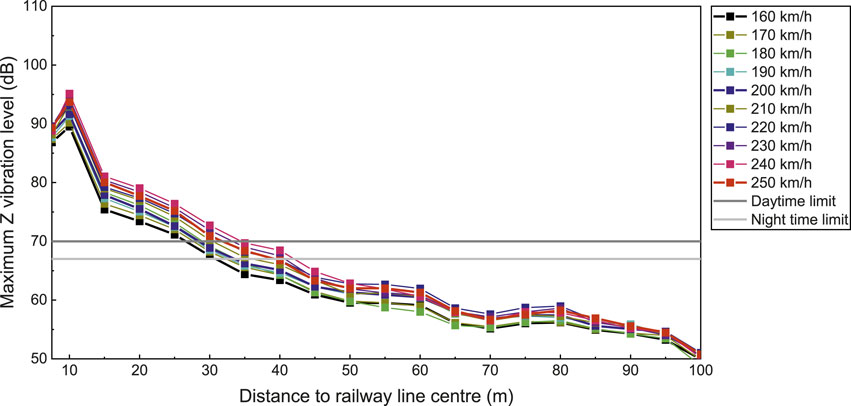
Figure 9. Maximum Z vibration level against distance to railway line centre (160–250 km/h).
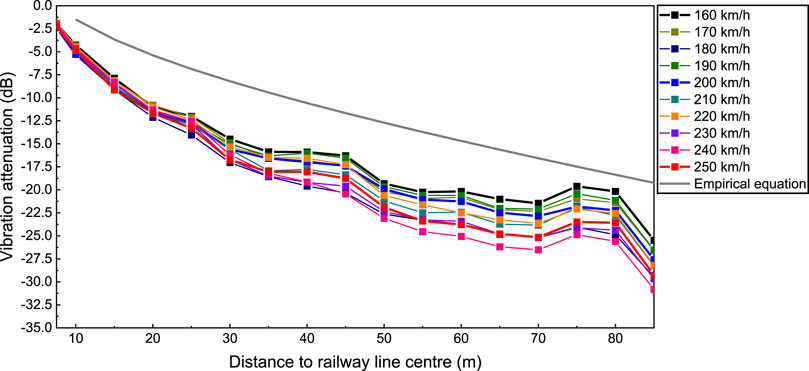
Figure 10. Vibration attenuation against distance to railway line centre (160–250 km/h).
3.1.3 Critical distance analysis
In Ref. Environment (1989), the maximum Z-vibration level limits for ambient vibration in different types of urban areas are given, as shown in Table 3.
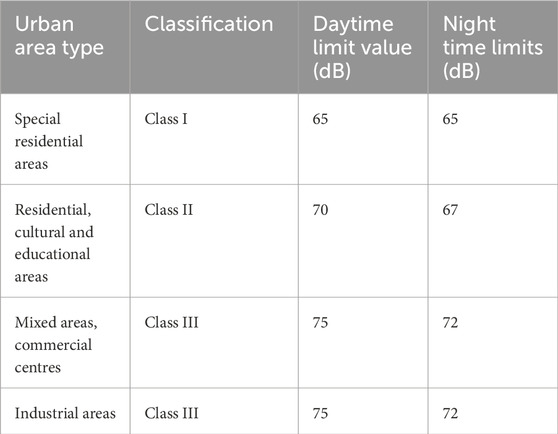
Table 3. Daytime and night-time environmental vibration limits.
Figure 11 displays the maximum Z vibration level against distance to railway line centre for train speeds of 120–160 km/h and 160–250 km/h, respectively. In addition, the vibration limits are also shown in this figure. Based on Figure 11, the critical distances of these urban areas are summarized, as shown in Table 4.
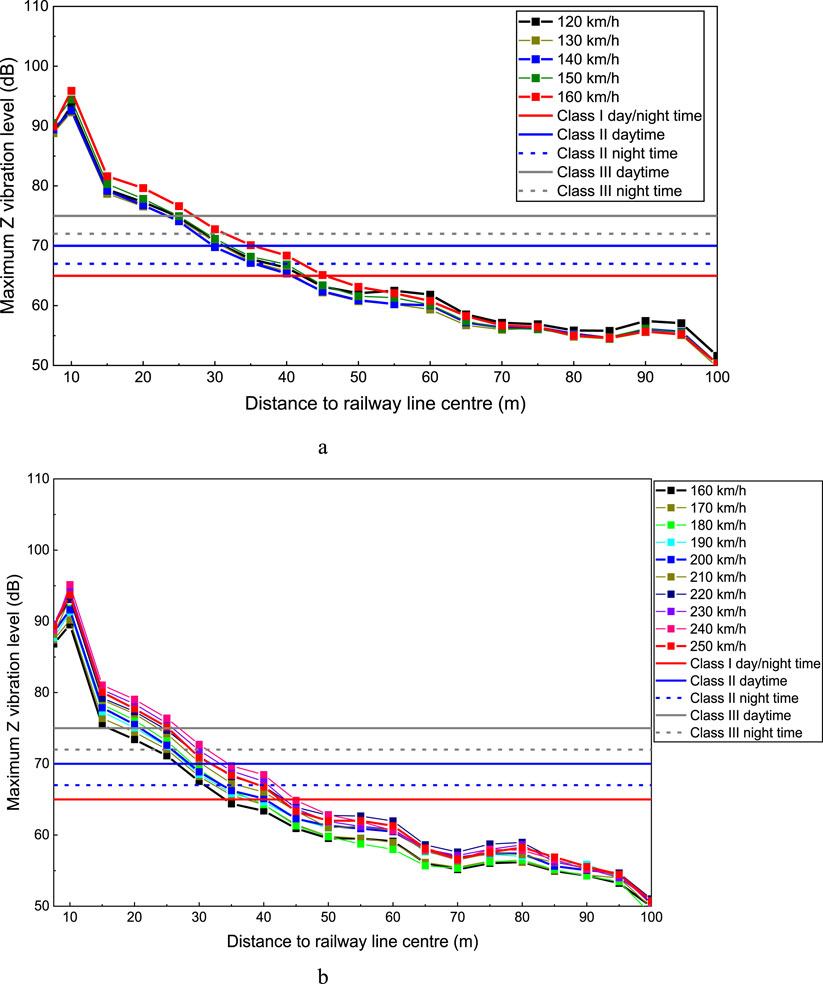
Figure 11. Maximum Z vibration level against distance to railway line centre and daytime and night-time environmental vibration limits. (a) Maximum Z vibration level against distance to railway line centre (120–160 km/h) (b) Maximum Z vibration level against distance to railway line centre (160–250 km/h).
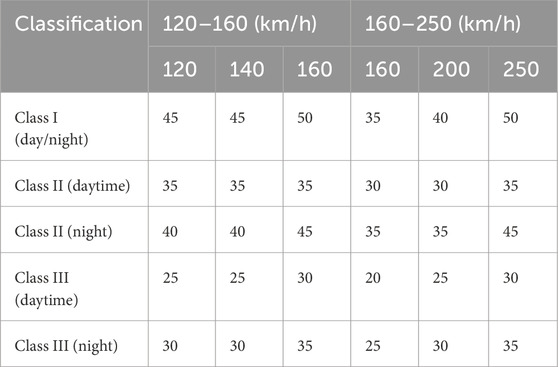
Table 4. Recommended critical distances for environmental vibration of track on subgrade (m).
3.2 Critical distance for track on viaduct
3.2.1 Vibration attenuation analysis for train speed at 120–160 km/h
Figure 12 presents the environmental vibration propagation and attenuation in the subgrade, using the maximum Z vibration level values as Y-axis. In the figure, the day and night environmental vibration limits are marked, which is based on the Chinese standard requirement (Environment, 1989). As the distance to the railway line center increases, the vibration level at the ground decreases due to attenuation by the soil. Notably, there is no obvious vibration amplification zone within the 0–50 m range.
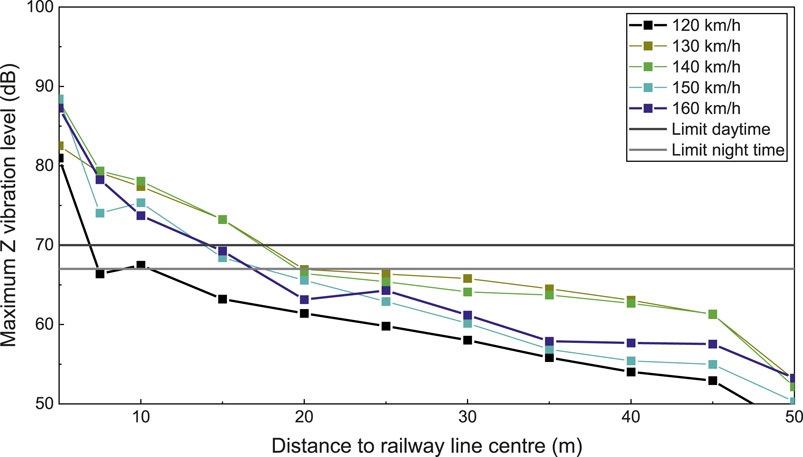
Figure 12. Maximum Z vibration level against distance to railway line centre (120–160 km/h).
Figure 13 shows the vibration attenuation against the distance to the railway line centre, with train speeds ranging from 120 to 160 km/h. The vibration attenuation obtained from the empirical equation are also shown in this figure for comparison. It can be found that within 15 m from the railway line’s centreline, the empirical attenuation results are smaller than those obtained through the numerical simulation, indicating that the empirical equation is not suitable for this proximity. Therefore, practical vibration reduction measures should be implemented within this 15 m zone. Conversely, beyond a 20 m distance from the centerline, the empirical results are larger than those from the numerical simulation, suggesting that the equation is conservative and needs modification.
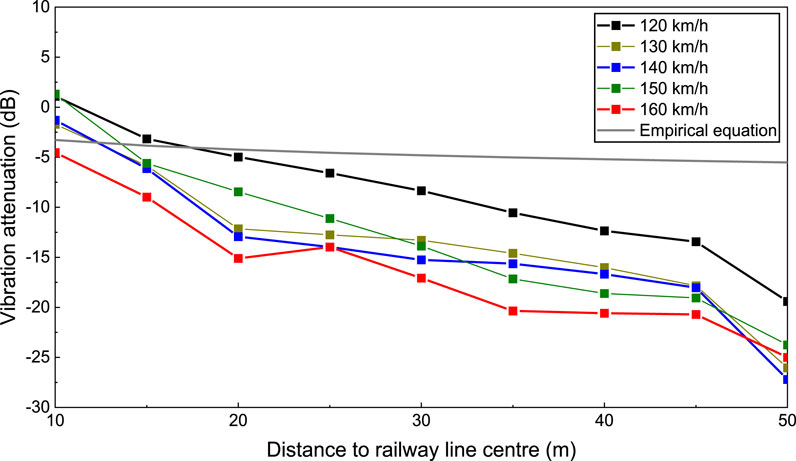
Figure 13. Vibration attenuation against distance to railway line centre (120–160 km/h).
3.2.2 Vibration attenuation analysis for train speed at 160–250 km/h
Figure 14 displays the maximum Z vibration level against distance to railway line centre, with no obvious vibration amplification areas observed. Figure 15 depicts the vibration attenuation against the distance to the railway line centre for train speeds of 160–250 km/h. It can be found that within 25 m from the railway line centre, the empirical attenuation results are smaller than those from the numerical simulation, rendering the empirical equation unsuitable for this range. Consequently, practical vibration reduction measures should be taken within 25 m from the railway line. Beyond 25 m from the railway line centre, the empirical results surpass the simulation results, indicating that the empirical equation lacks accuracy.

Figure 14. Maximum Z vibration level against distance to railway line centre (160–250 km/h).
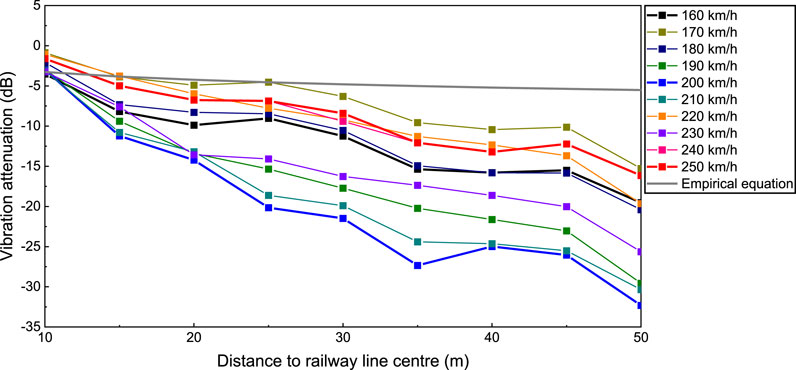
Figure 15. Vibration attenuation against distance to railway line centre (160–250 km/h).
3.2.3 Critical distance analysis
Figure 16 presents the maximum Z vibration level against distance to railway line centre for speed ranges of 120–160 km/h and 160–250 km/h, respectively. In addition, the vibration limits are also shown in this figure. Based on Figure 16, the critical distances of these urban areas are summarized, as shown in Table 5.

Figure 16. Maximum Z vibration level against distance to railway line centre and daytime and night-time environmental vibration limits. (a) Maximum Z vibration level against distance to railway line centre (120–160 km/h) (b) Maximum Z vibration level against distance to railway line centre (160–250 km/h).
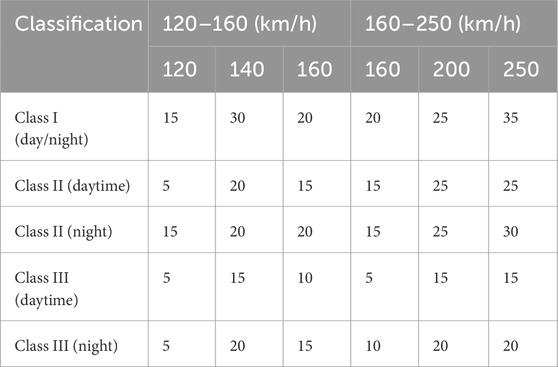
Table 5. Recommended critical distances for environmental vibration of track on viaduct (m).
3.3 Critical distance for track in tunnel
3.3.1 Vibration attenuation analysis for train speed at 120–160 km/h
The depth of the rail surface is an important factor in the vibration propagation and attenuation. This section investigates the influence of rail surface depth on these vibration characteristics. Specifically, the investigation considers rail surface depths of 10 m, 15 m, and 25 m, as illustrated in Figure 17.
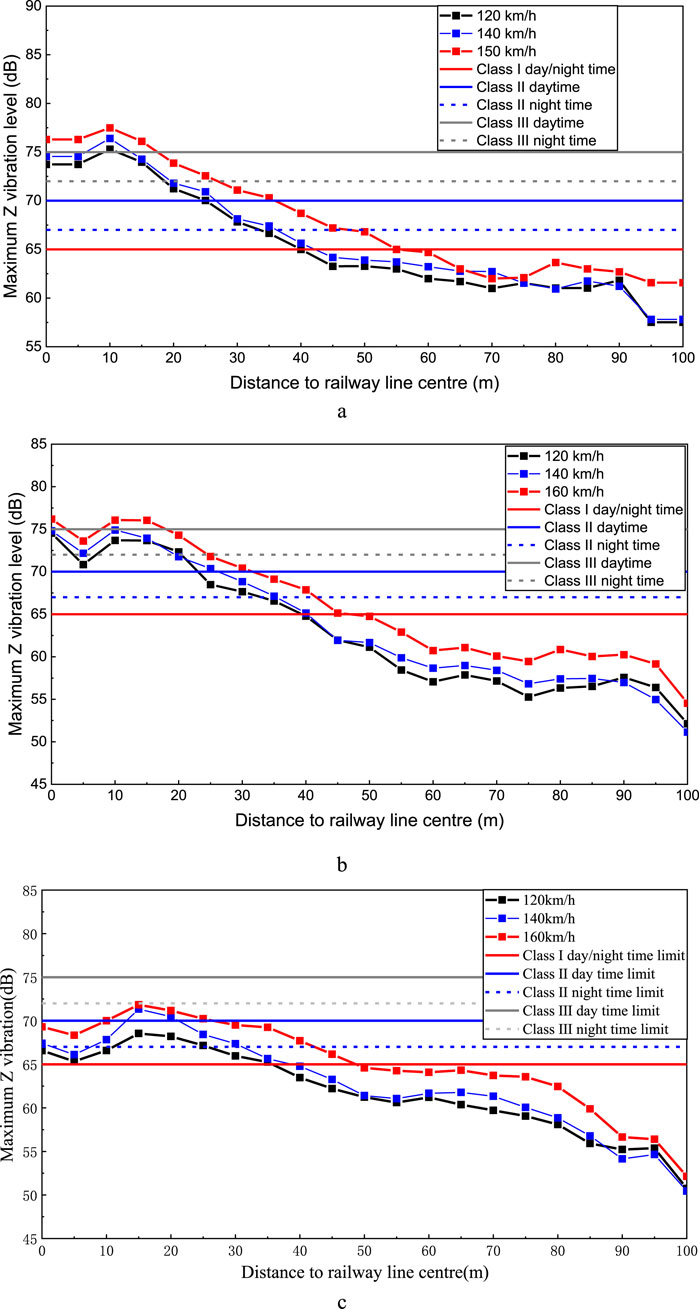
Figure 17. Maximum Z vibration level against distance to railway line centre (120–160 km/h). (a) 10 m rail surface depth (b) 15 m rail surface depth (c) 25 m rail surface depth.
As observed in Figure 17, the vibration level at ground decreases with increasing distance to the railway line centre due to the attenuation by the soil. However, significant vibration amplification zones emerge within specific ranges for different rail surface depths: 5–15 m and 75–90 m for a 10 m depth, 5–20 m and 75–95 m for a 15 m depth, and 10–25 m and 60–80 m for a 25 m depth. When sound-sensitive locations appear within these amplification zones, measures should be taken to mitigate train-induced vibrations.
Figure 18 presents the effect of different rail surface depths on the ground vibration levels for a constant train speed. It is evident that ground vibrations intensify as the rail surface depth decreases. As the burial depth of the tunnel structure increases, a notable decline in ground vibrations is observed within 50 m from the railway line center, attributed to the damping effect of the soil. Furthermore, beyond 50 m away from the railway line centre, the vibration level fall below the standard requirement (Environment, 1989).
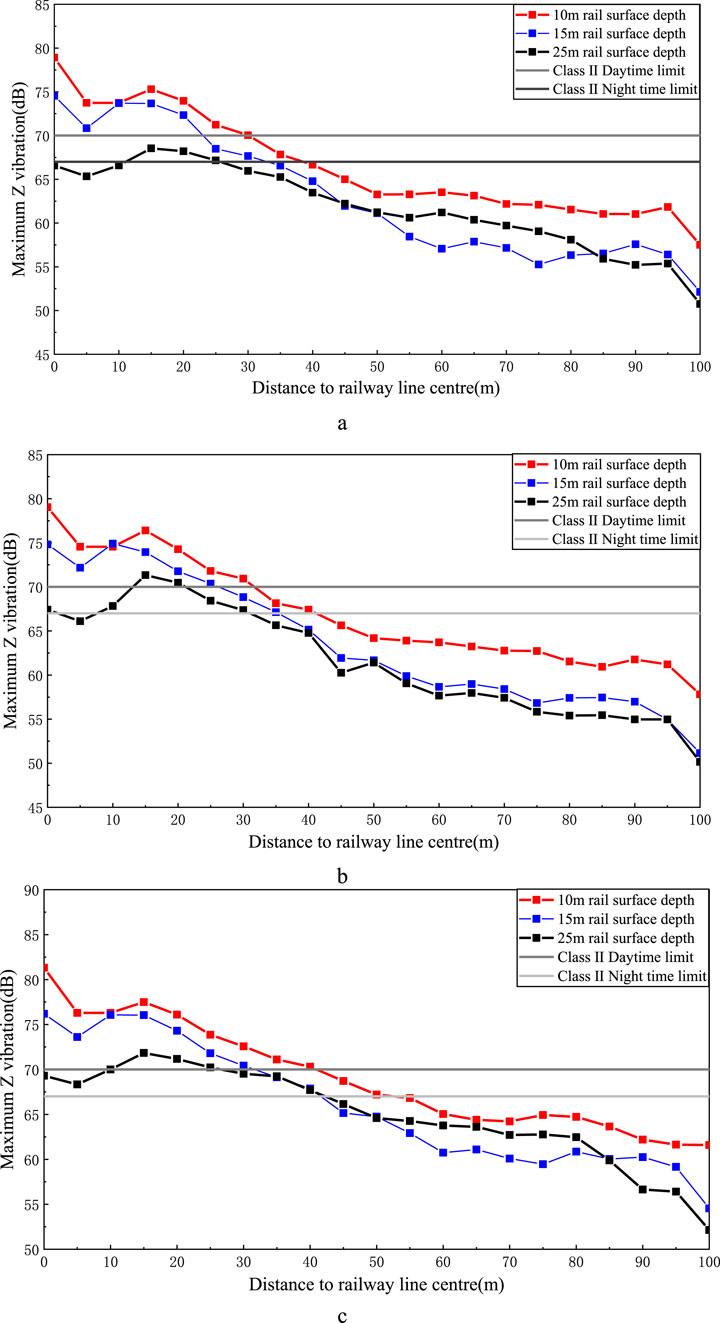
Figure 18. Maximum Z vibration level against distance to railway line centre (10, 15 and 25 m rail surface depths). (a) Train speed 120 km/h (b) Train speed 140 km/h (c) Train speed 160 km/h.
3.3.2 Vibration attenuation analysis for train speed at 160–250 km/h
In China, the intercity railway tunnel are typically mountain tunnels characterized by significant rail surface depths. Consequently, rail surface depths of 15, 25, and 35 m were examined. Figure 19 presents the maximum Z vibration level against distance to railway line centre in the intercity railway tunnel. The figure reveals that the vibration level at ground diminishes as the distance to the railway line centre increases, owing to the attenuation by the soil. Specifically, for the rail surface depth of 15 m, there is a distinct vibration amplification zone within a range of 10–25 m. When sound-sensitive locations fall within this amplification zone, measures should be taken to reduce the vibration. For the rail surface depth of 25 m and greater, the vibration at all depths fall below the strictest limit of 65 dB.

Figure 19. Maximum Z vibration level against distance to railway line centre (160–250 km/h). (a) 15 m rail surface depth (b) 25 m rail surface depth (c) 35 m rail surface depth.
3.3.3 Critical distance analysis
This section provides an overview of the critical distances necessary to comply with the vibration limits specified for various urban areas, as detailed in Table 6.

Table 6. Recommended critical distances for environmental vibration of track in tunnel (m).
4 Conclusion
This study is grounded in the noise and vibration control project pertaining to multiple railway lines within the Guangdong-Hong Kong-Macao Greater Bay Area. The railway lines encompassed in this study consist of suburban railways, intercity railways, and high-speed railways operating at speeds ranging from 120 to 250 km/h. Using the validated FEM models and parameters, which were calibrated through field measurements conducted on Beijing Daxing New Airport Line, the New Baiguang and Guangqing Intercity Railway, approximately 1,000 simulation conditions were analyzed. Consequently, a comprehensive data analysis database was established. The critical distances were proposed for train-induced vibrations at sound-sensitive locations along various types of railway alignments, including those on subgrades, viaducts, and tunnels. This research holds significant importance for the railway line location selection and vibration and noise management in crowed cities with multiple types of railways. The main findings of this study are outlined as follows.
(1) The ground vibration exhibits a notable decrease as the distance from the railway line center increases. At a constant train speed, the ground vibration demonstrates a decreasing trend with greater tunnel depth, due to the significant attenuation effect of soil damping on vibrations. Nevertheless, specific zones of vibration amplification emerge, and these zones vary in accordance with the rail surface depth and train speed.
(2) In many cases, the empirical equation for vibration prediction lacks accuracy and merely offers rough guidance that requires refinement. To enhance its precision, the empirical equation should incorporate a broader range of field conditions, thereby providing more accurate and reliable guidance.
(3) For railway lines with train speeds ranging from 160 to 250 km/h, the ground vibration remains below 65 dB when the rail surface depth exceeds 25 m.
The study focuses on specific railway types and speeds, and the results may not be directly applicable to other scenarios. Additionally, the study primarily considers vertical vibrations, and further research is needed to explore horizontal vibrations and their impact on surrounding environments.
Data availability statement
The original contributions presented in the study are included in the article/supplementary material, further inquiries can be directed to the corresponding author.
Author contributions
XG: Formal Analysis, Writing – original draft. DT: Methodology, Formal Analysis, Writing – original draft. JS: Formal Analysis, Methodology, Writing – original draft. DZ: Investigation, Methodology, Writing – review and editing. YL: Writing – review and editing, Investigation, Validation. JZ: Formal Analysis, Funding acquisition, Writing – review and editing.
Funding
The author(s) declare that financial support was received for the research and/or publication of this article. We would like to express our sincere gratitude to Guangzhou Metro Group Co. LTD. for funding and supporting this study. This research was also funded by the Natural Science Foundation of Shandong Province, grant number ZR2024QE392, Science and Technology Research and Development Program Project of China railway group limited (2022-Major-02, origin 2025-Special-03).
Conflict of interest
Authors XG, DT, JS, DZ, and YL were employed by China Railway Engineering Design and Consulting Group Co., Ltd.
The remaining author declares that the research was conducted in the absence of any commercial or financial relationships that could be construed as a potential conflict of interest.
Generative AI statement
The author(s) declare that no Generative AI was used in the creation of this manuscript.
Publisher’s note
All claims expressed in this article are solely those of the authors and do not necessarily represent those of their affiliated organizations, or those of the publisher, the editors and the reviewers. Any product that may be evaluated in this article, or claim that may be made by its manufacturer, is not guaranteed or endorsed by the publisher.
References
Balendra, T., Chua, K., Lo, K., and Lee, S. (1989). Steady-state vibration of subway-soil-building system. J. Eng. Mech. 115 (1), 145–162. doi:10.1061/(asce)0733-9399(1989)115:1(145)
Bucinskas, P., Ntotsios, E., Thompson, D. J., and Andersen, L. V. (2021). Modelling train-induced vibration of structures using a mixed-frame-of-reference approach. J. Sound Vib. 491, 115575. doi:10.1016/j.jsv.2020.115575
Chebli, H., Othman, R., Clouteau, D., Arnst, M., and Degrande, G. (2008). 3D periodic BE–FE model for various transportation structures interacting with soil. Comput. Geotechnics 35 (1), 22–32. doi:10.1016/j.compgeo.2007.03.008
Chen, Y., Feng, Q., Liu, Q., and Jiang, J. (2021). Experimental study on the characteristics of train-induced vibration in a new structure of metro depot. Environ. Sci. Pollut. Res. Int. 28 (30), 41407–41422. doi:10.1007/s11356-021-13599-x
Clouteau, D., Arnst, M., Al-Hussaini, T. M., and Degrande, G. (2005). Freefield vibrations due to dynamic loading on a tunnel embedded in a stratified medium. J. Sound Vib. 283 (1-2), 173–199. doi:10.1016/j.jsv.2004.04.010
Degrande, G., Clouteau, D., Othman, R., Arnst, M., Chebli, H., Klein, R., et al. (2006). A numerical model for ground-borne vibrations from underground railway traffic based on a periodic finite element–boundary element formulation. J. Sound Vib. 293 (3-5), 645–666. doi:10.1016/j.jsv.2005.12.023
Di, H., Zhou, S., He, C., Zhang, X., and Luo, Z. (2016). Three-dimensional multilayer cylindrical tunnel model for calculating train-induced dynamic stress in saturated soils. Comput. Geotechnics 80, 333–345. doi:10.1016/j.compgeo.2016.08.005
Environment, M. o.E. (1989). Standard of environmental vibration in urban area, GB 10070-1988. Beijing: China Standards Press.
Environment, M. o.E. (2018). Technical guidelines for environmental impact assessment-Urban rail transit, HJ 453-2018. Beijing: China Environmental Science Press.
Forrest, J. A., and Hunt, H. E. M. (2006). A three-dimensional tunnel model for calculation of train-induced ground vibration. J. Sound Vib. 294 (4-5), 678–705. doi:10.1016/j.jsv.2005.12.032
François, S., Schevenels, M., Galvín, P., Lombaert, G., and Degrande, G. (2010). A 2.5D coupled FE–BE methodology for the dynamic interaction between longitudinally invariant structures and a layered halfspace. Comput. Methods Appl. Mech. Eng. 199 (23-24), 1536–1548. doi:10.1016/j.cma.2010.01.001
Galvín, P., François, S., Schevenels, M., Bongini, E., Degrande, G., and Lombaert, G. (2010). A 2.5D coupled FE-BE model for the prediction of railway induced vibrations. Soil Dyn. Earthq. Eng. 30 (12), 1500–1512. doi:10.1016/j.soildyn.2010.07.001
Gardien, W., and Stuit, H. G. (2003). Modelling of soil vibrations from railway tunnels. J. Sound Vib. 267 (3), 605–619. doi:10.1016/s0022-460x(03)00727-2
He, C., Zhou, S., Di, H., Guo, P., and Xiao, J. (2018). Analytical method for calculation of ground vibration from a tunnel embedded in a multi-layered half-space. Comput. Geotechnics 99, 149–164. doi:10.1016/j.compgeo.2018.03.009
Jik Lee, P., and Griffin, M. J. (2013). Combined effect of noise and vibration produced by high-speed trains on annoyance in buildings. J. Acoust. Soc. Am. 133 (4), 2126–2135. doi:10.1121/1.4793271
Koziol, P., Mares, C., and Esat, I. (2008). Wavelet approach to vibratory analysis of surface due to a load moving in the layer. Int. J. Solids Struct. 45 (7-8), 2140–2159. doi:10.1016/j.ijsolstr.2007.11.008
Li, M., Ma, M., Cao, Z., Xia, Q., and Liu, W. (2021). Dynamic response analysis of train-induced vibration impact on the Probhutaratna pagoda in Beijing. Earthq. Eng. Eng. Vib. 20 (1), 223–243. doi:10.1007/s11803-021-2016-9
Liang, R. H., Liu, W. F., Li, C. Y., Li, W. B., and Wu, Z. Z. (2024). A novel efficient probabilistic prediction approach for train-induced ground vibrations based on transfer learning. J. Sound Vib. 30 (3-4), 576–587. doi:10.1177/10775463221148792
Liang, R. H., Liu, W. F., Ma, M., and Liu, W. N. (2021). An efficient model for predicting the train-induced ground-borne vibration and uncertainty quantification based on Bayesian neural network. J. Sound Vib. 495, 115908. doi:10.1016/j.jsv.2020.115908
Lombaert, G., Degrande, G., François, S., and Thompson, D. J. (2015). Ground-borne vibration due to railway traffic: a review of excitation mechanisms, prediction methods and mitigation measures. Noise Vib. Mitig. Rail Transp. Systems2015, 253–287. doi:10.1007/978-3-662-44832-8_33
Ma, M., Liu, W., Qian, C., Deng, G., and Li, Y. (2016). Study of the train-induced vibration impact on a historic Bell Tower above two spatially overlapping metro lines. Soil Dyn. Earthq. Eng. 81, 58–74. doi:10.1016/j.soildyn.2015.11.007
Ma, M., Xu, L., Du, L., Wu, Z., and Tan, X. (2020). Prediction of building vibration induced by metro trains running in a curved tunnel. J. Vib. Control 27 (5-6), 515–528. doi:10.1177/1077546320930910
Metrikine, A., and Vrouwenvelder, A. (2000). Surface ground vibration due to a moving train in a tunnel: two-dimensional model. J. Sound Vib. 234 (1), 43–66. doi:10.1006/jsvi.1999.2853
Nilsson, M. E. (2007). A-weighted sound pressure level as an indicator of short-term loudness or annoyance of road-traffic sound. J. Sound Vib. 302 (1-2), 197–207. doi:10.1016/j.jsv.2006.11.010
Organisation, I. S. (1997). Mechanical vibration and shock evaluation of human exposure to whole-body vibration. Francia: ISO.
Qu, S., Yang, J., Zhu, S., Zhai, W., Kouroussis, G., and Zhang, Q. (2021). Experimental study on ground vibration induced by double-line subway trains and road traffic. Transp. Geotech. 29, 100564. doi:10.1016/j.trgeo.2021.100564
Sheng, X., Jones, C., and Thompson, D. (2005). Modelling ground vibration from railways using wavenumber finite-and boundary-element methods. Proc. R. Soc. A Math. Phys. Eng. Sci. 461, 2043–2070. doi:10.1098/rspa.2005.1450
Sheng, X., Jones, C. J. C., and Thompson, D. J. (2006). Prediction of ground vibration from trains using the wavenumber finite and boundary element methods. J. Sound Vib. 293 (3-5), 575–586. doi:10.1016/j.jsv.2005.08.040
Sheng, X., and Li, M. H. (2007). Propagation constants of railway tracks as a periodic structure. J. Sound Vib. 299 (4-5), 1114–1123. doi:10.1016/j.jsv.2006.08.010
Vogiatzis, K., and Kouroussis, G. (2015). Prediction and efficient control of vibration mitigation using floating slabs: practical application at Athens metro lines 2 and 3. Int. J. Rail Transp. 3 (4), 215–232. doi:10.1080/23248378.2015.1076622
Vogiatzis, K., Zafiropoulou, V., and Mouzakis, H. (2018). Monitoring and assessing the effects from Metro networks construction on the urban acoustic environment: the Athens Metro Line 3 Extension. Sci. Total Environ. 639, 1360–1380. doi:10.1016/j.scitotenv.2018.05.143
Xia, H., Zhang, N., and Cao, Y. M. (2005). Experimental study of train-induced vibrations of environments and buildings. J. Sound Vib. 280 (3-5), 1017–1029. doi:10.1016/j.jsv.2004.01.006
Xu, L. (2021). Train-track-substructure dynamic interaction: theoretical model and numerical algorithm. China: Chinse Railway Press.
Xu, L., Wu, L., Li, Z., Peng, B., Lu, T., and Yu, Z. (2025). Further research of multi-scale assemble and matrix reassemble method for efficient analysis of railway track-substructure system subjected to a moving train. Railw. Eng. Sci. 33, 271–289. doi:10.1007/s40534-024-00342-8
Yang, J., Zhu, S., Zhai, W., Kouroussis, G., Wang, Y., Wang, K., et al. (2019). Prediction and mitigation of train-induced vibrations of large-scale building constructed on subway tunnel. Sci. Total Environ. 668, 485–499. doi:10.1016/j.scitotenv.2019.02.397
Zhai, W., Wei, K., Song, X., and Shao, M. (2015). Experimental investigation into ground vibrations induced by very high speed trains on a non-ballasted track. Soil Dyn. Earthq. Eng. 72, 24–36. doi:10.1016/j.soildyn.2015.02.002
Zhang, X., Zhou, S., He, C., Di, H., and Si, J. (2021). Experimental investigation on train-induced vibration of the ground railway embankment and under-crossing subway tunnels. Transp. Geotech. 26, 100422. doi:10.1016/j.trgeo.2020.100422
Zhu, S., Wang, J., Cai, C., Wang, K., Zhai, W., Yang, J., et al. (2017). Development of a vibration attenuation track at low frequencies for urban rail transit. Computer-Aided Civ. Infrastructure Eng. 32 (9), 713–726. doi:10.1111/mice.12285
Zou, C., Wang, Y., Moore, J. A., and Sanayei, M. (2017). Train-induced field vibration measurements of ground and over-track buildings. Sci. Total Environ. 575, 1339–1351. doi:10.1016/j.scitotenv.2016.09.216
Appendix
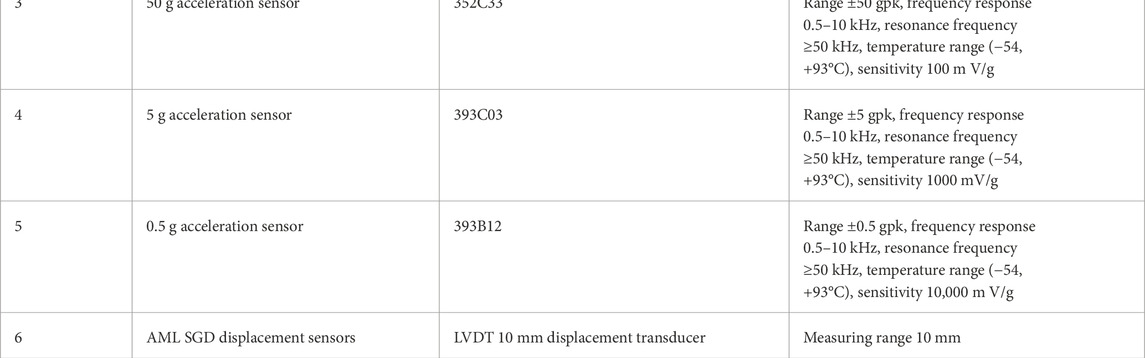
TABLE A1. Vibration measurement instruments

TABLE A2. Noise measurement instruments
Keywords: suburban railway, intercity railway, train-induced vibration, critical distance, field measurement
Citation: Guo X, Tian D, Sun J, Zhang D, Liu Y and Zhang J (2025) Evaluation of train-induced vibrations in medium-to-high speed railways: a parametric study. Front. Built Environ. 11:1577763. doi: 10.3389/fbuil.2025.1577763
Received: 16 February 2025; Accepted: 31 March 2025;
Published: 20 May 2025.
Edited by:
Qiang Zhang, Guangxi University, ChinaReviewed by:
Ruihua Liang, Nanyang Technological University, SingaporeLifeng Xin, Northwestern Polytechnical University, China
Liu Pan, Central South University, China
Copyright © 2025 Guo, Tian, Sun, Zhang, Liu and Zhang. This is an open-access article distributed under the terms of the Creative Commons Attribution License (CC BY). The use, distribution or reproduction in other forums is permitted, provided the original author(s) and the copyright owner(s) are credited and that the original publication in this journal is cited, in accordance with accepted academic practice. No use, distribution or reproduction is permitted which does not comply with these terms.
*Correspondence: Jinfeng Zhang, emhhbmdqaW5mZW5nMUBseXUuZWR1LmNu