 M. Carme Chaparro
 Maarten W. Saaltink
- 1CSD Engineers AG, Aarau, Switzerland
- 2Department of Civil and Environmental Engineering, Universitat Politècnica de Catalunya (UPC), Barcelona, Spain
El Cabril is the low- and intermediate-level radioactive waste disposal facility in Spain. Water is collected from the drains situated in the concrete cells storing radioactive waste, indicating flow of water into these concrete cells. 2D numerical models, together with temperature and humidity measurements, suggested that this flow of water was caused by a combination of thermo-hydraulic processes occurring in the unsaturated concrete, such as capillary rise from the groundwater, evaporation, and condensation due to temperature gradients caused by seasonal temperature fluctuations outside. The objective of this work is to study the effect of these processes on the mineralogy of the concrete. Therefore, 1D reactive transport models have been developed following the 2D thermo-hydraulic conceptual model. When minerals are controlled by fast kinetics, the model results show that the cement phases precipitate and dissolve, clearly following the yearly fluctuations of condensation and evaporation. However, when minerals are controlled by slow kinetics, the reactions are less affected by the hydraulic processes. The models suggest that precipitation-dissolution could be particularly important near the air gap in the concrete, where water condenses and evaporates more easily.
1 Introduction
Concrete is a porous material where, in unsaturated conditions, three main phases coexist: the solid phase, the gas phase, and the pore solution. The solid phase consists of aggregates of different sizes and the cement paste. The cement paste is composed mainly of C-S-H (calcium silicate hydrate), portlandite, ettringite, and hydrated calcium aluminate phases (primarily monosulfate and monocarbonate), along with smaller amounts of other hydration products (Taylor, 1997). Typically, the aggregates have less reactivity compared to the strong reactivity of the cement paste (Samson and Marchand, 2007). The pore solution, characterized by its high alkalinity (pH around 13), mainly comprises species such as OH, Na, K, Ca and
Concrete is widely used in various architectural and engineering structures, including buildings, bridges, and barriers for radioactive waste storage. These structures are exposed to environmental conditions where air temperature and relative humidity vary over time, causing changes in temperature and humidity within the concrete. Since concrete is a reactive material, it can be damaged, and its service life reduced by exposure to temperature and relative humidity variations due to processes involving water flow, solute transport, heat transport, evaporation, and condensation inside the concrete. Temperature gradients are one of the key factors controlling the processes interacting with concrete exposed to natural environments (Chaparro and Saaltink, 2016; Min et al., 2017; Isteita and Xi, 2017).
In unsaturated cementitious materials, experiments simulating environmental changes in temperature and humidity have been reported to study their effects on concrete. These findings demonstrate that temperature is the main factor influencing the internal relative humidity in concrete (Andrade et al., 1999; Min et al., 2017). As the temperature gradient increases, moisture transport inside concrete augments, leading to increased concrete damage (Min et al., 2017). However, these studies did not investigate changes in the mineralogy of the concrete. To simulate the effect of climate changes on concrete microstructure, El-Turki et al. (2010) conducted experiments on lime mortars exposed to wetting and drying cycles, although they did not account for temperature gradients. Their results suggest the dissolution and re-precipitation of C-S-H during each cycle. Recrystallization of C-S-H and portlandite due to residual unreacted clinker has also been observed by Chapwanya et al. (2009) and Chaparro et al. (2017) in saturated concrete.
In unsaturated porous media, temperature gradients can cause the diffusion of vapour with evaporation at the hot side and condensation at the cold side (Chaparro and Saaltink, 2016). Numerical models have been used to understand processes involving water flow, heat transport, evaporation, and condensation in concrete (Bažant and Najjar, 1972; Häupl et al., 1997; Lü, 2002; Liu et al., 2004). Our study focuses on El Cabril, the low- and intermediate-level radioactive waste disposal facility in Spain. The radioactive waste is stored in concrete cells. El Cabril motivated this study because, after sealing the cells, tritiated water was collected in drains placed at their centre, indicating water flow inside the cell. In previous works, Chaparro and Saaltink (2016), Chaparro and Saaltink (2022) demonstrated through numerical models that the leakage of water collected in the drains of the cells may be caused by capillary rise from the phreatic level, along with evaporation and condensation produced by temperature gradients inside the concrete due to seasonal fluctuations outside. However, in these previous works, changes in concrete microstructure were not considered. Also, within the framework of El Cabril, Trapote (2015) conducted experiments and reactive transport models simulating evaporation in unsaturated mortar under thermal loads. Although her numerical models predicted the dissolution of portlandite, calcite, and ettringite, and the precipitation of C-S-H, this could not be confirmed experimentally. Nevertheless, in another context, Schwotzer et al. (2010) demonstrated experimentally that a condensed drop of water could alter concrete due to carbonation, leading to progressive deterioration of the concrete both laterally and in depth.
Although the effects of temperature changes on mineralogy have been studied even in unsaturated environments (Samper et al., 2018), no modelling studies have been reported on the geochemistry of concrete affected by temperature gradients along with evaporation and condensation processes under natural conditions. Hence, the objective of this work is to study the effect of these hydraulic processes on the mineralogy of the concrete used to store radioactive waste at El Cabril, following the conceptual model of Chaparro and Saaltink (2016), Chaparro and Saaltink (2022).
2 Conceptual model
The “El Cabril” radioactive waste facility is situated in southern Spain. It consists of 28 concrete cells designed for waste storage. Each cell measures 19.3 m by 23.8 m by 9 m and has a capacity of 1,000
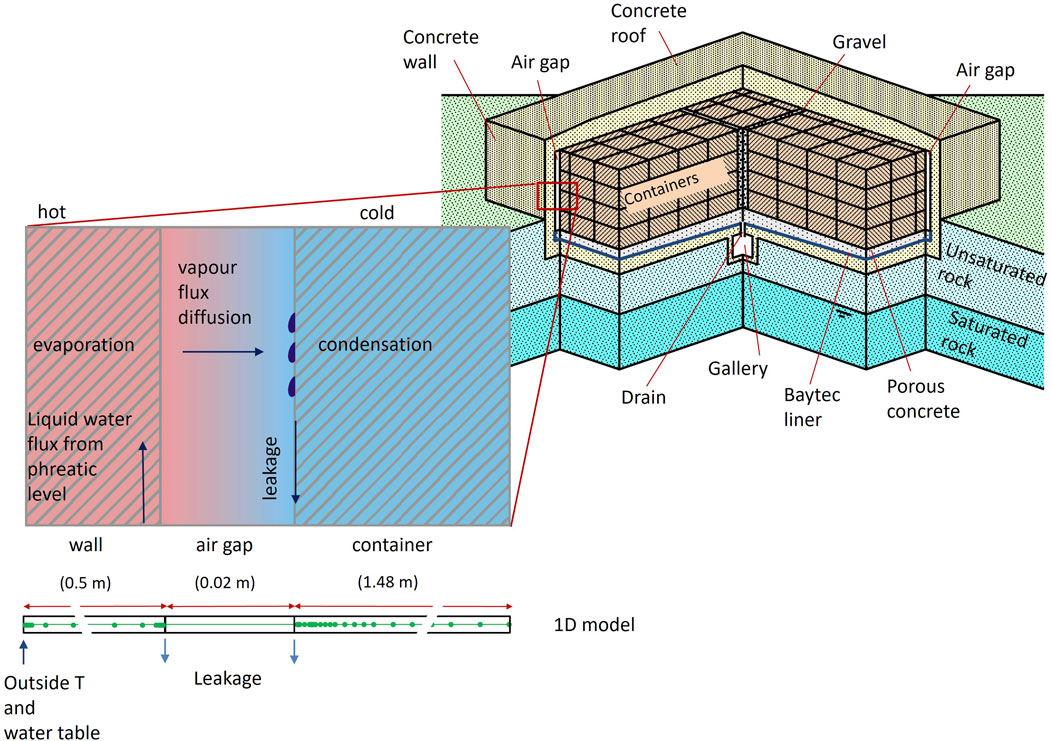
Figure 1. Schematization of a concrete cell and conceptual model. Situation in summer: water ascends from the phreatic surface, evaporates at the hot side (wall of the cell), vapour diffuses through the air gap and water condensates at the cold side (wall of container) (Chaparro and Saaltink, 2016).
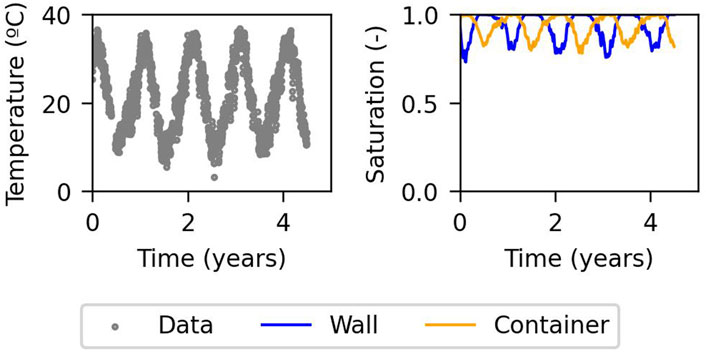
Figure 2. Evolution of temperature outside the cell and saturation inside the cell (Chaparro and Saaltink, 2016). Time = 0 years refers to summer.
We follow the same conceptual model used by Chaparro and Saaltink (2016), Chaparro and Saaltink (2022), which considers that water can ascend from the phreatic level to the wall of the cell due to capillary rise through the unsaturated rock. In summer, the wall of the cell is hotter and the wall of the container is colder because the air gap acts as thermal insulation. Thus, water can evaporate from the wall of the cell. This vapour diffuses through the air gap due to the temperature gradient between the wall of the cell and the wall of the container. Water condenses on the wall of the container because of its lower temperature. Consequently, water runs off to the drain. In winter, the wall is colder and the container is hotter. Hence, water evaporates at the container and condenses on the wall. So, again water runs off to the drain. This occurs only in summer and winter because then the temperature difference across the air gap is large enough to produce this phenomenon. Figure 2 shows the evolution of temperature outside the cell measured by sensors (Chaparro and Saaltink, 2016), with the corresponding seasonal fluctuations. This figure also shows the saturation inside the cell calculated by Chaparro and Saaltink (2016), where water evaporates at the side with lower water saturation, and condenses at the side with high water saturations. In this work, the conceptual model also takes into account the chemical reactions in the concrete during the evaporation and condensation processes. To do so, two numerical models have been implemented: one controlled by fast kinetics (where cement phases are practically at equilibrium) and another one controlled by slow kinetics. The model with fast kinetics considers the pore water in equilibrium with the main cement phases, while pore water from the model with slow kinetics is far from equilibrium to those phases.
3 Numerical model
The simulations were carried out using Retraso-CodeBright (Saaltink et al., 2004). This software package couples CodeBright (Olivella et al., 1996b) to a module for reactive transport modelling, including aqueous complexation reactions, adsorption and precipitation/dissolution of minerals.
3.1 Geometry, materials and mesh
The 1D model is positioned 3.5 m above the base of the cell and has a length of 2 m (Figure 1). It includes the wall of the cell (0.5 m), the air gap (0.02 m), and the container where the waste is stored (1.48 m). The model comprises 63 nodes and 62 one-dimensional elements, with sizes ranging from 0.001 to 0.1 m. The mesh is refined along both sides of the air gap and at the boundary of the wall of the cell. The gap is represented by a single element, with its nodes corresponding to the wall of the cell and the container. The reactions take place in the wall of the cell and container; no reactions occur in the gap.
3.2 Boundary and initial conditions
The initial and boundary conditions used in this numerical model are the same as used in previous works (Chaparro and Saaltink, 2022), which were verified with the measured data from the concrete cells.
The initial temperature of the entire cell is
Following Chaparro and Saaltink (2016), Chaparro and Saaltink (2022), temperature is prescribed and varies with time at the wall of the cell, using the daily average temperature measured by the sensors situated outside the cell (Figure 2). This boundary condition is applied to the outer boundary of the wall of the cell at the left (Figure 1).
The vertical water flux from and to the groundwater is simulated by a pressure dependent boundary flux taking into account the distance to the groundwater level and the hydraulic conductivity of the concrete (Equations 1–3). This boundary condition is applied to the second node from the wall of the cell, representing the interaction between the groundwater and the concrete porewater occurring at the base of the wall.
Where
A leakage boundary condition is applied to the air gap between the wall and the container, allowing water to leave the cell only when liquid pressure exceeds atmospheric pressure. This represents the leakage to the drain (Equation 4; Figure 1).
Where
3.3 Thermo-hydraulic system
Retraso-CodeBright solves the balance equations for water, air, and energy. The water balance takes into account unsaturated flow and vapour diffusion affected by temperature as detailed by Olivella et al. (1994).
The thermo-hydraulic parameters of the concrete used in this model are the same as those used by Chaparro and Saaltink (2016). The porosity is 0.17, the intrinsic permeability is
where
The van Genuchten model is also used for the relative permeability as a function of saturation using the same value for
where
For more details regarding the thermo-hydraulic parameters used in this model, we refer to Villar et al. (2009), Chaparro et al. (2015), and Chaparro and Saaltink (2016).
3.4 Geochemical system
3.4.1 Concrete composition
The concrete used to build the cells for storing radioactive waste was manufactured at El Cabril (Spanish Nuclear Waste Management Company). The numerical model starts when the structure was approximately 13 years old. Table 1 provides the cement composition used to make the concrete, and Table 2 gives the concrete composition (Chaparro and Saaltink, 2016; Chaparro et al., 2017). The cement paste considered in the numerical model is composed of C-S-H gel, portlandite, ettringite, and calcite as primary phases. Monosulphate or other minor phases are not considered because they were not found by X-ray diffraction, which was analysed in a sample with the same composition as that used for the cells. The numerical model assumes that aggregates are composed only of quartz, as it is the main component. The C-S-H gel is considered a solid solution with varying Ca/Si ratios. It is modelled assuming five pure minerals with Ca/Si ratio ranging from 0.83 to 1.67. C-S-H-1667 is used as the primary phase and the others as secondary phases. C-A-S-H is also considered a solid solution, with 3 phases having a Ca/Si ratio of one and Al/Si ratios equal to 0.05, 0.10, and 0.15 (Myers et al., 2015). All C-A-S-H phases are considered secondary phases. The volumetric fractions of the primary phases (Table 3) were calculated from the cement and concrete composition.
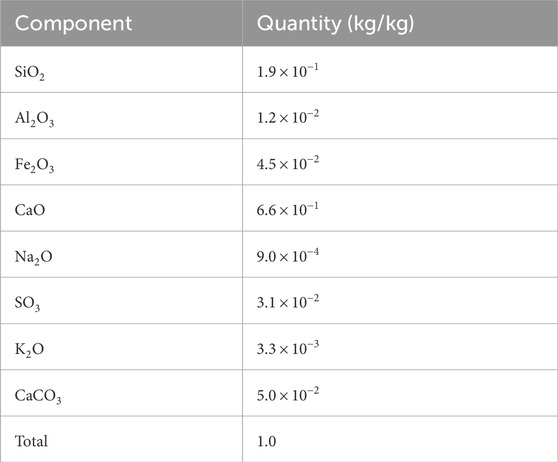
Table 1. Composition of the ordinary portland cement I-42.5 R/SR.
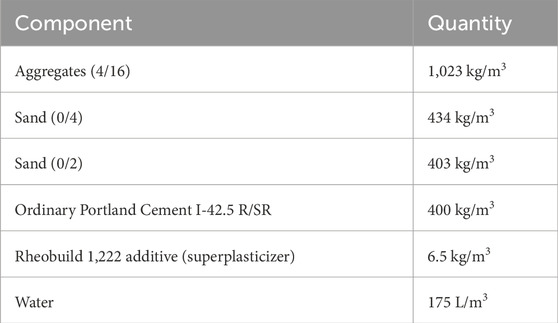
Table 2. Composition of the concrete. Minimum and maximum sizes (mm) of the aggregate and sand are given within parenthesis (Chaparro and Saaltink, 2016; Chaparro et al., 2017).
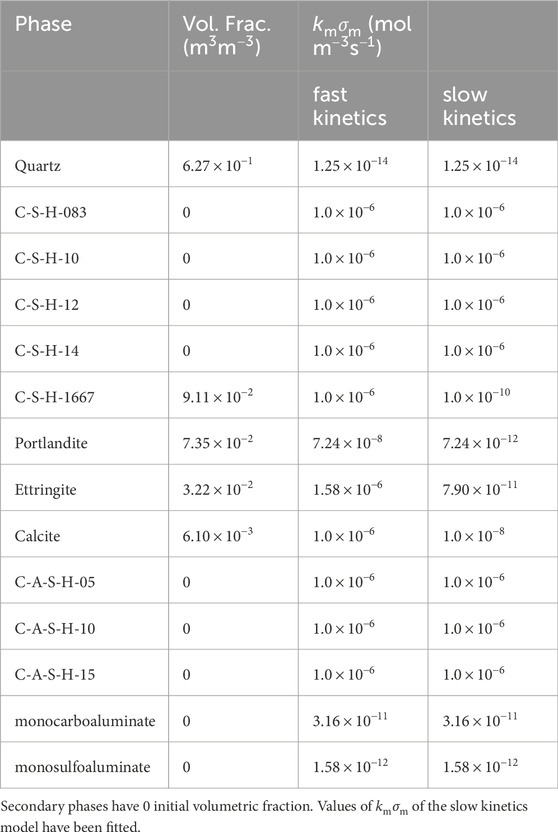
Table 3. Primary and secondary phases considered in the numerical model. The initial volumetric fraction and the product
3.4.2 Water composition
Table 4 shows the chemical composition of the initial concrete pore water and the groundwater used in the numerical model. The composition of the groundwater corresponds to the measured chemical data from a well located approximately 300 m from the concrete cell storing the radioactive waste, with a phreatic level between 4 and 5 m. As there are no data available on the chemical composition of the groundwater entering the cell, the chemical composition of this well is used instead. Two chemical compositions are considered for the initial concrete pore water according to two different conceptual models. The model referred to as fast kinetics considers the Ca, Si,
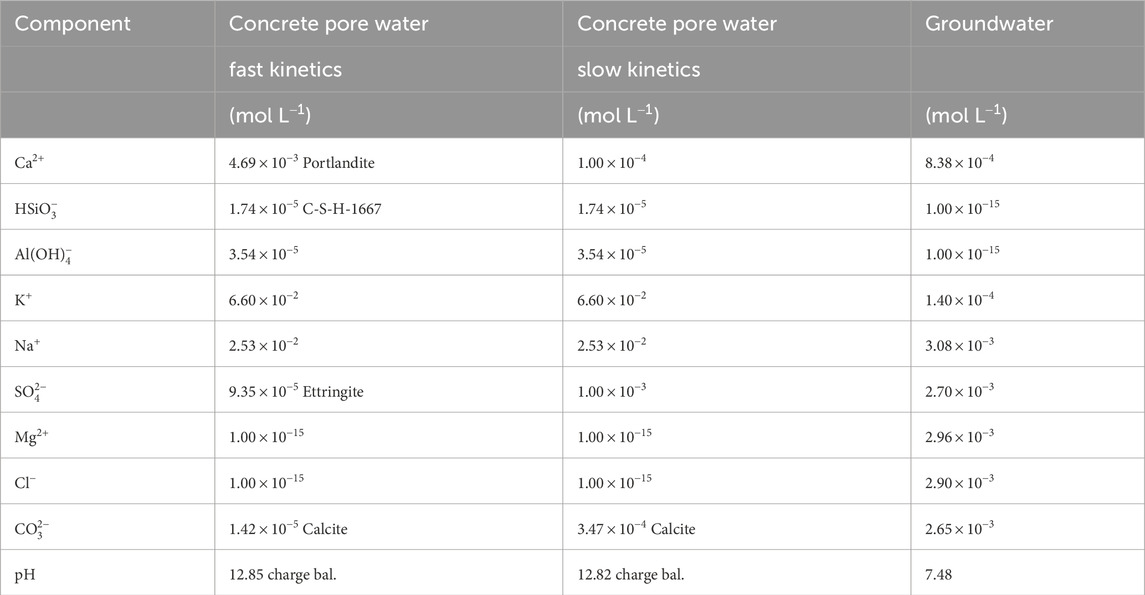
Table 4. Initial composition of the concrete porewater and composition of the groundwater at
3.4.3 Thermodynamic data
The thermodynamic data used in the numerical models depend on the temperature. Table 5 shows the thermodynamic data at different temperatures (0, 25 and 60
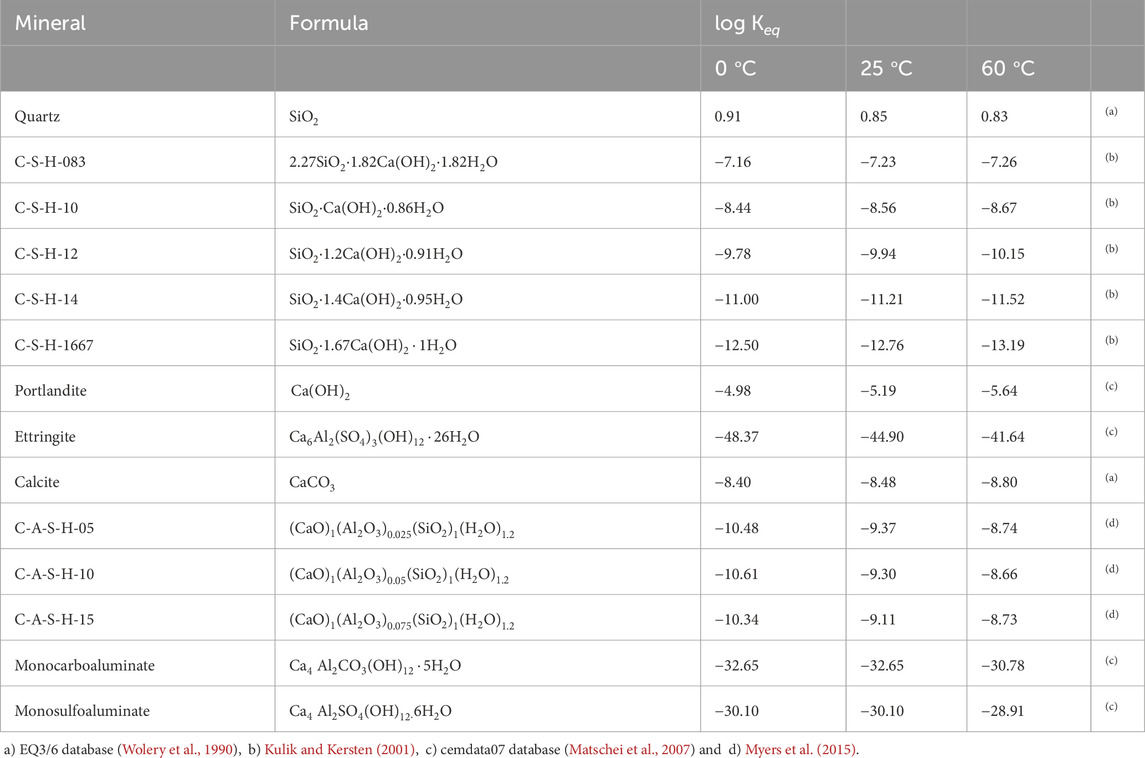
Table 5. Equilibrium constants of the minerals taken into account in the numerical model. Reactions are written as the dissolution of 1 mol of mineral in terms of the primary species
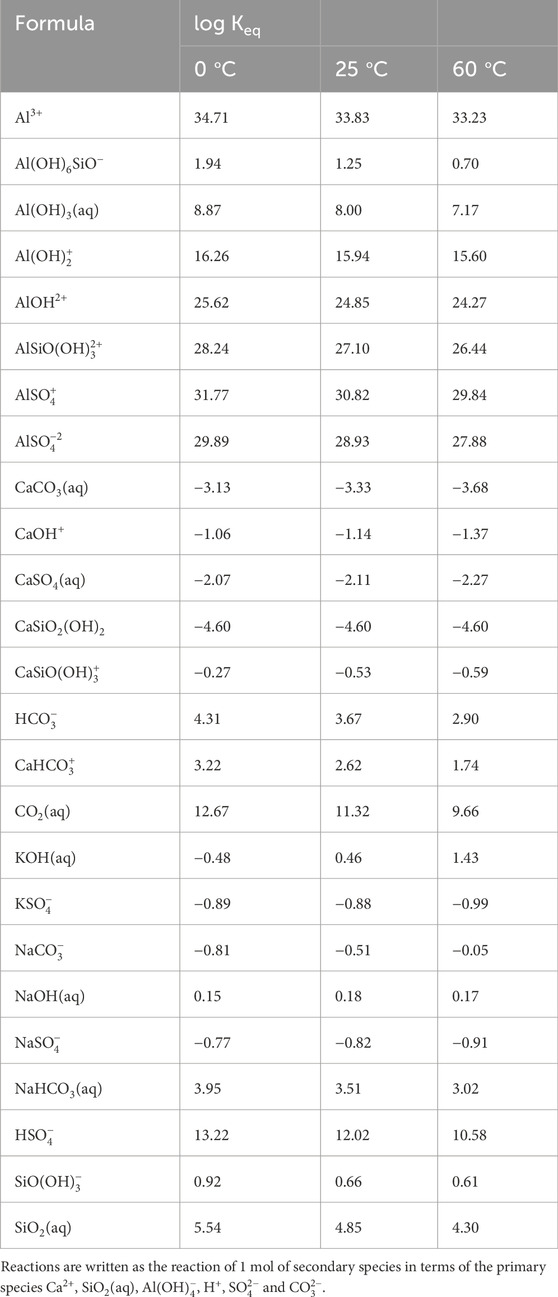
Table 6. Secondary species with their equilibrium constants (log
3.4.4 Reaction rates
A kinetic approach is used for the dissolution-precipitation of mineral phases, although sometimes the reaction is fast enough to be practically at equilibrium. The form of the rate law, Equation 7, is from Lasaga (1984).
Here,
For the model with fast kinetics, large values of the surface areas for cement phases and secondary phases are used (
Where
4 Results and discussion
4.1 Water composition
The evolution of measured concentrations of several chemical components in the water collected in the drain is compared with the model results in Figures 3, 4, for those components with measurements. Otherwise, only model results are presented. Figure 3 corresponds to the model with fast kinetics, and Figure 4 to the one with slow kinetics. In both models the fluctuating temperature at the outside leads to fluctuating saturation, as shown in Figure 2, due to evaporation and condensation discussed in Section 2. This affects also chemical composition and reactions. Concentrations are higher on the hotter side - during summer at the wall of the cell and during winter at the wall of the container - due to evaporation. Calcium concentration is overestimated when portlandite is assumed to be at equilibrium, indicating that in reality the concentrations in the cement pore water are not in equilibrium with the cement phases [also observed by Chaparro et al. (2017)]. The model with fast kinetics initially assumes equilibrium with portlandite, which is clearly not the case. Therefore, the chemical composition of the initial concrete pore water for the fast kinetics model was adjusted to match the concentration measured in the water collected in the drain. Additionally, the products of kinetic rate constant and surface area
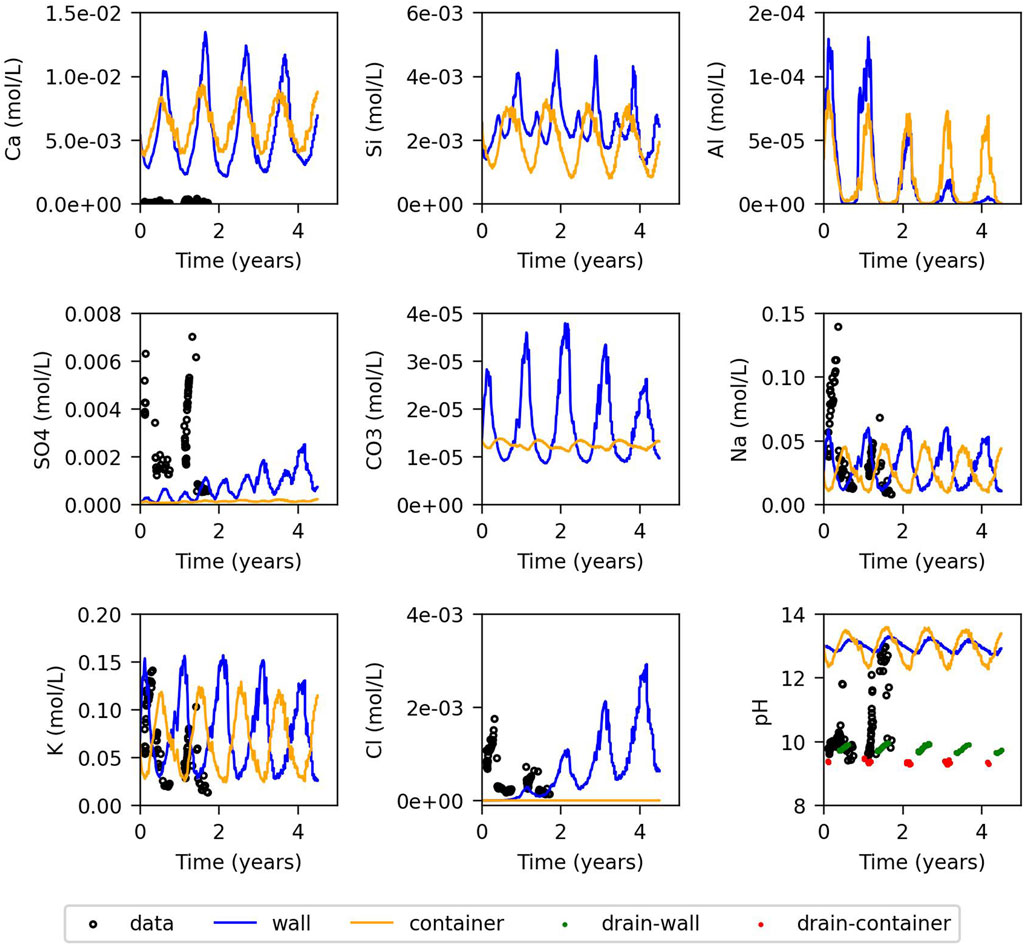
Figure 3. Evolution of the concentration for the model controlled by fast kinetics: Model results for the wall and container (blue and orange lines), measured data from the drain (black dots), and equilibrated model with atmospheric
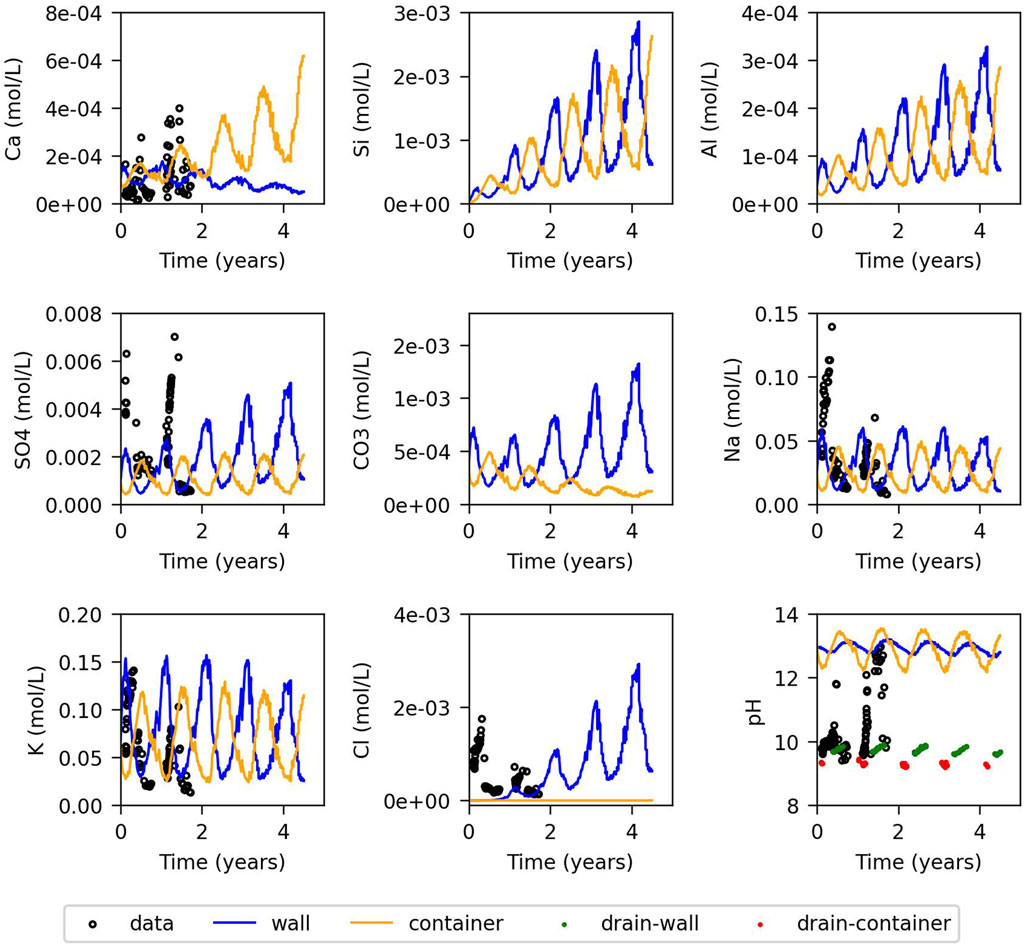
Figure 4. Evolution of the concentration for the model controlled by slow kinetics: Model results for the wall and container (blue and orange lines), measured data from the drain (black dots), and equilibrated model with atmospheric
4.2 Mineral variation
Figures 5, 6 depict the evolution of the volumetric fractions for the model with fast and slow kinetics, respectively. In the model with fast kinetics, the results show distinct seasonal variations in mineral fractions corresponding to fluctuations in external temperature. During summer, portlandite, C-S-H, ettringite, and calcite precipitate on the wall of the cell due to evaporation, while they dissolve in the container due to condensation. In winter, the opposite occurs: portlandite, C-S-H, and calcite dissolve in the wall and precipitate in the container. C-A-S-H-05 precipitates alongside portlandite and C-S-H dissolution, reversing when they precipitate. C-A-S-H-05 precipitates exclusively in winter and only on the cell wall. Monocarboaluminate precipitates minimally in the container but slightly more in the cell wall, possibly influenced by capillary groundwater infiltration. Other secondary phases considered do not precipitate.
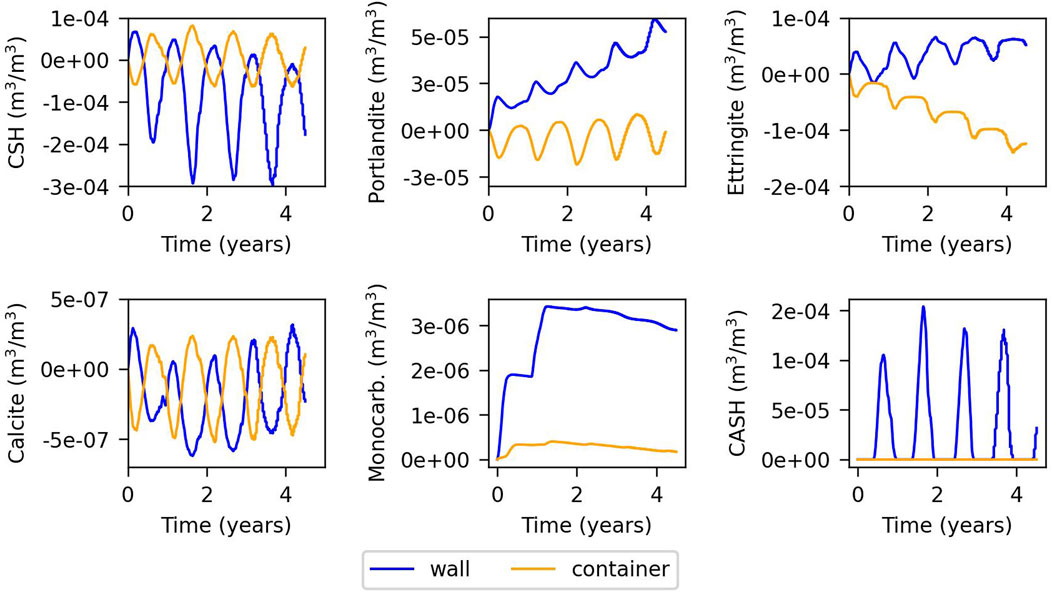
Figure 5. Evolution of the changes in volumetric fraction of minerals for the fast kinetics model. Time = 0 years refers to summer.
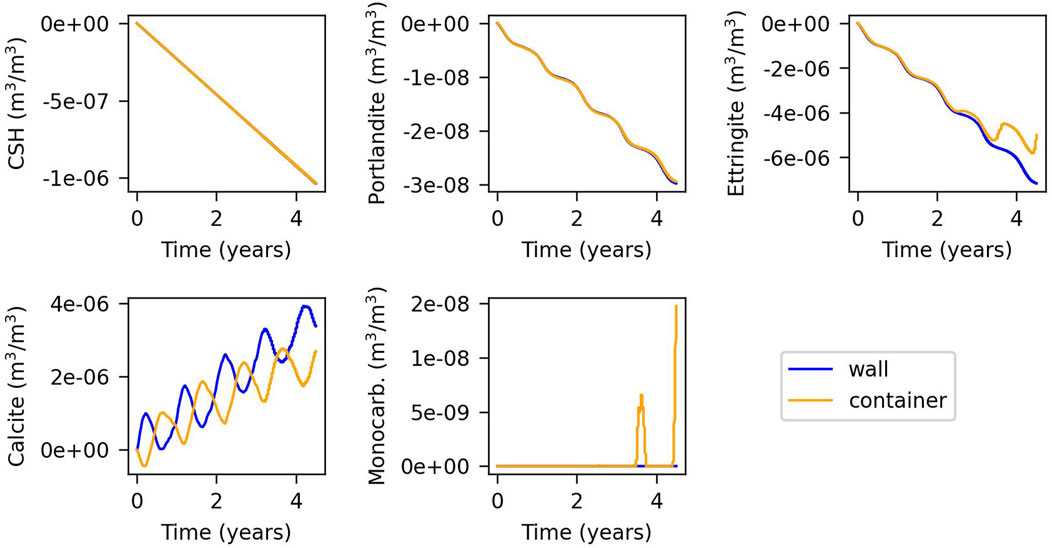
Figure 6. Evolution of the changes in volumetric fraction of minerals for the model controlled by slow kinetics. Time = 0 years refers to summer.
In contrast, the model with slow kinetics exhibits less dissolution and precipitation of portlandite, C-S-H, and ettringite. Temperature-driven fluctuations are less pronounced, since the chemical composition is far from equilibrium. Therefore, concentration changes due to condensation/evaporation do not have an important effect on precipitation-dissolution rates as shown by Equation 7. In contrast, calcite dissolution and precipitation remain significant and follow annual temperature cycles, reflecting equilibrium conditions. There is no precipitation of C-A-S-H, and monocarboaluminate appears in the container after 3.5 years, primarily in winter, probably due to increased ettringite dissolution from the preceding summer.
Figures 7, 8 illustrate the changes in volumetric fraction of minerals versus distance for summer and winter in models with fast and slow kinetics, respectively. The second node from the outer boundary represents the interaction between groundwater and concrete, which provokes dissolution of C-S-H and portlandite, and strong precipitation of calcite. In reality, this first contact with the groundwater and the concrete porewater is at the base of the wall of the cell. The gap between the wall of the cell and the container is at 0.5 m. In the model with fast kinetics, there is generally more dissolution and precipitation near the gap, where the temperature gradient and vapour diffusion are higher. Portlandite, C-S-H gel, ettringite, and calcite exhibit similar behaviour in both winter and summer. However, C-A-S-H appears predominantly in summer and primarily in the wall, dissolving completely in winter due to the dissolution of portlandite and C-S-H in summer and their precipitation in winter. Monocarboaluminate precipitates near the gap and in the container.
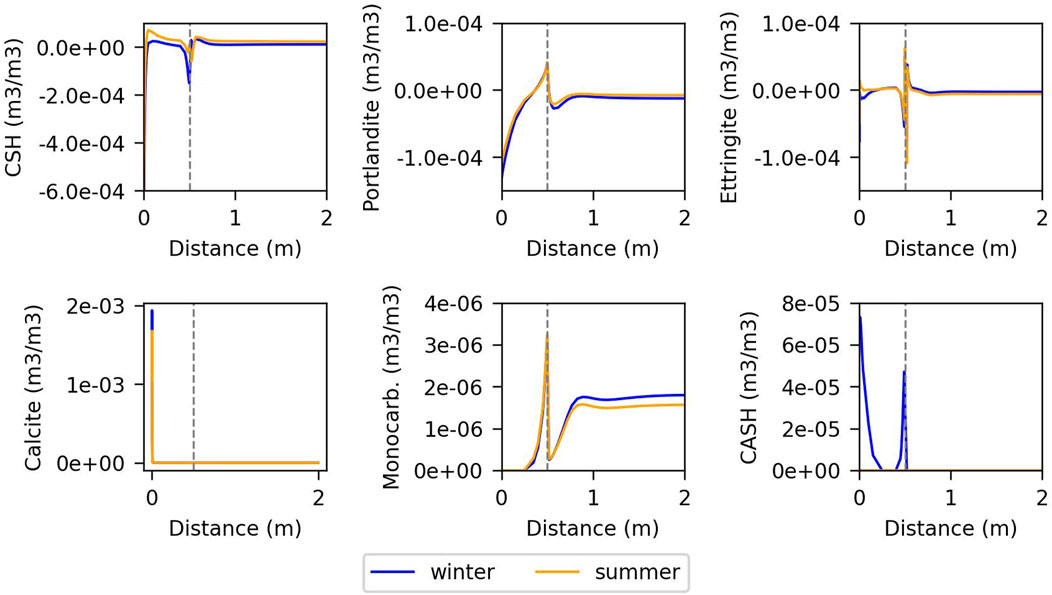
Figure 7. Changes in volumetric fraction of minerals against distance for the fast kinetics model, at the last year of simulation. The vertical line indicates the gap.
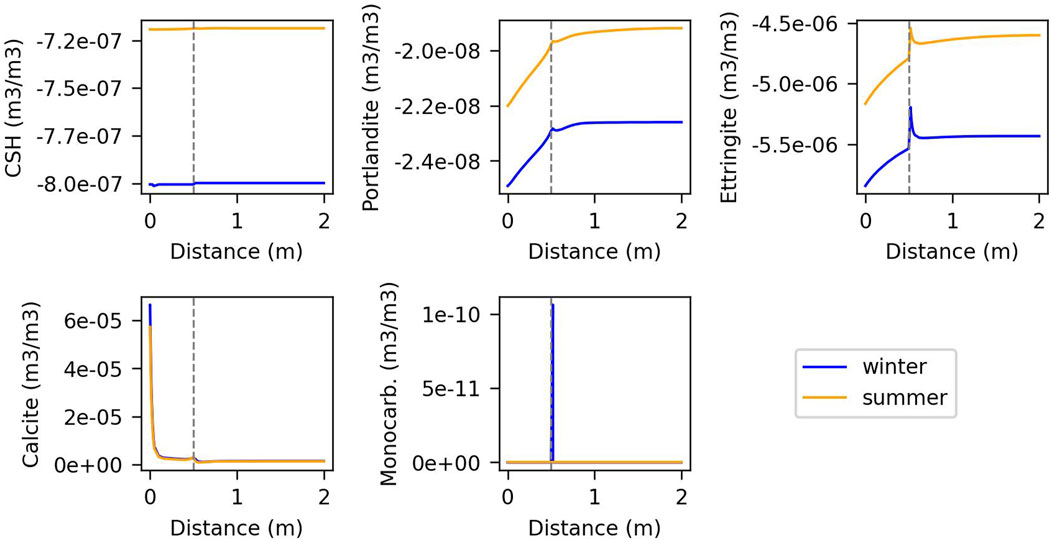
Figure 8. Changes in volumetric fraction of minerals against distance for the model controlled by slow kinetics, at the last year of simulation. The vertical line indicates the gap.
In contrast, the model controlled by kinetics shows lower dissolution and precipitation of portlandite, C-S-H, and ettringite, but slightly higher calcite precipitation near to the gap (
4.3 Porosity
Figure 9 depicts the porosity versus distance in the fast kinetics model. The slow kinetics model predicts no perceptible porosity changes. In the fast kinetics model, although porosity remains relatively stable, there is a slight impact at the second node from the outer boundary due to the interaction between the groundwater and the concrete, and near the air gap due to evaporation and condensation processes. These trends are consistent across both winter and summer conditions.
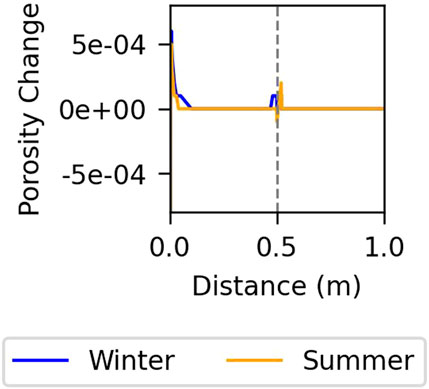
Figure 9. Change in porosity against distance for the model controlled by fast kinetics at the last year of simulation. The vertical line indicates the gap.
5 Conclusion
Reactive transport models were developed to investigate the impact of chemical reactions occurring within concrete due to evaporation and condensation processes. The model results demonstrate that the concentration of water collected in the drain varies with temperature fluctuations outside the cells. Concentrations are higher on the hotter side due to evaporation and lower on the colder side because of condensation. The model controlled by slow kinetics better reproduces the measured concentrations, suggesting that the initial pore water was not initially at equilibrium with cement phases, probably due to exposure to atmospheric conditions before sealing. The pH observed in samples is around 10, which may be attributed to contact with atmospheric
The model with fast kinetics, approaching local equilibrium, indicates that portlandite, C-S-H, ettringite, and calcite precipitate and dissolve in clear accordance with annual fluctuations in condensation and evaporation. C-A-S-H precipitates when portlandite and C-S-H dissolve, and dissolves when they precipitate. The precipitation and dissolution of monocarboaluminate are influenced by the dynamics of calcite and ettringite in the container, potentially affected by groundwater in the cell wall. In the model with slow kinetics, there is generally less dissolution and precipitation and a diminished impact of annual temperature fluctuations. This suggests that mineral precipitation-dissolution processes are primarily controlled by kinetics rather than by evaporation and condensation.
Minor changes in porosity, observed only in the fast kinetics model, occur mainly near the gap where water can readily evaporate and condense. However, these changes are minimal and can be considered negligible. Therefore, despite ongoing chemical reactions within the cell, the concrete structure does not appear to suffer significant damage. In the future, the installation will be covered by a multilayer cover. This will reduce considerably the temperature oscillations and, hence, evaporation and condensation near the gap. Therefore, we expect porosity changes and mineral precipitation/dissolution to cease after covering and neither to have an important effect during the total lifetime of the repository.
This 1D model is still qualitative. In order to have more quantitative results, the model should be verified and calibrated with measured data from the storage cells. Unfortunately, these data do not exist because the cells have already been closed. A 2D geometry will further improve the model, in order to have more detail on the vertical distribution of the mineral precipitation and dissolution.
Data availability statement
The original contributions presented in the study are included in the article/supplementary material, further inquiries can be directed to the corresponding author.
Author contributions
MC: Writing – review and editing, Writing – original draft. MS: Writing – review and editing, Writing – original draft.
Funding
The author(s) declare that no financial support was received for the research and/or publication of this article.
Acknowledgments
The authors acknowledge ENRESA (Spanish Nuclear Waste Management) for providing the measured data from “El Cabril” used in this study.
Conflict of interest
Author MC was employed by CSD Engineers AG.
The remaining author declares that the research was conducted in the absence of any commercial or financial relationships that could be construed as a potential conflict of interest.
Generative AI statement
The author(s) declare that no Generative AI was used in the creation of this manuscript.
Publisher’s note
All claims expressed in this article are solely those of the authors and do not necessarily represent those of their affiliated organizations, or those of the publisher, the editors and the reviewers. Any product that may be evaluated in this article, or claim that may be made by its manufacturer, is not guaranteed or endorsed by the publisher.
References
Andrade, C., Sarría, J., and Alonso, C. (1999). Relative humidity in the interior of concrete exposed to natural and artificial weathering. Cem. Concr. Res. 29 (8), 1249–1259. doi:10.1016/s0008-8846(99)00123-4
Bandstra, J. Z., Buss, H. L., Campen, R. K., Liermann, L. J., Moore, J., Hausrath, E. M., et al. (2008). Appendix: compilation of mineral dissolution rates. New York, NY: Springer.
Bažant, Z., and Najjar, L. (1972). Nonlinear water diffusion in nonsaturated concrete. Matériaux Constr. 5, 3–20. doi:10.1007/bf02479073
Chaparro, M. C., and Saaltink, M. W. (2016). Water, vapour and heat transport in concrete cells for storing radioactive waste. Adv. Water Resour. 94, 120–130. doi:10.1016/j.advwatres.2016.05.004
Chaparro, M. C., and Saaltink, M. W. (2022). Tritium transport in non-saturated concrete under temperature fluctuations. J. Environ. Radioact. 251-252, 106969. doi:10.1016/j.jenvrad.2022.106969
Chaparro, M. C., Saaltink, M. W., and Villar, M. V. (2015). Characterization of concrete by calibrating thermo-hydraulic multiphase flow models. Transp. Porous Media 109, 147–167. doi:10.1007/s11242-015-0506-9
Chaparro, M. C., Soler, J. M., Saaltink, M. W., and Mäder, U. K. (2017). Reactive transport models of a high–pH infiltration test in concrete. Physics and Chemistry of the Earth 99, 131–141. doi:10.1016/j.pce.2017.01.010
Chapwanya, M., Stockie, J., and Liu, W. (2009). A model for reactive porous transport during re-wetting of hardened concrete. J. Eng. Math. 65 (1), 53–73. doi:10.1007/s10665-009-9268-0
El-Turki, A., Ball, R. J., Holmes, S., Allen, W. J., and Allen, G. C. (2010). Environmental cycling and laboratory testing to evaluate the significance of moisture control for lime mortars. Constr. Build. Mater. 24 (8), 1392–1397. doi:10.1016/j.conbuildmat.2010.01.019
Gran-Esforzado, M. (2015). “Coupled heat and water flow dynamics in dry soils,” in Application to a multilayer waste cover. Universitat Politècnica de Catalunya UPC. Ph.D. thesis.
Häupl, P., Grunewald, J., Fechner, H., and Stopp, H. (1997). Coupled heat air and moisture transfer in building structures. Int. J. Heat Mass Transf. 40, 1633–1642. doi:10.1016/s0017-9310(96)00245-1
Isteita, M., and Xi, Y. (2017). The effect of temperature variation on chloride penetration in concrete. Constr. Build. Mater. 156, 73–82. doi:10.1016/j.conbuildmat.2017.08.139
Johannesson, B., and Utgenannt, P. (2001). Microstructural changes caused by carbonation of cement mortar. Cem. Concr. Res. 31 (6), 925–931. doi:10.1016/s0008-8846(01)00498-7
Kulik, D., and Kersten, M. (2001). Aqueous solubility diagrams for cementitious waste stabilization systems: II, end-member stoichiometries of ideal calcium silicate hydrate solid solutions. J. Am. Ceram. Soc. 84, 3017–3026. doi:10.1111/j.1151-2916.2001.tb01130.x
Lasaga, A. C. (1984). Chemical kinetics of water-rock interactions. J. Geophys. Res. Solid Earth 89 (B6), 4009–4025. doi:10.1029/jb089ib06p04009
Liu, J., Aizawa, H., and Yoshino, H. (2004). CFD prediction of surface condensation on walls and its experimental validation. Build. Environ. 39, 905–911. doi:10.1016/j.buildenv.2004.01.015
Lothenbach, B., and Winnefeld, F. (2006). Thermodynamic modelling of the hydration of portland cement. Cem. Concr. Res. 36 (2), 209–226. doi:10.1016/j.cemconres.2005.03.001
Lü, X. (2002). Modelling of heat and moisture transfer in buildings: I. model program. Energy Build. 34, 1033–1043. doi:10.1016/s0378-7788(02)00021-x
Matschei, T., Lothenbach, B., and Glasser, F. P. (2007). Thermodynamic properties of portland cement hydrates in the system CaO-Al2O3-SiO2-CaSO4-CaCO3-H2O. Cem. Concr. Res. 37 (10), 1379–1410. doi:10.1016/j.cemconres.2007.06.002
Min, H., Zhang, W., Gu, X., and Černý, R. (2017). Coupled heat and moisture transport in damaged concrete under an atmospheric environment. Constr. Build. Mater. 143, 607–620. doi:10.1016/j.conbuildmat.2017.03.163
Myers, R. J., L’Hôpital, E., Provis, J. L., and Lothenbach, B. (2015). Effect of temperature and aluminium on calcium (alumino)silicate hydrate chemistry under equilibrium conditions. Cem. Concr. Res. 68, 83–93. doi:10.1016/j.cemconres.2014.10.015
Olivella, S., Carrera, J., Gens, A., and Alonso, E. E. (1994). Nonisothermal multiphase flow of brine and gas through saline media. Transp. Porous Media 15, 271–293. doi:10.1007/bf00613282
Olivella, S., Carrera, J., Gens, A., and Alonso, E. E. (1996a). Porosity variations in saline media caused by temperature gradients coupled to multiphase flow and dissolution/precipitation. Transp. Porous Media 25, 1–25. doi:10.1007/bf00141260
Olivella, S., Gens, A., Carrera, J., and Alonso, E. E. (1996b). Numerical formulation for a simulator (CODE_BRIGHT) for the coupled analysis of saline media. Eng. Comput. 13 (7), 87–112. doi:10.1108/02644409610151575
Parkhurst, D. L., and Appelo, C. (1999). User’s guide to PHREEQC (version 2) - a computer program for speciation, batch-reaction, one-dimensional transport, and inverse geochemical calculations. U. S. Geol. Surv. water-resour. Invest. Rep., 99–4259.
Pu, Q., Jiang, L., Xu, J., Chu, H., Xu, Y., and Zhang, Y. (2012). Evolution of pH and chemical composition of pore solution in carbonated concrete. Constr. Build. Mater. 28 (1), 519–524. doi:10.1016/j.conbuildmat.2011.09.006
Saaltink, M. W., Batlle, F., Ayora, C., Carrera, J., and Olivella, S. (2004). RETRASO, a code for modeling reactive transport in saturated and unsaturated porous media. Geol. Acta 2 (3), 235–251.
Samper, J., Mon, A., Montenegro, L., Cuevas, J., Turrero, M., Naves, A., et al. (2018). Coupled THCM model of a heating and hydration concrete-bentonite column test. Appl. Geochem. 94, 67–81. doi:10.1016/j.apgeochem.2018.05.007
Samson, E., and Marchand, J. (2007). Modeling the transport of ions in unsaturated cement-based materials. Comput. & Struct. 85 (23), 1740–1756. doi:10.1016/j.compstruc.2007.04.008
Šavija, B., and Luković, M. (2016). Carbonation of cement paste: understanding, challenges, and opportunities. Constr. Build. Mater. 117, 285–301. doi:10.1016/j.conbuildmat.2016.04.138
Schwotzer, M., Scherer, T., and Gerdes, A. (2010). Protective or damage promoting effect of calcium carbonate layers on the surface of cement based materials in aqueous environments. Cem. Concr. Res. 40 (9), 1410–1418. doi:10.1016/j.cemconres.2010.05.001
Trapote, A. (2015). Dissolution kinetics of C-S-H gel and durability of mortar. Universitat Politècnica de Catalunya UPC. Ph.D. thesis.
Villar, M., Martín, P., and Barcala, J. (2009). Caracterización del material de cobertera y el hormigón del C.A. El Cabril. Tech. Rep. CIEMAT.
Keywords: reactive transport, multiphase flow, concrete, Retraso-Code_Bright, numerical model
Citation: Chaparro MC and Saaltink MW (2025) Modelling reactive transport in unsaturated concrete under evaporation and condensation processes. Front. Built Environ. 11:1601568. doi: 10.3389/fbuil.2025.1601568
Received: 28 March 2025; Accepted: 07 May 2025;
Published: 22 May 2025.
Edited by:
Ivan P. Damians, Universitat Politècnica de Catalunya·BarcelonaTech (UPC), SpainReviewed by:
Anna Ramon Tarragona, Universitat Politecnica de Catalunya, SpainClaire Watson, Quintessa, United Kingdom
Copyright © 2025 Chaparro and Saaltink. This is an open-access article distributed under the terms of the Creative Commons Attribution License (CC BY). The use, distribution or reproduction in other forums is permitted, provided the original author(s) and the copyright owner(s) are credited and that the original publication in this journal is cited, in accordance with accepted academic practice. No use, distribution or reproduction is permitted which does not comply with these terms.
*Correspondence: Maarten W. Saaltink, bWFhcnRlbi5zYWFsdGlua0B1cGMuZWR1