 Anantaya Philuek1
 Panuwat Wisutwattanasak2Fareeda Watcharamaisakul2Chinnakrit Banyong3
 Anon Chantaratang4
 Thanapong Champahom5
 Vatanavongs Ratanavaraha1
 Sajjakaj Jomnonkwao1*
- 1School of Transportation Engineering, Institute of Engineering, Suranaree University of Technology, Nakhon Ratchasima, Thailand
- 2Institute of Research and Development, Suranaree University of Technology, Nakhon Ratchasima, Thailand
- 3Industrial and Logistics Management Engineering, Suranaree University of Technology, Nakhon Ratchasima, Thailand
- 4Logistics Technology Program, Faculty of Sciences and Liberal Arts, Rajamangala University of Technology Isan, Nakhon Ratchasima, Thailand
- 5Department of Management, Faculty of Business Administration, Rajamangala University of Technology Isan, Nakhon Ratchasima, Thailand
This investigation analyzes the determinants of transportation mode selection among elderly populations in Thailand through a comparative approach utilizing both traditional statistical modeling and contemporary machine learning techniques. The research compares the predictive effectiveness of the Multinomial Logistics Regression (MNL) model against advanced algorithmic approaches including Random Forest (RF), Extreme Gradient Boosting (XGBoost), and Categorical Boosting (CatBoost) in forecasting elderly travel behavior. The research utilizes a dataset comprising 1,000 elderly participants distributed across Thailand’s four geographical regions, with data collection conducted via structured questionnaires encompassing demographic factors, journey purposes, frequency of travel, expenditure considerations, and modal preferences. Results indicate that the Random Forest algorithms achieved the highest predictive performance on the comprehensive dataset (99.83% accuracy), while CatBoost demonstrated excellent performance on test data (94%). Shapley Additive Explanations (SHAP) analysis identified transportation expenditure, travel party size, temporal considerations, and economic status as the predominant variables influencing modal selection decisions, with lower-income elderly individuals showing a greater tendency for public transportation utilization relative to their more affluent counterparts. The MNL model revealed transportation cost as the most statistically significant predictor of public transit usage (p < 0.001), indicating that elderly individuals confronted with elevated travel expenses tend to substitute public transportation with private vehicle alternatives. Concurrently, machine learning methodologies demonstrated enhanced capacity to capture complex relationships between predictive factors and exhibited superior predictive accuracy compared to conventional MNL modeling. These findings offer important implications for the formulation of age-sensitive public transportation policies, particularly emphasizing cost reduction strategies and infrastructure enhancements designed to accommodate the specific mobility requirements of elderly populations.
1 Introduction
Demographic transitions represent inevitable future trends that require strategic preparation and adaptation. A particularly significant shift is the global aging phenomenon. As of 2019, the world population totaled 7,713 million and is projected to reach 9,700 million by 2050 (United Nations, 2019), with individuals aged 60 and above constituting 13% (1,000 million) of the total population. By 2050, the population over 65 years is anticipated to double from 2019 levels (estimated to exceed 1,500 million). Within the ASEAN region, four countries had transitioned to aging societies by 2019: Singapore, Thailand, Vietnam, and Malaysia. Thailand specifically is undergoing an accelerated demographic transformation with its elderly population doubling within a comparatively brief timeframe. This expanding elderly demographic is redirecting consumer demand toward goods and services that address the needs of older adults, creating substantial opportunities for emerging businesses in this growing market sector, including healthcare services, medical facilities, elderly care establishments, and the development of age-friendly transportation infrastructure (Office of the National Economic and Social Development Council, 2022).
In contemporary Thailand, many active elderly individuals maintain independent daily activities, such as social engagement, medical appointments, and recreational travel. Elderly mobility encompasses both utilization of public transportation systems and operation of private vehicles. This raises critical questions regarding Thailand’s emphasis on public transportation services. One notable advantage for elderly individuals is their increased leisure time availability compared to other age demographics, assuming adequate health status without mobility-limiting conditions. Thai elderly generally prefer accompanied travel rather than solo journeys; however, the existing public transportation infrastructure does not adequately accommodate or ensure safety for this population segment. Enhanced safety features in mass transit systems could potentially encourage more elderly individuals to travel independently. Assessment of Thailand’s current mass transit systems reveals insufficient accommodation for this demographic group that will constitute a significant proportion of the future population. This issue necessitates strategic planning and comprehensive support mechanisms to enhance quality of life for elderly citizens (Prasertsubpakij and Nitivattananon, 2012; Sukto, 2021).
Within the transportation context, elderly individuals require not only safety and accessibility in public transportation systems but also autonomy in their daily activities, which significantly influences their modal choices (Zhang et al., 2025). Developing responsive policies and designing age-appropriate transportation systems is therefore essential for enhancing quality of life among this population segment.
From the elderly perspective, current transportation systems demonstrate inadequate alignment with their specific requirements, resulting in diminished quality of life and restricted mobility options (Elias et al., 2013). Enhancing public transportation systems through improved service quality and safety protocols represents a crucial factor in attracting elderly ridership and providing suitable travel alternatives aligned with their lifestyle preferences and needs (Luiu et al., 2017). Factors influencing elderly travel mode selection include financial considerations (many elderly operate within limited budgets and evaluate expenses when selecting transportation services) (Luiu et al., 2017); temporal efficiency (certain elderly groups prioritize journey duration over cost factors, selecting more expedient and convenient travel options) (Holmes et al., 2024); accessibility (transportation systems accommodating specific elderly requirements, such as ramp access and wheelchair-compatible vehicles, influence service utilization) (Du et al., 2020); and service standards (cleanliness, safety measures, and service frequency impact elderly travel decisions) (Cheng L. et al., 2019).
2 Literature review
Table 1 synthesizes recent research on elderly travel behavior, examining influential factors, methodological approaches, regional variations, and existing research gaps. The literature review is organized into four subsections that highlight key developments in understanding elderly mobility patterns.
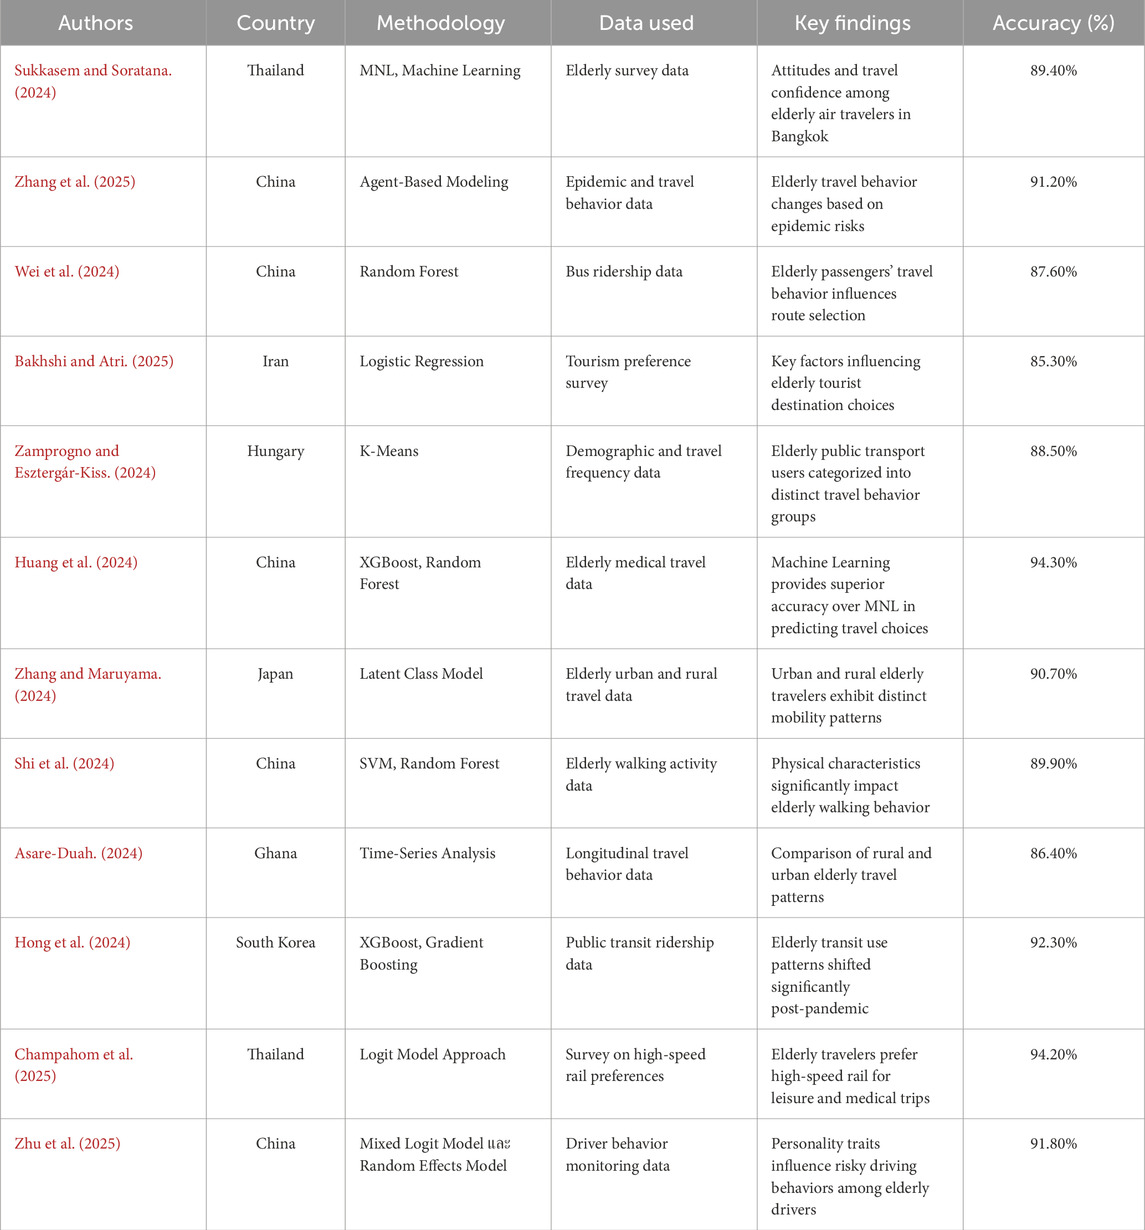
Table 1. Summary of related research.
2.1 Factors affecting elderly travel behavior
Several factors have been identified as significant influencers of elderly travel behavior across multiple studies. Sukkasem and Soratana. (2024) emphasized the importance of psychological factors, particularly attitudes and travel confidence, among elderly air travelers in Bangkok. Their findings connect with (Zhu et al., 2025), who discovered that personality traits significantly influence risky driving behaviors among elderly drivers in China. Both studies highlight the critical role of psychological dimensions in elderly mobility decisions.
Physical capabilities emerge as another crucial factor, as demonstrated by Shi et al. (2024), who found that physical characteristics significantly impact elderly walking behavior in China. This finding complements the work of (Champahom et al., 2025), who noted that comfort preferences strongly influence elderly travelers’ choice of high-speed rail for leisure and medical trips in Thailand.
External factors also shape elderly travel behavior. Zhang et al., 2025 revealed how epidemic risks alter elderly travel patterns in China, while Hong et al. (2024) documented significant shifts in elderly transit use following the pandemic in South Korea. These studies collectively demonstrate how health concerns and major disruptive events modify mobility patterns among older adults.
Travel purpose represents another significant determinant, with Champahom et al. (2025) noting distinct preferences for high-speed rail among elderly travelers for specific purposes like leisure and medical trips. This finding aligns with Wei et al. (2024), who observed how elderly passengers’ travel behaviors influence route selection for bus services in China.
2.2 Models used to analyze elderly travel behavior
Research methodologies for analyzing elderly travel behavior have evolved from traditional statistical approaches to advanced machine learning techniques. Traditional statistical models, such as the Multinomial Logit (MNL) model employed by Sukkasem and Soratana. (2024) and the Logit Model approach used by Champahom et al. (2025), have provided valuable insights into elderly travel preferences in Thailand. Similarly, Zhu et al. (2025) utilized a Mixed Logit Model combined with Random Effects to analyze driver behavior in China, while Bakhshi and Atri. (2025) applied Logistic Regression to study tourism preferences among elderly in Iran.
A notable trend in recent research is the increased application of machine learning techniques. Huang et al. (2024) directly compared XGBoost and Random Forest algorithms with traditional MNL models, demonstrating superior accuracy of machine learning methods (94.30%) in predicting elderly medical travel choices in China. This methodological advancement connects with Hong et al. (2024), who similarly employed XGBoost and Gradient Boosting to analyze public transit ridership data in South Korea with high accuracy (92.30%).
Other researchers have explored specialized analytical approaches. Zamprogno and Esztergár-Kiss. (2024) utilized K-Means clustering to categorize elderly public transport users in Hungary, while Zhang et al. (2024) applied a Latent Class Model to distinguish between urban and rural elderly travel patterns in Japan. These diverse methodological approaches reflect the complexity of elderly travel behavior and the need for sophisticated analytical tools.
2.3 Regional studies
Research on elderly travel behavior reveals significant regional variations across different countries. In Asia, several studies have provided valuable insights into elderly mobility patterns. In Thailand, Sukkasem and Soratana. (2024) examined elderly air travelers in Bangkok, while Champahom et al. (2025) focused on high-speed rail preferences among Thai elderly. These Thailand-based studies connect with research from neighboring countries, such as China, where Zhang et al., 2025, Wei et al. (2024), Shi et al. (2024) have examined various aspects of elderly mobility patterns, from epidemic-related behavior changes to walking activities and bus route preferences.
The Japanese context has been explored by Zhang et al. (2025), who identified distinct mobility patterns between urban and rural elderly travelers. This connects with findings from South Korea, where Hong et al. (2024) documented post-pandemic shifts in elderly transit use patterns. Together, these East Asian studies reveal both similarities and differences in elderly travel behavior across the region.
Beyond Asia, research in other regions offers additional perspectives. In Europe, Zamprogno and Esztergár-Kiss. (2024) categorized elderly public transport users in Hungary into distinct travel behavior groups. In the Middle East, Bakhshi and Atri. (2025) examined elderly tourism preferences in Iran. In Africa, Asare-Duah. (2024) compared rural and urban elderly travel patterns in Ghana, highlighting the importance of geographical context in mobility behavior.
These regional studies collectively demonstrate that while certain factors universally affect elderly travel behavior, regional contexts significantly shape specific mobility patterns and preferences, necessitating locally tailored transportation solutions.
2.4 Research gaps and current study
Despite the growing body of research on elderly travel behavior, several important gaps remain. First, while machine learning approaches have demonstrated superior predictive accuracy in some contexts, as shown by Huang et al. (2024), Hong et al. (2024), comprehensive comparisons between multiple machine learning algorithms and traditional statistical models remain limited, particularly in the context of elderly travel mode choice. Second, most studies have focused on a single methodological approach rather than comparing multiple techniques. For instance, Wei et al. (2024) used only Random Forest, while Champahom et al. (2025) employed only a Logit Model approach. This limits understanding of which methodological approaches might be most effective for analyzing different aspects of elderly travel behavior. Third, while studies have been conducted across various regions, comparative studies within Southeast Asia remain limited. Thailand’s rapidly aging population makes it a particularly important context for understanding elderly travel behavior, yet comprehensive studies examining multiple factors and utilizing comparative methodological approaches are scarce.
The current study addresses these gaps by comparing the MNL model with three advanced machine learning techniques (XGBoost, Random Forest, and CatBoost) using elderly travel behavior survey data from Thailand. This research builds upon previous Thailand-based studies by Sukkasem and Soratana. (2024), Champahom et al. (2025) while adopting the comparative methodological approach demonstrated by Huang et al. (2024). By identifying which factors most significantly influence elderly travel mode choices and determining which models provide the most accurate predictions, this study aims to contribute valuable insights for developing age-friendly transportation policies in Thailand and similar contexts.
3 Materials and methods
3.1 Research framework
The investigation commenced with an extensive review of existing literature to identify key determinants of travel mode selection among elderly populations and to establish appropriate methodological approaches. Survey instruments were deployed to capture demographic characteristics, economic factors, and travel patterns of elderly respondents (Train, 2009). The acquired data underwent systematic organization and classification based on fundamental travel attributes.
For the analysis of factors influencing travel mode preferences, the study implemented a dual methodological approach combining conventional statistical techniques with contemporary machine learning algorithms. The Multinomial Logit (MNL) framework was employed to estimate selection probabilities across various transportation modes (Ben-Akiva and Lerman, 1985; Train, 2009). Concurrently, three advanced machine learning approaches—Random Forest (RF), Extreme Gradient Boosting (XGBoost), and CatBoost—were utilized to enhance predictive capabilities (Breiman, 2001; Prokhorenkova et al., 2018; Tianqi and Carlos, 2016).
Model effectiveness was evaluated through comparative analysis of performance metrics including Accuracy, Precision, Recall, and F1-score to determine optimal analytical approaches. Further examination employed SHAP (Shapley Additive Explanations) methodology to elucidate the relative importance of variables affecting transportation decisions among elderly individuals (Powers, 2020).
The concluding phase involved comprehensive interpretation and discussion of findings, with particular emphasis on the highest-performing analytical model and identification of critical factors shaping elderly mobility patterns (Zhang et al., 2023). This analysis informed the development of policy recommendations designed to enhance transportation systems responsive to the specific needs of aging populations (Du et al., 2020; Luiu et al., 2017).
This research addresses a notable gap in existing scholarship by examining elderly travel behavior through multiple analytical lenses, comparing traditional statistical frameworks with machine learning approaches to generate insights for transportation policy development. The investigation aims to overcome limitations of previous studies by focusing specifically on infrastructure and transportation policy development appropriate for Thailand’s elderly population and offering concrete recommendations to facilitate mobility among older adults.
3.2 Questionnaire development and data collection
3.2.1 Questionnaire development
The study utilized a Revealed Preference (RP) survey instrument (Creswell and Creswell, 2017) to explore transportation mode preferences among Thailand’s elderly population, facilitating analysis through both Multinomial Logit (MNL) modeling and advanced machine learning techniques including Random Forest (RF), Extreme Gradient Boosting (XGBoost), and CatBoost. The questionnaire design prioritized the collection of quantitative information amenable to robust statistical analysis. The survey structure incorporated a combination of fixed-response and open-ended inquiries (Revealed Preference - RP Survey) and was structured around two primary components:
3.2.1.1 Section 1: General information and travel behavior.
This section collected demographic and travel behavior data, including gender, age, income, health conditions, physical impairments, marital status, household composition, education level, occupation, residential area type (urban/suburban), vehicle ownership, frequency of public transport use, and trip purposes. The collected data served multiple purposes: (1) to establish a preliminary understanding of the respondents’ demographic characteristics; (2) to assess the representativeness and distribution of the sample; and (3) to provide essential control variables and contextual background for subsequent descriptive statistics and predictive modeling processes.
3.2.1.2 Section 2: Travel diary data.
This section recorded detailed trip-level information based on respondents’ most recent travel activities. It included the travel mode used, trip purpose, origin and destination points, distance traveled, travel time, number of companions, travel cost, and key factors influencing the travel mode choice (e.g., cost, convenience, time, safety, comfort). These two sections provided the necessary empirical data to investigate the actual travel mode choices and behaviors of elderly travelers. The information collected was directly used to build the variables for the descriptive analysis and for the predictive modeling processes presented in this study. Figure 1 shows a sample of a travel diary section.
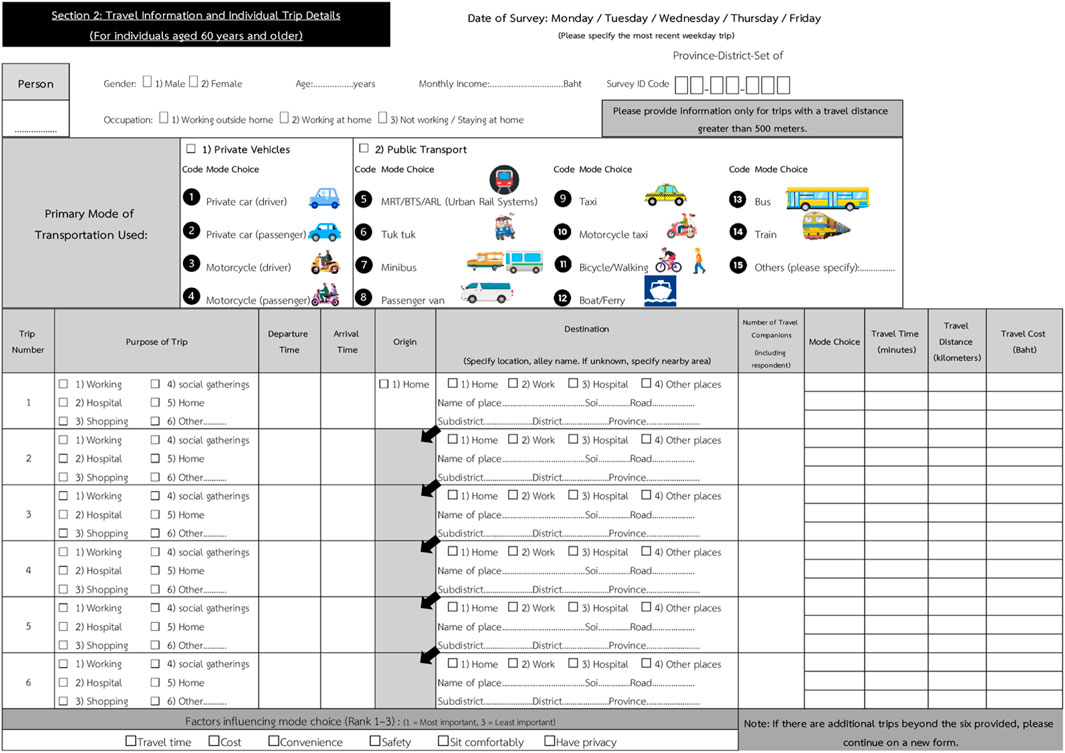
Figure 1. Sample of travel diary section.
3.2.2 Data collection
1. Sample Composition and Size: The research population encompassed individuals aged 60 and above residing across Thailand’s four principal geographical regions:
• Northern Thailand: Chiang Mai, Chiang Rai, Sukhothai, Phitsanulok
• Northeastern Thailand: Nakhon Ratchasima, Khon Kaen, Ubon Ratchathani, Udon Thani
• Central Thailand: Chonburi, Nakhon Sawan, Ayutthaya, Prachuap Khiri Khan
• Southern Thailand: Nakhon Si Thammarat, Songkhla, Surat Thani, Phuket
The sampling methodology employed stratified random selection to establish a total sample of 1,000 participants, with equal regional distribution of 250 individuals per geographic area.
2. Survey Implementation: Data acquisition occurred between January and March 2024 at locations commonly frequented by elderly individuals, including marketplaces, healthcare facilities, and senior service centers. Paper-based questionnaires were selected to accommodate participants with limited technological proficiency. In-person interviews were conducted by research personnel and trained assistants. Quality enhancement measures included linguistically accessible questionnaire design calibrated to elderly comprehension levels and provision of assistance for respondents with literacy limitations. A preliminary study involving 50 participants preceded the main data collection to refine the survey instrument.
3. Data Validation Procedures: Data integrity was verified through questionnaire validity and reliability assessment (Creswell and Creswell, 2017), including application of Cronbach’s Alpha coefficients. Partial responses were excluded from analysis, and atypical response patterns underwent verification. Random sampling of completed questionnaires was conducted to identify potential recording inaccuracies. The data management protocol incorporated digital transcription to facilitate analysis and encryption procedures to safeguard participant confidentiality.
3.2.3 Description of variables
The explanatory variables utilized in the modeling process were selected based on their relevance to elderly mobility behaviors and their availability in the collected dataset. These variables included travel cost (THB), travel time (minutes), travel distance (kilometers), household income (monthly, THB), vehicle ownership (private vehicle possession), gender, age, and the presence of mobility limitations.
Behavioral factors such as comfort, convenience, and safety were indirectly captured through these variables. Specifically, access time reflects travel convenience; travel cost reflects financial comfort and affordability; trust in public transport services reflects perceived safety; and travel time reflects both the perceived burden and overall ease of the journey. By integrating these variables into the modeling framework, the study accounted for critical behavioral dimensions influencing travel mode selection among elderly individuals.
3.3 Methodological comparison of statistical and machine learning approaches
This investigation employs a comparative analytical framework to evaluate the relative efficacy of traditional statistical modeling (Multinomial Logit) against contemporary algorithmic approaches (Random Forest, Extreme Gradient Boosting, and Categorical Boosting) in elucidating determinants of transportation mode selection among elderly populations. The methodological comparison facilitates comprehensive assessment of predictive performance across diverse analytical paradigms while identifying complementary insights derived from contrasting analytical techniques (Karlaftis and Vlahogianni, 2011). Comparative Analysis of MNL and machine learning Approaches are summarized in Table 2.
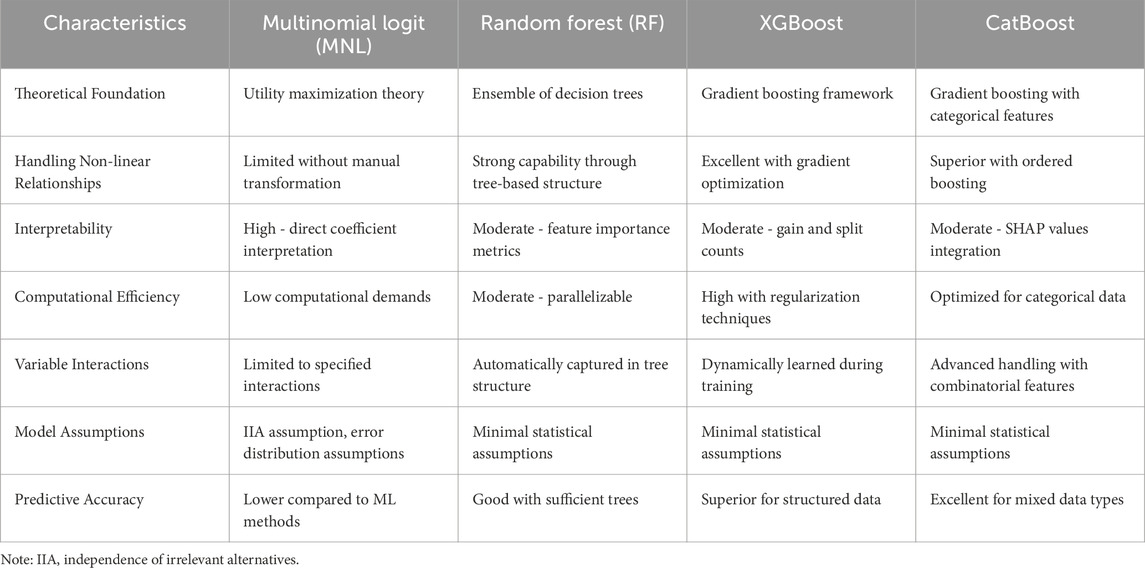
Table 2. Comparative analysis of MNL and machine learning approaches.
3.3.1 Multinomial Logit (MNL) model
The Multinomial Logit model represents a cornerstone of discrete choice analysis in transportation research, grounded in random utility maximization theory (McFadden, 1973). This approach posits that individuals select transportation alternatives that maximize their perceived utility, with utility functions comprising both observable and unobservable components (Train, 2009). The MNL model calculates the probability of an individual selecting a particular transportation mode from a set of available alternatives based on the relative utility of each option. In this study, the implementation of MNL involves specifying utility functions for each transportation mode available to elderly travelers, incorporating variables such as travel cost, travel time, income level, physical limitations, and trip purpose. Parameter estimation employs maximum likelihood techniques to identify coefficient values that maximize the probability of observed mode choices within the dataset (Train, 2009).
The MNL model offers distinct advantages in interpretability and theoretical foundation, as coefficients directly represent the influence of each variable on travel mode selection. However, it is constrained by several assumptions, most notably the Independence of Irrelevant Alternatives (IIA) property. This assumption stipulates that the ratio of selection probabilities between two alternatives remains unaffected by the introduction or modification of additional options—a condition that may be violated in complex transportation choice scenarios (Ben-Akiva and Lerman, 1985; McFadden, 1973).
3.3.2 Random Forest (RF)
Random Forest represents an ensemble learning method that generates multiple decision trees and aggregates their predictions to enhance model robustness and accuracy (Breiman, 2001). The algorithm constructs individual trees using bootstrap samples from the training data and incorporates random feature selection at each node, thereby reducing correlation between trees and mitigating overfitting risks (Karlaftis and Vlahogianni, 2011).
In the context of elderly travel mode choice, the Random Forest implementation in this study incorporates all relevant predictors including demographic variables, trip characteristics, and contextual factors. The algorithm autonomously identifies complex, non-linear relationships between predictor variables and transportation outcomes without requiring explicit specification of interaction terms (Hagenauer and Helbich, 2017).
Random Forest offers several advantages in transportation analysis, including robust performance with high-dimensional data, automatic handling of variable interactions, and built-in measures of variable importance. The method provides relative feature importance metrics calculated through mean decrease impurity or mean decrease accuracy, enabling identification of critical determinants in elderly travel behavior (Cheng L. et al., 2019; Ali et al., 2022; Yan et al., 2020). However, the approach presents limitations in computational efficiency for very large datasets and may be less interpretable than parametric models like MNL (Karlaftis and Vlahogianni, 2011).
3.3.3 Extreme Gradient Boosting (XGBoost)
Extreme Gradient Boosting (XGBoost) represents an advanced implementation of the gradient boosting framework that sequentially constructs an ensemble of weak learners to minimize a differentiable loss function. Unlike Random Forest, which builds independent trees in parallel, XGBoost develops trees sequentially, with each new tree correcting errors made by the existing ensemble (Chen and Guestrin, 2016).
In application to elderly travel mode choice, XGBoost implementation involves calibrating multiple hyperparameters including learning rate, maximum tree depth, subsample ratio, and regularization parameters to optimize predictive performance. The algorithm’s architecture facilitates handling of mixed data types prevalent in transportation research, including categorical variables (e.g., trip purpose, gender) and continuous measures (e.g., travel time, income) (Wang and Ross, 2018; Huang et al., 2024; Lee, 2022).
XGBoost offers superior predictive accuracy for structured data compared to traditional methods, incorporating built-in mechanisms for handling missing values, and providing efficient computational performance through parallelization and cache optimization. The method’s limitations include potential overfitting with inappropriate hyperparameter selection and reduced interpretability relative to parametric approaches, although feature importance metrics and SHAP values can partially address interpretational challenges (Chen and Guestrin, 2016; Lundberg and Su-In, 2017).
3.3.4 Categorical Boosting (CatBoost)
Categorical Boosting (CatBoost) represents a gradient boosting implementation specifically optimized for efficient processing of categorical features, a prevalent characteristic in transportation data. The algorithm addresses two critical challenges in gradient boosting: prediction shift caused by target leakage in classical gradient boosting and effective handling of categorical variables without extensive preprocessing (Dorogush, Ershov, and Gulin, 2018; Prokhorenkova et al., 2018).
In the context of elderly travel mode choice, CatBoost implementation benefits from automatic handling of categorical variables such as gender, education level, trip purpose, and transportation alternatives without requiring preliminary encoding transformations. The algorithm’s architecture is particularly suited to the mixed data types characteristic of transportation research (Banyong et al., 2024; Banyong et al., 2025).
CatBoost offers distinct advantages including superior performance with categorical features, built-in mechanisms to reduce overfitting, and automatic handling of missing values. The method provides integrated interpretability tools including feature importance metrics and native compatibility with SHAP (Shapley Additive Explanations) for explaining model predictions. Limitations include relatively recent adoption in transportation research compared to established methods and computational demands that may exceed those of traditional approaches for very large datasets (Prokhorenkova et al., 2018).
4 Results
4.1 Descriptive analysis
4.1.1 Demographic characteristics of the sample
Table 3 presents the demographic characteristics of the 1,000 elderly respondents in this study. The sample comprised 54.3% females and 45.7% males, with the majority (78.5%) aged between 60–69 years, followed by 19.9% aged 70–79 years, and only 1.6% over 80 years. This age distribution reflects Thailand’s current elderly demographic profile, with a higher proportion of “young elderly” (60–69 years) compared to older age groups. Most respondents were married (69.7%), with 23.5% widowed, divorced, or separated, and 6.8% single. The vast majority (94.9%) lived with family or caregivers, which is consistent with traditional Thai family structures where elderly typically reside with their children or relatives, while only 5.1% lived alone.
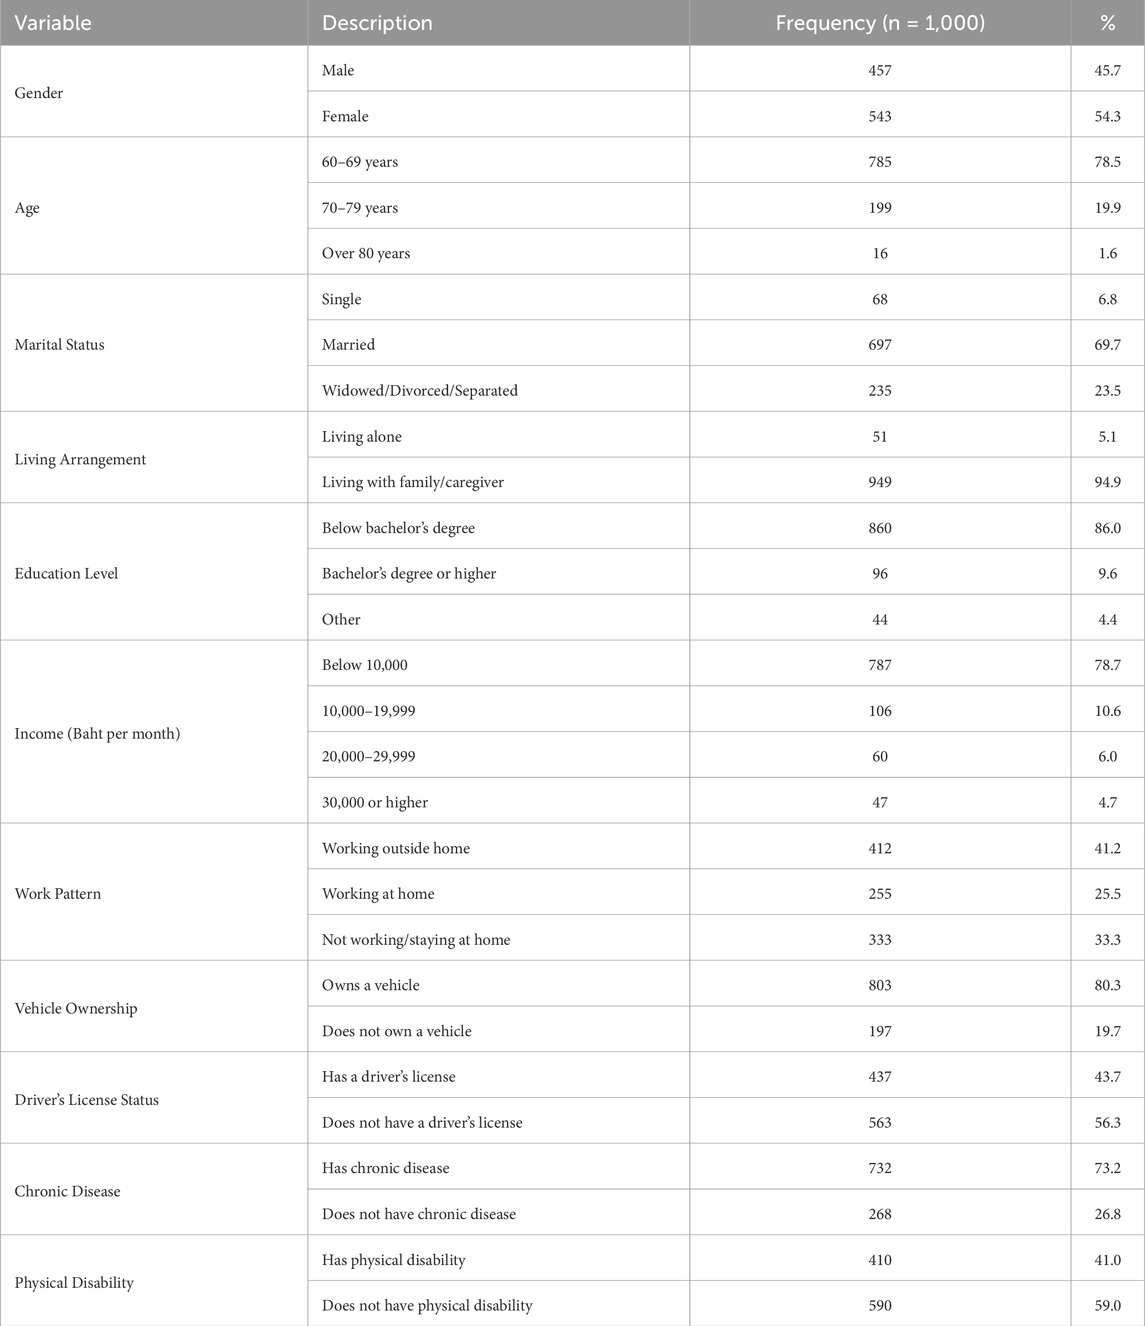
Table 3. General information of sample.
Regarding education, 86% of respondents had below a bachelor’s degree, 9.6% had a bachelor’s degree or higher, and 4.4% had other educational qualifications. This educational profile reflects the limited educational opportunities available to the current elderly generation in Thailand, particularly in rural areas. The income distribution showed that most respondents (78.7%) had a monthly income below 10,000 Baht, while 10.6% earned between 10,000–19,999 Baht, 6% earned between 20,000–29,999 Baht, and 4.7% earned 30,000 Baht or higher. This income distribution highlights the economic vulnerability of many elderly in Thailand, with the majority living on limited incomes below the national average.
In terms of work patterns, 41.2% worked outside the home, 25.5% worked at home, and 33.3% were not working or staying at home. The high percentage of elderly still engaged in work (66.7% total) reflects both economic necessity and cultural factors in Thailand, where many elderly continue working well past traditional retirement age. Vehicle ownership was high (80.3%), though only 43.7% held a driver’s license, indicating that while many households have access to private vehicles, the elderly themselves may not be the primary drivers. The majority of respondents (73.2%) reported having at least one chronic disease, and 41% reported having some form of physical disability, highlighting the health challenges facing this population and their potential impact on mobility and transportation choices.
4.1.2 Elderly travel mode patterns
As shown in Table 4, the most frequently used travel mode by the elderly was the bus (48.4%), followed by paratransit (23.6%), private cars (20.0%), and trains (7.9%). This indicates that public transportation (buses and trains) was the preferred choice for the majority of elderly travelers, accounting for 56.3% of all travel. The high usage of bus services reflects their widespread availability throughout Thailand, including in rural areas, as well as their relatively low cost, making them accessible to elderly on limited incomes. The substantial use of paratransit (including songtheaws, motorcycle taxis, and tuk-tuks) highlights the importance of flexible, on-demand transportation options that can provide door-to-door service for elderly with limited mobility.
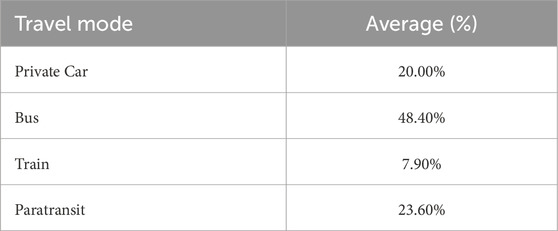
Table 4. Most frequently used travel modes.
The relatively low usage of private cars (20%) despite high household vehicle ownership (80.3%) suggests that many elderly rely on family members for private vehicle transportation rather than driving themselves. This is consistent with the lower proportion of elderly holding driver’s licenses (43.7%) and may also reflect concerns about safety, comfort, and physical limitations that prevent some elderly from driving. The lowest usage was for train services (7.9%), likely due to the limited rail network in Thailand, which primarily connects major cities and does not serve many rural or suburban areas where elderly may reside.
4.1.3 Analysis of factors affecting travel behavior
Table 5 provides detailed information about elderly public transportation usage patterns. Regarding frequency of public transportation use, 36.1% were frequent users (weekly or more), 34.7% were occasional users (monthly), 28.5% were infrequent users (less than once per month), and only 0.7% never used public transportation. This high overall usage rate (99.3% using public transportation at least occasionally) demonstrates the critical importance of public transportation systems for elderly mobility in Thailand.
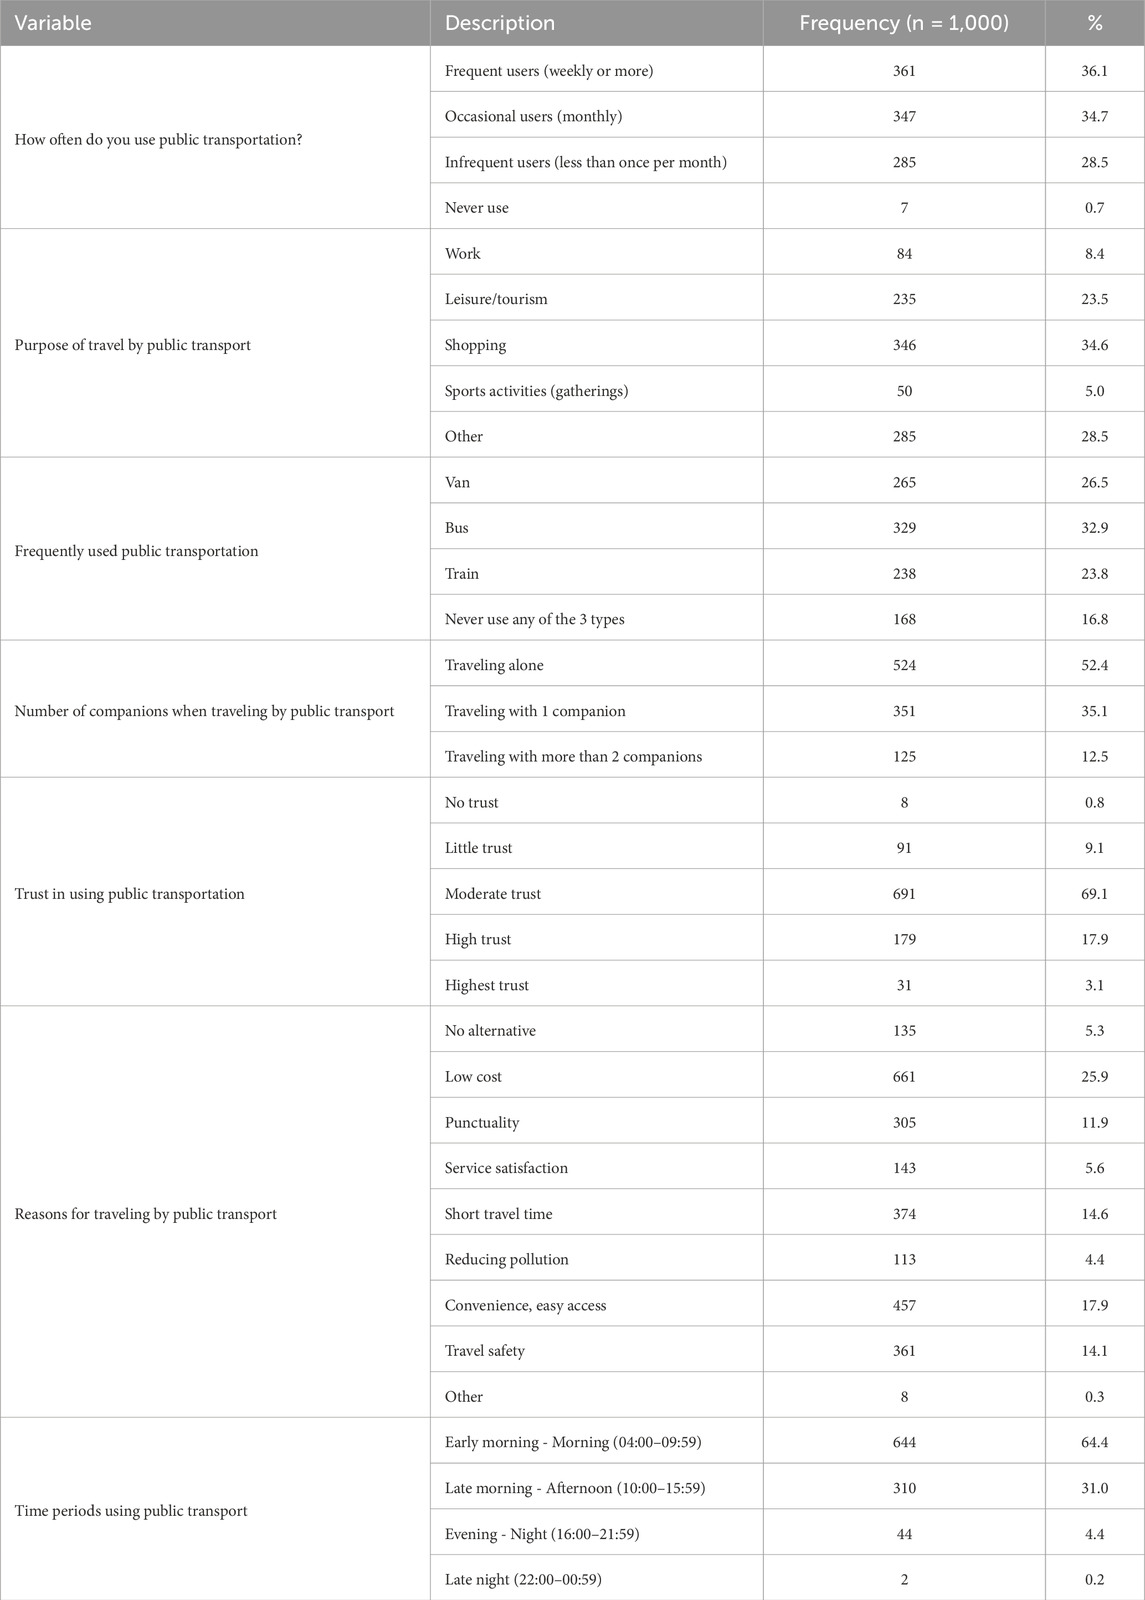
Table 5. Public transportation travel behavior of respondents.
The primary purposes for using public transportation included shopping (34.6%), followed by “other” purposes (28.5%), leisure/tourism (23.5%), work (8.4%), and sports activities (5%). This distribution reflects the daily activities and priorities of elderly, with essential activities like shopping dominating transportation needs. The relatively low proportion of work-related travel (8.4%) is consistent with the retirement status of many respondents, though it contrasts somewhat with the 66.7% who reported some form of work activity, suggesting that many may work from or near their homes.
The most frequently used public transportation types were buses (32.9%), vans (26.5%), and trains (23.8%), while 16.8% never used any of these three types. The higher usage of buses compared to vans likely reflects their lower cost and more extensive route network, while vans may be preferred for specific routes or for their higher comfort level and faster service. The relatively high train usage reported here (23.8%) compared to the overall mode share (7.9%) suggests that while fewer elderly use trains as their primary mode, a significant number use them occasionally for specific trips.
Most elderly traveled alone (52.4%), while 35.1% traveled with one companion, and 12.5% traveled with more than two companions. This finding challenges the common assumption that all elderly prefer or require accompanied travel and highlights the desire for independence among many Thai elderly. However, the substantial proportion traveling with companions (47.6% total) underscores the importance of social support and assistance for many elderly travelers.
Regarding trust in public transportation, the majority expressed moderate trust (69.1%), followed by high trust (17.9%), little trust (9.1%), highest trust (3.1%), and no trust (0.8%). This generally positive perception (90.1% expressing moderate to highest trust) suggests that safety and reliability concerns are not major barriers to public transportation use for most elderly, though there remains room for improvement to increase trust levels.
The most important reasons for choosing public transportation were low cost (25.9%), convenience and easy access (17.9%), short travel time (14.6%), travel safety (14.1%), punctuality (11.9%), no alternative (5.3%), service satisfaction (5.6%), reducing pollution (4.4%), and other reasons (0.3%). This ranking highlights the critical importance of economic factors (cost) as well as practical considerations (convenience, travel time) in elderly transportation decisions. The relatively low percentage citing “no alternative” (5.3%) suggests that most elderly use public transportation by choice rather than necessity, despite having other options available.
Most elderly used public transportation during early morning to morning hours (64.4%), followed by late morning to afternoon (31%), evening to night (4.4%), and very few during late night (0.2%). This temporal pattern aligns with safety concerns and lifestyle preferences of elderly, who typically avoid traveling after dark and prefer to conduct activities during daylight hours. The concentration of travel in morning hours may also reflect efforts to avoid peak congestion periods and higher temperatures later in the day.
4.1.4 Descriptive statistics of key variables
Table 6 presents descriptive statistics for key variables in the analysis. The average age of respondents was 66.08 years (SD = 4.90), reflecting the predominance of “young elderly” in the sample. The average travel time was 28.25 min per trip (SD = 28.46), indicating a wide variation in trip durations. The relatively high standard deviation suggests that while many elderly make short trips, a substantial number undertake longer journeys. Similarly, the average travel distance was 19.65 km (SD = 23.15), with considerable variation around this mean.
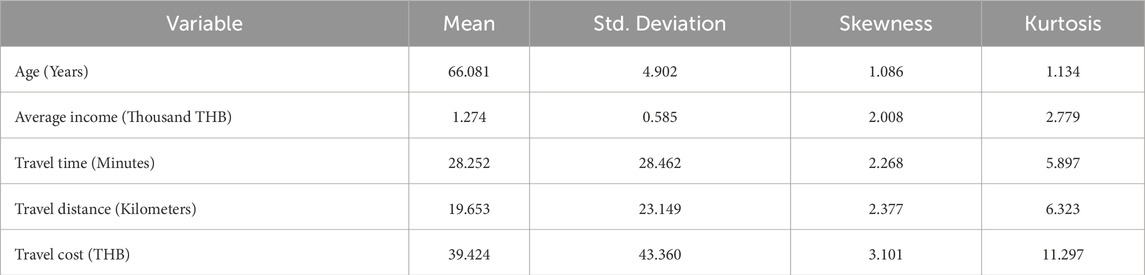
Table 6. Descriptive statistics for MNL.
The average travel cost was 39.42 Baht per trip (SD = 43.36), which is relatively modest given the average travel distance. This reflects the affordability of public transportation in Thailand, particularly government-subsidized services. The high standard deviation indicates substantial variation in transportation costs, likely reflecting differences in travel modes and distances.
Variables with high positive skewness included travel distance (2.377) and travel costs (3.101), indicating rightward data dispersion with some values significantly higher than the average. This pattern suggests that while most elderly trips are relatively short and inexpensive, a small proportion of trips involve substantially longer distances and higher costs. Variables with high kurtosis, such as work travel (21.859) and travel for social gatherings (16.964), indicate concentrated distributions where most values cluster tightly around the mean with few outliers.
Travel purpose variables showed that traveling home was the most common (mean = 0.469), followed by shopping (mean = 0.207), hospital visits (mean = 0.125), and visiting relatives or other places (mean = 0.116). Work-related travel (mean = 0.037) and social gatherings (mean = 0.046) were less common. These patterns reflect the daily activities and priorities of elderly, with essential activities like returning home and shopping dominating travel purposes.
4.2 Multinomial Logit model results
The Multinomial Logit (MNL) model results are presented in Table 7, with private car serving as the reference category. The model identified several significant factors affecting elderly travel mode choices, providing insights into the decision-making processes of elderly travelers.
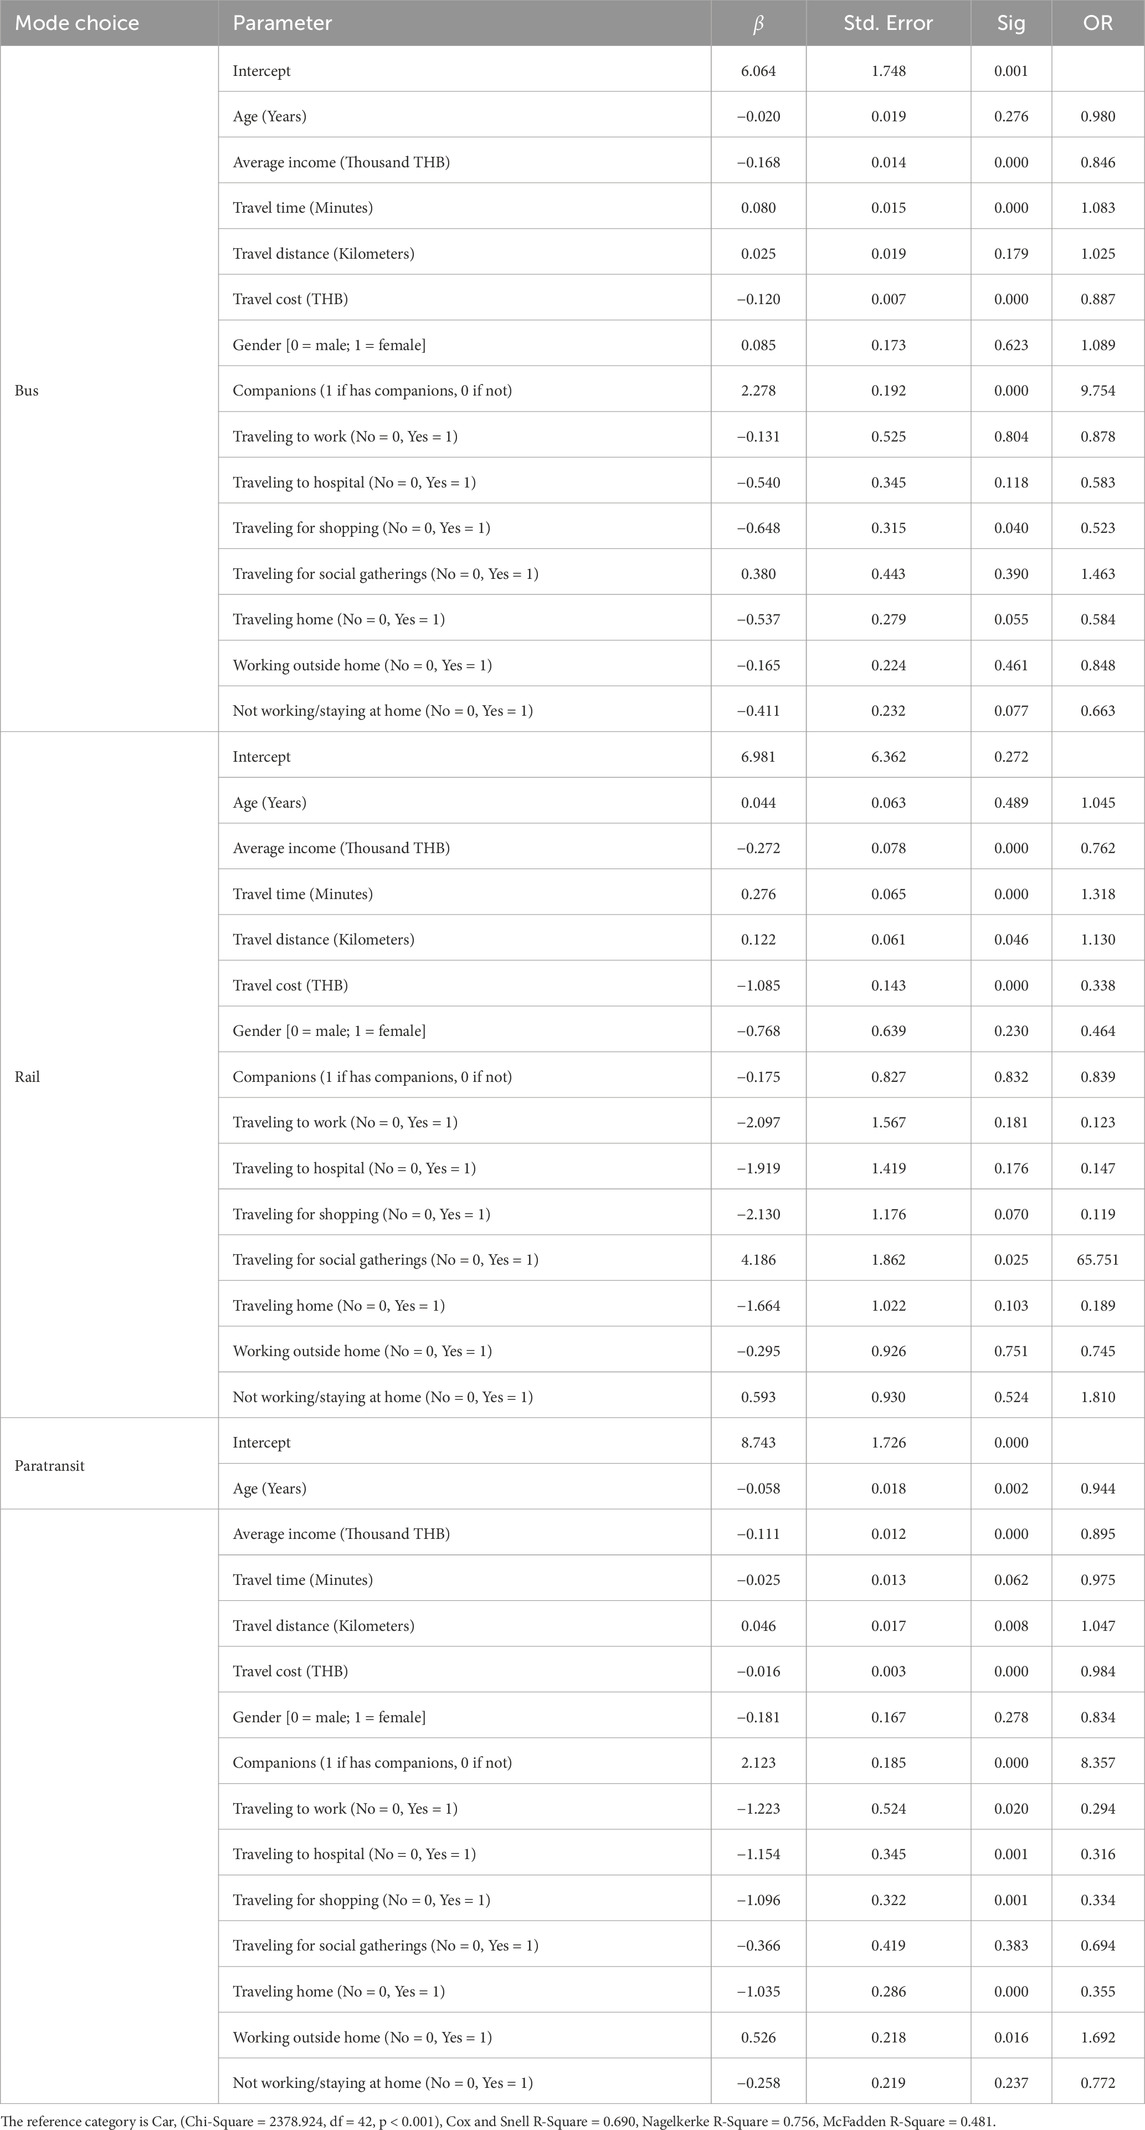
Table 7. Parameter estimates of MNL.
4.2.1 Factors affecting bus travel choice
For bus travel, the significant factors (p < 0.05) included average income (β = −0.168, p < 0.001), travel time (β = 0.080, p < 0.001), travel cost (β = -0.120, p < 0.001), having companions (β = 2.278, p < 0.001), and shopping as travel purpose (β = -0.648, p = 0.040).
The negative coefficient for income (β = −0.168) suggests that as income increases, elderly are less likely to choose bus transportation compared to private cars. For each unit increase in income category, the odds of choosing bus transportation decrease by 15.4% (OR = 0.846). This finding is consistent with economic theory, which suggests that higher-income individuals tend to value comfort and convenience more highly and can better afford private transportation.
The positive coefficient for travel time (β = 0.080) indicates a higher propensity to use buses for longer trips. For each additional minute of travel time, the odds of choosing bus transportation increase by 8.3% (OR = 1.083). This somewhat counterintuitive finding may reflect the relatively low cost of bus travel for longer distances compared to private vehicles or other modes.
The negative coefficient for travel cost (β = −0.120) confirms the importance of economic considerations in mode choice. For each additional baht in travel cost, the odds of choosing bus transportation decrease by 11.3% (OR = 0.887), indicating high price sensitivity among elderly bus users.
Having companions dramatically increases the likelihood of choosing buses (β = 2.278, OR = 9.754), suggesting that bus travel is strongly preferred for group travel. This may reflect both practical considerations (sharing costs) and social factors (companionship during the journey).
Shopping as a travel purpose reduced the likelihood of choosing bus transportation (β = -0.648, OR = 0.523). This may reflect the practical challenges of carrying shopping items on buses or the convenience of private vehicles for shopping trips that may involve multiple stops.
4.2.2 Factors affecting rail travel choice
For rail travel, significant factors included average income (β = −0.272, p < 0.001), travel time (β = 0.276, p < 0.001), travel distance (β = 0.122, p = 0.046), travel cost (β = −1.085, p < 0.001), and sports activities as travel purpose (β = 4.186, p = 0.025).
The strongly negative coefficient for income (β = -0.272) indicates that lower-income elderly are more likely to choose rail travel compared to private cars, with each unit increase in income category decreasing the odds of rail travel by 23.8% (OR = 0.762).
Travel time showed a strong positive effect (β = 0.276), with each additional minute increasing the odds of choosing rail by 31.8% (OR = 1.318). Similarly, travel distance showed a positive effect (β = 0.122), with each additional kilometer increasing the odds by 13% (OR = 1.130). These findings suggest that rail is particularly preferred for longer journeys, where its speed and comfort advantages may outweigh other considerations.
The strongly negative coefficient for travel cost (β = −1.085) indicates that cost is a particularly important factor in rail mode choice, with higher costs substantially reducing the likelihood of choosing rail transportation. For each additional baht, the odds decrease by 66.2% (OR = 0.338), suggesting extremely high price sensitivity for rail travel.
Interestingly, sports activities as a travel purpose dramatically increased the likelihood of choosing rail (β = 4.186, OR = 65.751). This strong effect may reflect the location of sports venues near rail stations or scheduled group activities that utilize rail transportation.
4.2.3 Factors affecting paratransit travel choice
For paratransit, significant factors included age (β = −0.058, p = 0.002), average income (β = −0.111, p < 0.001), travel distance (β = 0.046, p = 0.008), travel cost (β = −0.016, p < 0.001), having companions (β = 2.123, p < 0.001), several travel purposes including work (β = −1.223, p = 0.020), leisure/tourism (β = −1.154, p = 0.001), shopping (β = −1.096, p = 0.001), and return home (β = −1.035, p < 0.001), and working outside home (β = 0.526, p = 0.016).
The negative coefficient for age (β = −0.058) suggests that older elderly are less likely to use paratransit, with each additional year of age decreasing the odds by 5.6% (OR = 0.944). This may reflect increased physical limitations or safety concerns among older individuals that make paratransit less accessible or desirable.
Income showed a negative effect (β = −0.111), with each unit increase in income category decreasing the odds by 10.5% (OR = 0.895). Travel distance had a positive effect (β = 0.046), with each additional kilometer increasing the odds by 4.7% (OR = 1.047), suggesting paratransit is preferred for somewhat longer trips, perhaps due to its flexibility and door-to-door service.
Travel cost had a negative but relatively modest effect (β = −0.016), with each additional baht decreasing the odds by only 1.6% (OR = 0.984). This lower price sensitivity compared to bus and rail may reflect the perceived value of the convenience and flexibility offered by paratransit.
Having companions significantly increased the likelihood of using paratransit (β = 2.123, OR = 8.357), similar to the effect observed for bus travel. This strong effect suggests that paratransit is particularly valued for group travel, perhaps due to the ability to share costs and the convenience of door-to-door service for groups.
All specific travel purposes (work, leisure/tourism, shopping, return home) showed negative effects compared to the reference category (“other purposes”), suggesting that paratransit is particularly preferred for miscellaneous trips not covered by the main categories. Working outside the home increased the likelihood of using paratransit (β = 0.526, OR = 1.692), possibly due to its flexibility for commuting to workplaces not well-served by regular public transportation.
4.3 Multinomial Logit model results
4.3.1 Comparison on test dataset
Table 8 presents the performance metrics of the three machine learning models on the test dataset (30% of the total data). CatBoost achieved the highest accuracy at 94%, followed by Random Forest (93%) and XGBoost (91%). This high performance across all three models indicates that machine learning approaches are well-suited to predicting elderly travel mode choices.

Table 8. Comparison Results from Test Data (30% of data).
In terms of macro precision, Random Forest performed best (0.96), followed by CatBoost (0.95) and XGBoost (0.93). Precision measures the proportion of positive identifications that were actually correct, suggesting that Random Forest had the lowest rate of false positives. For macro recall, CatBoost outperformed the other models with a value of 0.95, compared to 0.93 for Random Forest and 0.92 for XGBoost. Recall measures the proportion of actual positives that were correctly identified, indicating that CatBoost was better at avoiding false negatives.
The macro F1-score, which represents the harmonic mean of precision and recall, was highest for CatBoost (0.95), followed by Random Forest (0.94) and XGBoost (0.92). This balanced measure suggests that CatBoost provided the best overall performance on the test dataset, effectively balancing the trade-off between precision and recall.
4.3.2 Comparison on full dataset
The performance metrics on the full dataset (100% of the data) are presented in Table 9. Interestingly, Random Forest performed best on the full dataset with an accuracy of 99.83%, followed by CatBoost (99.83%) and XGBoost (98.73%). This contrasts with the results on the test dataset, where CatBoost performed best. The difference may reflect Random Forest’s ability to better capture patterns in larger datasets or specific characteristics of the training-test split.
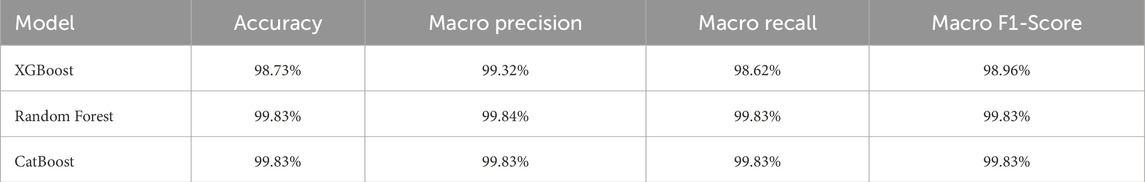
Table 9. Comparison Results from Real Data (100% of data).
Random Forest also achieved the highest macro precision (99.84%), macro recall (99.83%), and macro F1-score (99.83%) on the full dataset. CatBoost performed similarly to Random Forest across all metrics, while XGBoost showed slightly lower values. The high performance of all three models on the full dataset confirms their effectiveness for elderly travel mode prediction and suggests that they can generalize well to new data.
4.3.3 Confusion matrix analysis
Table 10 presents the confusion matrix results for all models, providing a detailed breakdown of correct and incorrect classifications for each travel mode. Among the machine learning models, XGBoost demonstrated the highest accuracy, correctly classifying 99.26% of car users, 98.88% of bus users, 100% of rail users, and 95.71% of paratransit users. Random Forest followed closely, achieving 98.51% accuracy for car users, 97.59% for bus users, 100% for rail users, and 95.80% for paratransit users. Misclassifications in these models were minimal, with the largest error occurring in the paratransit category, where a small proportion of bus users (2.31% for Random Forest and 3.47% for XGBoost) were incorrectly classified. These high accuracy rates suggest that both models effectively capture complex patterns and can distinguish between different travel modes based on the provided variables.
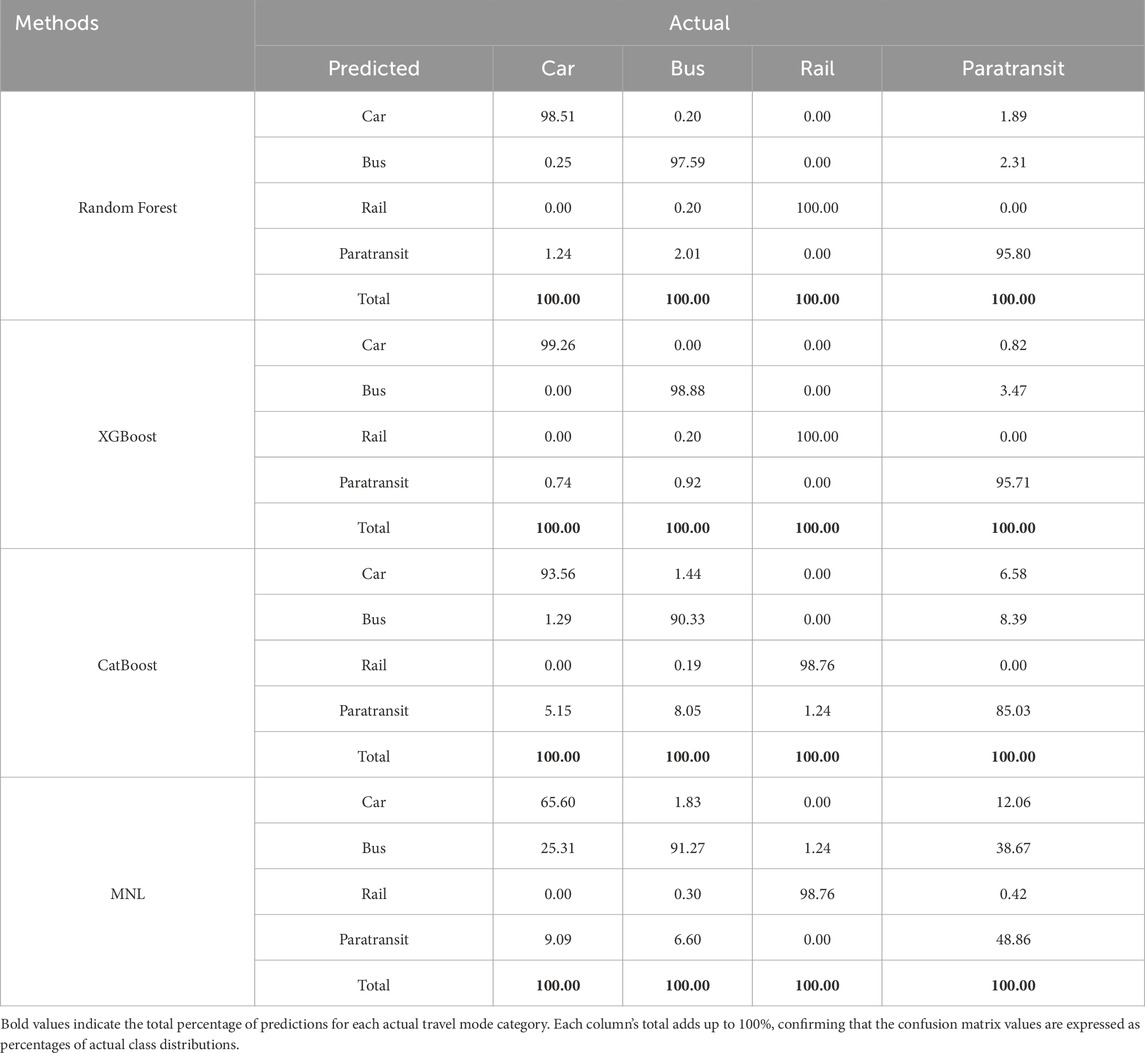
Table 10. Confusion matrix.
The perfect classification of rail users in both XGBoost and Random Forest likely reflects the distinct characteristics of rail travel in Thailand, such as longer distances and specific geographic corridors, making it easier to differentiate from other modes.
CatBoost exhibited slightly lower accuracy but still performed well, correctly classifying 93.56% of car users, 90.33% of bus users, 98.76% of rail users, and 85.03% of paratransit users. Misclassification primarily occurred between bus and paratransit users, where 8.05% of actual paratransit users were misclassified as bus users and 8.39% of actual bus users were misclassified as paratransit users. This pattern suggests that shared public transportation services, such as buses and paratransit, may exhibit overlapping features that pose a challenge for precise classification.
In contrast, the Multinomial Logit (MNL) model demonstrated substantially lower accuracy across most travel modes, correctly classifying only 65.60% of car users, 91.27% of bus users, 98.76% of rail users, and 48.86% of paratransit users. The model particularly struggled with car and paratransit modes, where 25.31% of actual car users were misclassified as bus users, and 38.67% of actual paratransit users were misclassified as bus users. This systematic bias toward predicting bus usage suggests that the MNL model may have limitations in capturing complex, non-linear relationships inherent in the data.
Interestingly, all models achieved high accuracy in classifying rail users (98.76%–100%), reinforcing the notion that rail travel has distinct characteristics. However, the stark contrast between the superior accuracy of machine learning models and the lower performance of the MNL model highlights the advantages of machine learning approaches. Machine learning models can better capture intricate variable interactions without requiring explicit specification, making them particularly suitable for predicting elderly travel mode choices.
Table 11 presents a comparison of prediction accuracy for elderly travel mode choice using different models, including Random Forest, XGBoost, CatBoost, and Multinomial Logistic Regression (MNL). The prediction is divided into different modes: Car, Bus, Rail, and Paratransit. The results from this table show that XGBoost is the best model, providing the highest overall accuracy as well as the best predictions for each travel mode. Random Forest is also a good option, especially for predicting Car and Paratransit modes. On the other hand, CatBoost and MNL show lower prediction performance, particularly for Car and Paratransit modes.
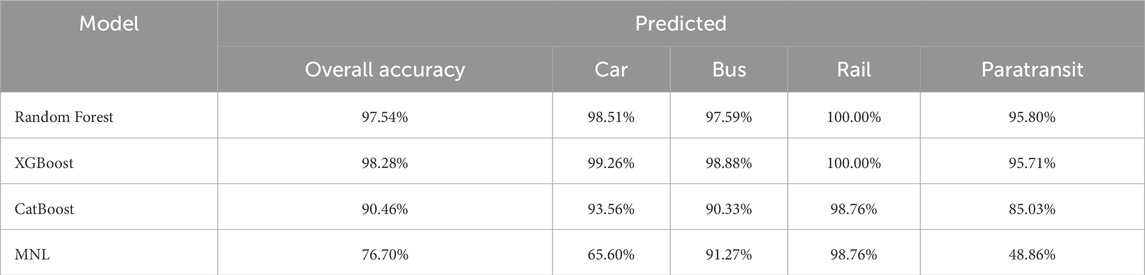
Table 11. Comparison of accuracy of each model.
4.4 Feature importance analysis
4.4.1 Variable importance across models
Table 12 presents the feature importance analysis for each machine learning model, identifying the most influential factors in elderly travel mode decisions. Across all three models, travel cost emerged as the most important factor affecting elderly travel mode choices, with impact values of 0.37 for XGBoost, 0.41 for Random Forest, and 0.39 for CatBoost. This consistent finding across models confirms the critical importance of economic considerations in elderly travel decisions and aligns with the MNL results, which showed significant negative effects of travel cost across all modes.
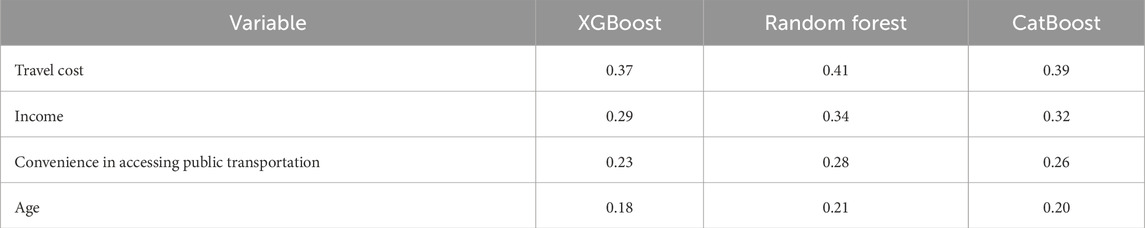
Table 12. Feature importance analysis in each model.
Income was the second most important factor (XGBoost: 0.29, Random Forest: 0.34, CatBoost: 0.32), followed by convenience in accessing public transportation (XGBoost: 0.23, Random Forest: 0.28, CatBoost: 0.26), and age (XGBoost: 0.18, Random Forest: 0.21, CatBoost: 0.20). The high importance of income reinforces the economic dimension of travel mode choices, while the significance of convenience highlights the practical considerations that influence elderly mobility.
The consistent ranking of these factors across all three models confirms the robustness of these findings and suggests that these variables should be prioritized in transportation policy and planning for elderly populations. The relatively lower importance of age compared to economic factors suggests that financial considerations may outweigh age-related preferences or limitations in determining travel mode choices.
4.4.2 SHAP analysis for model interpretability
The SHAP (Shapley Additive Explanations) analysis provided deeper insights into how each factor influences specific travel mode choices. Figure 2 shows the feature importance of the CatBoost model, with travel cost, distance, income, travel time, age, and number of companions emerging as the most important factors. This visualization confirms the results from the variable importance analysis and provides a more nuanced understanding of the relative importance of different factors.
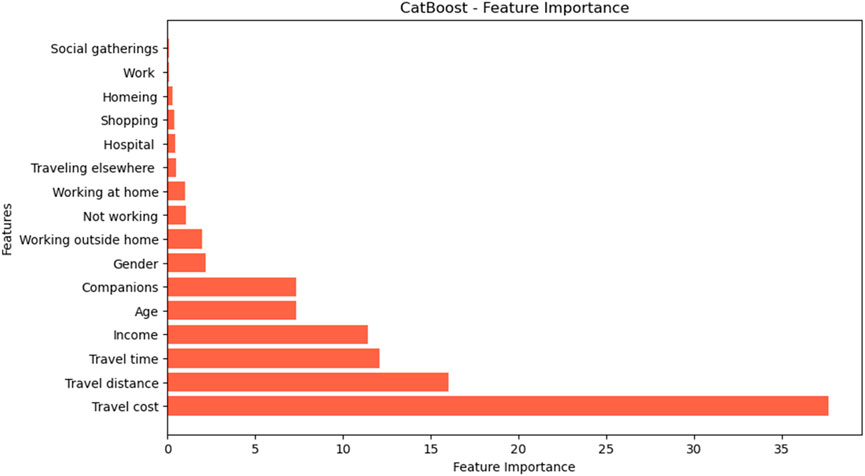
Figure 2. Feature importance of CatBoost.
Figure 3 presents the SHAP interaction plot, illustrating the complex relationships between different variables. This analysis reveals how factors interact to influence travel mode choices, capturing relationships that may not be apparent in simpler analyses. For example, the interaction between income and travel cost may be particularly important, with lower-income elderly being more sensitive to travel costs than higher-income individuals.
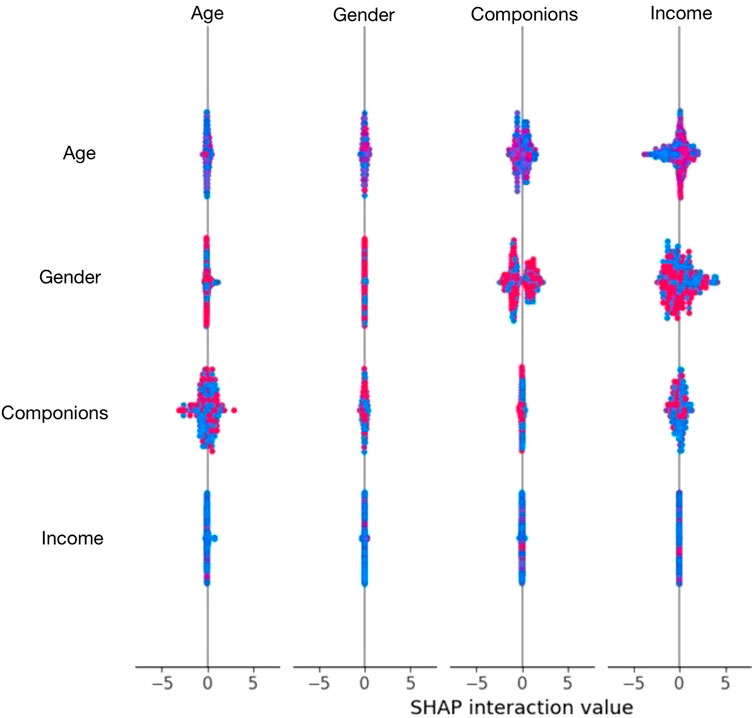
Figure 3. SHAP interaction plot.
Figures 4–7 show the SHAP contribution by mode for car, bus, rail, and paratransit respectively, revealing how each factor increases or decreases the likelihood of selecting a particular mode. These visualizations provide detailed insights into the decision-making process for each travel mode.
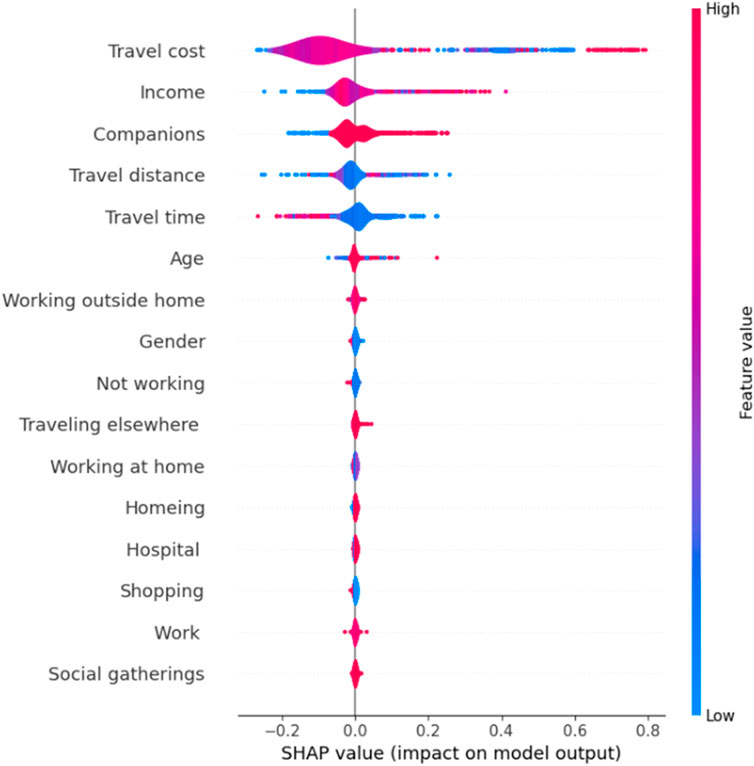
Figure 4. SHAP contribution by mode–car.
For car mode (Figure 4), higher income and higher travel costs increased the likelihood of choosing a private car, while having companions decreased this likelihood. The positive effect of travel cost may seem counterintuitive but may reflect the willingness of car users to pay more for the convenience and comfort of private transportation. The negative effect of having companions may reflect the economic advantages of sharing costs on public transportation for group travel.
For bus mode (Figure 5), lower income, lower travel costs, and having companions increased the probability of selecting buses. These findings align with the MNL results and economic theory, suggesting that buses are preferred by more price-sensitive elderly and those traveling in groups. The importance of travel cost and income reinforces the economic dimension of bus travel, which is often chosen for its affordability.
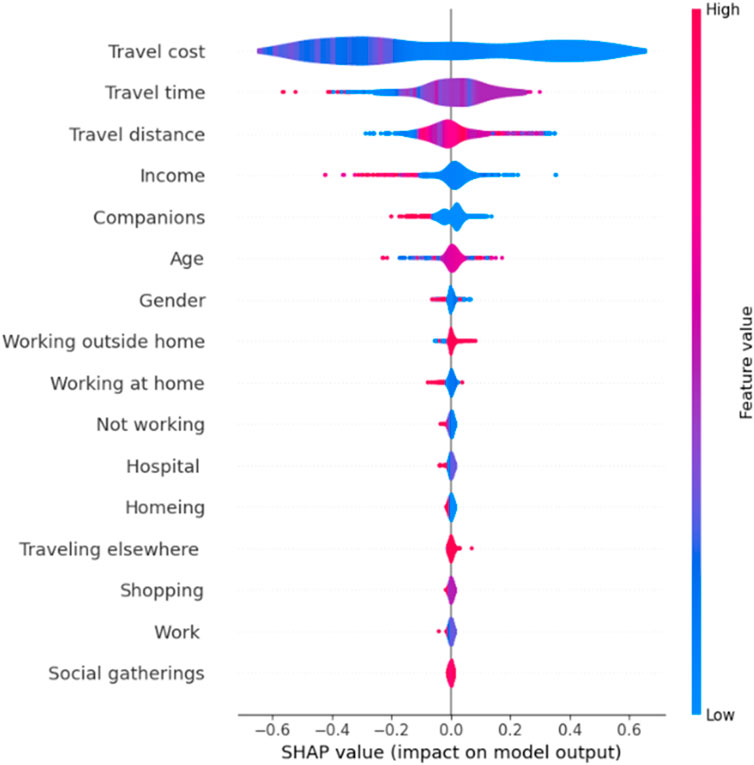
Figure 5. SHAP contribution by mode–bus.
For rail mode (Figure 6), longer travel time, longer travel distance, and lower travel costs were associated with increased rail usage. This pattern suggests that rail is particularly preferred for longer journeys where its speed and comfort advantages may outweigh other considerations, particularly when it offers cost savings compared to alternative modes. The importance of travel distance aligns with the MNL results, which showed a significant positive effect of distance on rail choice.

Figure 6. SHAP contribution by mode–rail.
For paratransit (Figure 7), having companions, shorter travel time, and medium income levels increased the likelihood of choosing this mode. The importance of having companions aligns with the MNL results and suggests that paratransit is particularly valued for group travel, perhaps due to its flexibility and door-to-door service. The preference for shorter travel times may reflect the higher cost per distance of paratransit compared to other public transportation options, making it more economical for shorter trips.

Figure 7. SHAP contribution by mode–paratransit.
These SHAP analyses provide nuanced insights that complement the MNL model results, capturing complex, non-linear relationships and interactions between variables that traditional statistical approaches might miss. They offer a more detailed understanding of the decision-making processes of elderly travelers and can inform more targeted transportation policies and services.
5 Discussion
5.1 Key findings and interpretation
This research reveals several important insights into elderly travel behavior in Thailand and demonstrates the comparative effectiveness of traditional statistical methods versus machine learning approaches in analyzing travel mode choices. The findings highlight the complex interplay of economic, social, and practical factors that influence transportation decisions among the elderly population.
5.1.1 Determinants of elderly travel mode choice
Our results consistently identified travel cost as the most influential factor affecting elderly travel mode decisions across all analytical approaches. This finding was evident in both the Multinomial Logit (MNL) model, which showed significant negative coefficients for travel cost across all alternative modes, and the machine learning models, where feature importance analyses ranked travel cost as the primary determinant. The high sensitivity to travel costs among elderly travelers likely reflects their predominantly lower income levels, with 78.7% of respondents earning less than 10,000 Baht monthly. This economic vulnerability makes cost considerations paramount in transportation decisions.
Income emerged as the second most influential factor, with higher-income elderly more likely to choose private vehicles over public transportation. This relationship between income and mode choice aligns with economic theory and reflects the ability of higher-income individuals to prioritize comfort and convenience over cost. The significant negative coefficients for income in the MNL model for all public transportation modes (bus, rail, and paratransit) compared to private cars reinforces this interpretation.
The presence of travel companions significantly influenced mode choices, particularly for bus and paratransit options. The strongly positive coefficients in the MNL model (OR = 9.754 for bus and OR = 8.357 for paratransit) indicate that accompanied travel substantially increases the likelihood of choosing these modes over private cars. This finding challenges the assumption that elderly travelers inherently prefer private transportation and suggests that public options can be attractive for group travel, possibly due to cost-sharing opportunities and social factors.
Travel time and distance demonstrated different effects across transportation modes. For rail travel, both factors showed positive coefficients, indicating that rail is preferred for longer journeys where its speed advantages become more valuable. In contrast, travel time showed negative effects for paratransit, suggesting this mode is preferred for shorter trips, likely due to its higher cost per distance compared to other public options.
5.1.2 Comparison of analytical methods
The performance comparison between traditional statistical modeling and machine learning approaches revealed compelling differences. Machine learning methods consistently outperformed the MNL model in prediction accuracy, with the best-performing ML model (CatBoost) achieving 94% accuracy on test data compared to substantially lower accuracy for the MNL model, particularly for car (65.60%) and paratransit (48.86%) modes.
The confusion matrix analysis revealed a systematic bias in the MNL model toward predicting bus usage, with substantial misclassifications of car and paratransit users as bus users. This limitation suggests that the MNL model, despite its theoretical foundation and interpretability advantages, may fail to capture complex, non-linear relationships and interactions that distinguish different travel modes.
Among machine learning approaches, CatBoost demonstrated superior performance on test data, achieving 94% accuracy, while Random Forest performed best on the full dataset with an accuracy of 99.83%. This variation highlights the importance of model selection based on specific data characteristics and analytical objectives. The SHAP analysis provided valuable insights into how factors influence specific travel modes, capturing nuanced relationships that complement the more straightforward interpretations from the MNL model.
5.2 Comparison with previous research
Our findings broadly align with previous research on elderly travel behavior while providing new insights specific to the Thai context. The importance of economic factors (travel cost and income) in elderly travel decisions is consistent with Luiu et al. (2018), who identified financial considerations as critical determinants of elderly travel mode choices. Similarly, our finding that travel time significantly influences mode selection, particularly for rail travel, aligns with Holmes et al. (2024), who noted that certain elderly groups prioritize journey duration over cost factors.
The superior performance of machine learning methods over traditional statistical approaches mirrors the results of Huang et al. (2024), who found that machine learning provided greater accuracy (94.30%) than MNL models in predicting elderly medical travel choices in China. Our study extends this finding to general travel behavior in Thailand, with similar accuracy levels (94% for CatBoost on test data and Random Forest on full data).
The high usage of bus services (48.4%) among Thai elderly contrasts somewhat with findings from urban China by Wei et al. (2024), likely reflecting differences in transportation infrastructure and urban development patterns between the two countries. However, the influence of physical capabilities on travel choices is consistent with Shi et al. (2024), who identified physical characteristics as significant determinants of elderly mobility patterns.
Our findings regarding the importance of having companions for public transportation use provide an interesting counterpoint to Zhang et al. (2024) identification of distinct mobility patterns between urban and rural elderly in Japan. While our study did not specifically compare urban and rural populations, the strong effect of companions suggests social factors may transcend geographical contexts in influencing elderly travel behaviors.
The high accuracy of our Random Forest model (99.83% on full data) is comparable to Hong et al. (2024) achievement of 92.30% accuracy using similar techniques in South Korea, and Champahom et al. (2025) 94.20% accuracy using the Logit Model approach in Thailand. This consistency in model performance across different Asian contexts suggests that advanced analytical methods can reliably capture elderly travel patterns despite cultural and infrastructural differences.
5.3 Methodological implications: MNL vs. machine learning
The comparative analysis of traditional statistical and machine learning approaches provides important methodological insights for transportation research. While the MNL model offers theoretical grounding in utility maximization principles and readily interpretable coefficients, its predictive limitations suggest that it may not fully capture the complexity of elderly travel decision-making processes.
Machine learning methods demonstrated superior predictive performance, with all three algorithms (XGBoost, Random Forest, and CatBoost) achieving accuracy rates exceeding 90%. This advantage likely stems from their ability to identify non-linear relationships and complex interactions without requiring explicit specification. The automatic handling of variable interactions in tree-based models represents a significant advantage over the MNL approach, where interactions must be manually specified based on prior theoretical assumptions.
However, the traditional criticism of machine learning as a “black box” approach with limited interpretability was partially addressed in this study through feature importance and SHAP analyses. These techniques provided insights into the relative importance of different factors and their specific effects on each travel mode, enhancing the interpretability of machine learning results. The consistency in feature importance rankings across all three machine learning models provides robust evidence regarding the key determinants of elderly travel behavior.
The complementary strengths of traditional statistical and machine learning approaches suggest value in employing both methodologies. The MNL model offers a theoretically grounded framework for understanding travel behavior, while machine learning provides superior predictive accuracy and can identify complex patterns that might be missed in traditional analyses. This dual approach can provide more comprehensive insights than either methodology alone.
6 Policy implications for elderly transportation
The findings of this study have several important implications for transportation policy and planning for elderly populations in Thailand. The identified determinants of travel mode choices suggest specific areas for intervention to enhance elderly mobility and quality of life.
6.1 Economic accessibility
The paramount importance of travel cost and income in elderly travel decisions underscores the need for affordable transportation options. Policy measures could include:
• Targeted subsidies: Implementing or expanding fare reduction programs specifically for elderly passengers could significantly increase public transportation usage among this population, particularly for lower-income individuals.
• Income-based fare structures: Developing differentiated fare systems based on income levels could make public transportation more accessible to economically vulnerable elderly while maintaining financial sustainability.
Integrated ticketing systems: Creating seamless payment systems across different transportation modes could reduce overall travel costs for elderly who use multiple modes for a single journey.
6.2 Social dimension of travel
The significant influence of travel companions on mode choices highlights the social dimension of elderly transportation. Policy interventions could include:
• Group travel incentives: Offering discounts or special services for elderly traveling in groups could encourage public transportation use and support social connectivity.
• Community transportation programs: Developing community-based transportation initiatives that facilitate group travel for shopping, healthcare visits, or social activities could enhance mobility while addressing social isolation.
Travel buddy systems: Establishing volunteer programs pairing mobility-limited elderly with travel companions could increase confidence in using public transportation.
6.3 Mode-specific enhancements
The distinct patterns identified for different transportation modes suggest targeted improvement opportunities:
• Bus services: Given their high usage rate (48.4%), enhancing accessibility features, increasing route coverage in areas with high elderly populations, and improving comfort could further increase utilization.
• Rail services: The preference for rail among longer-distance travelers suggests potential for expanding services connecting major healthcare facilities, shopping centers, and recreational destinations frequented by elderly.
Paratransit: The significant use of paratransit options (23.6%) indicates demand for flexible, door-to-door services. Formalizing and regulating these services could improve safety and reliability while maintaining their flexibility advantages.
6.4 Infrastructure and service design
The identified travel patterns and preferences suggest specific infrastructure and service design considerations:
• Temporal planning: With 64.4% of elderly using public transportation during early morning to morning hours, service frequency and capacity planning should prioritize these periods.
• Accessibility enhancements: Given that 41% of respondents reported physical disabilities, universal design principles should be incorporated into all transportation infrastructure and vehicles.
Information systems: Developing clear, accessible information systems about routes, schedules, and fares could address uncertainty that may discourage elderly from using public transportation.
7 Limitations and future research directions
While this study provides valuable insights into elderly travel behavior and methodological approaches, several limitations should be acknowledged. First, the cross-sectional nature of the data captures travel patterns at a specific point in time and does not account for potential changes over time or seasonal variations. Longitudinal studies tracking elderly mobility patterns over extended periods could provide more comprehensive understanding of how travel behaviors evolve with age and changing circumstances.
Second, the sample, while geographically diverse, may not fully represent all elderly population segments, particularly those with severe mobility limitations who may be underrepresented in public spaces where recruitment occurred. Future research should employ sampling strategies specifically targeting homebound elderly to understand their transportation challenges and needs.
Third, while the study employed both traditional and advanced analytical methods, it did not incorporate qualitative approaches that could provide deeper insights into decision-making processes and subjective experiences. Mixed-methods studies combining quantitative analysis with in-depth interviews or focus groups could enhance understanding of the psychological and social dimensions of elderly travel behavior. Future research directions could include:
• Cohort analysis: Examining differences between age cohorts within the elderly population could identify how travel preferences and behaviors might change as current middle-aged adults transition into older age with potentially different technological proficiency and transportation expectations.
• Technology adoption: Investigating elderly adoption of emerging transportation technologies, including ride-sharing applications, mobile payment systems, and real-time tracking, could inform the design of more accessible digital transportation services.
• Climate considerations: Exploring how Thailand’s tropical climate affects elderly travel patterns and mode choices could identify seasonal variations and inform climate-adaptive transportation planning.
• Comparative analysis: Extending the methodological comparison to include additional machine learning approaches, such as neural networks or support vector machines, could further advance understanding of their relative strengths for transportation analysis.
• Geographic information system (GIS) integration: Incorporating spatial analysis to examine how transportation accessibility varies across different regions and how geographical factors influence elderly travel choices could enhance the contextual understanding of mobility patterns.
Despite the strong predictive performance of machine learning models in this study, potential limitations must be acknowledged. Machine learning approaches, including Random Forest, XGBoost, and CatBoost, are often criticized for challenges in interpretability and the risk of overfitting, particularly when the models are trained on specific datasets without sufficient generalization testing. Future studies should incorporate techniques such as cross-validation, regularization, and explainable AI methods to mitigate these risks and enhance transparency for transportation policy applications.
Furthermore, while the sample is geographically diverse within Thailand, the findings may not fully generalize to other countries with different transportation infrastructures, cultural contexts, and elderly care systems. Expanding future studies to include multi-country comparisons within the ASEAN region or globally could enhance the external validity of the findings.
While health-related factors, including chronic diseases and physical disabilities, were incorporated into the survey and descriptive analysis, the study did not conduct an in-depth examination of how these specific conditions directly influenced travel mode choices. Future research could further investigate the relationships between various health limitations and transportation behaviors, particularly focusing on the accessibility requirements and safety concerns of elderly individuals with mobility impairments.
Additionally, the face-to-face survey method may have inadvertently excluded elderly individuals who are homebound or severely mobility impaired, potentially introducing sample bias. Future research could address this limitation by incorporating telephone surveys, online surveys, or home-based interviews.
Lastly, while this study touched upon economic and physical factors, the broader social context such as the role of family caregivers, the effects of social isolation, and community support systems also plays a crucial role in elderly transportation choices. Environmental factors such as infrastructure quality and climate conditions remain important dimensions that merit further investigation, particularly in developing inclusive transportation systems for aging societies.
In conclusion, this study provides valuable insights into the factors influencing elderly travel mode choices in Thailand and demonstrates the complementary value of traditional statistical and machine learning approaches. The findings suggest that economic accessibility, social dimensions of travel, and tailored mode-specific enhancements should be prioritized in transportation planning for aging populations. By addressing the identified determinants of elderly travel behavior, policymakers can develop more inclusive, accessible transportation systems that enhance mobility and quality of life for this growing demographic group.
Data availability statement
The data analyzed in this study is subject to the following licenses/restrictions: The authors do not have permission to share the dataset. Requests to access these datasets should be directed to c2FqamFrYWpAc3V0LmFjLnRo.
Ethics statement
The studies involving humans were approved by Ethics Committee of Suranaree University of Technology. The study was conducted according to the guidelines of the Declaration of Helsinki, and approved by the Ethics Committee of Suranaree University of Technology (COE No. 57/2567, 3 May 2023). Furthermore, verbal consent was secured from the volunteers and a detailed explanation of the questionnaire was provided prior to data collection. The studies were conducted in accordance with the local legislation and institutional requirements. Written informed consent for participation was not required from the participants or the participants’ legal guardians/next of kin in accordance with the national legislation and institutional requirements.
Author contributions
AP: Formal Analysis, Writing – review and editing, Writing – original draft, Conceptualization, Data curation, Methodology. PW: Conceptualization, Writing – review and editing, Methodology. FW: Writing – review and editing, Data curation, Formal Analysis. CB: Formal Analysis, Writing – review and editing, Methodology. AC: Formal Analysis, Writing – review and editing, Data curation. TC: Validation, Writing – review and editing. VR: Writing – review and editing, Supervision, Software. SJ: Writing – review and editing, Visualization, Conceptualization, Supervision.
Funding
The author(s) declare that financial support was received for the research and/or publication of this article. This project is funded by National Research Council of Thailand (NRCT) and Suranaree University of Technology (SUT), grant number are N42A660429 and 2/2566-NRCT.
Acknowledgments
The authors express their gratitude to the Suranaree University of Technology (SUT), Thailand Science Research and Innovation (TSRI), and National Research Council of Thailand (NRCT) for their support in undertaking this research.
Conflict of interest
The authors declare that the research was conducted in the absence of any commercial or financial relationships that could be construed as a potential conflict of interest.
Generative AI statement
The author(s) declare that no Generative AI was used in the creation of this manuscript.
Publisher’s note
All claims expressed in this article are solely those of the authors and do not necessarily represent those of their affiliated organizations, or those of the publisher, the editors and the reviewers. Any product that may be evaluated in this article, or claim that may be made by its manufacturer, is not guaranteed or endorsed by the publisher.
References
Ali, M., Fahriza, N., Sadullah, A. F. M., Abdul Majeed, A. P. P., Razman, M. A. M., and Musa, R. M. (2022). He identification of significant features towards travel mode choice and its prediction via optimised random forest classifier: an evaluation for active commuting behavior. J. Transp. Health 25: 101362. doi:10.1016/j.jth.2022.101362
Asare-Duah, S. (2024). A temporal analysis of travel by the urban and rural elderly and their implications for transportation planning. Cookeville, TN: Tennessee Technological University.
Bakhshi, H., and Atri, F. (2025). Relationship between destination image and satisfaction in inbound tourists of Isfahan. J. Urban Tour. doi:10.22059/jut.2025.368727.1173
Banyong, C., Hantanong, N., Wisutwattanasak, P., Champahom, T., Theerathitichaipa, K., Kasemsri, R., et al. (2025). Analyzing high-speed rail’s transformative impact on public transport in Thailand using machine learning. Infrastructures 10 (3), 57. doi:10.3390/infrastructures10030057
Banyong, C., Hantanong, N., Wisutwattanasak, P., Champahom, T., Theerathitichaipa, K., Seefong, M., et al. (2024). A machine learning comparison of transportation mode changes from high-speed railway promotion in Thailand. Results Eng. 24: 103110. doi:10.1016/j.rineng.2024.103110
Ben-Akiva, M., and Lerman, S. R. (1985). Discrete choice analysis: theory and application to travel demand. MIT Press.
Champahom, T., Chonsalasin, D., Dangbut, A., Watcharamaisakul, F., Jomnonkwao, S., and Ratanavaraha, V. (2025). Elderly travelers’ expectations of high-speed railway services in Thailand: a comparative study of leisure and other purposes. Travel Behav. Soc. 39, 100984. doi:10.1016/j.tbs.2025.100984
Chen, T., and Guestrin, C. (2016). XGBoost: a scalable tree boosting system. in Proceedings of the 22nd ACM SIGKDD International Conference on Knowledge Discovery and Data Mining, 785–794. doi:10.1145/2939672.2939785
Cheng, L., Chen, X., Yang, S., Cao, Z., De Vos, J., and Witlox, F. (2019a). Active travel for active ageing in China: the role of built environment. J. Transp. Geogr. 76, 142–152. doi:10.1016/j.jtrangeo.2019.03.010
Cheng, L., De Vos, J., Shi, K., Yang, M., Chen, X., and Witlox, F. (2019b). Do residential location effects on travel behavior differ between the elderly and younger adults? Transp. Res. Part D Transp. Environ. 73, 367–380. doi:10.1016/j.trd.2019.07.015
Creswell, J. W., and Creswell, J. D. (2017). Research design: qualitative, quantitative, and mixed methods approaches. Thousand Oaks, CA: Sage Publications.
Dorogush, A. V., Ershov, V., and Gulin, A. (2018). CatBoost: gradient boosting with categorical features support.
Du, M., Lin, C., Li, X., and Yang, J. (2020). Factors affecting the travel mode choice of the urban elderly in healthcare activity: comparison between core area and suburban area. Sustain. cities Soc. 52, 101868. doi:10.1016/j.scs.2019.101868
Elias, W., Albert, G., and Shiftan, Y. (2013). Travel behavior in the face of surface transportation terror threats. Transp. Policy 28: 114–122. doi:10.1016/j.tranpol.2012.08.005
Hagenauer, J., and Helbich, M. (2017). A comparative study of machine learning classifiers for modeling travel mode choice. Expert Syst. Appl. 78, 273–282. doi:10.1016/j.eswa.2017.01.057
Holmes, E., Arkesteijn, M., Knowles, K., McKinney, T., Mizen, A., and Purcell, C. (2024). Understanding the interactions that children and young people have with their natural and built environments: a survey to identify targets for active travel behaviour change in Wales. PLoS One 19 (10), e0311498. doi:10.1371/journal.pone.0311498
Hong, S.-Y., Cho, S.-H., and Park, H.-C. (2024). Behavioral differences between young adults and elderly travelers concerning the crowding effect on public transit after the COVID-19 pandemic. Res. Transp. Econ. 106, 101463. doi:10.1016/j.retrec.2024.101463
Huang, P., Gong, L., Lei, T., Wang, J., Zhu, C., and Zhang, Z. (2024). “A comparative study of MNL and machine learning methods for travel mode choice of medical travel,” in International conference on traffic and transportation studies. Springer, 305–313.
Karlaftis, M. G., and Vlahogianni, E. I. (2011). Statistical methods versus neural networks in transportation research: differences, similarities and some insights. Transp. Res. Part C Emerg. Technol. 19 (3): 387–399. doi:10.1016/j.trc.2010.10.004
Lee, E. H. (2022). Exploring transit use during COVID-19 based on XGB and SHAP using smart card data. J. Adv. Transp. 2022 (1), 6458371. doi:10.1155/2022/6458371
Luiu, C., Tight, M., and Burrow, M. (2017). The unmet travel needs of the older population: a review of the literature. Transp. Rev. 37 (4), 488–506. doi:10.1080/01441647.2016.1252447
Luiu, C., Tight, M., and Burrow, M. (2018). Factors preventing the use of alternative transport modes to the car in later life. Sustainability 10 (6), 1982. doi:10.3390/su10061982
Lundberg, S. M., and Su-In, L. (2017). “A unified approach to interpreting model predictions,” inProceedings of the 31st international conference on neural information processing systems. Long Beach, California, USA ACM, 4768–4777.
McFadden, D. (1973). “Conditional logit analysis of qualitative choice behavior,” in Frontiers in econometrics. Editor P. Zarembka (Academic Press), 105–142.
Office of the National Economic and Social Development Council (2022). Population development plan for long-term national development (2022-2037). Bangkok, Thailand: Office of the National Economic and Social Development Council. Available online at: https://www.nesdc.go.th/ewt_dl_link.php?nid=13502.
Powers, D. M. W. (2020). Evaluation: from precision, recall and F-measure to ROC, informedness, markedness and correlation. arXiv Prepr. arXiv:2010.16061.
Prasertsubpakij, D., and Nitivattananon, V. (2012). Evaluating accessibility to Bangkok Metro Systems using multi-dimensional criteria across user groups. IATSS Res. 36 (1): 56–65. doi:10.1016/j.iatssr.2012.02.003
Prokhorenkova, L., Gusev, G., Vorobev, A., Dorogush, A. V., and Gulin, A. (2018). CatBoost: unbiased boosting with categorical features. Adv. Neural Inf. Process. Syst. 31. doi:10.48550/arXiv.1706.09516
Shi, Z., Zhou, C., Cheng, L., He, M., and Liu, Y. (2024). Examining spatial variations in walking activity among older adults considering the impact of topographical characteristics. Transp. Res. Rec., 03611981241302339. doi:10.1177/03611981241302339
Sukkasem, A., and Soratana, K. (2024). Life Cycle Assessment of Incentive Travel: a case of Phitsanulok Province. J. Int. Thai Tour. 20 (2). Available online at: https://so02.tci-thaijo.org/index.php/jitt/article/view/267806
Sukto, A. (2021). Travel patterns and public transportation for aging society (in Thai). National Assembly of Thailand. Available online at: https://www.parliament.go.th/ewtadmin/ewt/parliament_parcy/download/article/article_20210423152404.pdf.
Tianqi, C., and Carlos, G. (2016). “XGBoost: a scalable tree boosting system,” in Proceedings of the 22nd ACM sigkdd international conference on knowledge discovery and data mining, ACM 785–794.
United Nations (2019). World population prospects 2019: highlights. Available online at: https://population.un.org/wpp/.
Wang, F., and Ross, C. L. (2018). Machine learning travel mode choices: comparing the performance of an Extreme gradient boosting model with a multinomial logit model. Transp. Res. Rec. 2672 (47), 35–45. doi:10.1177/0361198118773556
Wei, Q., Zhang, N., Gao, Y., Chen, C., Wang, Li, and Yang, J. (2024). Bus network adjustment pre-evaluation based on biometric recognition and travel spatio-temporal deduction. Algorithms 17 (11), 513. doi:10.3390/a17110513
Yan, X., Liu, X., and Zhao, X. (2020). Using machine learning for direct demand modeling of ridesourcing services in Chicago. J. Transp. Geogr. 83: 102661. doi:10.1016/j.jtrangeo.2020.102661
Zamprogno, M. M., and Esztergár-Kiss, D. (2024). Applying cluster analysis for the investigation of travel behavior and user profiles. Period. Polytech. Transp. Eng. 52 (4), 362–371. doi:10.3311/pptr.25663
Zhang, G., Wang, D., Cai, Z., and Zeng, J. (2024). Competitiveness of public transit considering travel time reliability: a case study for commuter trips in Hangzhou, China. J. Transp. Geogr. 114: 103768. doi:10.1016/j.jtrangeo.2023.103768
Zhang, H., Zhang, Li, Liu, Y., and Zhang, L. (2023). Understanding travel mode choice behavior: influencing factors analysis and prediction with machine learning method. Sustainability 15 (14), 11414. doi:10.3390/su151411414
Zhang, Z., Jalali, M. S., and Ghaffarzadegan, N. (2025). Behavioral dynamics of epidemic trajectories and vaccination strategies: a simulation-based analysis. J. Artif. Soc. Soc. Simul. 28 (1), 1–3. doi:10.18564/jasss.5583
Zhang, Z., and Maruyama, T. (2024). “Exploring the heterogeneity of the travel behavior of the elderly in the kumamoto metropolitan area based on latent Class analysis,” in 24th COTA International Conference of Transportation Professionals. Shenzhen, China, 23 07, 2024–26 07, 2024, ASCE 955–964.
Keywords: elderly, travel mode choice, multinomial logit, machine learning, CatBoost, shap, XGBoost, random forest
Citation: Philuek A, Wisutwattanasak P, Watcharamaisakul F, Banyong C, Chantaratang A, Champahom T, Ratanavaraha V and Jomnonkwao S (2025) Elderly travel mode choice in Thailand-evaluating MNL and machine learning models. Front. Built Environ. 11:1601754. doi: 10.3389/fbuil.2025.1601754
Received: 28 March 2025; Accepted: 30 May 2025;
Published: 12 June 2025.
Edited by:
Nishant Mukund Pawar, National Institute of Technology Calicut, IndiaReviewed by:
Harikrishna Madhavan, National Institute of Technology Calicut, IndiaMalik Muneeb Abid, University of Sargodha, Pakistan
Copyright © 2025 Philuek, Wisutwattanasak, Watcharamaisakul, Banyong, Chantaratang, Champahom, Ratanavaraha and Jomnonkwao. This is an open-access article distributed under the terms of the Creative Commons Attribution License (CC BY). The use, distribution or reproduction in other forums is permitted, provided the original author(s) and the copyright owner(s) are credited and that the original publication in this journal is cited, in accordance with accepted academic practice. No use, distribution or reproduction is permitted which does not comply with these terms.
*Correspondence: Sajjakaj Jomnonkwao, c2FqamFrYWpAc3V0LmFjLnRo