 Lan Deng1
 Cai Wu
- 1Hubei 9D Mapping and Design Co., Ltd., Xiaogan, China
- 2School of Civil Engineering, Hubei Engineering University, Xiaogan, China
- 3School of Natural Resources and Geographic Information, Hubei Land Resources Vocational College, Wuhan, China
- 4China Railway Siyuan Survey and Design Group Co., Ltd, Wuhan, China
With the rapid advancement of urbanization, the demand for efficient transportation networks, particularly for shield tunnels, has been rising. However, tunnel excavation significantly affects the surrounding soil and elevated bridge pile foundations, potentially leading to complex mechanical responses and safety risks for structures. Although prior studies have examined the impact of tunnels on pile foundations, systematic research on the deformation patterns of pile groups remains limited. Based on the case of the Zhengzhou Metro Line five crossing beneath the Shijiazhuang-Wuhan High-Speed Railway Bridge, this study uses three-dimensional finite element numerical simulations and field monitoring data to analyze the effects of tunnel excavation on bridge pile groups. The results reveal that: (1) For single-track excavation, the maximum horizontal displacement of the pile group increases to 1.587 mm, while for double-track excavation, it reaches 1.813 mm, with pile settlement increases to a maximum of 5.03 mm; (2) The maximum settlement and horizontal deformation of the bridge piles show a negative correlation with the minimum spacing between piles, with deformation increasing exponentially as the spacing decreases; (3) The excavation process at all stages affects the piers, with initial maximum settlement increasing from 0.787 mm to 3.569 mm, a growth rate of 201.91%, and maximum horizontal displacement reaching 1.576 mm. The final settlement and horizontal displacement are 5.171 mm and 1.770 mm, respectively; (4) Field monitoring and numerical analysis indicate that bridge piles in close proximity (e.g., piles 17#, 18#, 35#) are more significantly impacted by the tunnel, with maximum settlement and inclination reaching 4.5 mm and 0.008, while more distant piles (e.g., piles 16#, 20#, 34#) are less affected. These findings offer important insights for the design and construction of urban infrastructure projects, contributing to the sustainable development of cities by ensuring the safety and stability of built environment within rapidly evolving urban social spaces.
1 Introduction
As urban development accelerates, the demand for efficient transportation networks continues to grow, leading to a significant increase in shield tunneling projects. While shield tunneling offers advantages such as minimizing surface disruption and expediting construction, the process can disturb surrounding soils, posing severe risks to nearby structures (Basack et al., 2023; Awad et al., 2023; Huang et al., 2024a), particularly elevated bridges supported by pile foundations (Huang et al., 2024b). The excavation of shield tunnels induces complex mechanical responses in the surrounding soils and bridge piles, causing noticeable stress redistribution in the soil around the piles (Reese et al., 2002). This redistribution may result in pile group settlement or horizontal deformation, compromising the structural integrity of the piles and, in extreme cases, leading to pile foundation failure (Tamotsu and Kazuhiro, 2012). Therefore, it is crucial to thoroughly investigate the deformation response characteristics of pile groups during shield tunnel construction to mitigate associated risks effectively.
Nowadays, a large amount of researches have been conducted to understand the effects of tunnel construction on adjacent pile groups, which can be broadly categorized into three main approaches: theoretical analysis, model testing, and numerical simulation (Liu et al., 2023; Suh et al., 2009; Lowry and Rayhani, 2024). Theoretical analysis simplifies complex real-world problems to derive general principles. Many studies are grounded in elastic mechanics theory, analyzing pile deformation induced by tunnel construction. The primary approach employed is the classical two-stage method, which first establishes an elastic half-space model to derive soil displacement equations caused by tunnel excavation (Chen et al., 1999; Xiang and Feng, 2013). Then the pile foundation is simplified into structural element models, and the deformation of bridge piles is calculated. This method, due to its logical clarity and relatively accurate computations, has been widely adopted by scholars. For example, Kitiyodom et al. (Kitiyodom et al., 2005) used the Mindlin solution to calculate soil displacements caused by tunnel excavation, integrating pile-soil interaction theory and employing a Winkler elastic foundation beam model to investigate pile deformation patterns. Similarly, Zhang et al. (Zhang et al., 2013) developed a nonlinear two-stage analysis method that specifically accounts for pile-soil interface slippage, thereby providing a more accurate assessment of the impact of tunnel-induced loads on nearby pile foundations during excavation.
Experimental methods for studying the impact of tunnel construction on adjacent piles can be divided into conventional model tests and centrifuge model tests (Lee and Bassett, 2007; Sohaei et al., 2020; Matsumoto et al., 2004). In conventional model tests, similar materials are used to construct tunnel and bridge pile models, and by controlling excavation steps and loading conditions, the deformation patterns of bridge piles at varying distances are investigated, along with the response of the soil between the piles (Chen et al., 2024). For instance, Kong et al. (2017) explored the physical behavior of model piles during tunnel construction through model tests and numerical analysis. The results indicated that, under volume loss conditions, model piles bearing working loads experienced both vertical and horizontal displacements, leading to pile tilting. Additionally, many researchers have utilized geotechnical centrifuges to examine the effects of tunnel construction on bridge piles and analyze pile-soil interaction mechanisms (Loganathan et al., 2000; Ng et al., 2013). These studies also explored the influence of various parameters, such as tunnel depth, pile diameter, and pile length, on pile deformation. For example, Ng et al. (2014) and Hong et al. (2015) conducted three centrifuge model tests to investigate the effects of twin tunnel excavation at different depths on pile inclination and load transfer mechanisms. The results showed that back-to-back twin tunnel excavation on one side of the pile foundation is more likely to cause significant pile tilting compared to excavation on both sides. Similarly, Franza et al. (2018) performed a series of centrifuge tests simulating tunnel excavation beneath pile foundations, revealing that pile foundations have an adverse effect in tunnel-structure interaction problems, while the stiffness and weight of the superstructure can respectively reduce or increase deformation and settlement.
Numerical simulation also has become a widely used and efficient tool in engineering research, as it can capture changes at both the micro and meso levels, providing researchers with precise data and deeper analytical insights. Through numerical simulations, the entire process of shield tunneling can be modeled to analyze the effects on adjacent high-speed railway bridge pile groups, including changes in displacement, stress, and internal forces (Xia et al., 2009). Researchers frequently use finite element software such as ABAQUS, ANSYS, and Midas for these simulations) (Schweiger et al., 2001; Cheng et al., 2006; Ismail et al., 2015). By establishing 3D finite element models and considering factors such as soil nonlinearity and tunnel-pile interaction, these studies simulate the deformation and stress distribution of pile groups during tunnel excavation. For instance, Soomro et al. (2015) employed a 3D coupled consolidation finite element model to analyze the effects of tunneling on pile groups, finding that the most significant impacts on settlement, tilt, and induced bending moments occur when the tunnel face approaches the pile group. Soomro et al. (2019a), Soomro et al. (2019b) pioneered the use of numerical models to establish an analytical model of multi-supported deep excavations and adjacent pile foundations, investigating the interactive effects of excavation depth and pile foundation types. Regarding masonry wall structures, research has confirmed that excavation deformation elicits complex interaction mechanisms for different infrastructure types (Soomro et al., 2022). Specifically, optimizing the construction sequence of twin excavations can reduce the maximum tensile stress in masonry walls (Soomro et al., 2021c), while a multi-support system effectively suppresses differential settlement of the structure. Moreover, under the influence of twin vertical excavations, the crack propagation rate in masonry exhibits a non-linear relationship with the amount of stress relief in the ground (Soomro et al., 2023). These studies demonstrate a clear correlation between excavation depth and the structure, and also indicate that the construction sequence has a phased impact on the cumulative deformation of masonry. Other researchers, Lueprasert et al. (2017) used 3D elasto-plastic numerical analysis to explore the pile-soil-tunnel interaction mechanism, proposing a method that effectively captures the elliptical distortion of the deformed tunnel. Zheng et al. (2023) using 3D coupled consolidation finite element analysis, studied the effects of shield tunneling in soft soils on a 2 × 2 pile group and found that the maximum bending moment occurs near the middle of the pile group, though settlement and tilt remain relatively small. Li et al. (2002) employed FLAC3D to perform detailed simulations of pile foundation underpinning and shield tunneling. Their results showed that pile deformation is primarily caused by ground loss and excavation disturbance during tunneling, with underpinning contributing to 20%–30% of total settlement.
Based on the current state of research above, scholars have achieved certain results in the study of the impact of tunnel construction on pile foundations in the areas of theoretical analysis, model testing, and numerical simulation. However, it can be concluded that research on the deformation patterns of pile groups due to tunnel construction is still in its developmental stage. Current studies are highly empirical, and existing research often overlooks the pile group effect, lacks clear mechanical foundations, and does not delve deeply enough into the strain patterns of pile groups under different construction conditions. In practice, tunnel excavation projects are typically large in scale, and cases involving the impact of tunnel construction on adjacent pile groups are rare, with each project having highly varied conditions. Therefore, relying on empirical estimations of the impact patterns and neglecting the pile group effect in simple calculations fail to accurately reflect the analysis of the impact of tunnel construction on the deformation of pile groups. To address these gaps, this study presents a numerical simulation study based on the project of the twin-shield tunnels of Zhengzhou Metro Line 5, which pass beneath the pile foundations of three bridges. The study aims to comprehensively analyze the effects of shield tunneling on adjacent bridge pile groups and further investigate impact of pile-tunnel distance on pile strain patterns. The results will offer valuable references for the design and construction of similar projects, ensuring the safe operation of bridges.
2 Project overview
2.1 Profile of the project
The design length of Line five of Zhengzhou Metro is approximately 40.235 km, with the entire route being underground. The total length of the right track is 1,774.2 m (Right CK18 + 060.600 to Right CK19 + 834.800), while the left track is 1,775.89 m long (Left CK18 + 060.600 to Left CK19 + 834.800) (with an extended chain of 1.69 m). The metro project adopts the shield tunneling method, with the interval tunnel passing underneath several intersecting high-speed rail viaducts between Right CK18 + 920 and Right CK19 + 030. From the smaller to the larger chainage, the high-speed rail bridges it crosses are, in sequence: North Up Connection Line Bridge (N-1), North Down Connection Line Bridge (N-2), and Southwest Down Connection Line Bridge (SW-1). The spatial intersection between the line bridges and the shield tunnel is shown in Figure 1. The N-1 and N-2 are simply supported beams, while the SW-1 is a four-span continuous beam at the crossing location. The oblique crossing angles between the tunnel and the N-1, N-2, and SW-1 are 75°, 70°, and 106°, respectively, with the tunnel structure buried at a depth of approximately 14 m–16 m. The shield tunneling process was divided into eight stages (S1–S8) to systematically evaluate its impact on the adjacent pile foundations, as shown in Figure 2. Stages S1–S4 involved the sequential excavation of the left tunnel beneath the cap of bridge N-2 and S-1 (from the near edge to the mid-section and then fully through), followed by excavation beneath the cap of bridge N-1. Stages S5–S8 corresponded to the right tunnel excavation, progressing beneath the near edge of bridge S-1, the mid-section of bridge N-2, and the near edge of bridge N-1, before the tunnel fully passed through.

Figure 1. Spatial relationship between the tunnel section and connection line bridges. (a) Location in China; (b) Aerial vie; (c) Site picture; (d) CAD plan.
The spatial relationship between the interval tunnel and the viaducts of each liaison line is shown in Figures 2, 3, respectively. The description of the bridge piles for each viaduct is as follows:
(1) The two sub-piers of the Piers 34–38 of N-1 have heights of 15.75 m, 15.25 m (two piers), and 14.75 m (two piers), as shown in Figure 2A. All piers use bored cast-in-place piles as the foundation, with each pier containing six piles, each 1.00 m in diameter. The pile lengths for Piers 34 to 38 vary, specifically 51.50 m, 49.0 m, 47.5 m, 46.0 m, and 51.0 m, respectively. The minimum distance (Dmin) between Pier 35 and the left tunnel is 12.46 m, while the Dmin between Pier 36 and the right and left tunnels are 5.51 m and 7.65 m, respectively. The Dmin between Pier 33 and the right tunnel is 14.26 m, as shown in Figures 1D, 3.
(2) The heights of the piers for the N-2, specifically Piers 16 to 20, are 12.75 m, 15.25 m (two piers), 15.75 m, and 16.75 m, respectively. All piers utilize bored cast-in-place piles as their foundation (see Figure 2B). Pier 16 consists of a foundation made up of five piles, each with a diameter of 1.00 m and a length of 45.50 m. Both Piers 17 and 18 have six piles, with a diameter of 1.00 m and lengths of 45.50 m and 48.5 m, respectively. Piers 19 and 20 are also supported by six piles, each with a diameter of 1.00 m and a length of 42 m. Dmin between Pier 17 and the left tunnel is 8.64 m, while the Dmin between Pier 18 and the right and left tunnels are 6.62 m and 8.13 m, respectively. The Dmin between Pier 19 and the right tunnel is 15.49 m.
(3) The heights of the piers for the SW-1, specifically Piers 29 to 33, are 28.35 m, 26.35 m, 25.35 m, 27.35 m, and 31.35 m, respectively. All piers utilize bored cast-in-place piles as their foundation. The pile diameters for Piers 29, 30, and 33 are 1.25 m, with pile lengths of 58 m, 69 m, and 59 m, respectively. In contrast, the pile diameters for Piers 31 and 32 are slightly larger, at 1.50 m, with pile lengths of 70 m and 80 m, respectively. Dmin between Pier 30 and the left tunnel is 8.69 m, while the Dmin between Pier 31 and the right tunnel is 15.67 m.
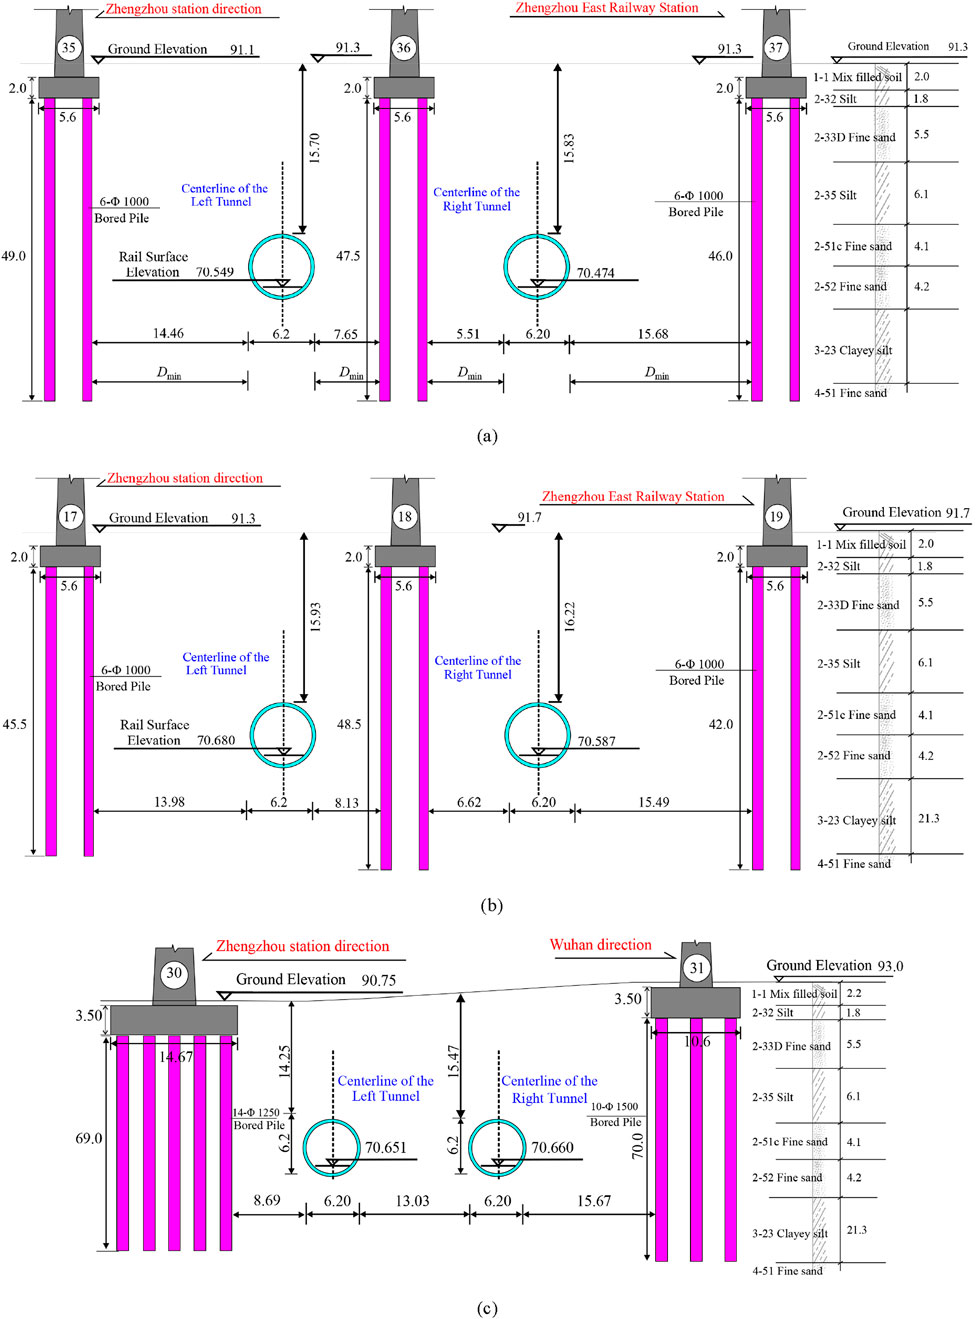
Figure 2. Spatial relationship between the tunnel section and different connection line bridges: (a) N-1; (b) N-2; (c) SW-1.
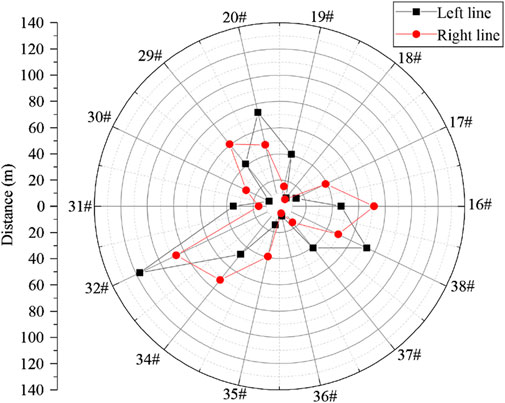
Figure 3. Minimum distance (Dmin) statistics of bridge piles to the left and right tunnel.
2.2 Engineering geological and hydrogeological conditions
The study area is located in the Yellow River alluvial plain and dune topography, characterized by flat and open terrain with underdeveloped vegetation. Based on the geological age, formation lithology, and engineering characteristics of the soil, the exploratory investigation within the exposed depth range reveals that the primary lithology consists of artificial fill, silt, silty clay, silty sand, and fine sand. The depth and thickness distribution of the soil layers is shown in Table 1. The stratigraphic description of the site is provided below according to geological zoning.
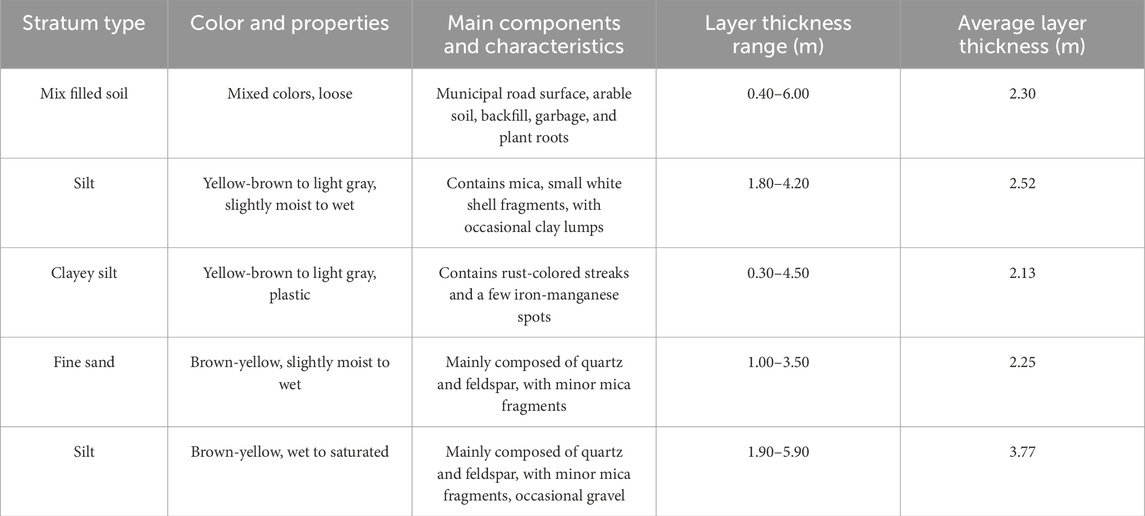
Table 1. Geological stratigraphy characteristics.
3 Numerical model and parameters for the shield tunnel passing under the connection line bridge
3.1 Establish of the numerical model
In this study, the MIDAS/GTS NX finite element software was used to conduct a 3D numerical simulation and analysis of the shield tunnel passing beneath the elevated bridges N-1, N-2, and SW-1. Based on the spatial relationship between the shield tunnel of Section 5 in the Zhengjing section and the bridge pile groups, a finite element model was established (see Figure 4). For the modeling, the selected strata range was determined to analyze the impact of the shield excavation on the bridge. This model includes not only the nearby piers but also several relatively distant piers and pile foundations. The pier numbers for Bridge N-1 are 34#, 35#, 36#, 37#, and 38#, listed in ascending order; for Bridge N-2, the pier numbers are 16#, 17#, 18#, 19#, and 20#; for Bridge SW-1, the pier numbers are 29#, 30#, 31#, and 32#.
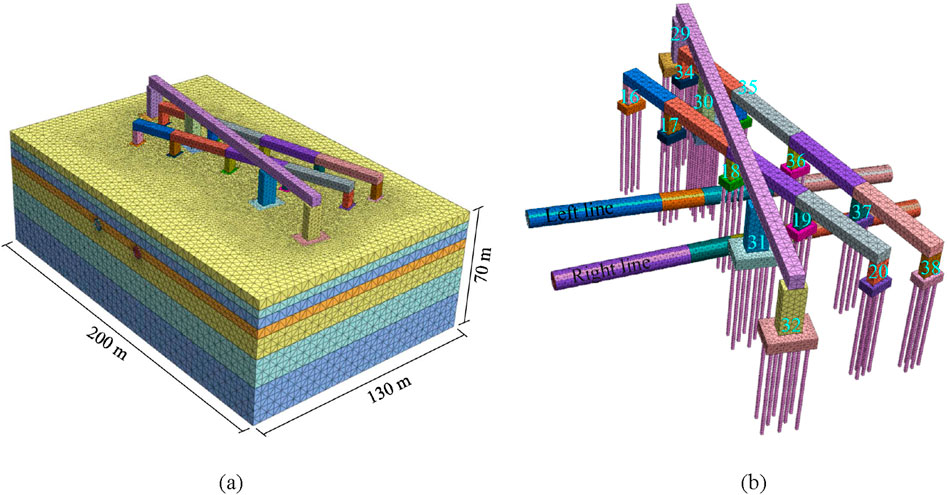
Figure 4. 3D model of the interval tunnel and the SW-1: (a) Overview of model; (b) Spatial relationship between shield tunnel and bridge pile group.
The surrounding rock and soil were modeled with solid elements using the Mohr-Coulomb yield criterion, with parameters derived from site investigation and laboratory tests (Table 2). To better reflect the nonlinear response of the ground during excavation, the simulation adopted a staged excavation approach, with appropriate stress redistribution at each stage to capture the construction-induced stress path and deformation evolution more realistically. The bridge piers and caps were also modeled with solid elements, using an elastic model. The shield tunnel segments were simulated with two-dimensional structural elements, while the bridge piles and isolation piles were modeled using one-dimensional structural elements. To accurately capture the interaction effects, interface elements were introduced between the tunnel lining and the surrounding soil to simulate potential slippage and separation. The pile–soil interaction was modeled using the embedded pile technique, which internally represents the relative displacement and force transfer mechanisms between piles and soil without requiring mesh conformity.
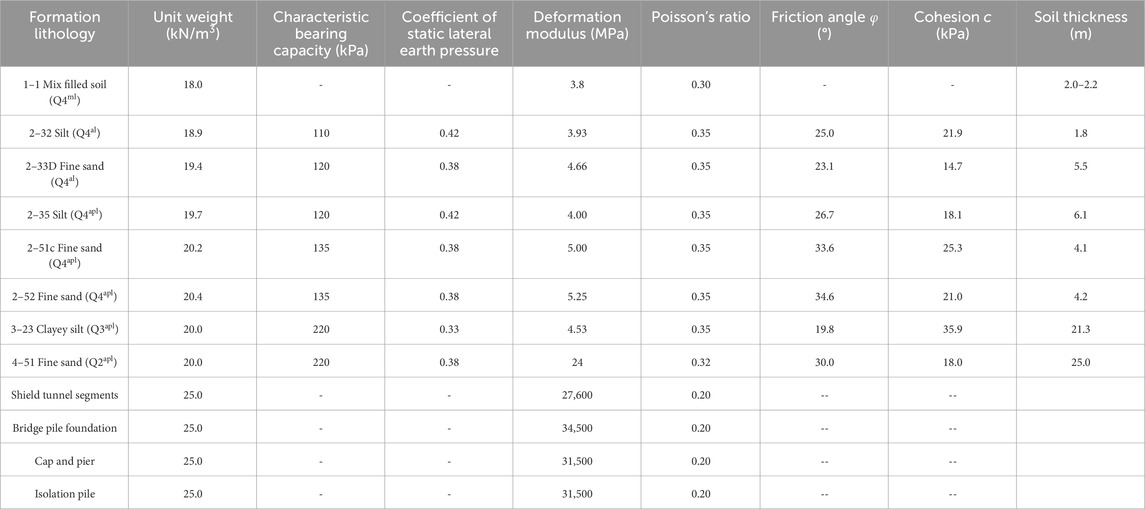
Table 2. Calculation parameters for the 3D numerical model.
According to Peck’s empirical formula i = K × z0 (Peck, 1969; O’reilly and New, 1982), where i is the settlement trough half-width, K is a soil-dependent coefficient, and z0 is the tunnel depth. The settlement influence zone typically extends at least 3i. With K = 0.6 and z0 = 20 m, 3i is about 36 m from each tunnel. Additionally, based on Article 19 of the Wuhan Urban Bridge and Tunnel Safety Management Regulations, the safety protection zone extends 50 m beyond the vertical projection of the bridge. Considering about 27 m spacing between the two tunnels and the 50 m safety zone on both sides, the X-direction model width was set to 200 m to fully capture the potential impact and avoid boundary effects. In the Y-direction, 130 m was selected to fully cover the tunnel–bridge interaction zone, and a 70 m depth in the Z-direction ensured adequate coverage of subsurface deformation. Accordingly, boundary conditions were applied at X = 0/200, Y = 0/130, and Z = −70 to encompass the entire affected area within the model. The loads on the pile foundation included the self-weight of the bridge, piers, sleepers, rails, and other auxiliary structures, along with the effect of the train load. Based on the above, a 3D calculation model was established in MIDAS/GTS. The geological model of the site was divided into a total of 410,950 solid elements and 1,643,800 nodes, while the caps, bridge piers, and pile foundations consisted of 26,030 structural elements and 97,140 nodes.
3.2 Calculation parameters
The physical and mechanical parameters of the surrounding rock strata, bridge pile foundations, bearing platform, bridge piers, and shield tunnel segments used in the simulation are shown in Table 2. These parameters were derived from laboratory tests, including compression and triaxial shear tests conducted on undisturbed samples, in accordance with the Code for Foundation Pit Engineering (DB42/T159-2012), and were further validated using regional engineering experience.
In addition, to further verify the model’s capability in representing the nonlinear behavior of the soil in this case, a main parameter sensitivity analysis was conducted by increasing and decreasing the original soil cohesion c and internal friction angle φ by 20%, respectively, to evaluate their influence on pier displacement. The analysis shows that the soil in the study area is predominantly sandy, and variations in c have a minimal impact on pier deformation. In contrast, changes in φ have a more significant effect. When φ was reduced by 20%, the maximum pier displacement increased by approximately 14%, indicating that a decrease in φ leads to greater pier movement. When φ was increased by 20%, the change in displacement was relatively small. The trends in the influence of cohesion and friction angle on soil and pier deformation were consistent with those observed for bridge piers. Thus, the simulation results are insensitive to changes in cohesion but show moderate sensitivity to φ. Nevertheless, within a reasonable range of parameter variation, the deformation patterns remained consistent, indicating that the numerical model exhibits a robust and reliable performance. Representative simulation results are shown in the figure below.
4 Analysis of numerical results
By analyzing the eight excavation steps, the impact of shield tunnel construction on the bridge pile groups can be comprehensively evaluated. The analysis of the calculation results is divided into two main parts. The first part focuses on the deformation characteristics of the bridge foundations, by simulating the changes in the shape of the bridge foundations during the shield tunnel construction process, the magnitude, direction, and variations in deformation as construction progresses are analyzed. The second part examines the impact of tunnel excavation on the existing bridges. This analysis takes into account various factors generated during the tunnel excavation, such as soil disturbance and stress changes, to determine the specific impact of shield tunnel construction on the adjacent pile foundations and upper bridges.
4.1 Analysis of bridge foundation deformation characteristics
4.1.1 Horizontal displacement of bridge piles
The construction of the shield tunnel is divided into multiple stages, significantly affecting the horizontal displacement of nearby pile foundations. Figure 5 illustrates the horizontal deformation contour map of the pile group during the tunnel excavation process.
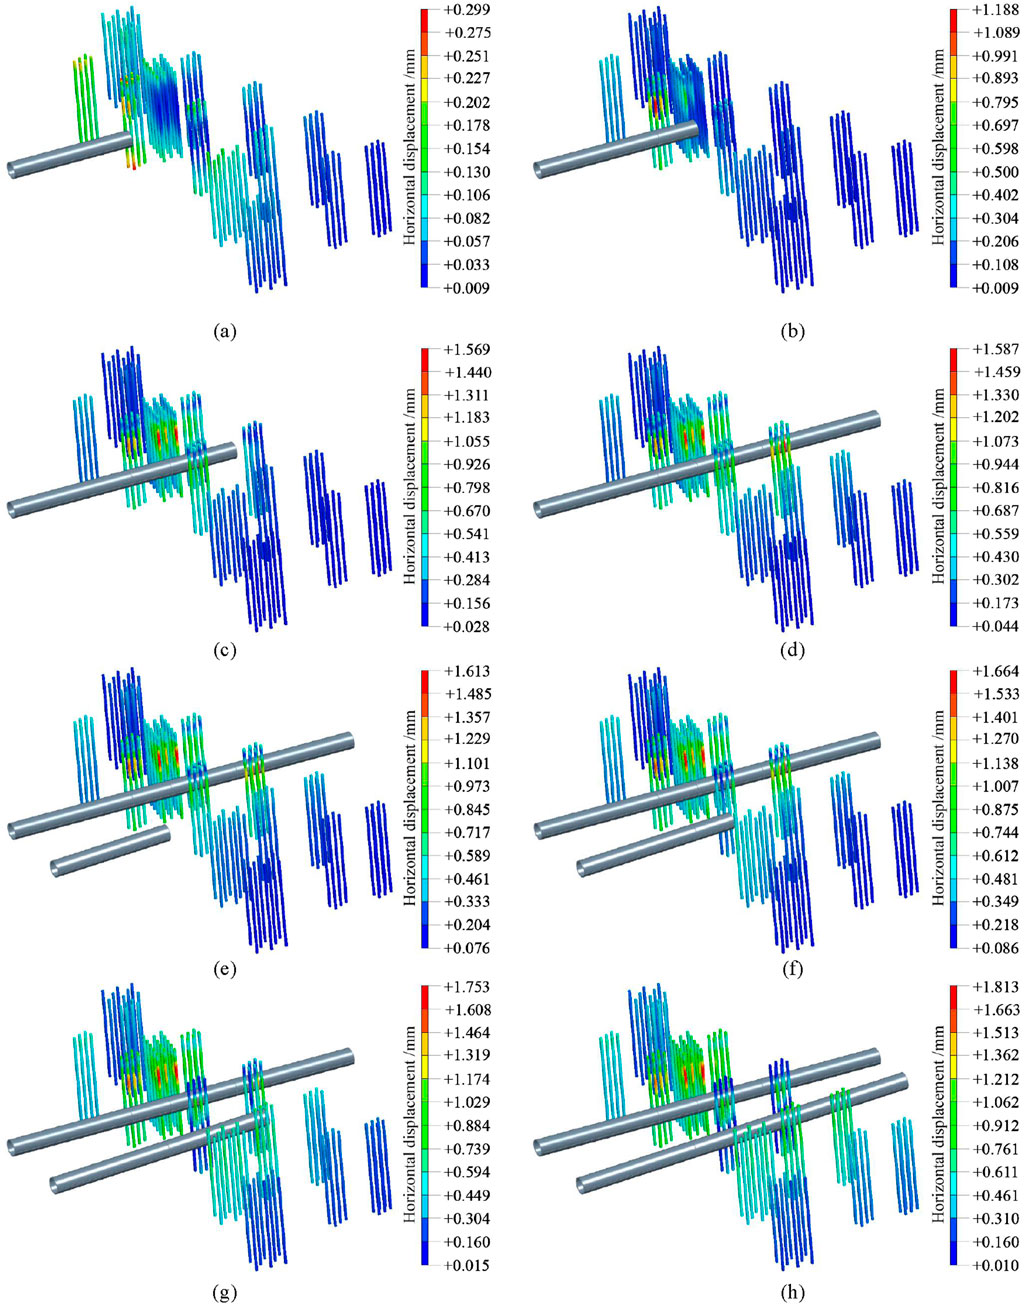
Figure 5. Cloud map of pile groups horizontal deformation during tunnel excavation process: (a) S1; (b) S2; (c) S3; (d) S4; (e) S5; (f) S6; (g) S7; (h) S8.
In the initial stage (S1), left-line excavation induced minimal soil disturbance but altered stress states, generating horizontal thrust and initial displacement. As S2, the disturbed area of the soil expands, further increasing the horizontal thrust on the pile foundation and resulting in greater horizontal displacement. By S3, the left tunnel’s midpoint position introduced complex stresses, with soil heave and friction further amplifying displacement. At S4, although the left-line tunnel has completely passed through, soil stress readjustment maintained a displacement level. During S5, similar horizontal thrusts occur, compounded by the existing effects from the left-line tunnel, which modifies the stress field around the pile foundation and introduces new influences on its horizontal displacement. At S6, the soil between the two tunnels experiences the combined effects of excavation from both sides, leading to a more complex stress state and increased horizontal displacement due to the horizontal forces resulting from the interaction of the two tunnels on the pile foundation. By S7, the soil disturbance around the right tunnel and continued influence from the left tunnel further elevated displacement. At S8, when both tunnels have been completely excavated, the combined effect of both tunnels maximized soil disturbance and thrust, resulting in the greatest horizontal displacement.
It can also be concluded that construction progresses, the range of horizontal displacement of the pile group gradually expands, initially concentrated around the pile foundations near the left-line tunnel excavation face in the S1 stage and progressively extending to multiple locations, ultimately encompassing the entire construction impact area by the S8 stage.
Figures 5, 6A show that from S1 to S4, during single-line excavation, the maximum horizontal displacement Dh of the pile group was 0.299 mm, 1.188 mm, 1.568 mm, and 1.587 mm, respectively. From S5 to S8, during double-line excavation, Dh of the pile group was 1.613 mm, 1.664 mm, 1.753 mm, and 1.813 mm, respectively. By calculating the rate of increase in Dh at each stage, the variation pattern can be observed. The significant increase from S1 to S2 is attributed to the rapid expansion of the disturbed soil zone caused by the left tunnel excavation, leading to increased horizontal thrust on the piles. The subsequent increases from S2 to S3 and S3 to S4 were lower, indicating a deceleration in the soil disturbance and, consequently, a slower growth rate of horizontal displacement. The small increase from S4 to S5 reflects the minimal initial impact of the right tunnel excavation. More substantial increases from S5 to S6 and S6 to S7 resulted from the right tunnel’s advancement and the intensified horizontal thrust due to the combined excavation effect. Finally, the reduced increase from S7 to S8 suggests that the pile foundation’s horizontal displacement approached its maximum as double-line excavation neared completion.
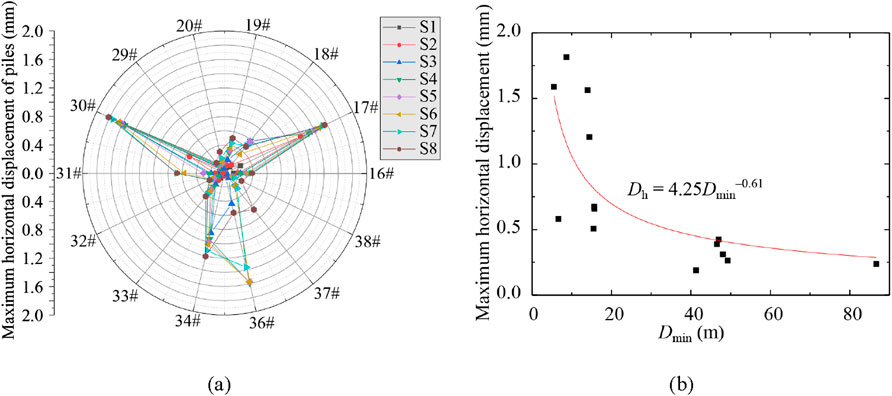
Figure 6. Statistical analysis of maximum deformation of bridge piles: (a) Maximum horizontal displacement; (b) Variation of maximum horizontal displacement with minimum distance Dmin.
By analyzing the maximum horizontal displacement of bridge piles at different positions (S1 to S8), as can be seen in Figure 6, the fitting function for the relationship between Dh of bridge piles and the Dmin can be obtained as Equation 1,
The maximum horizontal displacement of bridge piles is negatively correlated with the Dmin. Specifically, as the Dmin between the piles and the tunnel decreases, the maximum horizontal displacement increases, with a growth exponent of approximately 0.61. Although the fitting coefficient R2 = 0.72 indicates a moderate fit, the function still reflects the general trend of maximum horizontal displacement as a function of Dmin.
4.1.2 Settlement deformation of bridge piles
Figure 7 illustrates the displacement contour map of pile foundation settlement throughout the entire tunnel excavation process. Overall, as the shield tunnel excavation progresses, the pile settlement gradually increases. In the initial stages, piles located near the excavation site experience significant settlement, while settlement decreases with increasing distance from the tunnel. Additionally, piles located directly above the tunnel exhibit settlement due to the unloading effect of tunnel excavation, which reduces the effective stress in the overlying soil, leading to pile settlement. In contrast, piles below the tunnel may experience slight heave due to the compressive effects on the surrounding soil. As the excavation of the right tunnel proceeds, soil deformation becomes more pronounced, and the settlement area expands. Piles located between the two tunnels experience the most substantial settlement, as the soil in this region is influenced by the excavation on both sides, resulting in more complex stress conditions. Ultimately, when both tunnels are fully excavated, the extent of pile settlement reaches its maximum.
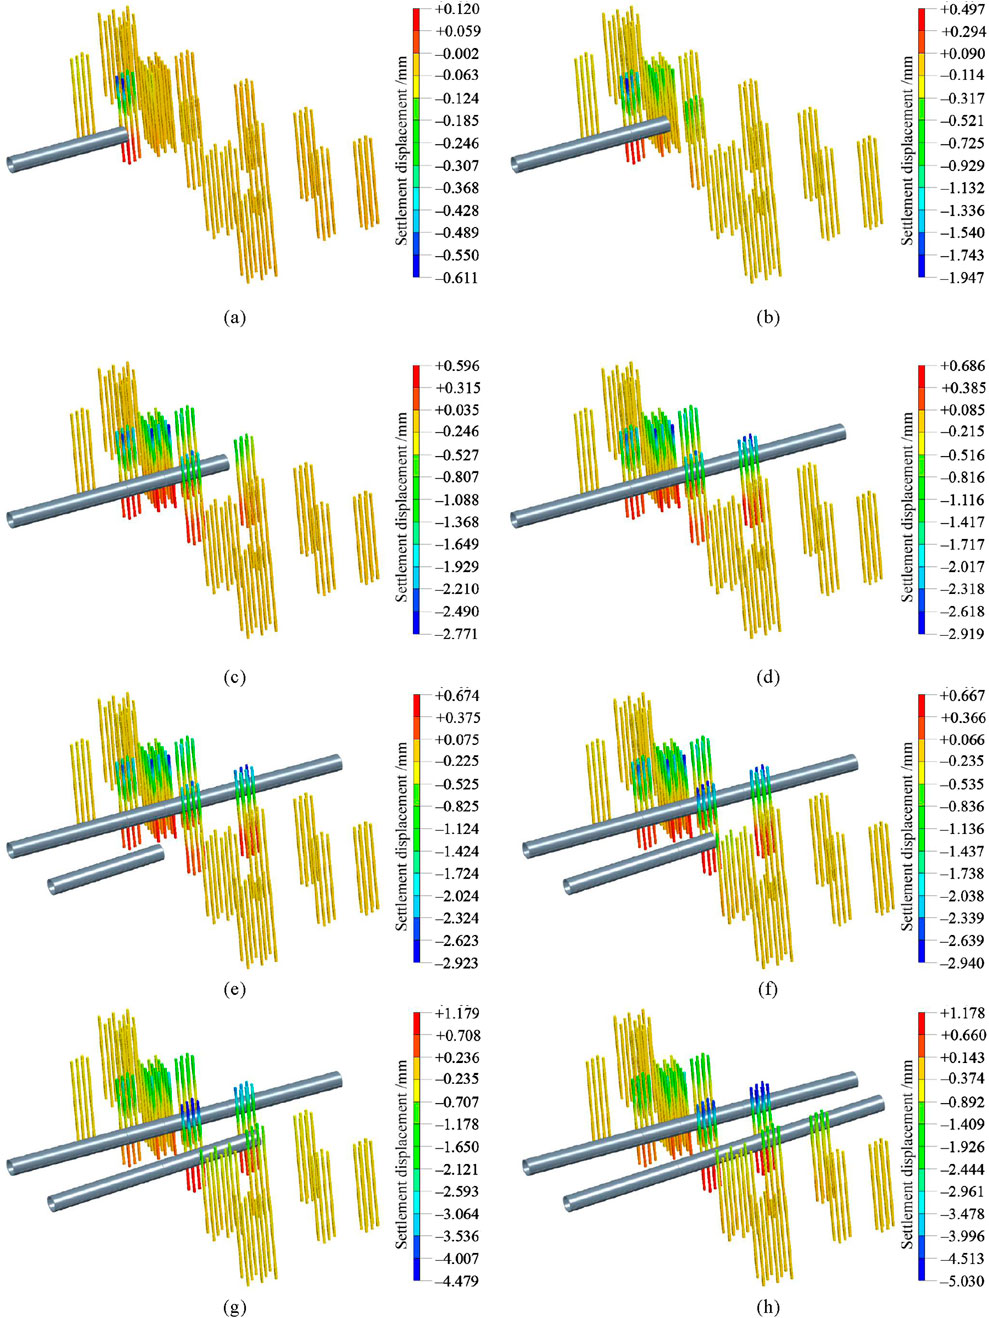
Figure 7. Settlement deformation contour of pile group during excavation (a) S1; (b) S2; (c) S3; (d) S4; (e) S5; (f) S6; (g) S7; (h) S8.
The maximum settlement Dv of pile foundations during different stages is analyzed as follows:
From S1 to S4, during the excavation of the shield tunnel on the left line, Dv was 0.611 mm, 1.947 mm, 2.771 mm, and 2.919 mm, respectively. The significant increase in Dv from S1 to S2 is mainly due to the advancement of the left-line tunnel from the edge near the pile cap to the middle section beneath the pile cap, where the disturbance to the soil increases rapidly, causing a sharp rise in pile settlement. From S2 to S4, the growth rates were 42.33% and 5.34%, respectively, indicating that while the disturbance to the soil continued to increase as the tunnel progressed, the rate of increase in pile settlement gradually slowed down.
Starting from stage S5, the excavation of both tunnels commenced. Dv during S5 to S8 was 2.923 mm, 2.940 mm, 4.479 mm, and 5.030 mm, respectively. The increase from S4 to S5 was only 0.14%, as the excavation of the right tunnel had just begun, having a relatively minor effect on pile settlement. The growth rates from S5 to S6 and S6 to S7 increased as the right-line tunnel progressed, with the soil between the two tunnels being affected by the excavation on both sides, leading to a more complex stress state and a faster increase in pile settlement. Finally, by the time both tunnels were fully excavated, the pile settlement was nearing its maximum, and the rate of increase had slowed down.
Through nonlinear fitting of the Dv and the Dmin between piles, as can be seen in Figure 8, the following relationship can be obtained as Equation 2,
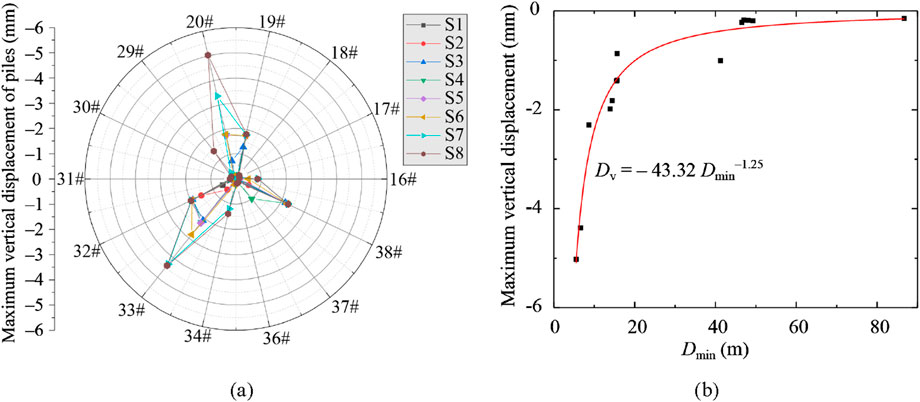
Figure 8. Statistical analysis of maximum vertical displacement of bridge piles: (a) Maximum vertical displacement; (b) Variation of maximum vertical displacement Dv with minimum distance Dmin.
As the Dmin between piles increases, Dv gradually decreases. The fitting coefficient R2 = 0.95 indicates that this negative exponential function provides a strong explanation of the relationship between Dv and Dmin, demonstrating high reliability. This relationship can serve as a reference for assessing pile settlement deformation induced by tunnel excavation.
4.2 Analysis of the impact of tunnel excavation on existing bridges
Tunnel excavation causes the release of soil stress, leading to the surrounding soil moving towards the tunnel, which exerts both horizontal and vertical forces on the bridge foundation. This is the primary reason for the deformation of the existing bridge. Additionally, as the tunnel advances through different stages, the extent of soil disturbance continuously changes. Combined with the interaction between multiple bridge piers and the process of soil stress adjustment, this results in varying degrees of settlement, longitudinal deformation, and transverse deformation of the existing bridge.
Figure 9 illustrates the cloud map of settlement and deformation of the bridge body during tunnel excavation. At S1, left tunnel excavation disrupted soil equilibrium, causing stress redistribution and subsequent soil shift around Pier #17, leading to pier and slight bridge settlement. By S2, the area of soil disturbance expanded further impacting Pier #17, with Pier #30 of Bridge S-2 also affected by stress transmission. During Stage S3, the left tunnel advanced to the middle section beneath the N-1 bridge’s pier cap, further intensifying soil disturbance around Piers #17, #18, and #30. Changes in soil stress increased the vertical forces on these piers’ foundations, causing pier settlement. In Stage S4, with the full passage of the left tunnel line, long-term soil deformation affected both the piers and the bridge. Stage S5 saw the excavation of the right tunnel line, which once again disturbed the soil equilibrium and redistributed stress. In Stage S6, as the right tunnel advanced, the disturbance expanded to a larger portion of Bridge N-2, significantly affecting Piers #18 and #31. This was due to their relative position to the tunnel and the cumulative effects of stress transmission in the soil. In Stage S7, the right tunnel advanced beneath the N-2 bridge pier cap towards the N-1 bridge, further expanding soil disturbance. At S8, complete tunnel passage subjected the N-2 bridge to combined influence, causing significant deformation alongside deformation of multiple piers and the bridge body, reaching maximum settlement.
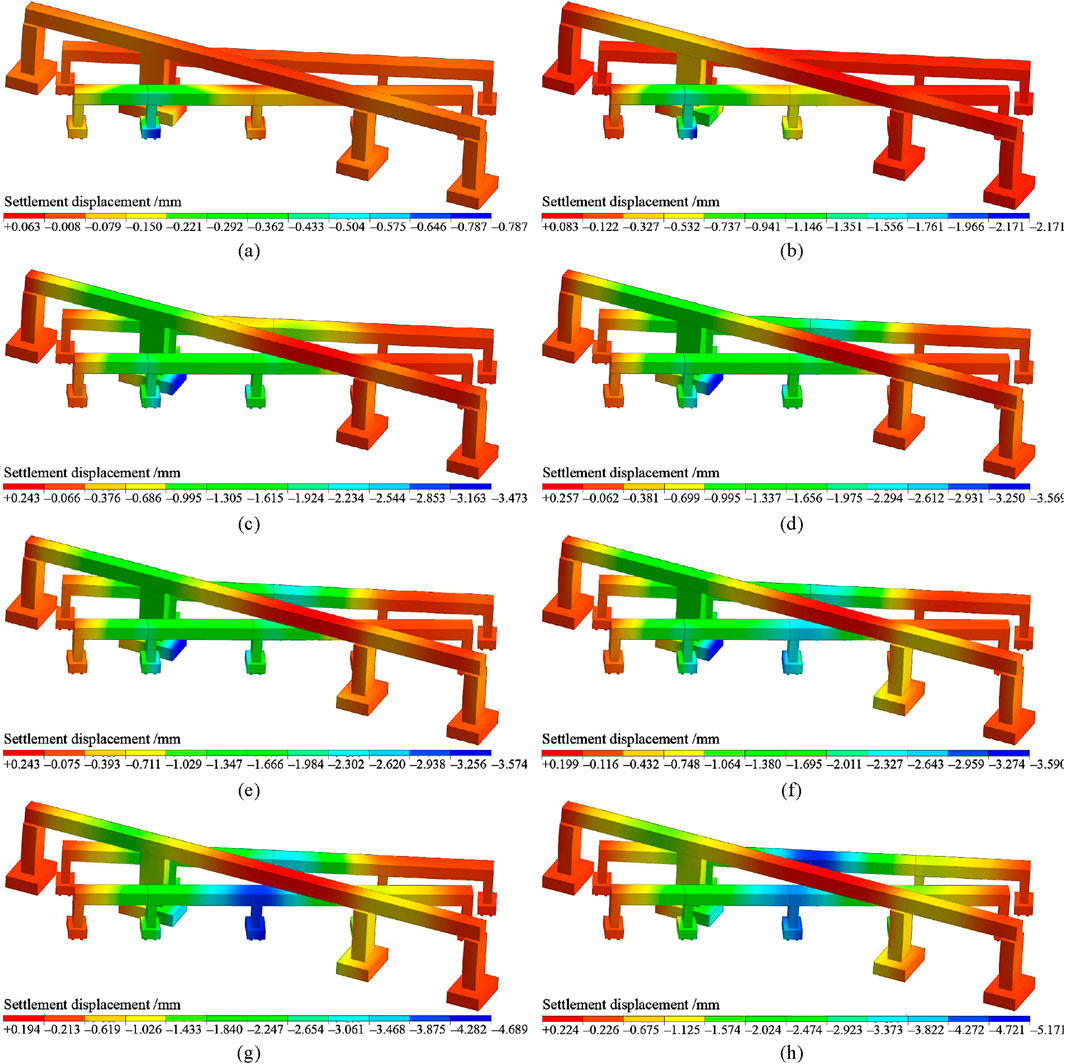
Figure 9. Settlement deformation contour of the bridge during excavation: (a) S1; (b) S2; (c) S3; (d) S4; (e) S5; (f) S6; (g) S7; (h) S8.
During tunnel construction, the maximum settlement of the piers and the bridge body exhibited distinct characteristics. During the excavation of the left shield tunnel, the maximum settlement gradually increased, reaching 0.787 mm, 2.376 mm, 3.473 mm, and 3.569 mm, respectively. The growth rate of maximum settlement was high in the early stages, then gradually slowed, with increases of 201.91%, 46.17%, and 2.76%. This indicates that the impact on the piers and the bridge body was more pronounced during the initial excavation of the left tunnel. As the tunnel progressed, the rate of impact growth gradually slowed. This is due to the fact that the initial excavation of the left tunnel disrupted the soil’s original equilibrium, causing a significant redistribution of soil stress, leading to rapid deformation in the areas close to the tunnel. However, as the tunnel advanced, the soil began to adapt to the new stress state, resulting in a reduction in the rate of deformation growth.
Similarly, during the right shield tunnel excavation, the maximum settlement also showed a rising trend, reaching 3.574 mm, 3.590 mm, 4.689 mm, and 5.171 mm, with corresponding growth rates of 0.45%, 30.61%, and 10.28%. Settlement continued to increase during this stage, though the growth rate was unstable. On the one hand, the excavation of the right tunnel once again disturbed the soil equilibrium, and combined with the effects of the left tunnel, created a more complex stress condition in the soil, impacting the piers and bridge body. From Stage S5 to S6, the growth rate was relatively low, as the right tunnel excavation had just started, resulting in a smaller impact. However, from Stage S6 to S7, the growth rate was higher because the right tunnel had advanced to a critical position, intensifying the impact on the soil and existing structures. Finally, from S7 to S8, the growth rate decreased again as the tunnel passed through the critical area, and the soil stress gradually stabilized.
If the deformation caused by tunnel construction becomes too large, it can affect the normal operation of the bridge. According to Article 7.3.10 of the Code for Design of High-Speed Railways (TB10621-2014), the settlement of pier foundations should be calculated based on dead load, and the post-construction settlement should not exceed the limit of 20 mm. The calculation results in this study show that the impact of shield tunnel excavation on the bridge meets the regulatory requirements, ensuring that it complies with the standards for the normal operation of the dedicated railway line.
Figure 10 illustrates the horizontal displacement of the bridge deck and piers during the tunnel excavation process. At S1, soil disturbance near N-2’s Pier 17 causes displacement in the adjacent bridge deck, while SW-1 experiences minor displacement due to altered soil stress, influenced by the 70° skew angle between the tunnel and N-2. At S2, increased disturbance around Pier 17 further displaces the N-2 deck, and SW-1’s displacement grows with the expanding range of soil stress transmission. At S3, the range of soil stress influence extends to more areas of the SW-1, causing various degrees of horizontal displacement along the bridge deck, with the maximum displacement occurring near Pier 30. By S4, the impact of soil disturbance spreads to different sections of the three bridges, resulting in an expansion of vertical deformation. By S5, Pier 31 and the bridge deck near the right-side tunnel are increasingly affected. At S6, further soil disturbance increases Pier 31’s horizontal displacement, but bridge deck displacement lessens as stress redistributes. At S7, with the right-line tunnel passing N-2 and nearing N-1, concentrated stress near Pier 31 causes significant horizontal displacement. By S8, after tunnel completion, combined effects influence all three bridges with complex stress patterns and widespread horizontal displacement.
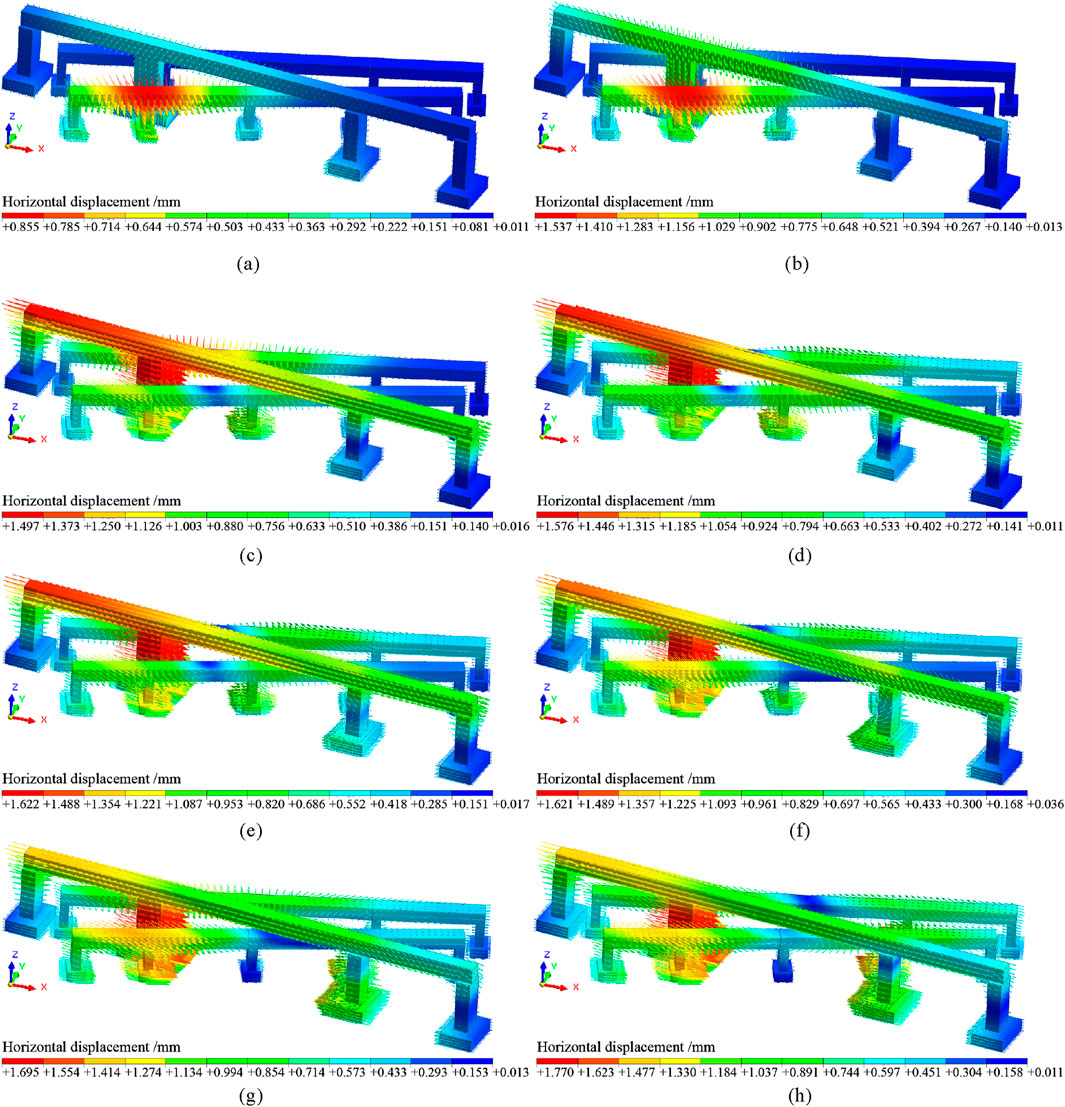
Figure 10. Horizontal deformation contour of the bridge during excavation: (a) S1; (b) S2; (c) S3; (d) S4; (e) S5; (f) S6; (g) S7; (h) S8.
The analysis of the maximum horizontal displacement affecting the existing bridge piers and deck during the various stages of tunnel excavation is as follows.
(1) From S1 to S4, the maximum horizontal displacement of the existing bridge exhibited variation characteristics. As for the maximum horizontal displacement, the values for the bridge deck and piers were 0.855 mm, 1.537 mm, 1.497 mm, and 1.576 mm, respectively. As for the rate of increase in maximum horizontal displacement, the rate from S1 to S2 was 80%, indicating a significant increase and highlighting that the initial advancement of the left-line tunnel had a notable impact on the horizontal displacement of the existing bridge. In stage S3, the maximum horizontal displacement was slightly lower than in the S2 stage, due to changes in soil stress distribution and the partial release of stress. The rate of increase from S3 to S4 was 5.28%, showing a slower growth rate, suggesting that in the later stages of the left-line tunnel construction, the growth in horizontal displacement of the existing bridge slowed down.
From S5 to S8, the maximum horizontal displacements were 1.622 mm, 1.621 mm, 1.695 mm, and 1.770 mm, respectively. The corresponding rates of increase in maximum horizontal displacement were −0.06%, 4.57%, and 4.43%. It can be seen that during the right-line tunnel construction, the increase in maximum horizontal displacement fluctuated slightly at different stages, but the overall growth rate remained relatively slow.
5 Comparison of the monitoring and numerical simulation
5.1 Bridge deformation monitoring scheme
To ensure the safety and stability of surrounding bridge piles during the shield tunnel excavation, the deformation of nearby bridge piles were monitored, focusing on the piles in specific regions (Piles 16–20, Piles 34–38, and Piles 31–33). Three displacement sensors were installed on each pier to measure both settlement and horizontal displacement, as shown in the detailed layout in Figure 1D. The sensors have a measurement accuracy of ±0.01%. The settlement deformation of the bridge piers on site was directly measured by the displacement sensors.
As for the monitoring method for the tilting deformation of bridge piers, it is illustrated in Figure 1E. Two displacement sensors were installed at the top and bottom of the piers. By measuring the relative horizontal displacement between the two monitoring points and the distance between these points, the tilt angle T can be calculated using the Equation 3:
where d1 represents the displacement of the upper part of the pier (mm), d2 represents the displacement of the lower part of the pier (mm), and h refers to the distance between the two measurement points (mm), as shown in Figure 1E.
5.2 Comparison of pier settlement results
During tunnel excavation, the settlement deformation of different bridge piles varies based on their proximity to the tunnel and the geological conditions. By analyzing the relationship between the settlement of different bridge piles and various excavation stages through numerical simulations and on-site monitoring, the results are shown in Figure 11 and Table 3. The analysis is as follows:
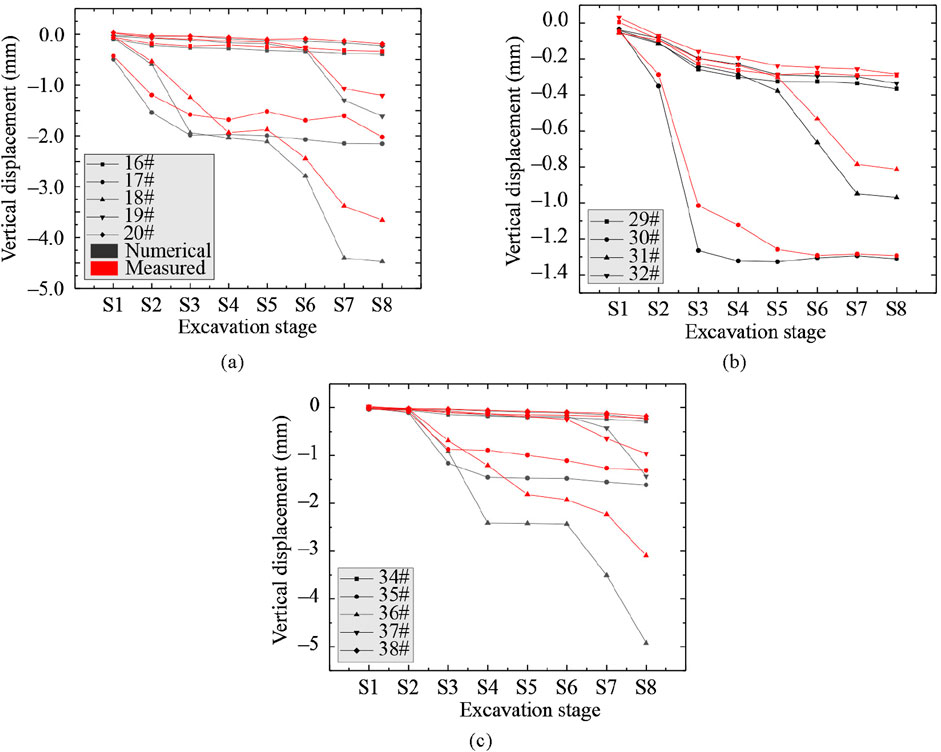
Figure 11. Comparison of measured and numerical simulation values of bridge pile settlement deformation at different excavation stages: (a) N-1; (b) SW-1; (c) N-2.
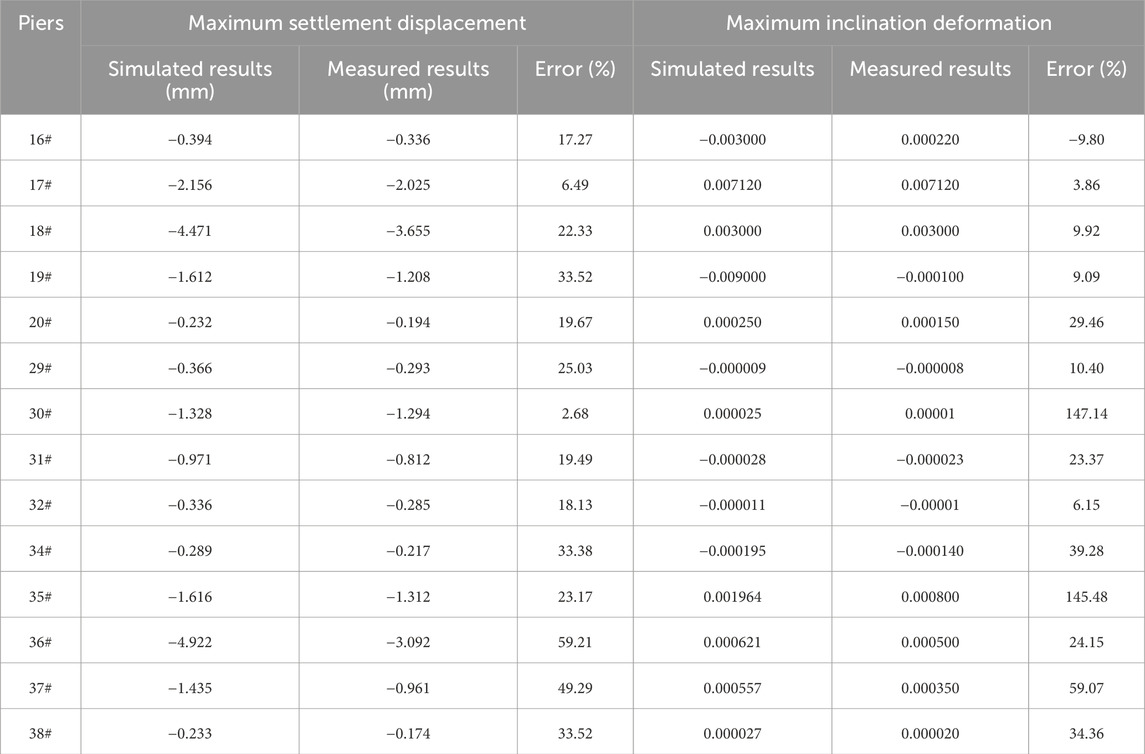
Table 3. Comparison between simulated and measured results of maximum settlement and inclination deformation of piers.
Settlement characteristics of the N-1 bridge: Piers 16# and 20# are located relatively far from the shield tunnel, and their displacements remain close to zero throughout the entire tunnel excavation process. This is mainly due to the weakening of soil stress transmission as the distance increases. Piers 17# and 18# are located closer to the tunnel and are significantly affected by the excavation stages. In stages S1–S4, the settlement increases rapidly as the left-line tunnel approaches and passes near these two piers. The redistribution of soil stress causes the surrounding soil to move toward the tunnel, resulting in settlement of the pier s. In stages S5–S8, the settlement of Pier 17# stabilizes at around 2 mm because, after the left-line tunnel construction is completed, the soil stress gradually stabilizes. However, the settlement of Pier 18# continues to increase as the excavation progresses. This is due to the right-line tunnel excavation further affecting the soil stress distribution around this pier. Pier 19#, which is closer to the right-line tunnel, begins to show settlement in stages S7–S8, as the right-line tunnel excavation reaches the vicinity of this pier, breaking the soil stress balance again.
All piers of the SW-1 bridge experienced varying degrees of settlement due to the tunnel excavation, with the settlement values gradually increasing as the excavation progressed. Piers 30# and 31# were the most significantly affected. Pier 30# experienced rapid settlement growth during stages S1–S4, reaching its maximum value. From stages S4–S8, the settlement stabilized at around 1.3 mm. Pier 31# showed a sudden change in settlement after stage S5, with the settlement value increasing rapidly, reaching a maximum of about 0.8 mm. Piers 29# and 32# were relatively less affected, with maximum settlement values of only about 0.3 mm, due to their greater distance from the tunnel. The bridge piers 35# and 36# of the N-2 bridge were significantly affected by tunnel excavation. In stage S3, settlement began to increase, with the maximum settlement of pier 36# reaching 3 mm. The 34# pier experienced relatively small settlement, about 0.2 mm, due to its greater distance from the tunnel. In stage S7, the 37# pier showed an increase in settlement, although the maximum value was less than 1 mm.
Overall, bridge piers closer to the tunnel (such as piers 17# and 18#) were significantly impacted during the early stages of excavation, while piers farther away (such as piers 16# and 20#) experienced minimal displacement. Certain stages, such as S7 and S8, caused additional settlement in nearby piers like 19# and 37#. Comparison between simulated and measured results (Table 3) shows that the numerical simulations slightly overestimate settlement values, with errors generally within 20%–35% for most piers. Nevertheless, the simulated and measured trends are consistent, indicating that the numerical model can reasonably reflect the actual settlement behavior of the bridge piers.
5.3 Comparison of bridge pier inclination deformation
Tunnel excavation induces lateral pressure and uneven settlement on nearby bridge piers, leading to changes in pier tilt. At different excavation stages, the relative position between the tunnel and the piers constantly changes, and the disturbance to the surrounding soil varies, causing the tilt of the piers to exhibit different trends over time. As shown in Figure 12 and Table 3, the relationship between pier tilt and the excavation stages for different bridges and piers is as follows: Similar to the settlement characteristics, piers closer to the tunnel (such as 17#, 18#, 30#, 31#, 35#, and 36#) were more affected by the excavation, showing significant changes in tilt, with the maximum tilt reaching 0.008. The maximum inclination deformation varied from 0.0001 to 0.008, with an average value of approximately 0.0023. Among them, piers 17#, 30#, 31#, 35#, and 36# exhibited relatively larger inclination magnitudes, whereas piers farther from the tunnel generally showed negligible tilt changes. In contrast, piers located farther from the tunnel (such as 20#, 32#, and 34#) were less affected, with minor or nearly zero tilt changes. During the left-line tunnel excavation stages, the tilt of piers near the left-line tunnel gradually increased. In the right-line tunnel excavation stages, the tilt of piers closer to the right-line tunnel, as well as those already impacted by the left-line tunnel and now further affected by the right-line tunnel, continued to change or experienced sudden shifts. When the tunnel excavation reached directly beneath a pier’s central position, the pier’s tilt often peaked, reflecting the increased impact from the excavation-induced soil stress redistribution.
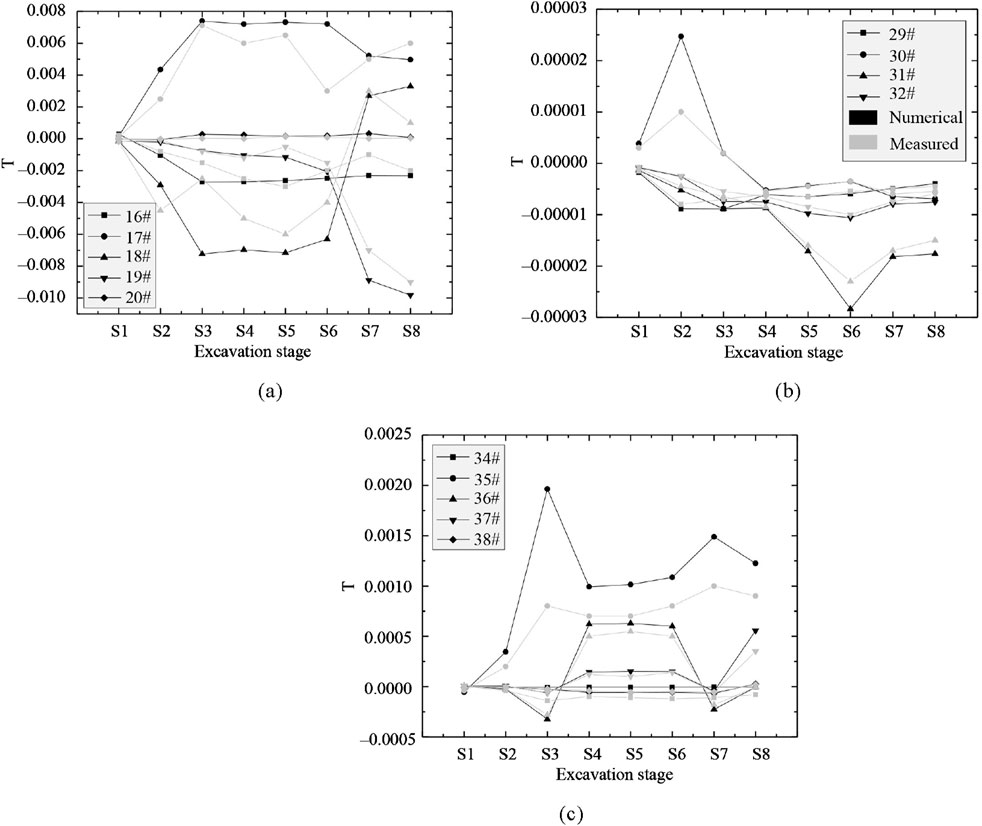
Figure 12. Comparison of measured and numerical simulated values of bridge pier inclination deformation at different excavation stages: (a) N-1; (b) SW-1; (c) N-2.
The positive and negative tilt values reflect the direction of the pier inclination. Based on the tunnel’s true north direction and the angle it intersects with the bridges, it can be determined that the piers of the N-1, N-2, and SW-1 tilt approximately towards 15° south-east, 20° south-west, and 74° south-west, respectively. Assuming the top of the pier tilting away from the tunnel (southward) is positive, and tilting towards the tunnel (northward) is negative, the inclination directions of the piers are analyzed as follows:
(1) Piers 16#, 30#, 31#, and 37# have negative tilt, indicating that during tunnel excavation, the top of these piers leaned northward under the load, but the tilt magnitude was relatively small.
(2) Piers 17#, 35#, and 36# show positive tilt, indicating that their tops leaned southward due to the lateral pressure exerted by the left-line tunnel excavation.
(3) Pier 18# initially had negative tilt, but later shifted to positive, indicating that its tilt direction changed during different excavation stages. This was caused by the complex effects of both the left-line and right-line tunnel excavations, which altered the stress distribution around the pier at different stages, leading to a change in tilt direction.
In summary, the inclination of various bridge piers is closely related to factors such as the excavation stage of the tunnel, the clear distance, the excavation direction, and the position of the bridge. As shown in Table 3 and Figure 12, the trend of inclination changes observed in the numerical simulation results aligns well with the field monitoring data, indicating the reliability of the numerical simulation calculations. Specifically, the maximum inclination deformation errors at 14 monitoring points range from −9.80% to 147.14%. While a few monitoring points show large deviations, likely due to local construction disturbances or soil heterogeneity, more than half of the errors are within ±30%, and several values are under ±10% (e.g., −9.80%, 3.86%, 6.15%, 9.09%). These results demonstrate that the model can reasonably predict both the magnitude and trend of pier inclination during shield tunneling, supporting its applicability in similar engineering scenarios.
6 Discussions
Existing research on tunnel-pile foundation interaction primarily focuses on single tunnel excavation scenarios, typically analyzed through plane strain models that treat tunnel construction as a singular load source (Zheng, 2024; Wang et al., 2025). However, centrifuge experiments and numerical simulations demonstrate that twin tunnel construction induces fundamentally different soil displacement patterns, characterized by a “double-peaked” settlement trough rather than the “single-peaked” morphology of single tunnels (Yang et al., 2022; Mirhabibi and Soroush, 2020). Studies of actual engineering cases, such as the Shiraz subway line (Nematollahi and Dias, 2018) and Sydney’s central business district (Khabbaz et al., 2019), reveal that twin tunnel excavation involves complex dynamic processes of multi-stage stress release and structural interaction, significantly affecting adjacent pile foundations through stress redistribution and physical obstruction effects (Soomro et al., 2020). This study expands previous research by examining multi-stage twin shield tunnel excavation effects on pile foundations, a critical aspect neglected in single-tunnel studies. The analysis shows that twin tunnel excavation generates more complex stress fields than single tunnel scenarios, leading to greater pile displacement and settlement. A finding is the negative exponential relationship between pile-tunnel spacing and deformation. These insights provide valuable guidance for deformation control in complex tunneling environments.
However, the study has limitations. While focusing on pile-tunnel spacing effects, it does not fully consider other influential factors like pile group arrangement or shield tunneling methods. Additionally, the analysis primarily addresses short-term construction effects, lacking long-term monitoring data to assess pile group stability over extended periods. Future research should incorporate these aspects to develop more comprehensive stability assessment systems.
7 Conclusion
Based on the construction project of Zhengzhou Metro Line five crossing the North Up Connection Bridge, North Down Connection Bridge, and Southwest Up Connection Bridge, a 3D finite element model was established to analyze the effects of multi-stage double-line shield tunnel construction on the deformation of high-speed railway bridge piers and pile foundations. The influence of pile-tunnel distance on bridge deformation was examined, and settlement characteristics were validated against field monitoring data. The research findings are as follows:
(1) Shield tunnel construction, divided into multiple stages, significantly affected the horizontal displacement and settlement of adjacent pile foundations. During stages S1 to S4, corresponding to single-line excavation, the maximum horizontal displacement reached 1.587 mm and the settlement reached 2.919 mm. As excavation progressed to stages S5 to S8, representing double-line excavation, the maximum horizontal displacement increased to 1.813 mm and the settlement increased to 5.030 mm.
(2) A nonlinear fit was conducted to analyze the relationship between the maximum horizontal deformation of the bridge piles (from S1 to S8) and the minimum clear distance between the piles and the tunnel. The results show that as the clear distance increases, the maximum horizontal displacement of the bridge piles decreases. Similarly, the maximum settlement displacement gradually decreases with increasing clear distance between the piles and the tunnel. The nonlinear fitting formula used in this study effectively quantifies this relationship.
(3) Each stage of tunnel excavation impacted the existing bridge piers and superstructure. During the initial excavation stages, the maximum settlement deformation of the piers and superstructure gradually increased from 0.787 mm to 3.569 mm, with an early growth rate of 201.91%. The maximum horizontal displacement increased from 0.855 mm to 1.576 mm, with an 80% increase from stage S1 to stage S2. As tunnel excavation progressed, the rate of increase slowed, but the maximum deformation continued to grow, reaching 5.171 mm for settlement and 1.770 mm for horizontal displacement.
(4) A comparison between field monitoring and numerical simulation results reveals differences in the settlement deformation patterns and magnitudes for different bridge piers based on their proximity to the tunnel. Bridge piers closer to the tunnel (e.g., Pier 17 and Pier 18) experienced significant impact early in the excavation process, with noticeable changes in both settlement (the vertical displacement of the structure) and inclination (the tilt or leaning of the structure). The maximum settlement and maximum inclination for these piers reached 4.5 mm and 0.008, respectively. In contrast, piers located farther from the tunnel (e.g., Pier 16 and Pier 20) showed minimal displacement, with movements close to 0. When the tunnel reached stages S7-S8, piers adjacent to the excavation, such as Pier 19 and Pier 37, exhibited significant settlement, with a maximum of 3 mm. The trends observed in numerical calculations closely matched the field monitoring data, indicating that the model used in this study can effectively assess deformation in bridge pier groups due to tunnel excavation, and the results are reasonably reliable.
Overall, according to relevant standards and regulations, the simulated effects of the shield tunnel excavation on the existing bridge meet the required specifications, and the post-construction settlement remains within the prescribed safety limits, ensuring the continued safe operation of the bridge.
Data availability statement
The original contributions presented in the study are included in the article/supplementary material, further inquiries can be directed to the corresponding author.
Author contributions
LD: Investigation, Methodology, Resources, Writing – original draft. JL: Data curation, Formal Analysis, Software, Writing – original draft. CH: Investigation, Resources, Validation, Writing – original draft. SY: Data curation, Software, Writing – original draft. JH: Supervision, Validation, Visualization, Writing – review and editing. CW: Conceptualization, Funding acquisition, Project administration, Writing – review and editing.
Funding
The author(s) declare that financial support was received for the research and/or publication of this article. We acknowledge the financial support by the Natural Science Foundation of Hubei Province (2024AFB434).
Conflict of interest
Authors LD and JH were employed by Hubei 9D Mapping and Design Co., Ltd. Author SY was employed by China Railway Siyuan Survey and Design Group Co., Ltd.
The remaining authors declare that the research was conducted in the absence of any commercial or financial relationships that could be construed as a potential conflict of interest.
Generative AI statement
The author(s) declare that no Generative AI was used in the creation of this manuscript.
Publisher’s note
All claims expressed in this article are solely those of the authors and do not necessarily represent those of their affiliated organizations, or those of the publisher, the editors and the reviewers. Any product that may be evaluated in this article, or claim that may be made by its manufacturer, is not guaranteed or endorsed by the publisher.
References
Awad, F. A., Graham, D. J., AitBihiOuali, L., and Singh, R. (2023). Performance of urban rail transit: a review of measures and interdependencies. Transp. Rev. 43, 698–725. doi:10.1080/01441647.2023.2166146
Basack, S., Nimbalkar, S., and Zaman, M. (2023). Recent developments in pile foundations: design, construction, innovations and case studies. Int. J. Geotechnical Eng. 17, 581–582. doi:10.1080/19386362.2023.2380106
Chen, L. T., Poulos, H. G., and Loganathan, N. (1999). Pile Pile Responses Caused by Tunnelingesponses caused by tunneling. J. Geotechnical and Geoenvironmental Eng. 125 (3), 207–215. doi:10.1061/(asce)1090-0241(1999)125:3(207)
Chen, Y., Wang, X., Sun, C., and Zhu, B. (2024). Exploring the failure mechanism of light poles on elevated bridges under high winds. Eng. Fail. Anal. 159, 108076. doi:10.1016/j.engfailanal.2024.108076
Cheng, C., Dasari, G., Chow, Y., and Leung, C. (2006). Finite element analysis of tunnel–soil–pile interaction using displacement controlled model. Tunn. Undergr. Space Technol. incorporating Trenchless Technol. Res. 22 (4), 450–466. doi:10.1016/j.tust.2006.08.002
Franza, A., and Marshall, M. A. (2018). Centrifuge modeling study of the response of piled structures to tunneling. J. Geotechnical and Geoenvironmental Eng. 144 (2), 04017109. doi:10.1061/(ASCE)GT.1943-5606.0001751
Hong, Y., Soomro, M., and Ng, C. (2015). Settlement and load transfer mechanism of pile group due to side-by-side twin tunnelling. Comput. and Geotechnics 64 (3), 105–119. doi:10.1016/j.compgeo.2014.10.007
Huang, J., Liu, J., Guo, K., Wu, C., Yang, S., Luo, M., et al. (2024a). Numerical simulation study on the impact of deep foundation pit excavation on adjacent rail transit structures—a case study. Buildings 14, 1853. doi:10.3390/buildings14061853
Huang, J., Liu, J., Guo, K., Yang, S., Lu, Y., Wu, C., et al. (2024b). Evaluation method of the impact of twin shield tunneling construction on elevated bridges: case study. Symmetry 16 (9), 1113. doi:10.3390/sym16091113
Ismail, M. A. M., Lim, P. S., and Tay, W. W. (2015). Finite element analysis of tunnelling induced deformation towards pile foundation. Appl. Mech. Mater. 4197 (802-802), 28–33. doi:10.4028/www.scientific.net/AMM.802.28
Khabbaz, H., Gibson, R., and Fatahi, B. (2019). Effect of constructing twin tunnels under a building supported by pile foundations in the Sydney central business district. Undergr. Space 4 (4), 261–276. doi:10.1016/j.undsp.2019.03.008
Kitiyodom, P., Matsumoto, T., and Kawaguchi, K. (2005). A simplified analysis method for piled raft foundations subjected to ground movements induced by tunnelling. Int. J. Numer. Anal. methods geomechanics 29 (15), 1485–1507. doi:10.1002/nag.469
Kong, S. M., Jung, H. S., and Lee, Y. J. (2017). Investigation of ground behaviour adjacent to an embedded pile according to various tunnel volume losses. Int. J. Geo Eng. 8 (5), 5–15. doi:10.1186/s40703-017-0043-1
Lee, Y. J., and Bassett, R. H. (2007). Influence zones for 2D pile–soil-tunnelling interaction based on model test and numerical analysis. Tunn. and Undergr. Space Technol. 22 (3), 325–342. doi:10.1016/j.tust.2006.07.001
Li, Z., Chen, Z., Wang, L., Zeng, Z., and Gu, D. (2002). Numerical simulation and analysis of the pile underpinning technology used in shield tunnel crossings on bridge pile foundations. Undergr. Space 6 (4), 396–408. doi:10.1016/j.undsp.2020.05.006
Liu, J., Xue, B., Wang, H., Zhang, X., and Zhang, Y. (2023). Numerical study on the behavior of an existing tunnel during excavating adjacent deep foundation pit. Sustainability 15, 9740. doi:10.3390/su15129740
Loganathan, N., Poulos, H. G., and Stewart, D. P. (2000). Centrifuge model testing of tunnelling-induced ground and pile deformations. Géotechnique 50 (3), 283–294. doi:10.1680/geot.2000.50.3.283
Lowry, K., and Rayhani, M. T. (2024). Factors affecting axial and lateral load transfer of hollow fibre-reinforced polymer piles in soft clay. Int. J. Geotechnical Eng. 17, 644–653. doi:10.1080/19386362.2024.2344410
Lueprasert, P., Jongpradist, P., and Suwansawat, S. (2017). Numerical investigation of tunnel deformation due to adjacent loaded pile and pile-soil-tunnel interaction. Tunn. and Undergr. Space Technol. 70 (10), 166–181. doi:10.1016/j.tust.2017.08.006
Matsumoto, T., Kitiyodom, P., Matsui, H., and Katsuzaki, Y. (2004). Monitoring of load distribution of the piles of a bridge during and after construction. Soils Found. 44, 109–117. doi:10.3208/sandf.44.4_109
Mirhabibi, A., and Soroush, A. (2020). Three-dimensional simulation of interaction between surface buildings and twin tunnelling regarding the surface settlement. Geotechnical Geol. Eng. 38, 5143–5166. doi:10.1007/s10706-020-01353-y
Nematollahi, M., and Dias, D. (2018). Three-dimensional numerical simulation of pile-twin tunnels interaction – case of the Shiraz subway line. Tunn. Undergr. Space Technol. 86, 75–88. doi:10.1016/j.tust.2018.12.002
Ng, C., Lu, H., and Peng, S. (2013). Three-dimensional centrifuge modelling of the effects of twin tunnelling on an existing pile. Tunn. Undergr. Space Technol. incorporating Trenchless Technol. Res. 35, 35189–35199. doi:10.1016/j.tust.2012.07.008
Ng, C., Soomro, M., and Hong, Y. (2014). Three-dimensional centrifuge modelling of pile group responses to side-by-side twin tunnelling. Tunn. Undergr. Space Technol. incorporating Trenchless Technol. Res. 43, 43350–43361. doi:10.1016/j.tust.2014.05.002
O'reilly, M. P., and New, B. M. (1982). Settlements above tunnels in the United Kingdom-their magnitude and prediction.
Peck, B. B. (1969). Deep excavation and tunnelling in soft ground, State of the art volume[C]//7th ICSMFE, 4: 225–290.
Reese, L., Van Impe, W. F., and Holtz, R. (2002). Single piles and pile groups under lateral loading. Appl. Mech. Rev. 55, B9–B10. doi:10.1115/1.1445326
Schweiger, F. H., Thurner, R., and Pöttler, R. (2001). Reliability analysis in geotechnics with deterministic finite elements theoretical concepts and practical application. Int. J. Geomechanics 1 (4), 389–413. doi:10.1061/(ASCE)1532-3641(2001)1:4(389)
Sohaei, H., Namazi, E., Hajihassani, M., and Marto, A. (2020). A review on tunnel–pile interaction applied by physical modeling. Geotechnical Geol. Eng. 38 (4), 3341–3362. doi:10.1007/s10706-020-01240-6
Soomro, M. A., Hong, Y., Ng, C. W. W., Lu, H., and Peng, S. (2015). Load transfer mechanism in pile group due to single tunnel advancement in stiff clay. Tunn. Undergr. Space Technol. incorporating Trenchless Technol. Res. 45 (2), 63–72. doi:10.1016/j.tust.2014.08.001
Soomro, M. A., Liu, K., Mangnejo, D. A., and Mangi, N. (2022). Effects of twin excavations with different construction sequence on a brick masonry wall: 3D finite element approach. Structures 41, 866–886. doi:10.1016/j.istruc.2022.05.060
Soomro, M. A., Mangi, N., Xiong, H., Kumar, M., and Ali Mangnejo, D. (2020). Centrifuge and numerical modelling of stress transfer mechanisms and settlement of pile group due to twin stacked tunnelling with different construction sequences. Comput. Geotechnics 121, 103449. doi:10.1016/j.compgeo.2020.103449
Soomro, M. A., Mangnejo, D. A., Bhanbhro, R., Memon, N. A., and Memon, M. A. (2019a). 3D finite element analysis of pile responses to adjacent excavation in soft clay: effects of different excavation depths systems relative to a floating pile. Tunn. Undergr. space Technol. 86, 138–155. doi:10.1016/j.tust.2019.01.012
Soomro, M. A., Mangnejo, D. A., and Mangi, N. (2023). Investigation of crack growth in a brick masonry wall due to twin perpendicular excavations. Geomechanics Eng. 34 (3), 251–265. doi:10.12989/gae.2023.34.3.251
Soomro, M. A., Mangnejo, D. A., Saand, A., and Hong, Y. (2021b). Responses of a masonry façade to multi-propped deep excavation-induced ground deformations: 3D numerical parametric study. Eur. J. Environ. Civ. Eng. 26 (12), 5983–6011. doi:10.1080/19648189.2021.1926336
Soomro, M. A., Mangnejo, D. A., Saand, A., and Mangi, N. (2021a). 3D numerical analysis of a masonry façade subjected to excavation-induced ground deformation. Int. J. Geotechnical Eng. 16 (7), 865–877. doi:10.1080/19386362.2021.1937853
Soomro, M. A., Mangnejo, D. A., Saand, A., Mangi, N., and Auchar Zardari, M. (2001c). Influence of stress relief due to deep excavation on a brick masonry wall: 3D numerical predictions. Eur. J. Environ. Civ. Eng. 26 (15), 7621–7644. doi:10.1080/19648189.2021.2004450
Soomro, M. A., Saand, A., Mangi, N., Mangnejo, D. A., Karira, H., and Liu, K. (2019c). Numerical modelling of effects of different multipropped excavation depths on adjacent single piles: comparison between floating and end-bearing pile responses. Eur. J. Environ. Civ. Eng. 25 (14), 2592–2622. doi:10.1080/19648189.2019.1638312
Suh, J. M. W., Cho, K. Y., Koo, T. Y., Ji, S. H., and Suh, M. w. (2009). Multi-agent based traffic simulation and integrated control of freeway corridors: Part 1 simulation and control model. J. Mech. Sci. Technol. 23, 1365–1373. doi:10.1007/s12206-008-1109-y
Tamotsu, M., and Kazuhiro, O. (2012). Foundation damage of structures. Soils Found. 36, 189–200. doi:10.3208/sandf.36.Special_189
Wang, R., Peng, Y., Wang, Y., Yoshitake, I., Yan, B., and Ding, B. (2025). Mathematical model for single-pile vibration displacement induced by tunnel construction vibrations based on the Pasternak model. Appl. Math. Model. 144, 116053. doi:10.1016/j.apm.2025.116053
Xia, H., Guo, W. W., Xia, C. Y., Pi, Y. L., and Bradford, M. A. (2009). Dynamic interaction analysis of a LIM train and elevated bridge system. J. Mech. Sci. Technol. 23, 3257–3270. doi:10.1007/s12206-009-1015-y
Xiang, Y., and Feng, S. (2013). Theoretical prediction of the potential plastic zone of shallow tunneling in vicinity of pile foundation in soils. Tunn. Undergr. Space Technol. incorporating Trenchless Technol. Res. 38 (9), 115–121. doi:10.1016/j.tust.2013.05.006
Yang, W., Zhang, D., and Wang, A. (2002). Field measurement analysis of the influence of simultaneous construction of river channel and bridge on existing double shield tunnels. Undergr. Space 7 (5), 812–832. doi:10.1016/j.undsp.2021.12.008
Zhang, R. J., Zheng, J. J., and Yu, S. (2013). Responses of piles subjected to excavation-induced vertical soil movement considering unloading effect and interfacial slip characteristics. Tunn. Undergr. Space Technol. 36 (6), 66–79. doi:10.1016/j.tust.2013.02.005
Zheng, G., Wang, R., Lei, H., Zhang, T., and Fan, Q. (2023). Load-transfer-associated settlements of a piled building during shield tunnelling in soft ground. Tunn. Undergr. Space Technol. 133, 104964. doi:10.1016/j.tust.2022.104964
Keywords: urban built environment, twin shield tunnel, finite element simulation, bridge pile group, field monitoring
Citation: Deng L, Liu J, Huang C, Yang S, Huang J and Wu C (2025) Impact of twin shield tunnel construction on the deformation of bridge pile groups beneath multiple bridges: a case study. Front. Built Environ. 11:1602817. doi: 10.3389/fbuil.2025.1602817
Received: 30 March 2025; Accepted: 02 May 2025;
Published: 30 May 2025.
Edited by:
Paolo Martinelli, Polytechnic University of Milan, ItalyReviewed by:
K. K. Pabodha M. Kannangara, Hong Kong Metropolitan University, ChinaMukhtiar Ali Soomro, China University of Mining and Technology, China
Copyright © 2025 Deng, Liu, Huang, Yang, Huang and Wu. This is an open-access article distributed under the terms of the Creative Commons Attribution License (CC BY). The use, distribution or reproduction in other forums is permitted, provided the original author(s) and the copyright owner(s) are credited and that the original publication in this journal is cited, in accordance with accepted academic practice. No use, distribution or reproduction is permitted which does not comply with these terms.
*Correspondence: Jizhixian Liu, bGp6eGN1Z0BoYmV1LmVkdS5jbg==