 David Koren
1*
David Koren
1*
 Katarina Rus
1,2
Katarina Rus
1,2
- 1 Faculty of Architecture, University of Ljubljana, Ljubljana, Slovenia
- 2 Department of Environment and Spatial Planning, Municipality of Škofja Loka, Škofja Loka, Slovenia
Cities operate as complex socio-spatial systems, composed of interconnected networks formed by diverse physical and social components. Dynamic interactions among these components sustain the city’s functionality, support the fulfilment of fundamental human needs, and ultimately determine the quality of life for urban residents. Urban resilience to earthquakes is traditionally assessed through physical damage analyses, yet such evaluations often overlook human-centred impacts on the quality of life. This study introduces a novel framework for evaluating the accessibility of citizens to essential urban functions post-earthquake, with these functions assessed through access to the corresponding facilities, and emphasising human needs rather than mere structural vulnerability. The proposed approach integrates seismic fragility assessments with graph theory-based accessibility metrics, capturing how damage to buildings and road blockages caused by earthquake-induced building debris affect the ability of residents to access vital urban functions. By integrating a panel of experts, the research examines the shifts in the hierarchy of human needs following seismic events. The proposed model is tested on a case study of a small Mid-European town under different seismic scenarios and evaluation approaches. The analysis shows that strong earthquakes can result in severe fragmentation of the urban network, with up to one-third of the population losing access to essential services. Educational and work-related functions emerge as particularly vulnerable, while healthcare accessibility proves more stable due to spatial distribution and facility robustness. Findings reveal a critical distinction between structural and functional vulnerability. A city may preserve most of its physical structures but still suffer major functional collapse if key services become inaccessible. This distinction underscores the need for spatial strategies that ensure the redundancy and dispersion of critical urban functions, particularly in historically dense or infrastructure-dependent areas. Building upon these findings, this study offers a methodology for assessing urban resilience by prioritising accessibility and human needs, aiding planners in improving emergency preparedness and long-term recovery.
1 Introduction
1.1 Background
Earthquakes are typically classified as low-probability, high-consequence events, characterised by their potential for catastrophic impacts despite their relatively infrequent occurrence. These seismic events can cause widespread destruction, significantly impacting urban environments and the communities that inhabit them. Such impacts are particularly profound in cities, which function as complex socio-spatial systems. Comprising interconnected networks of diverse physical and social components – such as infrastructure, transportation networks, public services, and social institutions – cities rely on the dynamic interplay of these elements to maintain functionality. This functionality is essential not only for meeting fundamental human needs but also for ensuring the quality of life for urban residents (Mouratidis, 2021; Alsayed, 2024). A well-functioning urban system enhances accessibility, connectivity, and opportunities for social interaction, thereby reinforcing social capital and contributing to the city’s overall resilience (Bruneau et al., 2003; Aldrich and Meyer, 2015; Bozza et al., 2017a; Meerow and Newell, 2019; Sharifi and Yamagata, 2016; Rus et al., 2018; Al-Humaiqani and Al-Ghamdi, 2024; Zhao et al., 2025). The functionality of an urban system can be defined as the capacity to enable the fulfilment of basic human needs (Cardoso et al., 2021; Abubakar, 2022). This functionality is often evaluated through accessibility to urban spaces or functions that facilitate the fulfilment of these needs (Okulicz-Kozaryn, 2013; Guida and Carpentieri, 2021). However, it is important to recognise that the hierarchy of needs depends both on individual perceptions and external circumstances, making it context-dependent. For instance, immediately after a disaster such as an earthquake, the prioritisation of needs differs significantly compared to normal (pre-earthquake) conditions. Thus, the functionality of a city is a complex and dynamic concept, evolving over time based on circumstances and the priorities of its inhabitants. Additionally, the functionality of an urban system is significantly influenced by human-made components, such as transportation infrastructure and the building stock. Transportation networks serve as the backbone of urban systems and are critical infrastructure lifelines that enable successful operation by providing physical connections between various elements and facilitating social interactions and the flow of information. Although primarily designed for daily commuting and freight services, transportation systems also play a vital role in emergency response and recovery operations following disasters (Koren and Rus, 2021). The topology of transportation infrastructure is vital for resilience at the network level and can be assessed using graph theory (Cavallaro et al., 2014; Aydin et al., 2018; Rus et al., 2020; Gao et al., 2021).
Earthquakes can affect communities structurally, environmentally, socially, and economically (Bozza et al., 2017a; Hsu et al., 2022; Aksoy et al., 2024; Xie et al., 2025). Disturbance or destruction of infrastructure can destabilise society and impact the economy, health, and safety of the community; thus, the functioning of communities is closely related to infrastructure functionality, especially in response to disasters and during evacuations. Indirect impacts include obstacles to accessing urban functions, disruptions in essential services, and a general decline in overall city functionality. Damaged buildings often obstruct road infrastructure, impeding access to emergency services, evacuation efforts, and the delivery of vital supplies (Hassan et al., 2022; Ceferino et al., 2024; Lin J. et al., 2024). The consequences of an earthquake may manifest in many ways: direct damage to road infrastructure; obstructions caused by earthquake-induced building debris; or broader community disaster-related disruptions such as panic or chaos. In the aftermath of such events, urban residents may find their access to essential services significantly reduced. Blocked roads not only isolate neighbourhoods but also hinder emergency response efforts (Golla et al., 2020; Battegazzorre et al., 2021; Liu et al., 2022; Pei et al., 2023; Hosseini et al., 2024; Costa and Silva, 2024; 2025).
1.2 Literature review
In the context of evaluating the impact of earthquakes on urban systems, particularly regarding road permeability and accessibility disruptions due to earthquake-induced building debris, a wealth of literature has recently emerged that underscores these interrelated themes.
Probabilistic models have emerged as a cornerstone for predicting road blockages caused by building debris. These methods consider factors such as seismic intensity, building typologies, and debris distribution. For instance, Hosseini et al. (2024) developed a comprehensive probabilistic framework to evaluate urban road blockages and optimise network restoration using resilience metrics and resource allocation scenarios. Similarly, Yu and Gardoni (2022) proposed fragility curves to estimate blockage probabilities, integrating damage states and road characteristics into system reliability assessments. These approaches provide crucial insights for pre-disaster planning and post-event recovery strategies.
The degradation of road accessibility due to earthquake-induced debris profoundly affects emergency functionality. Studies like Lin X. et al. (2024) simulate seismic accessibility changes in urban networks, incorporating debris dynamics and road capacity reductions. Golla et al. (2020) emphasise the vulnerability of local road networks, highlighting how intrinsic road attributes and extrinsic building damage create isolated neighbourhoods. Similarly, Miano et al. (2024) propose a multidisciplinary framework to assess road network efficiency under seismic hazards, evaluating the probability of building debris causing road blockages and its impact on critical connections, including increased travel times. Their methodology, demonstrated through case studies in Naples and Turin, offers insights into mitigating functionality loss in road networks while enhancing the accessibility of critical urban services. This dual focus is critical for urban planners aiming to prioritise mitigation measures and minimise travel time disruptions to essential services. In general, travel times in cities depend on a number of factors (Verovšek et al., 2022).
Agent-based models and integrated frameworks are increasingly employed to assess the impacts of building debris on evacuation efficiency and accessibility to critical urban functions during disasters. Castro et al. (2018) and Battegazzorre et al. (2021) demonstrate that debris significantly delays evacuations. Battegazzorre et al., for instance, developed the IdealCity model, which combines the built environment, transportation networks, and emergency response systems to simulate urban evacuations under seismic scenarios, offering valuable insights for enhancing emergency response and urban resilience.
In the context of healthcare accessibility, Pei et al. (2023) introduced a gravity-based model that examines the interplay between road network disruptions caused by debris and reduced hospital functionality, offering strategies to improve emergency service response times. Complementing these efforts, Costa and Silva (2024) present a detailed analysis of how earthquake-induced road network damage affects hospital accessibility. Their study uses a building-level exposure model for Lisbon to estimate the extent of debris and its impact on transportation network functionality. Furthermore, in another study, Costa and Silva (2025) use machine learning techniques to estimate road disruptions due to earthquake-induced debris, demonstrating how global datasets can predict accessibility losses in urban networks without relying on detailed exposure data. These frameworks underscore the importance of integrating debris impact assessments into urban disaster response planning to enhance both evacuation efficiency and post-event service accessibility.
Resilience-based frameworks increasingly address the broader impacts of road network connectivity under earthquake scenarios. Zhou et al. (2019) introduced percolation theory to measure global and local connectivity in disrupted road networks, while Liu et al. (2022) assessed emergency response functionality using probabilistic metrics. El-Maissi et al. (2023), El-Maissi et al. (2021) expanded on these concepts, proposing integrated vulnerability assessments that correlate road damage with surrounding building conditions, emphasising the importance of holistic resilience strategies for complex urban systems. The integration of transportation, population flows, and critical facilities in multi-layered network models has provided a comprehensive perspective on urban disaster resilience (Li and Yan, 2024). These studies underscore the importance of balancing physical infrastructure robustness with functional accessibility to minimise disruptions and enhance recovery capacities.
In summary, the review of existing literature reveals several critical gaps that shape the objectives and scope of this study. First, there is a notable absence of qualitative approaches in the assessment of urban resilience, emphasizing that the field remains dominated by purely quantitative, indicator-based metrics, which provide precision but often fail to capture human- and community-centered perspectives that are essential for decision makers in recovery planning. Second, while many of these studies provide precise and detailed analyses of urban system or network performance, they typically adopt a non-holistic approach, focusing on selected components while overlooking essential ones such as open urban spaces, the role of people and community services, and citizens’ accessibility to urban spaces or functions vital for fulfilling basic human needs. Third, the interactions between different urban components are often poorly addressed within proposed mathematical models, limiting the understanding of system-wide dynamics. Additionally, most existing works focus on specific case studies under narrowly defined conditions, which constrains their broader applicability. The reviewed literature does converge on the importance of incorporating the impact of building debris into road network assessments, highlighting the roles of predictive modelling, accessibility analysis, and resilience optimisation. It also underscores the need for interdisciplinary strategies that integrate technical, spatial, and social perspectives to improve disaster preparedness and response. From the above-mentioned research gaps identified in the current literature arises the central motivation for this study, which aims to present a more comprehensive and integrative contribution to the field of urban seismic resilience.
1.3 Objective of the study
The presented study introduces a novel model for evaluating the accessibility of residents to essential urban functions, shifting the focus from conventional assessments of physical damage to the human-centred impacts on quality of life. By prioritising the fulfilment of basic human needs during disasters, this research addresses how accessibility disruptions due to earthquake-induced debris can severely limit access to critical services such as healthcare, shelters, and essential supplies.
This research examines the impact of earthquakes on urban functionality from the perspective of the city’s residents. Specifically, it evaluates how the accessibility of urban spaces, essential for fulfilling basic human needs, changes before and after an earthquake. By focusing on the consequences of earthquake-induced building debris, this paper aims to contribute to the planning and development of urban resilience strategies, helping cities better prepare for the challenges posed by seismic events. Additionally, this paper presents, applies, and upgrades the authors’ recently developed framework for evaluating the resilience of urban systems in the context of earthquakes (Koren and Rus, 2021; 2023; Rus et al., 2018). The study also incorporates a mixed-method approach, combining quantitative and qualitative assessments of functional urban spaces conducted by a panel of experts. These assessments are integrated into the model, providing a comprehensive evaluation of urban functionality from a human perspective. The presented case study, focusing on a small Mid-European town, explores the effects of various seismic scenarios, applied through a pseudo-probabilistic approach, on urban infrastructure and the system’s overall functionality. In this context, the results should be interpreted as reflecting residents’ accessibility to essential urban functions and their facilities, rather than the actual operational status of these functions, which would require considering vital infrastructure systems (e.g., water, electricity, telecommunications) beyond the scope of this study. While the present study focuses on a single Mid-European town, the proposed framework is not inherently location-specific and can, in principle, be transferred to other urban contexts, provided appropriate adaptations are made (e.g., using fragility curves derived for the local built environment, and considering hierarchies of needs and functions defined by the local population and/or expert panel).
2 Methodology – the authors’ framework proposal for the assessment of a city’s performance and citizen’s accessibility to urban functions
The authors of this article have recently developed and proposed a model for evaluating the resilience of urban systems to seismic events, which is described in more detail in their recent publications (Koren and Rus, 2021; 2023; Rus et al., 2018). For the sake of brevity, the present paper provides only a summary of the main procedures applied in the model (Figures 1, 2). However, this study introduces several important upgrades to the original methodology, thus constituting a significant advancement over the previous work. In particular, the following novelties are introduced: i) User-centric perspective – urban resilience is observed and analysed primarily from the viewpoint of its users, i.e., citizens, focusing on their post-earthquake quality of life; ii) Expanded scope of human needs – the study now covers the full spectrum of human needs (a total of nine), compared to only two basic needs (survival and protection) addressed in earlier studies; iii) Inclusion of a qualitative component – a qualitative approach is integrated into the model, including expert assessments of urban functions and evaluations of the hierarchy (weights) of human needs; iv) Broader and deeper analysis of accessibility – the assessment of citizens’ accessibility to urban functions has been significantly expanded; v) Consideration of urban open spaces – urban open spaces are explicitly included as a key resource in the evacuation phase; vi) Assessment of the recovery phase – the model includes a preliminary analysis of the urban system’s reconstruction phase, based on assumed repair times.
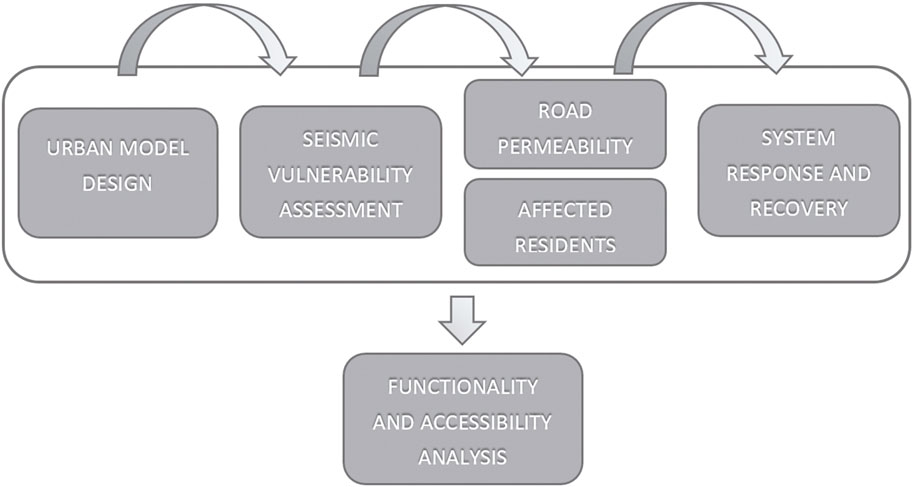
Figure 1. Workflow illustrating the main steps in the proposed model for urban seismic performance assessment.
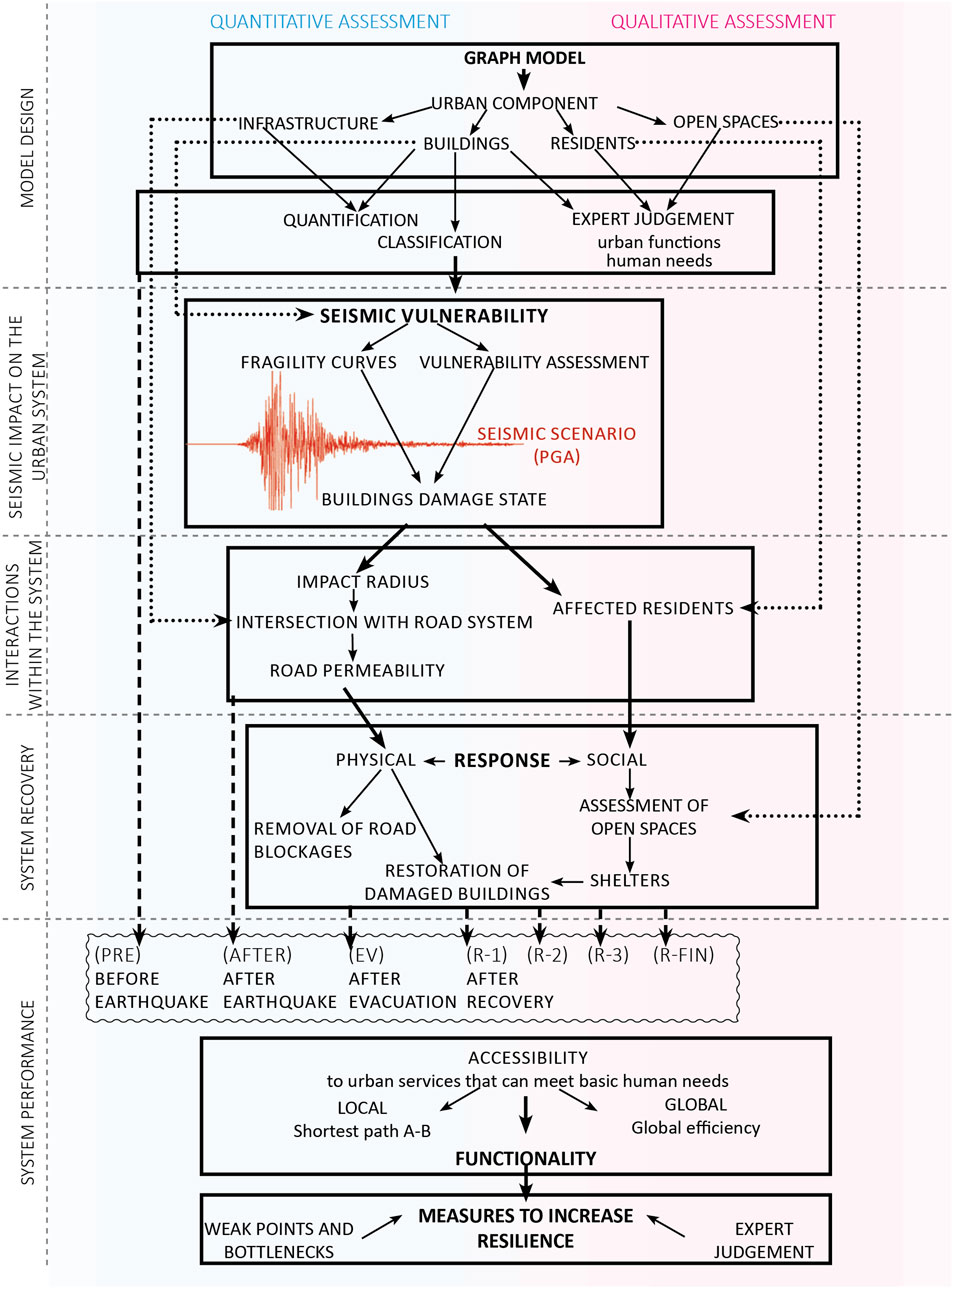
Figure 2. A flowchart presenting the authors’ framework proposal for urban seismic performance assessment.
The methodology thus builds upon the foundations laid by previous work, but extends them into a more comprehensive and integrated framework that combines both quantitative and qualitative approaches to assess the functionality of urban system under varying earthquake scenarios. The procedure encompasses several key steps, including model preparation, analysis of the seismic impact on the urban system, assessment of earthquake damage to buildings and their inhabitants, the impact of debris on the road network and its permeability, and the final analysis of urban performance observed through the accessibility of citizens to main urban services (Figure 1). In the presented study, the city model was designed and analysed using GIS tools, which facilitated the integration of spatial data for the analysed network, supporting the visualisation and assessment of accessibility changes over time. The accessibility was assessed by running the Wolfram Mathematica software version 13.3 (Wolfram ResearchInc, 2023).
2.1 Modelling of urban system’s components, earthquake damage assessment and its effect on road permeability
In the presented study, the city was modelled as a complex socio-spatial system by constructing a multilayer network composed of four fundamental urban components (Figure 2). The built environment includes residential buildings, where the city’s inhabitants as representatives of the social component are located, and non-residential functional buildings, which serve as spaces for activities that fulfil fundamental human needs. In this context, functional buildings refer specifically to non-residential structures supporting essential services and the city’s functioning. Open spaces (OSs) operate as functional voids between buildings that contribute to the satisfaction of specific needs, and the entire system is interconnected through transport infrastructure. In this study, only the road transport network was considered within the infrastructure component, while the broader framework remains applicable to other urban (sub)components if they exist and their corresponding data are available. The urban system was thus modelled as a mathematical graph consisting of nodes (residential buildings with inhabitants, functional buildings, and OSs) and edges representing connections between them (roads and pathways) (Cavallaro et al., 2014; Koren and Rus, 2019; Rus et al., 2020). The graph nodes correspond to the centroids of building footprints and OSs, while the edges represent the road centrelines that link residential buildings to functional spaces. All connections were assumed to be bidirectional as they allow movement in both directions during emergency situations. The graph nodes were weighted based on the number of inhabitants and the function of the buildings, while road connections were weighted according to their capacity or permeability. A visual representation of this graph structure, including the spatial distribution of all node types and their connections, is provided in Figure 6, which is part of the case study presented in Section 4.1. Additional explanations regarding the applied network model are also provided in that section.
In order to assess seismic vulnerability of building stock, the classification of buildings needs to be made (Silva et al., 2022). In our study [for more details see (Koren and Rus, 2023)], the building classes were based on the buildings’ construction type and material, the period of construction, and the number of storeys. Then, the seismic vulnerability for each building type was characterised by fragility curves adopted from the literature on similar (European) building stock (Pitilakis et al., 2014; Ahmad et al., 2011; Borzi et al., 2007). Seismic fragility curves show the probability of exceedance of a limit state (e.g., yielding, collapse, etc.) against a ground motion intensity measure like peak ground acceleration (PGA). Thus, in the presented study, the probability of damage to buildings was estimated based on the assumed earthquake event (i.e., PGA for the area under investigation) and the associated set of fragility curves, which were harmonised in the set of two curves (yielding and collapse – Figure 3) and three damage states: D1 – no damage; D2 – slight to moderate damage, conditionally still-usable construction; D3 – severe damage, non-usable construction. For each building type and seismic intensity, the most probable damage levels were estimated based on the mean damage grade (Koren and Rus, 2023). However, the effects of an earthquake reach beyond structural damage, disrupting social and infrastructural networks, particularly roadways. For this purpose, the interaction between damaged buildings and the adjacent road segments needs to be considered. Furthermore, the usability (safety levels) of damaged buildings and the total number of affected citizens should be assessed in order to provide the information on the number of affected or homeless citizens, shelter demands, evacuation strategies, and other post-earthquake emergency measures.
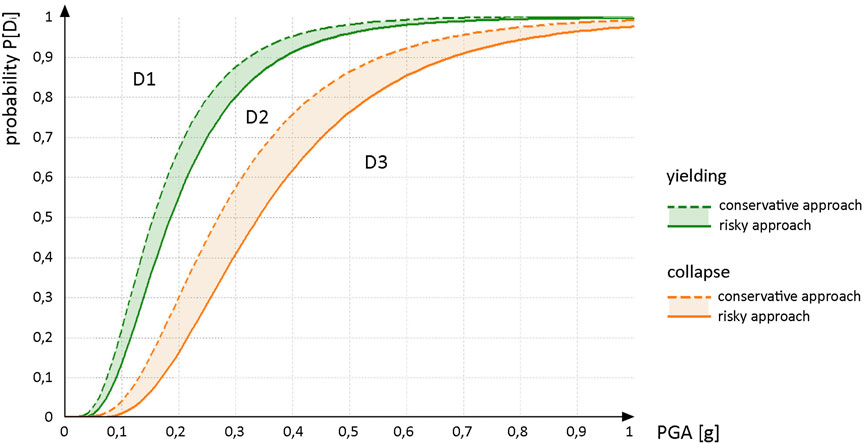
Figure 3. An example for a set of two harmonised fragility curves for two limit states (yielding and collapse) under conservative and risky approaches, framing three damage states (D1 – D3).
To model the effects of earthquake-induced building debris on road permeability, an impact radius was assigned to damaged structures, assessing how building debris obstructs road segments and reduces travel speeds. The impact radius was calculated individually for each building, based on the actual (measured) and assumed building parameters. It was computed in accordance with the Equation 1 proposed by Argyroudis et al. (2015):
where
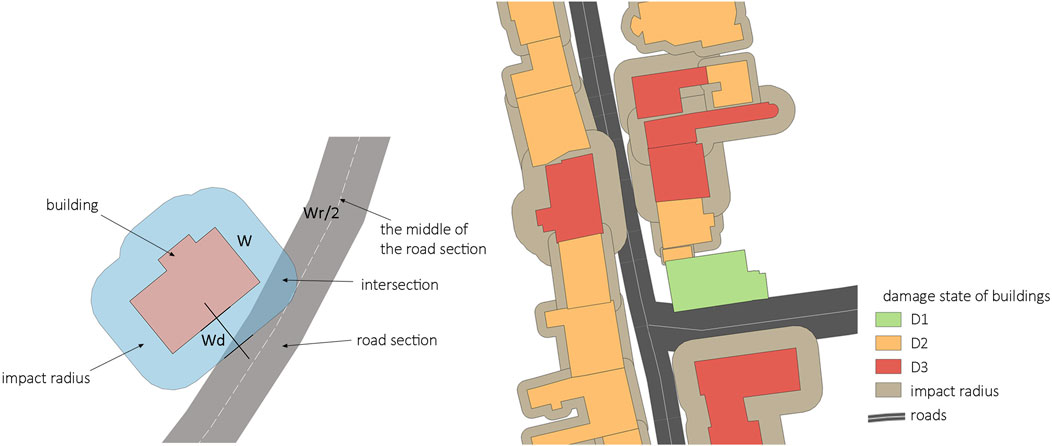
Figure 4. Impact radius of a damaged building and its influence on the nearby road: an isolated building (left), an actual row of buildings in different damage states (right).
After determining the impact radii of affected buildings (based on the damage state in the selected earthquake scenario), a detailed analysis was conducted to assess the impact of these radii on nearby road connections using GIS-based spatial analysis tools. It was examined which road segments were in close proximity to damaged buildings, what was their width (Wr), and to what extent these segments overlapped with the impact radii. It was then estimated which roads would be partially (the P2 level of permeability, where Wd < Wr/2) or completely (the P3 level of permeability, where Wd > Wr/2) blocked and impassable due to earthquake-induced building debris (Figure 4). Additionally, the assumed average travel speed (by car) for fully permeable (the P1 level of permeability) road segments was set at 20 km/h (Knez et al., 2014), while for partially permeable (P2) segments, half of this value was used. For impermeable (P3) road segments, the assumed average travel speed was 0. This analysis was crucial for evaluating the overall accessibility and passability of the urban system after an earthquake as well as for planning appropriate measures for road infrastructure rehabilitation and ensuring unobstructed traffic flow within the system.
2.2 Affected citizens, their human needs, and urban functions
A destructive earthquake can have severe consequences for people due to the direct damage it causes to the built environment. Affected individuals may experience the loss of safe housing, reduced access to essential services, personal injuries, or, in the most tragic cases, loss of life. While the residents of buildings classified under the D3 damage state are left without a safe shelter, those living in buildings classified under the D2 damage state do not need to evacuate their homes, although these buildings may require either minor or major repairs. However, for residents of D3 buildings, it is necessary to provide safe temporary accommodation as their homes are either collapsed or unsafe for habitation. After a destructive earthquake, the main priority is to provide rapid and adequate assistance to those affected. This includes both emergency medical care in hospitals and the provision of temporary shelters for those who have lost their homes. The demand for hospital capacities and temporary housing was assessed on the basis of the study by Di Ludovico et al. (2023), which estimated that, under optimal conditions, 18% of the affected population lived in buildings that sustained damage classified as D3 (referred to as D4 and D5 in their study). Among those, approximately 4% are expected to be fatalities – a figure that was incorporated into the overall assessment of affected residents as the focus was not on human casualties but rather on the functional changes within the urban system. Key data relevant to the research, therefore, included the number of individuals requiring hospital treatment and the remaining number of uninjured people left without safe housing.
In addition to the level of damage caused to homes, the quality of life for urban residents is also influenced by their limited access to urban functions, which consequently reduces their ability to meet basic human needs. While fundamental human needs are universal for every individual, the ways of fulfilling them change depending on the local, temporal, social, and cultural context. Various scientific theories of human needs have been developed (Maslow, 1943; Max-Neef, 1991). Contemporary scientific literature in the field of urban studies (Cardoso et al., 2021; Abubakar, 2022) most commonly refers to Max-Neef’s (1991) theory of human needs, which views needs as an interconnected interactive system, without hierarchy, often presented in the form of a matrix intersecting the existential needs (being, having, doing, interacting) and the axiological needs: subsistence (n1), protection (n2), affection (n3), understanding (n4), participation (n5), idleness/leisure (n6), creation (n7), identity (n8), and freedom (n9).
The functionality of the urban system determines how well the urban environment provides opportunities for meeting various needs. In this study, functionality is defined as the residents’ accessibility to urban functions that facilitate the fulfilment of basic human needs. Carlos Moreno, in his concept of the 15-min city, defines six essential social functions for the effective operation of an urban system: living (f1), working (f2), supplying (f3), healthcare (f4), education (f5), entertainment and recreation (f6) (Moreno et al., 2021). Additionally, based on a discussion with an expert panel, the seventh urban function – mental and spiritual care (f7) – was identified and addressed in the study. A survey on the interaction between urban functions, human needs, their hierarchy, and weighting is presented in Section 3.
2.3 Urban functionality and citizens’ access to urban functions
The main parameter observed in the study was the accessibility of residents to functional urban spaces (non-residential buildings and OSs with a specific function) that enable the fulfilment of needs and, thus, improve the quality of life in the city. The accessibility measure provides a comprehensive insight into the spatial distribution of justice and the efficiency of the urban system. Furthermore, accessibility is measurable (a quantitative metric), allowing for comparisons between different cities and time periods. It is evident that the damage to functional buildings and the resulting obstacles and closures of the transportation network have a strong direct impact on the accessibility to urban functions. In the most critical case, residents in affected areas may become physically isolated due to impassable or blocked roads. At the same time, it should be noted that a limitation of the current framework is that it does not account for the operability of lifeline infrastructure (e.g., water, electricity, telecommunications), which may further affect the actual provision of urban functions.
In the proposed model, the reduction in accessibility for urban residents in the event of a severe earthquake was analysed using graph theory algorithms (Wilson and Watkins, 1990). Graph theory is a branch of mathematics that studies networks of nodes (vertices) and their connections (edges), allowing the representation of complex systems and relationships. In the urban context, nodes represent urban elements (such as buildings, OSs, road joints), and the connections (edges) between them represent paths and other networks (road segments, railways, water supply networks). This approach enables the evaluation of centrality, connectivity, and accessibility of individual network elements, which is crucial for understanding their functionality and resilience to various disturbances. Among the various measures and algorithms of graph theory used in the relevant literature to assess the resilience of urban transportation networks (Zhang et al., 2015; Derrible and Kennedy, 2011; Koren and Rus, 2019; Cavallaro et al., 2014; Bozza et al., 2017a; Bozza et al., 2017b), this study employed global efficiency and shortest path measures to evaluate earthquake impacts on accessibility to functional spaces fulfilling the nine basic human needs as defined by the Max-Neef’s framework. These metrics are particularly suitable as they capture both the spatial configuration of the network and its ability to maintain connectivity between residential areas and essential urban functions after disruption. Compared to other graph-theory measures – such as alpha, beta, gamma indices or clustering coefficient – which provide topological insights but are less sensitive to accessibility loss (Aydin et al., 2018), global efficiency more directly reflects the degradation of service reachability in spatially embedded networks. The selection of these metrics is grounded also in our previous studies (Koren and Rus, 2019; Rus et al., 2020), where a wide range of graph-theory indices was categorised according to three key network properties: overall health, connectivity, and accessibility. This framework, along with similar methodological approaches (Cavallaro et al., 2014; Bozza et al., 2017b), provided the foundation for the focused metric selection in this study. The methodological rationale and implementation of global efficiency in the context of earthquake-induced disruptions are further discussed in Section 2.3.1.
2.3.1 Global efficiency
Finding the shortest paths is one of the key steps in graph theory, which also serves as the fundamental measure for determining the global efficiency of the urban system. Global efficiency is defined as the average reciprocal value of the shortest paths between all pairs of nodes in the graph (Latora and Marchiori, 2001; Li et al., 2025). This metric makes it possible to assess how efficiently the urban network connects all of its components. According to its definition, global efficiency considers the relationships between all pairs of nodes in the system but does not address the overall state of the system regarding the quantity and quality of urban elements. For example, if some buildings collapse during an earthquake, their nodes are excluded from the graph and not considered in the evaluation, which can, in some cases, lead to greater connectivity between the remaining nodes. To gauge this, a modified measure for global efficiency denoted as
where:
Global efficiency can be used in the urban system as the key measure for assessing connectivity and functionality of the urban network as well as for measuring accessibility to essential facilities, such as hospitals, schools, or business centres. Additionally, global efficiency can aid in understanding the urban system’s resilience to various disruptions, such as traffic congestion or natural disasters. By monitoring changes in global efficiency, it is possible identify weak points in the urban system and develop strategies to improve resilience and efficiency. However, it is important to note that global efficiency alone does not provide a comprehensive picture of an urban system’s performance. For a more accurate assessment, other indicators must be considered, such as local accessibility and qualitative aspects (e.g., the distribution of urban functions, quality and adaptability of open spaces, social capital, etc.), which can influence the overall functioning of a city.
This study distinguishes between local and global accessibility. Local accessibility focuses on the quality of life for individual residents and assesses how easily they can reach essential services within the city from their location of residence. Global accessibility, on the other hand, looks at the broader urban level and evaluates how well the entire city is interconnected and how it functions from the perspective of an average resident. The use of both accessibility measures in the study provides a comprehensive insight into the functioning of the urban system. Accessibility is measured for each urban function separately. This means that accessibility to spaces is assessed through functions such as living, working, supply, healthcare, education, entertainment, and recreation as well as mental and spiritual care. This approach makes it possible to precisely determine which areas of the city have high or low levels of accessibility to specific urban functions, which is crucial when planning urban interventions or adopting measures to improve the functioning of individual neighbourhoods or a city as a whole.
In accordance with the 15-minute city theory, the shortest paths within the system are measured in kilometres. The 15-minute city concept assumes that basic urban functions are accessible within a 15-minute walk, which roughly corresponds to the distance of 1 km. If the distance between two nodes is less than 1 km, it meets the criteria of the 15-minute city. Thus, the accessibility value indicates the extent to which an urban function is accessible to the average resident within a 1 km distance. Based on this concept, three different levels of accessibility are defined in the study: i) low (0–5 km−1), ii) medium (5–20 km−1), and iii) high (>20 km−1).
2.3.2 Local accessibility
To measure local accessibility, the shortest path metric from graph theory is used and the average shortest path from each resident to various functional spaces in their vicinity is calculated in accordance with the Equation 3:
where:
A particular feature is the evaluation of accessibility to the living function, where it is considered that each resident only has access to their own home. This means that the functional weight
2.3.3 Global accessibility
For measuring global accessibility, modified metrics for global efficiency from graph theory are used (Koren and Rus, 2021; 2023). The distances from all residential buildings to all nodes with a specific urban function are taken into consideration. In addition to the basic parameters, functional weights and weights for the damage state are included in the calculation of global accessibility, and in all the steps, the total number of all residents
where:
Thus, global accessibility reflects the quantity, quality, and proximity of urban functions for the average resident of the observed urban system.
2.3.4 Urban functionality
The final step in this thorough assessment process involved the evaluation of urban functionality. Specifically, the focus was on assessing accessibility to urban functions that can fulfil essential human needs even in the aftermath of a seismic event. In the study, the functionality of the urban system was evaluated based on local and global accessibility to urban functions, which were further weighted. Mathematically, functionality in relation to each need (
where:
The overall functionality of the city F (Equation 6) is the sum of the functionality of individual needs, weighted by the corresponding weights
where:
The evaluation of the city’s functionality (F) represents the final step in assessing the overall performance. This includes integrating all previous analyses into a unified framework that allows for the evaluation of general functionality of the urban system. It considers how different components of the system interact and contribute to the overall quality of life in the city. It is particularly important to understand how well the city supports the dynamic needs of residents in various life situations and how these needs change over time. In order to construct a resilience curve (Figure 5) illustrating how network functionality varies over time, the study included the temporal phases of urban functionality – pre-earthquake, immediate aftermath, post-evacuation, and recovery (Table 1). In support of urban recovery, a restoration strategy was developed that prioritises incremental interventions based on damage severity. This strategy outlines a structured timeline to re-establish essential urban functions, providing a basis for more efficient recovery planning and contributing to enhanced resilience for future seismic events.
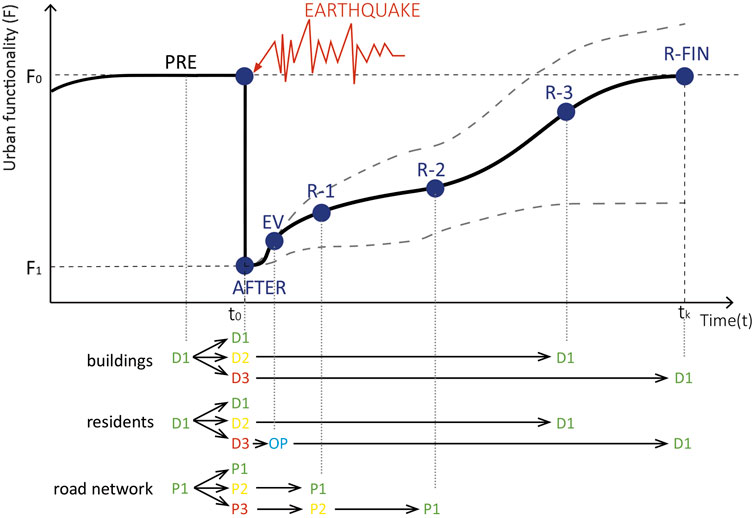
Figure 5. Phases of urban system functionality represented as the resilience curve in relation to the damage state of urban components.
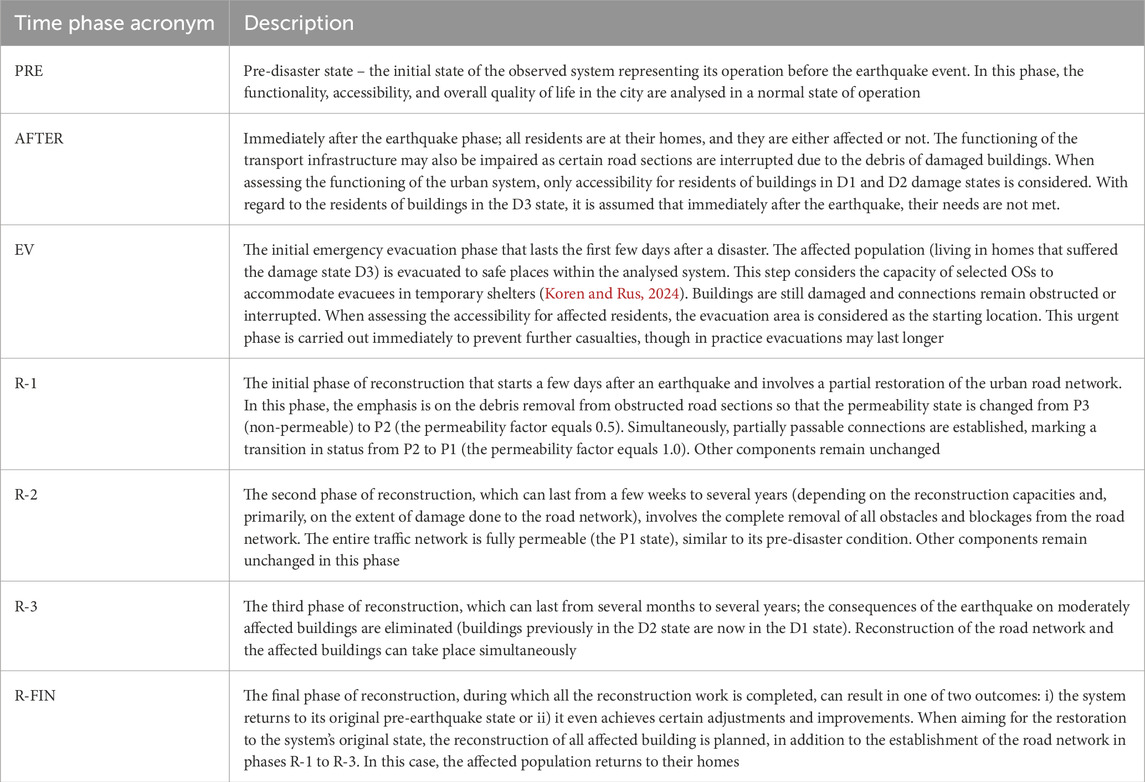
Table 1. Different time phases considered in the study.
The resilience curve (Figure 5) illustrates how the modelled accessibility to urban functions evolves over time, based on the considered components (building damage, affected population, and road network permeability). It should be noted that this representation does not capture the full functionality of the city, as other critical aspects such as the operability of lifeline infrastructure are not included in the present framework. By examining the area under the functionality curve, the resilience of the system can be assessed. When an earthquake event occurs, the functionality of the city drastically decreases. This is followed by the evacuation and emergency aid phase, during which the city’s functionality increases relatively quickly; however, the growth in functionality typically slows down after this phase. In the initial stages of recovery (R-1 and R-2), restoration efforts usually focus on essential infrastructure, such as roads, water supply, electricity, and telecommunication networks. During this phase, the functionality of the city gradually increases due to improved connectivity within the system. The final phase, R-FIN, marks the achievement of a new equilibrium, where the city reaches full recovery and may experience permanent changes and even improvements in urban planning and operation, enhancing the city’s resilience to future challenges.
3 Assessments of functional urban spaces and human needs hierarchy pre- and post-disaster
3.1 Panel of experts
In order to identify (i) which buildings and OSs in the city perform specific urban functions and to what extent they contribute to their execution; (ii) which urban functions enable the satisfaction of particular human needs and to what extent; and (iii) the priority scale of individual needs both under normal conditions and in the event of a destructive earthquake, a qualitative assessment was conducted in collaboration with a panel of experts from diverse fields, including urban planning, psychology, sociology, architecture, and civil engineering. The panel was structured in two parts. In the first part, an extensive questionnaire was completed to determine the priorities and weights of individual needs and functions as well as the positions they occupy in their complex interconnectedness. The Analytic Hierarchy Process (AHP) method (Saaty, 1987; Saaty, 1990; Markelj et al., 2014; Singh and Kumar, 2024; Lin J. et al., 2024; Xie et al., 2025) was used to compare the importance and priorities of individual elements. The second part involved a discussion with invited experts, where the results were qualitatively refined. In the first part, 12 participants completed the questionnaire, while seven experts participated in the final discussion. While this number of experts allowed for a structured and diverse assessment, it may limit the range of perspectives captured. In order to streamline the large number of comparisons required by the basic AHP method, the express AHP method was utilised (Leal, 2020). This method first identifies the most important element and compares it with all the other elements under consideration. This makes the entire process significantly less time-consuming and complex, without compromising the accuracy of the results. These comparisons were used to calculate the average values of the responses, which were then used to determine the weights of individual elements. Although expert judgment inherently involves some degree of uncertainty, this was mitigated by combining structured data collection (via AHP), aggregation of multiple responses, and a follow-up group discussion to validate and refine the outcomes. The mixed-methods approach ensured robustness and consistency, even though statistical confidence intervals were not derived.
3.2 Results obtained from the panel
Key results from the expert panel provide insights into the hierarchy of needs both before and after the earthquake, as well as an assessment of which urban functions satisfy particular needs and to what extent. These expert assessments inform the weightings and priorities of different functions within the model, providing a detailed picture of functional priorities as they shift in the aftermath of an earthquake.
In the first section of the questionnaire, the hierarchy of basic human needs was explored both in normal conditions and in a crisis situation immediately after a destructive earthquake. The hierarchy of needs and their weight values (Table 2) in different phases of the recovery process were determined using linear interpolation and limits, i.e., the initial (equal to final) state of equivalence. The results confirmed the equivalence of needs in the pre-earthquake and normal situation. Only minimal differences were observed between individual needs, which can be attributed to the subjective evaluation by participants. Before the earthquake, no different weights were assigned to individual needs, and their equivalence was assumed. In the aftermath of the destructive earthquake, the priority of needs changed significantly. The need for survival came to the forefront, followed by the need for protection. After the disaster, the original hierarchy of needs begins to be re-established over time. This is influenced by individual perceptions as well as external circumstances, which change with the recovery process of the urban system. In the study, it was assumed that at the end of the recovery process, when the system is restored to its original state, the original hierarchy of needs will also be reinstated.
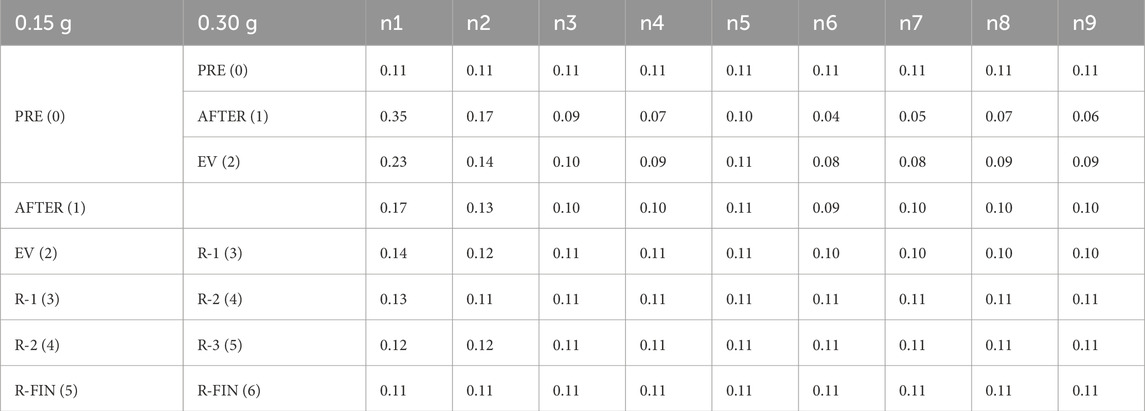
Table 2. Weights describing the priorities of needs (n–for nomenclature see Section 2.2) in different phases of the urban system’s operation in relation to the earthquake intensity.
Each need can be fulfilled by utilising multiple urban functions. At the same time, each urban function can fulfil several different needs, but not all to the same extent. The significance of urban functions in fulfilling a specific need was also assessed by the expert panel, and the results were quantified in the study as weights (Table 3). These weights represent the extent to which a given function can fulfil a specific human need. The total sum of the weights for each need represents the complete value, normalised to 1.
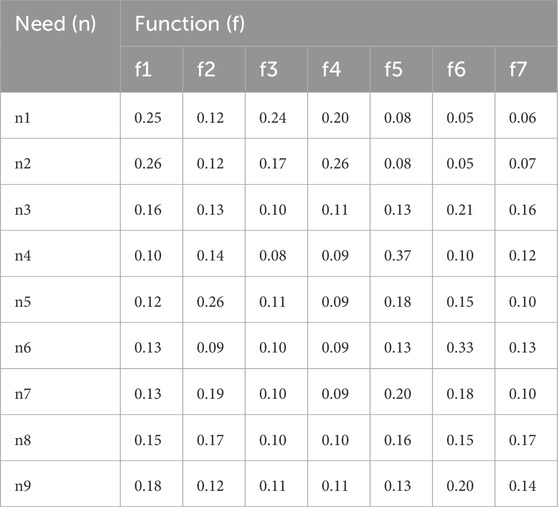
Table 3. Weights describing the significance of urban functions (f) in fulfilling a specific need (n) – for nomenclature see Section 2.2.
The expert panel’s assessment also involved identifying the urban functions of individual urban spaces, including buildings and OSs. It was necessary to determine the primary function of each urban space along with any potential secondary functions. Accordingly, every building and OS was assigned a share of its contribution to the operation of a specific urban function. The total sum of all shares for every function represents the whole, valued as 1 (Table 4). When determining the weights for urban spaces in relation to a particular urban function, the results of the questionnaire and the discussion with experts were taken into consideration. Every expert on the panel assigned points to every type of space for its primary function (3 points) and, optionally, for its secondary (2 points) or tertiary (1 point) function. Based on all the obtained evaluations for every function, average points were calculated and used to determine the final weights, expressed as the share of every type of building or space contributing to a specific function (Table 4). Functions that were identified as primary by only one expert or were recognised as tertiary by three experts were excluded.
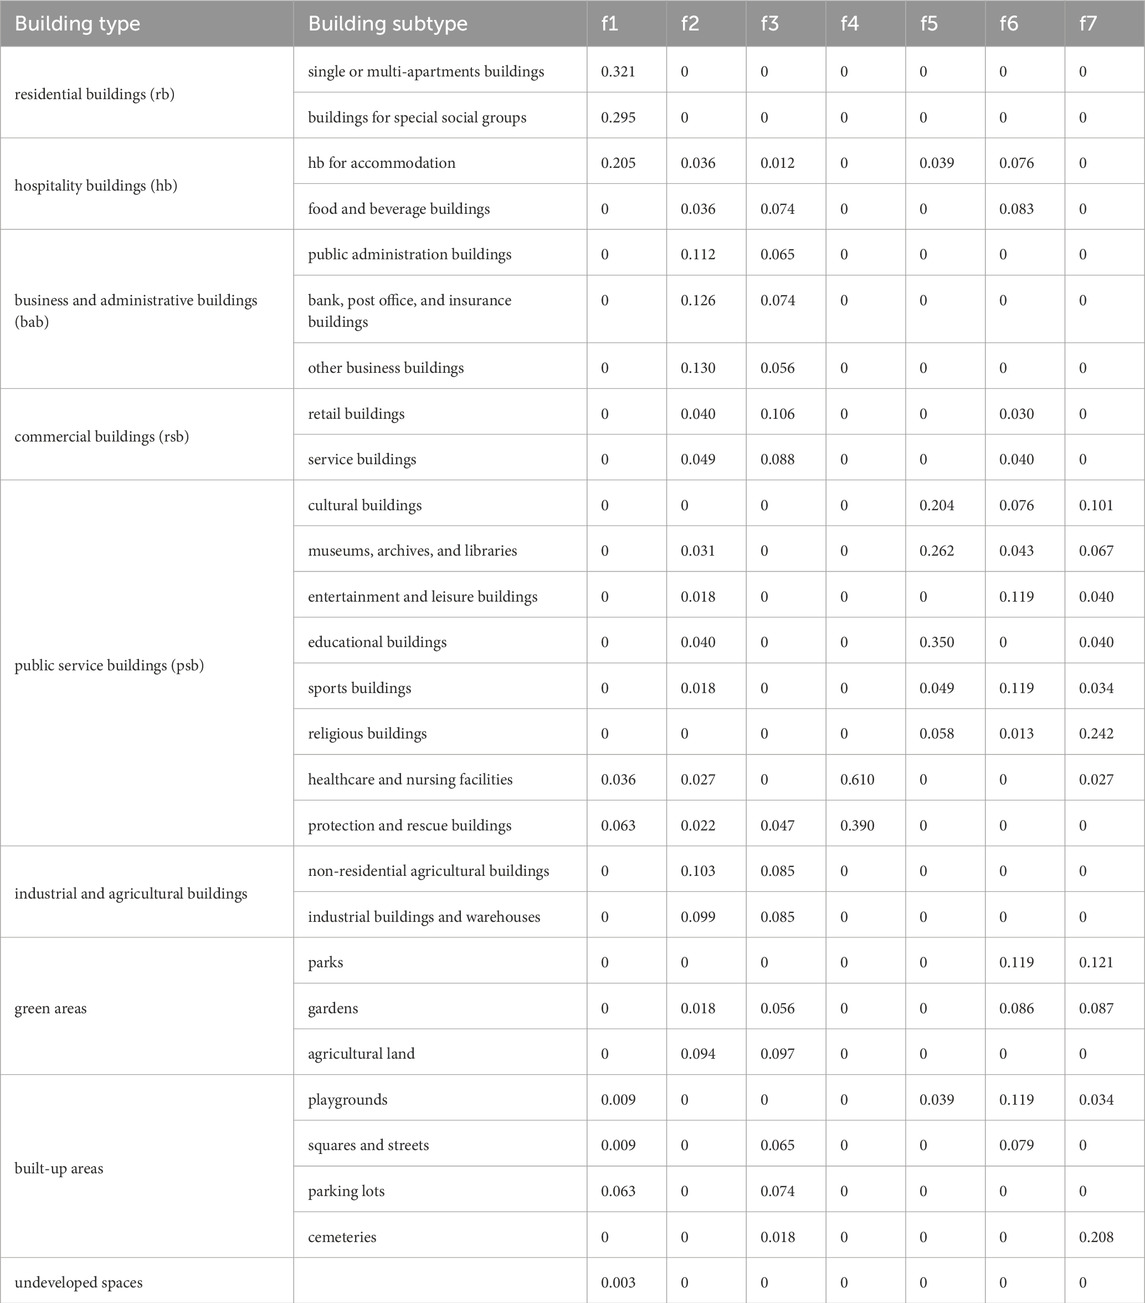
Table 4. The share that buildings and OSs contribute to the operation of a specific urban function (f).
In the second part of the panel discussion with invited experts, the quantitative results were qualitatively defined. The experts emphasised that for an average healthy resident, the need for survival is closely related to housing (f1) and material supply (f3). In cases of illness or other health issues, healthcare (f4) becomes especially important, in addition to shelter (f1) and material supply (f3). The discussion highlighted the fact that living arrangements can encompass various aspects; the notion can be understood as a physical location or as the very essence of human existence. The functions of living and healthcare were particularly prominent in the context of the need for protection, which includes saving lives during disasters or emergencies.
The need for affection is more complex and is expressed through relationships between people, as well as through interactions with nature, animals, and other environmental elements. It can be fulfilled through various urban functions, depending on an individual’s situation in terms of living arrangements and age. The varied responses in the questionnaire highlight the significance of individual experiences and preferences. Affection has a multifaceted impact on urban residents as positive relationships with other people, nature, and animals can enhance the quality of life. A key aspect of affection is entertainment and recreation (f6), which was recognised by the experts, as the most important urban function in terms of fulfilling the need for affection.
Education (f5) stood out as the key function in relation to the need for understanding, highlighting the importance of continuous learning and research aimed at grasping the complexity of existence. This was followed by work, which may be a reflection of the fact that the participating experts come from the academic field. Work plays an important role in shaping and connecting communities in the city and was recognised as crucial in terms of fulfilling the need for cooperation by all experts except sociologists and psychologists. The latter prioritised education as well as entertainment and recreation. Entertainment and recreation also stood out as essential in terms of fulfilling the need for leisure.
The need for creation can be fulfilled through various urban functions, as evidenced by the evenly distributed weight values in the study results. Education had the most consistent rating and the highest overall priority, while work was most frequently recognised as the leading function. The study also found an even distribution of weight values across different functions aimed at satisfying the needs related to identity and freedom.
4 Case study
4.1 Description of the analysed urban system and earthquake scenarios
The assessment of a city’s response to an earthquake was conducted in the form of a case study of the small Mid-European town of Brežice. The study area of about 5 km2 includes significant landmarks, such as a medieval core and a castle dating back to the 13th century as well as important emergency services (a health centre and two fire stations). The analysis utilises a test model of the town with 6,843 inhabitants and 1,446 buildings. Of these, 1,069 are residential buildings, while the remaining 377 are functional structures serving various purposes that can satisfy human needs. The built facilities are connected by the road network spanning 50.47 km. Several open spaces covering a total area of 345,794 m2 are distributed throughout the town, with a total of 50 of them recognised as either public or semi-public areas. Among these, ten serve essential public functions that cannot be altered (functional OS), while five have public functions that, in times of crisis, can be repurposed for evacuation purposes. Additionally, 35 OSs do not hold any significant functions (non-functional OS) and are available for use in emergency evacuation scenarios.
The selected system was modelled as a graph consisting of nodes representing the centroids of buildings’ footprints, OSs, and traffic intersections, as well as physical (transport network) connections between these nodes (Figure 6). Individual nodes of buildings and OSs were linked to the road infrastructure network through secondary (functional) connections, forming a unified graph. In this process, the social component of the city was incorporated by defining node attributes and their weights in the accessibility analysis. Thus, all objects were weighted according to the urban functions they perform (see Section 3.2), while residential buildings were additionally weighted according to the number of inhabitants. The number of inhabitants of each building was calculated on the basis of census data. In the study, the inhabitants were assumed to be uniformly distributed according to the total floor area of the buildings (buildings’ footprints area multiplied by the number of storeys) while considering that population density in multi-residential buildings is two times larger compared to single houses.
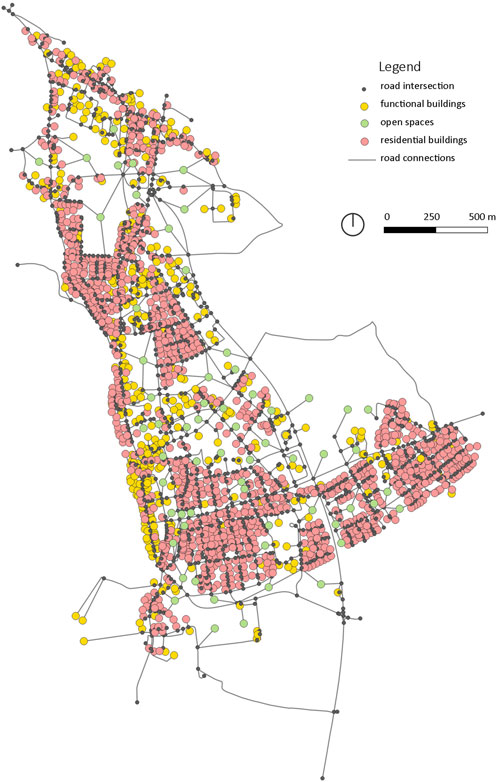
Figure 6. Graph of the computational model of the town of Brežice.
The majority (approximately 75%) of buildings in Brežice are masonry and low-rise structures constructed in the 2nd half of the 20th century, while the remained building stock is composed of reinforced concrete (RC) structures (9%) and structures made of other materials (16%) (Koren and Rus, 2023; Petrovčič et al., 2025). In the presented study, fragility curves for masonry and reinforced concrete (RC) building classes were selected using the Fragility Function Manager software (Syner-G, 2022; Pitilakis et al., 2014). For masonry low-rise (ML) and mid-rise (MM) structures, different fragility curves proposed by Ahmad et al. (2011) were selected, while for RC structures, the curves introduced by Borzi et al. (2007) were adopted. In the original classification, the building stock was divided into twelve classes according to construction material, height, and construction period, with an additional class for important buildings (IB) (Koren and Rus, 2023). However, in the FFM library, fragility curves were available only for masonry and RC structures, which restricted the analysis to three main classes. For structures made of other materials and for important buildings, no suitable fragility curves were available. Their damage states were therefore estimated qualitatively, based on typological characteristics and existing recommendations (Koren and Rus, 2023; Zuccaro and Cacace, 2015). In the case of important buildings (e.g., hospitals and emergency facilities), which were all renovated after 1982 under strict seismic codes, these were assumed to remain functional under the considered earthquake scenarios. These simplifications represent a limitation of the study, as the absence of class-specific fragility curves for some building types required assumptions that may affect the accuracy of the results.
In the study, a pseudo-probabilistic approach was adopted: while the fragility curves and seismic hazard maps were derived from probabilistic principles, the two seismic scenarios were defined in a deterministic manner. Two seismic intensities were analysed: (i) a severe earthquake with a peak ground acceleration (PGA) of 0.30 g, which corresponds to the design PGA for the given study location (Slovenian Environment Agency, 2024), and (ii) a moderate earthquake with a PGA of 0.15 g (half of the design PGA). Due to the relatively small study area, a uniformly distributed PGA was assumed across the entire investigated region. We acknowledge that this simplification limits the accuracy of seismic demand representation, as PGA alone cannot capture the full complexity of earthquake ground motion; future work should therefore adopt more advanced methods and alternative intensity measures. Since a pseudo-probabilistic approach was applied, the obtained results (see Section 4.2) should not be treated as purely deterministic values. Both scenarios were considered as night-time earthquake events, assuming that at the time of the earthquake, all residents were at home (in residential buildings), while non-residential buildings were assumed to be unoccupied. Each scenario was analysed from the perspective of a conservative (C) and a risky (R) approach, accounting for the uncertainties arising from structural design. In general, such approaches could be defined using statistical quantiles of the fragility curves; however, in this study they are applied in a simplified manner, based on the compactness of masonry structures. To capture the wide spectrum of possible seismic responses, two fragility curves were applied for each class of masonry buildings: one representing a low percentage of voids (the R approach) and the other a high percentage of voids (the C approach). For reinforced concrete buildings, the same fragility curves were used for both the risky and conservative approaches. In the case of buildings made of other materials, a difference of one damage level was assumed between the risky and conservative approaches. Important buildings (IB) were considered fully resistant to earthquakes in the selected scenarios and were assumed to sustain no damage during the analysed seismic events.
4.2 Results and discussion
4.2.1 Affected urban components and evacuation of citizens to suitable urban OSs
To assess the impact of the earthquake on urban components, three distinct damage states were assumed. In the D1 damage state, structures remained undamaged, the population was unaffected, and road connections remained unobstructed (P1). The D2 state was characterised by light to moderate structural damage. Although buildings were still usable, their condition was compromised. Road connections were partially obstructed, making travel and access more challenging (P2). The most severe damage state D3 involved buildings that were either severely damaged or completely collapsed. Inhabitants of these buildings were left without suitable living conditions and road connections were fully interrupted, severely limiting mobility and access (P3).
In the case of a moderate earthquake (0.15 g), there was no major damage or collapse of buildings (no building reached the D3 damage state), so there was no need to provide temporary housing. By contrast, the severe earthquake (characterised by a PGA of 0.30 g) caused devastating consequences to the observed test model, which experienced widespread damage and disruption, necessitating a comprehensive evaluation of the aftermath (Figure 7). Approximately 20% of the town’s buildings were so badly damaged that they were rendered unusable. Furthermore, 12% of the road connections within the town were totally interrupted, exacerbating the challenges faced by residents and emergency responders. A considerable portion of the population, approximately 37%, found themselves in severely damaged buildings that were no longer suitable for habitation. This posed an immediate threat to the safety and wellbeing of affected residents. These residents were subsequently assigned to suitable OSs (35 in total) within the town based on different allocation principles and criteria including five qualitative parameters: capacity, safety, quality, function, and accessibility. It should be noted that not all OSs are suitable as shelters, as many may lack the necessary supporting infrastructures or the capacity to meet the required post-earthquake standards.
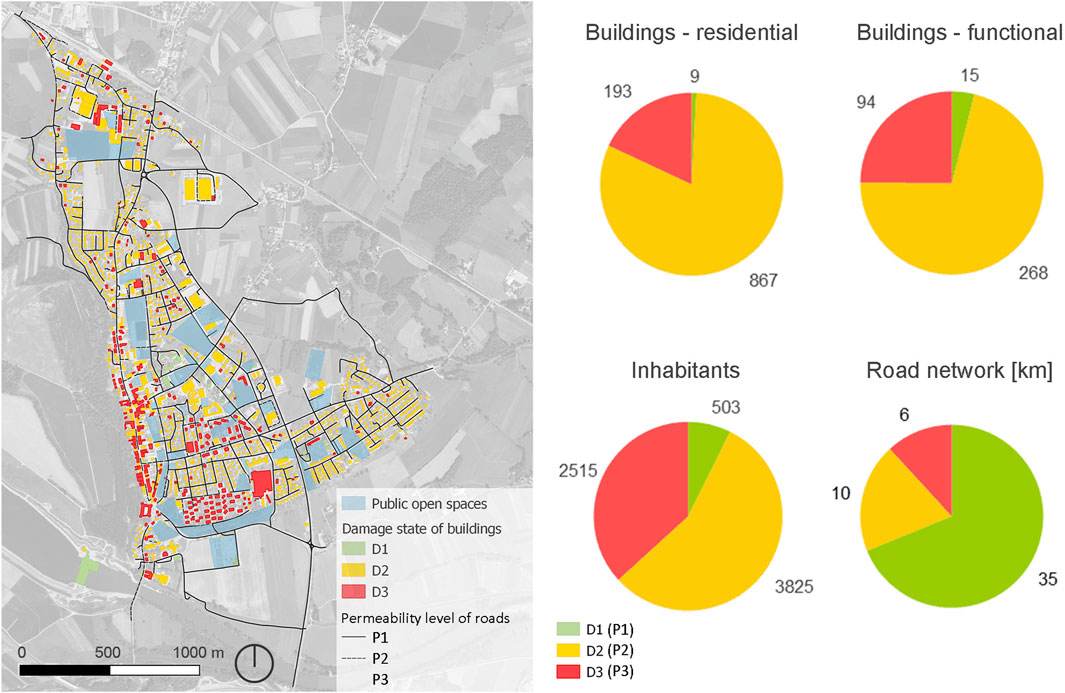
Figure 7. The damage to the investigated town after the severe earthquake (0.30 g_C) and its distribution within the system.
The evaluation of OSs was based on a multi-criteria assessment developed in our previous work, combining GIS-based analysis and expert judgement (Koren and Rus, 2024; Rus, 2025). Based on these assessments, the suitability of each open space (OS) for temporary shelters was evaluated (Figure 8), and strategies for allocating the affected population to suitable locations were defined. In this article, in line with the proposed concept of assessing urban quality of life, the focus is solely on the strategy for allocating temporary shelters to OSs with optimal accessibility to urban functions. In addition to ensuring accessibility to evacuation areas and temporary shelters, it is crucial to provide adequate living conditions in shelters until the damaged buildings are restored, which may take more than a year. Thus, in this study, the density of temporary shelters was assumed on the basis of literature regarding long-term replacement housing (Anhorn and Khazai, 2015) and was set at one inhabitant per 45 m2. In this study, a simplifying assumption was made that all affected residents are temporarily accommodated in shelters located in the identified OSs until their homes are restored.
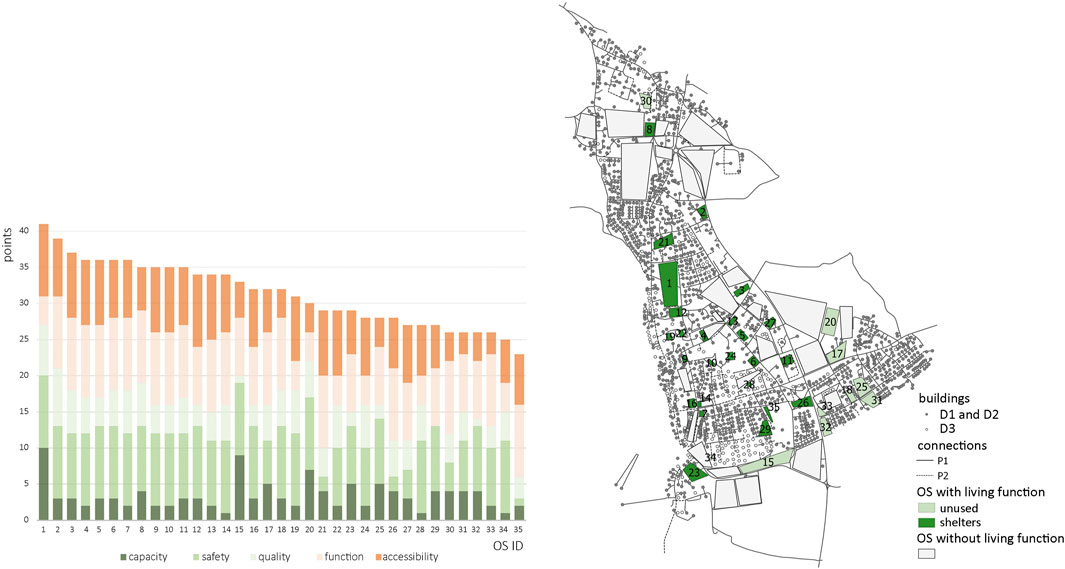
Figure 8. Overall evaluation of OSs (35 in total) based on five defined parameters (left) and selected OSs designated for temporary shelters for the affected population in the case of the scenario 0.30 g_C (right).
4.2.2 Strategies for urban system reconstruction
For post-earthquake city recovery, this study adopted an approach based on gradual progression from less demanding interventions to more complex ones. The selected strategy assumes that initial actions focus on smaller interventions that require less time and resources (e.g., debris removal and the restoration of moderately damaged (D2 state) connections and buildings) and have an immediate impact on increasing the city’s functionality. In the secondary phase of restoration, more challenging interventions on heavily damaged (D3 state) components of the system follow, with restorations starting only after the buildings and road sections, which were in the D2 state after the earthquake, have been restored. The speed of restoration, referred to as the system’s recovery capacity, depends on the extent of the damage, available resources, organizational capacity, legal and administrative constraints, and socio-economic conditions. In this study, these factors were not modelled dynamically; instead, they were indirectly incorporated through fixed daily restoration capacities adopted from existing literature (ATC, 2021; Cook et al., 2022; Terzic et al., 2021). This simplification allowed for a clear and comparable representation of the recovery process across different earthquake scenarios, aligning with the primary aim of the study – to demonstrate the functionality of the proposed assessment framework rather than to simulate the full complexity of real-world recovery dynamics. The restoration strategy unfolds through seven consecutive phases (PRE, AFTER, EV, R-1, R-2, R-3, R-FIN), as outlined in Table 1; Figure 5. Each phase involves specific interventions that affect the functional state of the road network, buildings, and population distribution.
The restoration sequence prioritised roads over buildings and moderately damaged (D2) components over heavily damaged (D3) ones. Although the spatial movement of crews was not explicitly modelled, recovery progressed in parallel within each damage category, limited by fixed daily capacities. Based on the cited sources, the following recovery capacities were determined for our case study:
• 1,000 m/day and 100 m/day for road connections in the P2 and P3 states, respectively;
• 2,000 m2/day and 200 m2/day for buildings in the D2 and D3 states, respectively.
It was assumed that the restoration process begins on the second day after the earthquake, as the first day is dedicated to establishing emergency evacuation routes and evacuating all residents to a safe location. The time needed for the restoration of the physical components of the urban system was estimated on the basis of these assumptions and the extent of damage caused by the earthquake (Table 5). The long D3 restoration times reflect both the above-mentioned sequential approach and the conservative restoration rates assumed, which are in line with literature and real post-earthquake experiences, e.g., Di Ludovico et al. (2023). While the model does not capture all real-world restoration dynamics (e.g., funding, policy priorities, institutional barriers), it provides a structured and replicable way to analyse system recovery potential and to illustrate the methodology’s practical value in a comparative scenario framework.
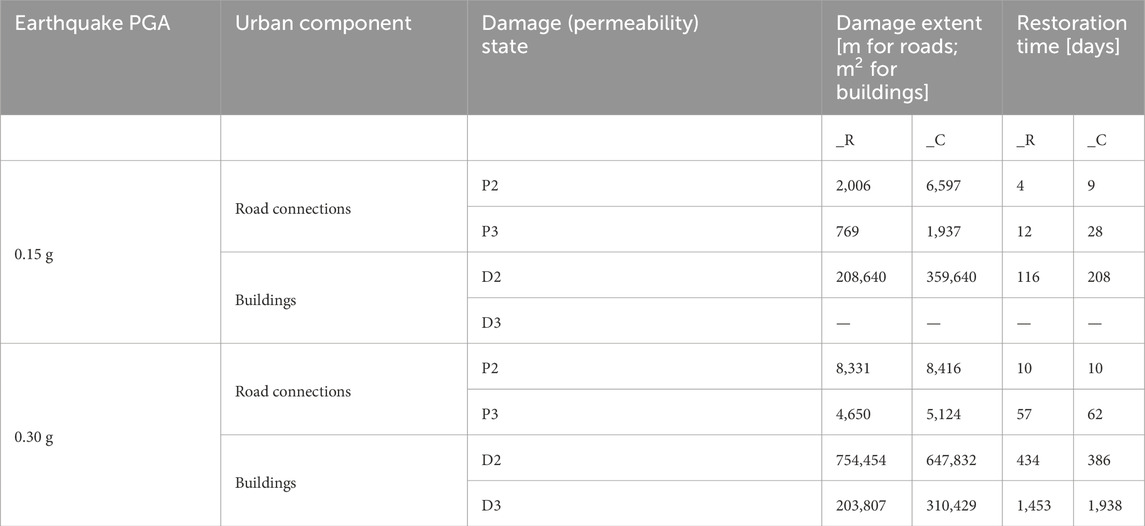
Table 5. Estimated restoration time for the physical components of the urban system for different earthquake scenarios.
4.2.3 Local and global accessibility of citizens to urban functions
Local accessibility refers to the average accessibility of residents in a given residential building to functional facilities in their vicinity and has a direct impact on the functionality of the urban system. The analysis of local accessibility to all functional spaces of the studied town revealed that before the earthquake, most residents had a medium level of accessibility to urban functions, and following the earthquake, this level declined to a varying degree (Figures 9, 10). In the case of a moderate earthquake (0.15 g), small changes in accessibility to urban functions occurred, but after a strong earthquake (0.30 g), much larger changes in local accessibility were observed. In this case, only 29%–43% of residents retained medium local accessibility, while 57%–71% had low accessibility, with one-third of the population losing their homes or access to other urban functions (Figure 10). The greatest drop in local accessibility occurred in the old town centre and the southern part of the town. The smallest change in accessibility was observed in the eastern urban area, where accessibility was already low even before the earthquake.
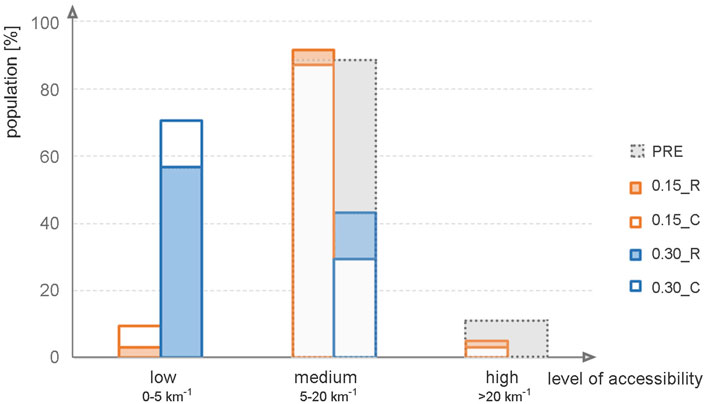
Figure 9. Proportion of residents with low, medium, and high level of accessibility to urban functions before and immediately after the earthquake, taking into account different earthquake scenarios.
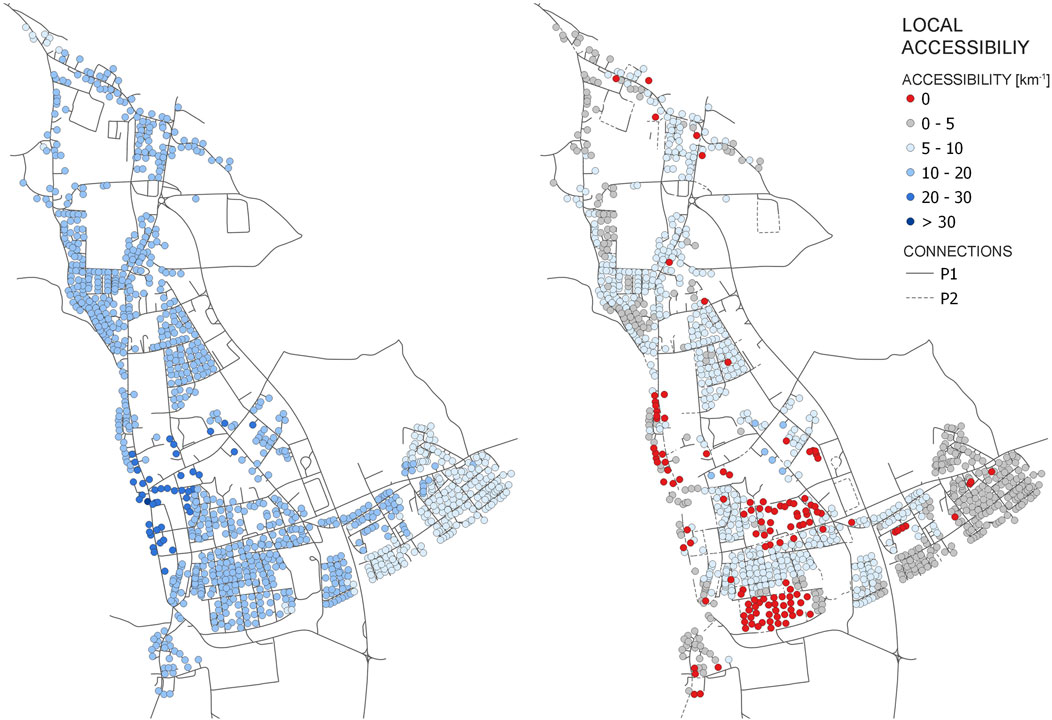
Figure 10. Distribution of local accessibility to all urban functions (functional buildings) BEFORE (left) and AFTER (right) the earthquake scenario 0.30 g_R.
In assessing local accessibility before the earthquake, differences were observed between various areas of the town (e.g., in the old town centre, accessibility to workplaces (f2) and material supply (f3) was significantly better than on the outskirts). For the sake of brevity, the results of these analyses are not presented in this article. Significant differences were also noted between different urban functions: i) low local accessibility for housing (f1), education (f5), and mental and spiritual care (f7); ii) high accessibility to workplaces (f2) and material supply (f3); and iii) medium accessibility to healthcare (f4) and leisure activities (f6).
Global accessibility as a general measure of the entire urban system provides a broader view of accessibility to functional facilities. Since global accessibility represents a single value of the whole system, accessibility was calculated (Equation 4) for every temporal phase under consideration (Table 1), and the results are presented as a function of time (Figure 11). When evaluating the residents’ global accessibility to key urban functions, significant differences were observed between earthquakes of different intensities (PGA 0.15 g and 0.30 g) as well as between different evaluation approaches (risky and conservative), particularly for the moderate earthquake (0.15 g). For example, the risky approach (0.15 g_R) shows a slight drop in accessibility, indicating that the system remains relatively functional despite the earthquake. This suggests that, in the case of moderate earthquakes, the impacts on global accessibility are relatively low. By contrast, the conservative approach shows more significant deteriorations in accessibility. The differences between the risky and conservative approaches are important as they highlight the uncertainties in assessing the earthquake’s consequences and their impact on the system’s functionality. In this case, the deviations between the conservative and risky approaches are primarily due to the relatively rough division of the assumed damage states into only three categories, which has a significant effect on the classification of individual buildings and the damage level assigned.
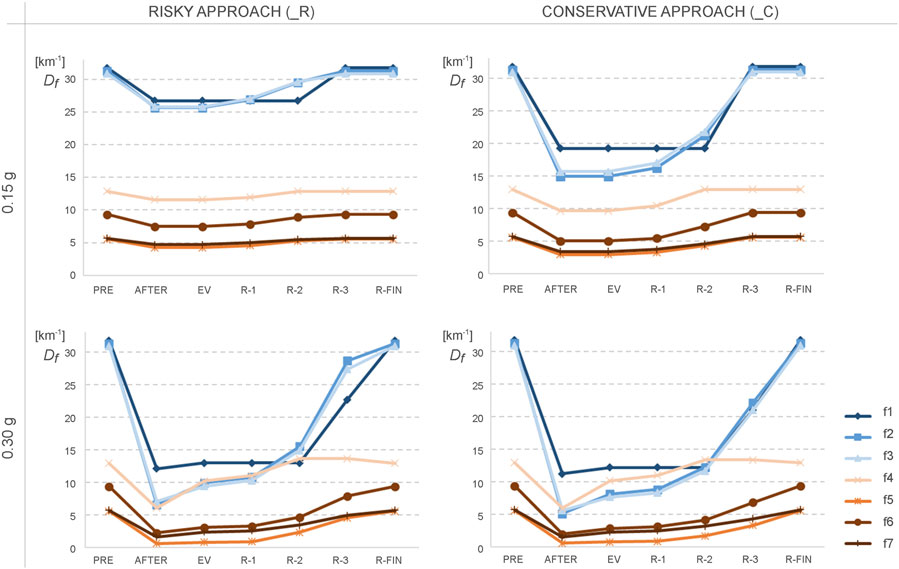
Figure 11. Global accessibility to urban functions (f1-7) in different time phases for various earthquake scenarios.
In the case of a stronger earthquake (0.30 g), the reductions in accessibility after the event were even greater, but no significant differences were observed between the risky and conservative approaches. The greatest drops were in accessibility to workplaces (79% for the risky scenario and 84% for the conservative scenario) and educational institutions (89% for the risky scenario and 90% for the conservative scenario). Accessibility to healthcare (f4) remained relatively stable due to the presumably adequate seismic resistance of healthcare facilities and their central location. An interesting aspect of this scenario is that accessibility to healthcare during the recovery phase was better than after the finalisation of the recovery process. This is due to the favourable location of healthcare facilities and the selected evacuation open spaces within the system.
4.2.4 Evaluation of urban system’s functionality
The functionality of the selected urban system in terms of fulfilling basic human needs in different time periods (pre- and post-earthquake, including immediately after the event, in the evacuation phase, and at different stages of restoration) was initially analysed from the perspective of each of the nine basic needs (Equation 5), and then the overall functionality of the city was determined (Equation 6). The hierarchy of needs relative to different time intervals from the disastrous event, defined by the expert panel (Section 3; Table 2), was taken into account as well. The results for the total functionality of the urban system for both analysed seismic intensities (with PGA 0.15 g and 0.30 g) and both damage assessment approaches (risky and conservative) are shown in Figure 12. The initial functionality F0 (before the earthquake event) was found to be at a relatively high level and equalled 18.35 EF (calculated using Equation 6). After the earthquake, a decrease in functionality was observed in all four evaluation scenarios. In the case of a moderate earthquake, minimal functionality of the urban system is still ensured (above 50% of its original value) after the event. However, in the case of a stronger earthquake, the functionality is significantly reduced (to about 1/3 of the original value), threatening the continued existence of the entire urban system. The figure also shows that the range of results (defined by the two damage assessment approaches, risky and conservative) is narrower in the event of the stronger earthquake (0.30 g). By contrast, for the moderate earthquake (0.15 g), large discrepancies between the two extreme values are observed. The greatest disparities occur 1 week after the earthquake, but during the recovery process, the discrepancy gradually decreases.
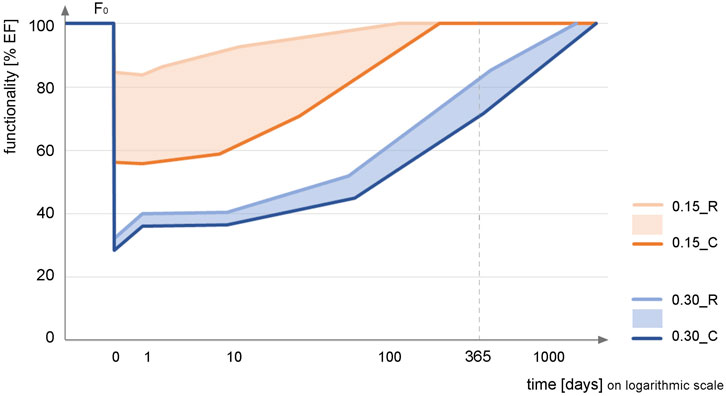
Figure 12. Functionality of the investigated urban system for all analysed earthquake scenarios.
Immediately after the main strike (t = 0), a strong drop in urban functionality is identified. In the following days (t ≥ 1 day), the residents prioritise different needs as restoration begins and the system starts to recover. The shape of the obtained curves is in accordance with the concept of the resilience triangle (Bruneau et al., 2003), which favours a steeper curve inclination in the early stages of the recovery process. In the case of a moderate earthquake, the system’s functionality returns to its original level F0 1 year after the earthquake, while in the case of a strong earthquake, the entire system is still in the recovery process, with functionality at around 3/4 of the original value F0. It turns out that in the case of a stronger earthquake (0.30 g) and under the considered assumptions, the recovery of the entire system is a long-lasting process, and it would take several years for it to return to its original level of functionality (F0) – more than 4 years in the case of the R scenario and more than five in the case of the C scenario. A quantitative resilience measure, represented by the area under the performance curve, illustrates the town’s resilience trajectory and recovery progress. Resilience is assessed as the proportion of the maximum potential area, with values ranging from 0 (indicating a system failure) to 1 (indicating a smooth system operation). In the analysed case, it was shown that the resilience of the urban system is highly dependent on the time of observation (Figure 13). The short-term resilience of the investigated urban system subjected to a moderate earthquake (0.15 g) is relatively high (65%–94%), meaning that in this case, the system is able to quickly restore the majority of essential urban functions. Conversely, in the case of a severe earthquake (0.30 g), the short-term resilience is only at approximately 40%, which indicates that the system cannot effectively provide basic functions in the early stages of recovery, which points to a critical vulnerability. However, the long-term resilience is found to be high, indicating a robust capacity for recovery over an extended period of time. This demonstrates that, while the immediate aftermath of a severe earthquake could significantly impair urban operations, the town is capable of robust recovery.
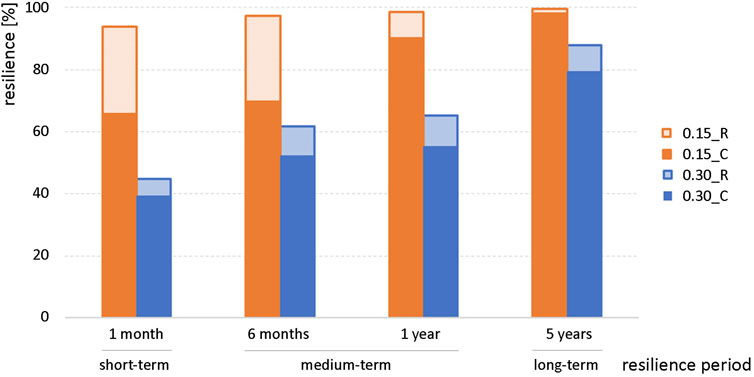
Figure 13. Short-term (1 month), medium-term (half a year to 1 year) and long-term (5 years) resilience of the investigated urban system.
In order to achieve a more detailed insight into the urban functionality, it should be divided in accordance with the extent to which every human need (n1 to n9) contributes to the overall functionality. In our case (Figure 14), the functionality values were normalised with respect to the need with the highest value, so that relative proportions among needs are preserved and the weakest functions become clearly visible. It was found that the contribution of survival needs (n1) increased after the earthquake, indicating the prioritisation of basic survival needs in crisis situations (Table 2). A stable level of functionality was maintained in relation to the need for protection (n2), whereas the functionality in relation to other needs notably decreased. The lowest level of functionality was observed in connection to the need for understanding (n4), both before and after the earthquake. This need is more dependent on the access to educational buildings (f5) and, to a lesser extent, on the access to workplaces (f2) and facilities providing mental and spiritual care (f7), whereas access to other urban functions has little impact on the need for understanding. A similarly low level of functionality was observed in relation to leisure (n6) and creativity (n7). These needs have a more limited impact on the overall functionality in a crisis situation as they are less prioritised compared to basic needs such as survival and protection. However, fulfilling the need for understanding is crucial for facilitating a quick response and an effective recovery of the city after a natural disaster such as an earthquake as it involves both informing and educating the residents. Furthermore, it plays an important role in developing the expertise related to the recovery and the ability of the authorities to effectively organise restoration efforts.
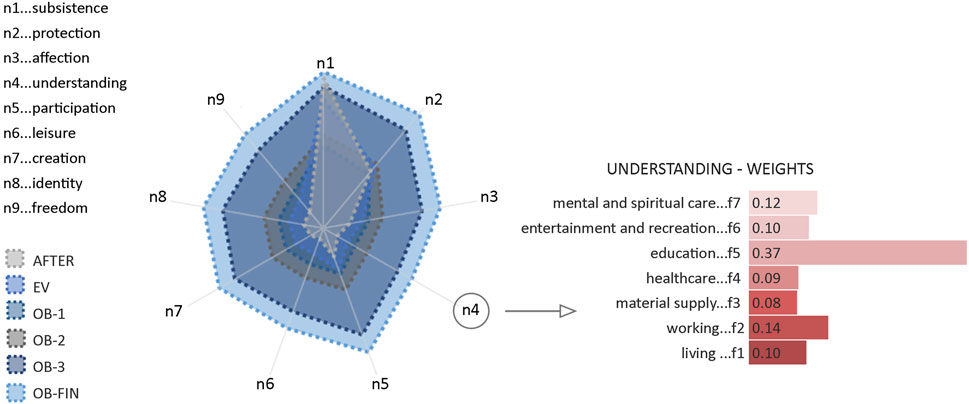
Figure 14. The town’s performance in the case of the 0.30 g_R scenario: normalised functionality levels in relation to different human needs (left) and weights of individual functions that contribute to satisfying the weakest need - the need for understanding (right).
5 Conclusion
This paper presents a unique model for evaluating the residents’ accessibility to essential urban functions, shifting the focus from traditional assessments of physical damage to the human-centred impacts on the quality of life. By prioritising the fulfilment of basic human needs during disasters, this research addresses how accessibility disruptions due to earthquake-induced debris can severely limit access to critical services, while not accounting for the operability of lifeline infrastructure (e.g., water, electricity, telecommunications). This holistic approach offers distinct insights into the indirect impacts of earthquakes, emphasising how barriers created by debris isolate communities and hinder their resilience. The proposed methodology, although focused on earthquake resilience, holds potential for urban planning and resilience-building in relation to various hazards. By adopting a complex-systems perspective, it provides planners with a comprehensive tool to evaluate vulnerabilities, support interdisciplinary insights, and foster a more resilient urban design.
Comparing the functionality of the urban system (a small Mid-European town) before and immediately after the assumed earthquake scenarios revealed significant reductions in accessibility, particularly in the town’s historic core and on its southern periphery. The most significant changes appeared under the stronger earthquake scenario with a 0.30 g peak ground acceleration, where accessibility dropped sharply. In this severe case, approximately one-third of residents completely lost access to essential urban functions. The historic centre, once highly accessible, suffered the greatest decline due to severe damage to key buildings and infrastructure, highlighting the vulnerability of densely interconnected urban areas. The findings suggest that reinforcing access in central areas and strategically expanding functions into peripheral zones could substantially improve the overall resilience of an urban system. Furthermore, accessibility to educational services emerges as a critical point of vulnerability within the urban framework. Disruptions in this function could have cascading effects, emphasising the need for prioritised intervention in post-earthquake recovery efforts to enhance the overall resilience of the system. The analysis also reveals a critical distinction between structural vulnerability on one hand and functional vulnerability on the other. The results further demonstrate that urban functionality depends not only on the integrity of structures but also on the spatial distribution and accessibility of essential services. While structural strength and stiffness are crucial, a dispersed layout of essential functions across the urban area allows the city to maintain continuity of services, even when some locations are compromised. This type of distributed model enables faster recovery and reduces the risk of functional paralysis in critical areas. The resilience of the urban system is heavily influenced by the robustness of its interconnections, suggesting that strengthening the network of urban linkages is as crucial as reinforcing individual structures.
In general, enhancing the resilience of an urban system can be achieved by improving various urban functions (prioritising those identified as most critical) and accessibility to them. This can be achieved by increasing capacity, expanding the existing facilities and improving their seismic resilience, strategically placing new objects, reducing the traffic load on key transportation links by adding alternative ones, ensuring appropriate safety distances (based on impact radius) between roads and buildings, making seismic reinforcements to the critical transport infrastructure (such as bridges, overpasses, and underpasses, which were not part of the presented case study of the town of Brežice), and implementing other measures. Furthermore, urban open spaces can provide a significant contribution to the resilience of an urban system as they can serve as safe locations for evacuation, temporary housing, and the organisation of recovery efforts after an earthquake. Therefore, it is essential to maintain existing open spaces, ensure their adaptability, and establish strong connectivity with the transportation network. This study focused on allocating temporary shelters to open spaces with optimal accessibility, yet the framework is open to extension. Other buildings or infrastructures could also serve as shelters if case-specific assessments are made, while real-world strategies such as relocation or partial rebuilding lie beyond the present scope but warrant future research. In addition to measures aimed at reshaping the urban design and the layout of the city, strategic planning for post-earthquake recovery is crucial for enhancing urban system resilience. However, measures to strengthen urban resilience must be grounded in a comprehensive approach that includes analytical evaluation and actively involves local communities.
The study’s assumptions and specific parameters introduce certain limitations, highlighting areas for further research and refinement. By embracing a holistic, interdisciplinary approach to urban resilience, this model contributes valuable perspectives for advancing the resilience of complex urban systems in the face of growing disaster risks.
Data availability statement
The original contributions presented in the study are included in the article/supplementary material, further inquiries can be directed to the corresponding author.
Author contributions
DK: Conceptualization, Methodology, Supervision, Writing – original draft, Writing – review and editing. KR: Conceptualization, Formal Analysis, Visualization, Writing – original draft, Writing – review and editing.
Funding
The author(s) declare that financial support was received for the research and/or publication of this article. The research presented in this paper was conducted within the scope of the research program “Sustainable planning for the quality living space” and is funded by the Slovenian Research and Innovation Agency (ARIS) under grant number P5-0068.
Acknowledgments
The authors gratefully acknowledge the financial support which was received from the Slovenian Research and Innovation Agency (Research core funding No. P5-0068). The authors would like to thank our colleague Assist. Prof. Matevž Juvančič for his valuable contribution to the formation and operation of the expert panel, as well as for his feedback on the conceptual framework, and Mr. Martin Mikuletič for his assistance in proofreading this manuscript.
Conflict of interest
The authors declare that the research was conducted in the absence of any commercial or financial relationships that could be construed as a potential conflict of interest.
Generative AI statement
The author(s) declare that no Generative AI was used in the creation of this manuscript.
Any alternative text (alt text) provided alongside figures in this article has been generated by Frontiers with the support of artificial intelligence and reasonable efforts have been made to ensure accuracy, including review by the authors wherever possible. If you identify any issues, please contact us.
Publisher’s note
All claims expressed in this article are solely those of the authors and do not necessarily represent those of their affiliated organizations, or those of the publisher, the editors and the reviewers. Any product that may be evaluated in this article, or claim that may be made by its manufacturer, is not guaranteed or endorsed by the publisher.
References
Abubakar, A. (2022). Towards a human-centred approach for enhancing place prosperity: defining and operating within the basic human needs. Open House Int. 47 (2), 190–206. doi:10.1108/OHI-12-2020-0171
Ahmad, N., Crowley, H., and Pinho, R. (2011). Analytical fragility functions for reinforced concrete and masonry buildings and buildings aggregates of euro-Mediterranean regions – UPAV methodology. Department of Structural Mechanics, University of Pavia. WP3-Task, 3. Internal report, Syner-G Project, 2009/2012, 2011.
Aksoy, C. G., Chupilkin, M., Koczan, Z., and Plekhanov, A. (2024). Unearthing the impact of earthquakes: a review of economic and social consequences. J. Policy Anal. Manag. 44, 1450–1471. doi:10.1002/pam.22642
Al-Humaiqani, M. M., and Al-Ghamdi, S. G. (2024). Robustness, redundancy, inclusivity, and integration of built environment systems: resilience quantification from stakeholders' perspectives. Front. Built Environ. 10, 1343334. doi:10.3389/fbuil.2024.1343334
Aldrich, D. P., and Meyer, M. A. (2015). Social capital and community resilience. Am. Behav. Sci. 59 (2), 254–269. doi:10.1177/0002764214550299
Alsayed, S. S. (2024). Urban human needs: conceptual framework to promoting urban city fulfills human desires. Front. Sustain. Cities 6, 1395980. doi:10.3389/frsc.2024.1395980
Anhorn, J., and Khazai, B. (2015). Open space suitability analysis for emergency shelter after an earthquake. Nat. Hazards Earth. Syst. Sci. 15, 789–803. doi:10.5194/nhess-15-789-2015
Argyroudis, S., Selva, J., Gehl, P., and Pitilakis, K. (2015). Systemic seismic risk assessment of road networks considering interactions with the built environment. Comp.-Aid. Civ. Infrastr. Eng. 30, 524–540. doi:10.1111/mice.12136
ATC (2021). ATC-138-3 report: seismic performance assessment of buildings, volume 8 – methodology for assessment of functional recovery time. Available online at: https://femap58.atcouncil.org/fr-methodology (Accessed December 10, 2021).
Aydin, N. Y., Duzgun, H. S., Wenzel, F., and Heinimann, H. R. (2018). Integration of stress testing with graph theory to assess the resilience of urban road networks under seismic hazards. Nat. Haz. 91, 37–68. doi:10.1007/s11069-017-3112-z
Battegazzorre, E., Bottino, A., Domaneschi, M., and Cimellaro, G. P. (2021). IdealCity: a hybrid approach to seismic evacuation modeling. Adv. Eng. Softw. 153, 102956. doi:10.1016/j.advengsoft.2020.102956
Borzi, B., Pinho, R., and Crowley, H. (2007). “SP-BELA: un metodo meccanico per la definizione della vulnerabilità basato su analisi pushover semplificate,” in Proceedings of XII convegno l’Ingegneria sismica in Italia ANIDIS 2007.
Borzi, B., Crowley, H., and Pinho, R. (2008). Simplified pushover-based earthquake loss assessment (SP-BELA) method for masonry buildings. Int. J. Arch. Herit. 2 (4), 353–376. doi:10.1080/15583050701828178
Bozza, A., Asprone, D., and Fabbrocino, F. (2017a). Urban resilience: a civil engineering perspective. Sustainability 9, 103. doi:10.3390/su9010103
Bozza, A., Asprone, D., and Manfredi, G. (2017b). A methodological framework assessing disaster resilience of city ecosystems to enhance resource use efficiency. Int. J. Urb. Sust. Devel. 9 (2), 136–150. doi:10.1080/19463138.2016.1244538
Bruneau, M., Chang, S. E., Eguchi, R. T., Lee, G. C., O’Rourke, T. D., Reinhorn, A. M., et al. (2003). A framework to quantitatively assess and enhance the seismic resilience of communities. Earthq. Spect. 19 (4), 733–752. doi:10.1193/1.1623497
Cardoso, R., Sobhani, A., and Meijers, E. (2021). The cities we need: towards an urbanism guided by human needs satisfaction. Urb. Stud. 59 (13), 2638–2659. doi:10.1177/00420980211045571
Castro, S., Poulos, A., Herrera, J. C., and de la Llera, J. C. (2018). Modeling the impact of earthquake-induced debris on tsunami evacuation times of coastal cities. Earthq. Spect. 35 (1), 137–158. doi:10.1193/101917EQS218M
Cavallaro, M., Asprone, D., Latora, V., Manfredi, G., and Nicosia, V. (2014). Assessment of urban ecosystem resilience through hybrid social–physical complex networks. Infrastr. Eng. 29, 608–625. doi:10.1111/mice.12080
Ceferino, L., Merino, Y., Pizarro, S., Moya, L., and Ozturk, B. (2024). Placing engineering in the earthquake response and the survival chain. Nat. Communic. 15, 4298. doi:10.1038/s41467-024-48624-3
Cook, D. T., Liel, A. B., Haselton, C. B., and Koliou, M. (2022). A framework for operationalizing the assessment of post-earthquake functional recovery of buildings. Earthq. Spect. 38 (3), 1972–2007. doi:10.1177/87552930221081538
Costa, C., and Silva, V. (2024). “Assessing the accessibility to healthcare facilities in urban centres following seismic events,” in Proceedings of the 18th world conference on earthquake engineering (WCEE2024) (Milan, Italy).
Costa, C., and Silva, V. (2025). Estimating road disruptions in urban contexts due to earthquakes using machine learning surrogates. Earthq. Engng. Struct. Dyn. 54, 1799–1818. doi:10.1002/eqe.4318
Derrible, S., and Kennedy, C. (2011). Applications of graph theory and network science to transit network design. Transp. Rev. 31 (4), 495–519. doi:10.1080/01441647.2010.543709
Di Ludovico, M., De Martino, G., Manfredi, V., Masi, A., Prota, A., Sorrentino, L., et al. (2023). Loss functions for the risk assessment of residential buildings. Buildings 13, 2817. doi:10.3390/buildings13112817
El-Maissi, A. M., Argyroudis, S. A., and Nazri, F. M. (2021). Seismic vulnerability assessment methodologies for roadway assets and networks: a state-of-the-art review. Sustainability 13, 61. doi:10.3390/su13010061
El-Maissi, A. M., Argyroudis, S. A., Kassem, M. M., and Nazri, F. M. (2023). Integrated seismic vulnerability assessment of road network in complex built environment toward more resilient cities. Sust. Cit. Soc. 89, 104363. doi:10.1016/j.scs.2022.104363
Gao, L., Wang, M., Liu, A., and Gong, H. (2021). Comprehensive evaluation of urban road network resilience facing earthquakes. Math. Probl. Eng. 2021, 1–12. doi:10.1155/2021/6659114
García-Torres, S., Kahhat, R., and Santa-Cruz, S. (2017). Methodology to characterize and quantify debris generation in residential buildings after seismic events. Resour. Conserv. Recycl. 117 (B), 151–159. doi:10.1016/j.resconrec.2016.11.006
Golla, A. P. S., Bhattacharya, S. P., and Gupta, A. (2020). The accessibility of urban neighborhoods when buildings collapse due to an earthquake. Transp. Res. Part D. Transp. Environ. 86, 102439. doi:10.1016/j.trd.2020.102439
Guida, C., and Carpentieri, G. (2021). Quality of life in the urban environment and primary health services for the elderly during the Covid-19 pandemic: an application to the city of milan (Italy). Cities 110, 103038. doi:10.1016/j.cities.2020.103038
Hassan, S. A., Amlan, H. A., Alias, N. E., Kadir, M. A. A., Mashros, N., and Sukor, N. S. A. (2022). Vulnerability of road transportation networks under natural hazards: a bibliometric analysis and review. Int. J. Dis. Risk Red. 83, 103393. doi:10.1016/j.ijdrr.2022.103393
Hosseini, Y., Mohammadi, R. K., and Yang, T. Y. (2024). A comprehensive approach in post-earthquake blockage prediction of urban road network and emergency resilience optimization. Reliab. Eng. and Syst. Saf. 244, 109887. doi:10.1016/j.ress.2023.109887
Hsu, C. H., Ke, S. S., and Wu, T. H. (2022). Development and application of a platform for multidimensional urban earthquake impact simulation. Front. Built Environ. 8, 938747. doi:10.3389/fbuil.2022.938747
Iskandar, R., Al Tfaily, B., Cornou, C., Bard, P. Y., Guillier, B., Harb, J., et al. (2023). Estimating urban seismic damages and debris from building-level simulations: application to the city of Beirut, Lebanon. Bull. Earthq. Eng. 21, 5949–5990. doi:10.1007/s10518-023-01768-x
Knez, M., Muneer, T., Jereb, B., and Cullinane, K. (2014). The estimation of a driving cycle for Celje and a comparison to other European cities. Sust. Cit. Soc. 11, 56–60. doi:10.1016/j.scs.2013.11.010
Koren, D., and Rus, K. (2019). The potential of open space for enhancing urban seismic resilience: a literature review. Sust. 11, 5942. doi:10.3390/su11215942
Koren, D., and Rus, K. (2021). “Assessment of a city’s performance under different earthquake scenarios,” in Proceedings of the 1st Croatian conference on earthquake engineering 1CroCEE, Zagreb, Croatia 2021.
Koren, D., and Rus, K. (2023). Framework for a city's performance assessment in the case of an earthquake. Buildings 13, 1795. doi:10.3390/buildings13071795
Koren, D., and Rus, K. (2024). “Assessment of community response to an earthquake via accessibility to urban functions,” in Proceedings of the 18th World Conference on Earthquake Engineering (WCEE2024) (Milan, Italy).
Latora, V., and Marchiori, M. (2001). Efficient behavior of small-world networks. Phys. Rev. Lett. 87, 198701. doi:10.1103/PhysRevLett.87.198701
Leal, J. E. (2020). AHP-express: a simplified version of the analytical hierarchy process method. MethodsX 7, 100748. doi:10.1016/j.mex.2019.11.021
Li, Z., and Yan, W. (2024). Service flow changes in multilayer networks: a framework for measuring urban disaster resilience based on availability to critical facilities. Lands. Urb. Plan. 244, 104996. doi:10.1016/j.landurbplan.2023.104996
Li, L., Wang, J., Yuan, J., Gu, T., Ling, S., and Zhan, H. (2025). Unlocking physical resilience capacities of building systems: an enhanced network analysis approach. Buildings 15, 641. doi:10.3390/buildings15040641
Lin, J., Li, Y., Wang, L., Wang, J., Zhang, T., and Wu, W. (2024). A Bayesian and analytic hierarchy process-based multilevel community resilience evaluation method and application study. Sustainability 16, 6004. doi:10.3390/su16146004
Lin, X., Chen, Z., Song, C., and Zhong, J. (2024). “Simulation on post-earthquake accessibility of road network considering falling debris of buildings,” in Proceedings of the 18th world conference on earthquake engineering (WCEE2024) (Milan, Italy).
Liu, K., Zhai, C., Dong, Y., and Meng, X. (2022). Post-earthquake functionality assessment of urban road network considering emergency response. J. Earthq. Eng. 27 (9), 2406–2431. doi:10.1080/13632469.2022.2113001
Markelj, J., Kitek Kuzman, M., Grošelj, P., and Zbašnik-Senegačnik, M. (2014). A simplified method for evaluating building sustainability in the early design phase for architects. Sustainability 6 (12), 8775–8795. doi:10.3390/su6128775
Maslow, A. H. (1943). A theory of human motivation. Psychol. Rev. 50 (4), 370–396. doi:10.1037/h0054346
Max-Neef, M. A. (1991). Human scale development: conception, application and further reflections. New York: The Apex Press.
Meerow, S., and Newell, J. P. (2019). Urban resilience for whom, what, when, where, and why? Urb. Geogr. 40 (3), 309–329. doi:10.1080/02723638.2016.1206395
Miano, A., Civera, M., Aloschi, F., De Biagi, V., Chiaia, B., Parisi, F., et al. (2024). Efficiency assessment of urban road networks connecting critical node pairs under seismic hazard. Sustainability 16, 7465. doi:10.3390/su16177465
Moreno, C., Allam, Z., Chabaud, D., Gall, C., and Pratlong, F. (2021). Introducing the “15-Minute city”: sustainability, resilience and place identity in future post-pandemic cities. Smart Cities 4, 93–111. doi:10.3390/smartcities4010006
Mouratidis, K. (2021). Urban planning and quality of life: a review of pathways linking the built environment to subjective well-being. Cities 115, 103229. doi:10.1016/j.cities.2021.103229
Okulicz-Kozaryn, A. (2013). City life: rankings (livability) versus perceptions (satisfaction). Soc. Indic. Res. 110 (2), 433–451. doi:10.1007/s11205-011-9939-x
Pei, S., Zhai, C., Hu, J., Liu, J., and Song, Z. (2023). Seismic functionality of healthcare network considering traffic congestion and hospital malfunctioning: a medical accessibility approach. Int. J. Dis. Risk Red. 97, 104019. doi:10.1016/j.ijdrr.2023.104019
Petrovčič, S., Prašnikar, P., and Kilar, V. (2025). Seismic assessment and FRCM strengthening of post-war masonry residential buildings: a case study on building typologies. Int. J. Dis. Risk Red. 119, 105341. doi:10.1016/j.ijdrr.2025.105341
Pitilakis, K., Crowley, H., and Kaynia, A. M. (2014). SYNER-G: typology definition and fragility functions for physical elements at seismic risk. Dordrecht: Springer.
Rus, K. (2025). Resilience assessment of an urban system and the potentials of open space in the case of an earthquake. (in Slovene). [dissertation in preparation]. Ljubljana: University of Ljubljana, Faculty of Architecture.
Rus, K., Kilar, V., and Koren, D. (2018). Resilience assessment of complex urban systems to natural disasters: a new literature review. Int. J. Dis. Risk Red. 31, 311–330. doi:10.1016/j.ijdrr.2018.05.015
Rus, K., Kilar, V., and Koren, D. (2020). “Configuration of a city street network to support urban seismic resilience,” in Proceedings (eds. Fikfakt et al.) of City Street4: streets for 2030: proposing streets for integrated, and universal mobility (Ljubljana, Slovenia).
Saaty, R. W. (1987). The analytic hierarchy process—what it is and how it is used. Math. Model 9 (3), 161–176. doi:10.1016/0270-0255(87)90473-8
Saaty, T. L. (1990). How to make a decision: the analytic hierarchy process. Eur. J. Oper. Res. 48 (1), 9–26. doi:10.1016/0377-2217(90)90057-I
Shang, Q., Guo, X., Li, J., and Wang, T. (2022). Post-earthquake health care service accessibility assessment framework and its application in a medium-sized city. Reliab. Eng and Syst. Saf. 228, 108782. doi:10.1016/j.ress.2022.108782
Sharifi, A., and Yamagata, Y. (2016). On the suitability of assessment tools for guiding communities towards disaster resilience. Int. J. Dis. Risk Red. 18, 115–124. doi:10.1016/j.ijdrr.2016.06.006
Silva, V., Brzev, S., Scawthorn, C., Yepes, C., Dabbeek, J., and Crowley, H. (2022). A building classification system for multi-hazard risk assessment. Int. J. Dis. Risk Sci. 13, 161–177. doi:10.1007/s13753-022-00400-x
Singh, S., and Kumar, V. (2024). Modelling the determinants for sustainable smart city through interpretive structure modelling and analytic hierarchy process. Comput. Urban Sci. 4, 16. doi:10.1007/s43762-024-00125-1
Slovenian Environment Agency (2024). Seismic hazard map. Available online at: https://potresi.arso.gov.si/doc/dokumenti/potresna_nevarnost/ (Accessed December 23, 2024).
Syner-G (2022). Syner-G project. Available online at: http://www.vce.at/SYNER-G/index.htm (Accessed October 14, 2022).
Terzic, V., Villanueva, P. K., Saldana, D., and Yoo, D. Y. (2021). Framework for modelling post-earthquake functional recovery of buildings. Eng. Struct. 246, 113074. doi:10.1016/j.engstruct.2021.113074
Verovšek, Š., Juvančič, M., Petrovčič, S., Zupančič, T., Svetina, M., Janež, M., et al. (2022). An integrative approach to neighbourhood sustainability assessments using publicly available traffic data. Comput. Environ. Urban Syst. 95, 101805. doi:10.1016/j.compenvurbsys.2022.101805
Wilson, R. J., and Watkins, J. J. (1990). Graphs: an introductory approach: a first course in discrete mathematics. New York: John Wiley and Sons Inc.
Xie, L., Zhao, Y., Wen, W., and Zhai, C. (2025). From earthquake resistance structure to earthquake resilience city – urban seismic resilience assessment. Earthq. Eng. Eng. Vib. 24, 1–13. doi:10.1007/s11803-025-2294-8
Yu, Y. C., and Gardoni, P. (2022). Predicting road blockage due to building damage following earthquakes. Reliab. Eng and Syst. Saf. 219, 108220. doi:10.1016/j.ress.2021.108220
Zhang, X., Miller-Hooks, E., and Denny, K. (2015). Assessing the role of network topology in transportation network resilience. J. Transp. Geogr. 46, 35–45. doi:10.1016/j.jtrangeo.2015.05.006
Zhao, Z., Li, Z., Wang, T., Lin, Z., and Fang, D. (2025). Post-disaster recovery planning for infrastructure systems based on residents’ needs: a hypernetwork approach. Int. J. Dis. Risk Red. PRESS 118, 105258. doi:10.1016/j.ijdrr.2025.105258
Zhou, Y., Wang, J., and Sheu, J. B. (2019). On connectivity of post-earthquake road networks. Transp. Res. Part E Logist. Transp. Rev. 123, 1–16. doi:10.1016/j.tre.2019.01.009
Keywords: earthquake, urban system, seismic fragility, building stock, accessibility, functionality, urban functions, human needs
Citation: Koren D and Rus K (2025) Impact of earthquake-induced building debris on urban network functionality and citizen accessibility to urban functions. Front. Built Environ. 11:1602963. doi: 10.3389/fbuil.2025.1602963
Received: 30 March 2025; Accepted: 30 September 2025;
Published: 27 October 2025.
Edited by:
Pia Hollenbach, Zurich University of Applied Sciences, SwitzerlandReviewed by:
Ahsana Parammal Vatteri, University College London, United KingdomFilipe Ribeiro, National Laboratory for Civil Engineering, Portugal
Copyright © 2025 Koren and Rus. This is an open-access article distributed under the terms of the Creative Commons Attribution License (CC BY). The use, distribution or reproduction in other forums is permitted, provided the original author(s) and the copyright owner(s) are credited and that the original publication in this journal is cited, in accordance with accepted academic practice. No use, distribution or reproduction is permitted which does not comply with these terms.
*Correspondence: David Koren, ZGF2aWQua29yZW5AZmEudW5pLWxqLnNp