 Oluwayemi-Oniya Aderibigbe
 Trynos Gumbo
- Department of Urban and Regional Planning, Faculty of Engineering and Built Environment, Sustainable and Smart Cities and Regions Research Group, University of Johannesburg, Johannesburg, South Africa
Introduction: Good public transport accessibility is often linked to increased active travel, yet Q6 gender differences in this area are relatively under-researched. Our study aimed to explore these gender variations in active mobility within Johannesburg, South Africa. To achieve this, we utilized a robust research design, collecting primary data through an online survey administered via Google Forms.
Methods: A total of 425 structured questionnaires was distributed using a random sampling approach, with the survey being sent through email and social media platforms such as WhatsApp and Facebook. Respondents provided information on their socioeconomic characteristics, travel behaviours, and factors influencing their use of active travel. We employed the Likert scale method for response ranking and used the binary logistic model being a choice model to validate the Likert scale results and also explain reasons for respondents actions based on their choices.
Results and discussions: Our findings indicated significant gender-based differences in both socio-economic and travel characteristics. Factors influencing active mobility for women, in particular, included, car ownership, income level, availability of pedestrian facilities, travel time, age, safety, and the condition of public transport. Based on these findings, we recommend that policymakers consider gender differences that support the use of active travel especially in the area of safety, as well as provision of specific public transport infrastructures to accommodate the needs of women in accordance to their age and life cycle in the study area.
1 Introduction
Over the past decade, experts in transport planning, geography, economics, and policy have increasingly recognized global differences in travel behaviours and activity patterns between men and women. This awareness has driven research into the complex links among transportation, mobility, and gender across both developed and developing contexts (Rosenbloom et al., 1993; Spitzner, 1998; Terlinden, 1994; Fernando, 1997; Kinyingi et al., 2020). However, gender-focused transport studies remain limited and less conclusive in less developed countries.
Walking, the most fundamental and oldest transport mode, is integral to nearly all trips. Despite its importance, serious attention to walking only emerged in recent decades. European cities have generally supported walking better than regions like North America and Australia. Yet, during the car-focused planning of the 1950s and 1960s, even European pedestrians were largely neglected (Buehler et al., 2017). Goel et al. (2023) argue that walking and cycling should be integrated into daily life as essential physical activities. Active travel is linked to Heightened physical activity (Roth et al., 2012; Sahlqvist et al., 2012), which significantly reduces all-cause mortality and the risks of chronic illnesses, such as cardiovascular disease, diabetes, and cancer (Bull et al., 2025; Warburton and Bredin, 2017). Promoting active travel is therefore critical to public health.
Motherwell (Motherwell, 2018) observes that efforts to build inclusive cities have stalled, and women still face numerous travel-related barriers. The COVID-19 pandemic highlighted the potential of reducing motorized travel to improve urban quality (Goenaga et al., 2021; Albayati et al., 2021; Liu and Stern, 2021; Wang and Li, 2021; Aderib et al., 2025), while also exposing planning flaws—such as inadequate walking infrastructure, lack of local services, and difficulty accessing areas without a car, especially when public transport is unsafe or unavailable. These issues call for more sustainable, equitable, inclusive, and safe mobility systems.
Though women understand the benefits of active travel, inclusivity demands a planning shift that involves all genders from the outset. Haynes et al. (2019) show growing evidence of gender differences in commute lengths, trip purposes, mode choices, and how life events—like childbirth—affect mobility differently. The focus must move from expecting women to adapt, to embedding gender analysis into transport policy and planning. While walking has been extensively studied in developed nations, it is under-researched in developing countries like South Africa. Furthermore, gender disparities in active mobility remain inadequately addressed in many developing regions, where women are among the most vulnerable populations.
Hence, this study fills that gap by examining gender variation in the use of active mobility. This approach should consider the evidence and lived experiences of women who have been found to be fundamentally deprived from achieving basic life goals compared to the male counterparts due to the differences in their socio-economic status and family commitment, such as childbearing, among others, which impact their mobility. Given the varying degrees of gender inequality across different countries, This study contributes to existing research by isolating variation in factors influencing active trave by gender, as well as identifying difficulties being faced by women in utilizing active mobility which has been found to be of great importance to health and wellbeing of individuals in the society. Based on this, we aimed to assess the progress made toward gender equality in active travel, with an emphasis on the experiences of women who cycle and walk in the urban context of Johannesburg, South Africa.
1.1 Literature review
1.1.1 General overview of active travel
In the past decade, urban planning has shifted toward compact, integrated, and pedestrian-friendly neighbourhoods, promoting healthier, inclusive communities through improved active transportation networks. Pentikainen (2013) and Aderibigbe and Gumbo (2023) emphasize the vital role of these networks in advancing public health, safety, social cohesion, econo3) mic vitality, and environmental sustainability.
Active transport directly supports health. Suburbanisation and car-centric infrastructure negatively affect wellbeing. Transport Canada (2011) reports that 60% of Canadian adults and 26% of youth are overweight or obese. Promoting walking and cycling boosts physical activity, helping reduce obesity and diabetes. Socially, active travel improves mental health by encouraging interaction and reducing isolation (Ontario Professional Planning Institute OPPI, 2012), fostering stronger community ties beyond car use.
Safety is another benefit. Well-designed urban areas reduce pedestrian and cyclist injuries, especially for vulnerable groups like children and the elderly (Ontario Professional Planning Institute OPPI, 2012). Environmentally, active transport lowers greenhouse gas emissions. Short car trips, where emissions are highest at start-up, can be replaced with walking or cycling (Transport Canada, 2011).
These networks are inclusive, supporting people regardless of age, health, or income (Aldred et al., 2017). Yet, Aderibigbe and Gumbo (2024) note that in developing countries, built environments often limit accessibility, diminishing quality of life. Gender disparities in active mobility persist, with women citing fear, crime, and inadequate pedestrian facilities such as sidewalks, rest points, shade areas among other factors as major barriers. Studies by Aboyeji and Aguda (2024), Roulet et al. (2024), and McHenry et al. (2023) confirm active mobility’s role in enhancing societal wellbeing. Therefore, there is an urgent need for transport infrastructure that supports women’s mobility, particularly in active travel.
1.1.2 Gender and transport
Women tend to be more cautious about traffic risks, contributing to gender differences in active travel uptake (Aldred et al., 2017; Garrard et al., 2008). Cultural norms, safety concerns, and fears of sexual harassment discourage many from using certain transport modes or travelling at particular times (Iqbal et al., 2020; Phadke, 2013). Gekoski et al. (2017) found that women often feel unsafe while walking, cycling, or using public transport, making active travel less accessible.
Goel et al. (2021), studying 19 global cities, reported that women walk and use public transport more than men but cycle less. Regional differences in gendered mobility are also evident. Althof et al. (2020), using mobile data from 100 countries, revealed high walking inequality in Qatar, Saudi Arabia, and Malaysia, while Sweden, Ukraine, and Russia showed the least disparity. Studies by Haynes et al. (2019), and Aderibigbe and Gumbo (2023) identified factors such as urban design, infrstaructural provision, trip purpose, travel time among others as a major cause of regional disparity in the effective utilization of non-motorised travel in cities of both developed and developing countries. For instance, the level of infrastructural provision to support active mobility in developed countries can not be compared to the developing countries as most of these transport infrastrutures are either inadequate or unavailable in most of the developing countries like South Africa. Addressing gender gaps in physical activity can boost public health by increasing women’s mobility. Deike (2002) noted gendered transport preferences, with many women depending on walking. In Dhaka and Lima, walking rates were similar across genders, but women walked 52% more in Pune, 61% more in Bamako, and twice as much in Ashgabat. In Bamako, 87% of women lacked private transport, compared to 57% of men. Deike (2002) highlighted:
• Women are more likely than men to depend solely on walking.
• Public transport use is higher among women.
• Women have less access to motorised vehicles.
• Bicycle and intermediate transport use is lower among women.
In urban Africa, cycling remains largely inaccessible to women due to cultural norms, safety risks, and poor infrastructure. Though bikes are widely available in Pune (Deike, 2002), only 2% of female trips are by bicycle, compared to 12% for men (Astrop, 1998). In contrast, China and Vietnam show near-equal cycling rates between genders. In Vietnam, rising motorcycle ownership has led to over 50% of women’s trips by bike, compared to 38% for men (Godard and Cusset, 1996).
In South Africa, GIZ (2021) found that pedestrians often walk 15 min to over an hour to reach bus stations. About 31% walk 16–30 min, while 30.4% walk 31–60 min to the nearest train station. Safety remains a major issue—over 30% are dissatisfied with walking route security, and 70%–80% of households report concerns about walking to public transport.
Despite women forming a significant share of South Africa’s population, transport infrastructure often prioritises male mobility needs (GIZ, 2021). Women make shorter trips, mostly during off-peak hours, and prioritise household tasks, leading to greater reliance on active travel. Factors such as age, distance, cost, and transport infrastructure—including sidewalks, cycle paths, and street lighting—affect active mobility use (Jennings et al., 2020; Olojede et al., 2017). Safety concerns, employment levels, and cultural constraints further shape women’s active travel choices (Goel et al., 2023). In Johannesburg, walking and cycling occur year-round, though cycling is mainly recreational. Strava Metro (2023) recorded 10,931 cycling trips in October 2022 and 8,345 in October 2023. Similarly, most walking trips were leisure-oriented, with 444,133 in 2022 and 418,144 in 2023—suggesting that residents view active mobility more as recreation than daily transport.
Data from Statistics South Africa (2021) (see Figure 1; Table 1) show that active mobility use is low among adults, both male and female, compared to youths. A majority of learners (55.9%–72.8%) in grades 1–12 across urban and rural households use active travel, with males more likely to walk for school trips. In contrast, only 4.8% and 3.0% of adult Black Africans walk for transport, indicating age as a key factor in active mobility use.
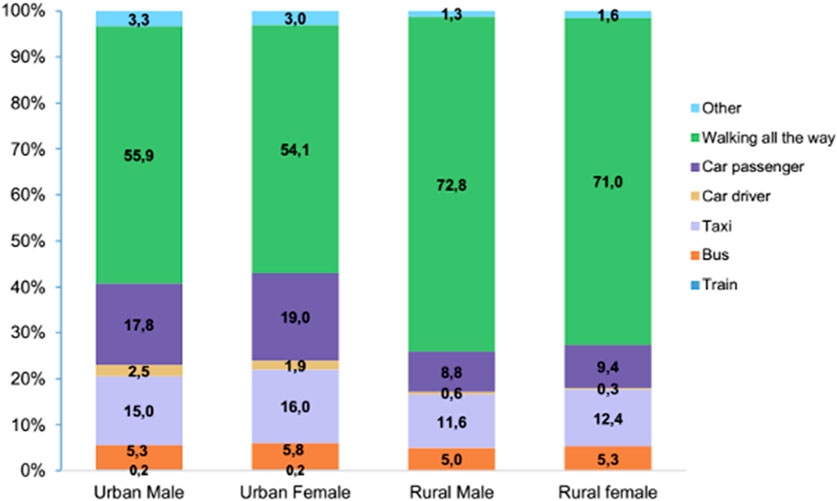
Figure 1. Gender Difference in Transport Mode for the young adults (Grade 1–12) in South Africa. Source: NHTS 2020 Adapted from Statistics South Africa, (2021).
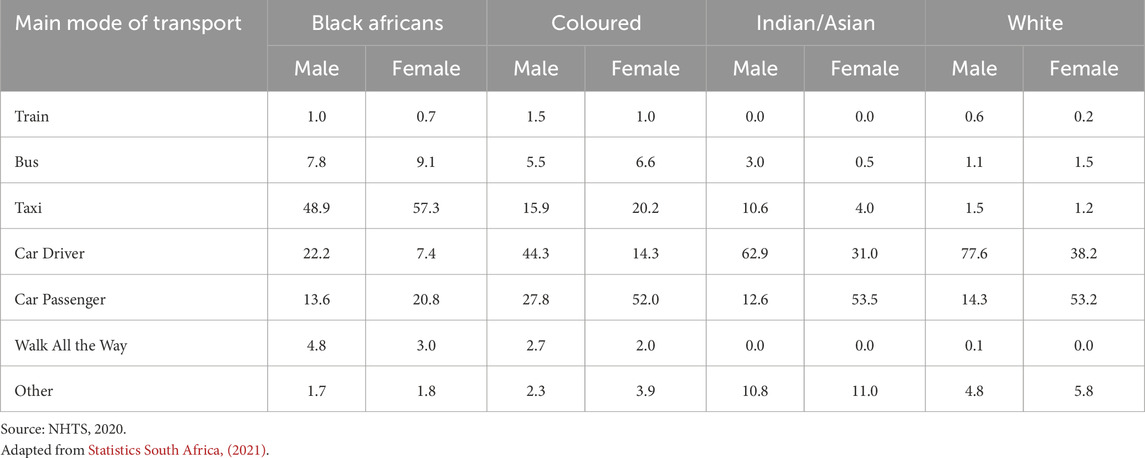
Table 1. Gender difference in Transport Mode for Adults in South Africa.
Overall, mobility patterns show clear gender disparities. Women tend to differ from men in trip purpose, travel distance, and mode choice (Alessandretti et al., 2020; Gauvin et al., 2020; Garrard et al., 2008; Law, 2002; Ravensbergen et al., 2019), largely due to childcare and domestic roles linked to employment inequality (Kwan, 2000; Peters, 2011). Greater concern over traffic risks (Aldred et al., 2017; Garrard et al., 2008), along with cultural norms, gender roles, and fears of harassment (Iqbal et al., 2020; Phadke, 2013), further limit women’s mobility choices.
As seen in Figure 1; Table 1, and contrary to study by Deike (2002) where women utilized the non motorised transport (walking) more, the case is different for women in Johannesburg, South Africa. This further explains the regional differences in the use of active mobility across regions. For instance, result of the study as evidenced and revealed in Figures 1, 2 showed that men utilized active mobility (walking) more than their female counterparts in South Africa, which is quite different from the study conducted by Deike (2002) in Pune and Bamako. Hence, the issue of regional differences in the use of active mobility varies across zones based on the design of the environment, availability of infrastructures among other factors.
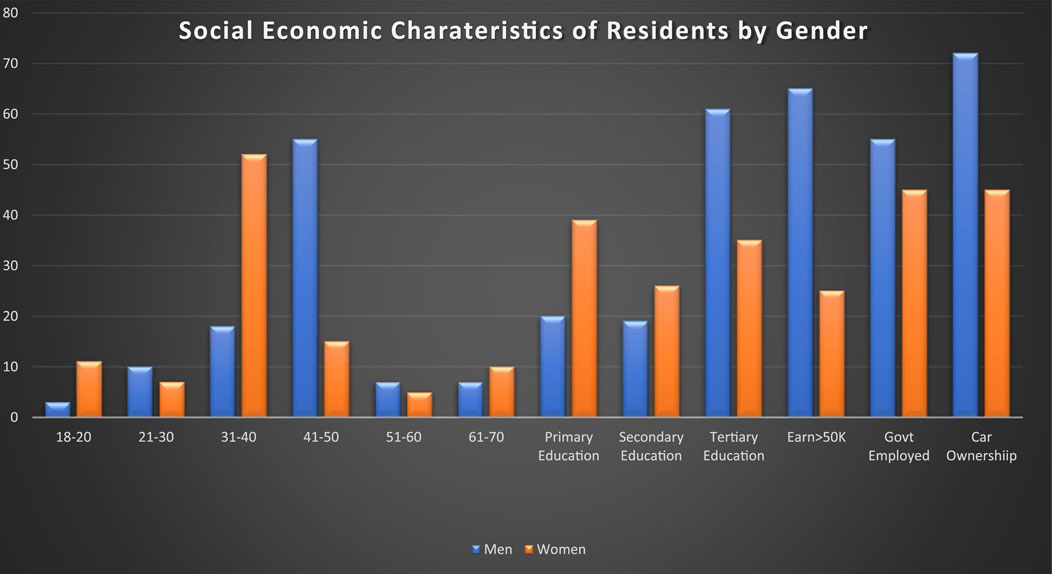
Figure 2. Socio-economic characteristics of respondents by gender. Source: Author’s Field survey.
2 Materials and methods
The study utilised primary data from an online survey conducted via Google Forms using random sampling. The survey was shared on Facebook, WhatsApp, and institutional emails to reach Johannesburg residents. Designed in line with previous research (Aderib et al., 2025; Lee et al., 2021), the survey yielded 425 completed questionnaires for analysis.
The data covered socio-demographics, travel characteristics, and gender-based factors influencing active mobility. Section 1 gathered socio-economic details, including gender, age, education, income, and marital status. Section 2 focused on travel data such as trip frequency, travel purposes (work, shopping, healthcare, recreation), duration, transport modes, and expenses. The final section examined factors affecting active mobility use.
The sample size was determined using the Taro Yamane (see Equation 1), suitable for finite populations with a known size. The formula used for sample size calculation is as follows:
where
n: Required sample size,
N: Total population (5,782,747), and
e: Margin of error (MoE): 5% or 0.05 (This is due to the 95% confidence level which explains the true proportion of active mobility users by gender. This is expected to be the true population of value, hence its adoption)
A report published by Statistics South Africa in 2022, and cited by the World Population Review (World Population Review, 2022), estimated Johannesburg’s population at 5,782,747 in the year 2020. Using this population figure, a sample size of 400 was derived. The calculation process is presented below:
2.1 Model specifications
The research data was coded and analyzed using the Statistical Package for Social Sciences (SPSS) percentages and the Relative Importance Index (RII) was utilized to evaluate the impact of various factors influencing the decision to walk or refrain from walking. Participants rated the significance of each factor on a Likert Scale ranging from 1 (Very Low) to 5 (Very High). These ratings were subsequently converted into (See Equation 2) for each factor, calculated using the following formula:
W represents the weight (i = 1–5, with 5 highest) assigned by respondents, and N is the total number of respondents. A higher Relative Importance Index (RII) indicates greater influence on respondents’ vulnerability. Factors were ranked by RII to assess their perceived importance in influencing active travel decisions. The RII reflects the mean importance of each factor in the study.
The Relative Importance Index (RII) results were confirmed using binomial logistic regression, which models commuting patterns by assessing respondents’ mode choices based on utility maximization theory (Hensher and Johnson, 2018). To validate Likert scale findings and examine factors influencing shifts toward active travel, a binary logistic regression model was applied.This model allows us to analyse the relationship between independent variables and the probability of the event of interest (Y = 1), as expressed in Equation 3. This model is also appropriate for our study as our research question focusses on a binary outcome such as walking/cycling.
Equation 4 calculates the probability (Pr) of the event of interest based on the independent variable (x). Additionally, Equation 4 determines the value of x in terms of the coefficients (βn) corresponding to the independent variables.
where
2.2 Assigning variable codes
A binary logistic regression model was employed to analyse the factors influencing the shift in transportation modes towards active travel. The quantitative questionnaire utilised in the study collected data on the dependent and ten independent variables, which were utilised to construct the binary logistic model. Among these variables, the dependent variable of the model was “Gender representing the prediction of future travel behaviour based on gender towards the adoption of active mobility. It had two possible Sustainability 1 (female) and 0 (male). The other ten variables served as independent variables in the model. These independent variables comprised a range of types such as age and travel cost, car ownership, safety, travel distance, pedestrian facilities among others. To facilitate the analysis, each variable was coded with specific values, and their definitions are outlined in Table 2.
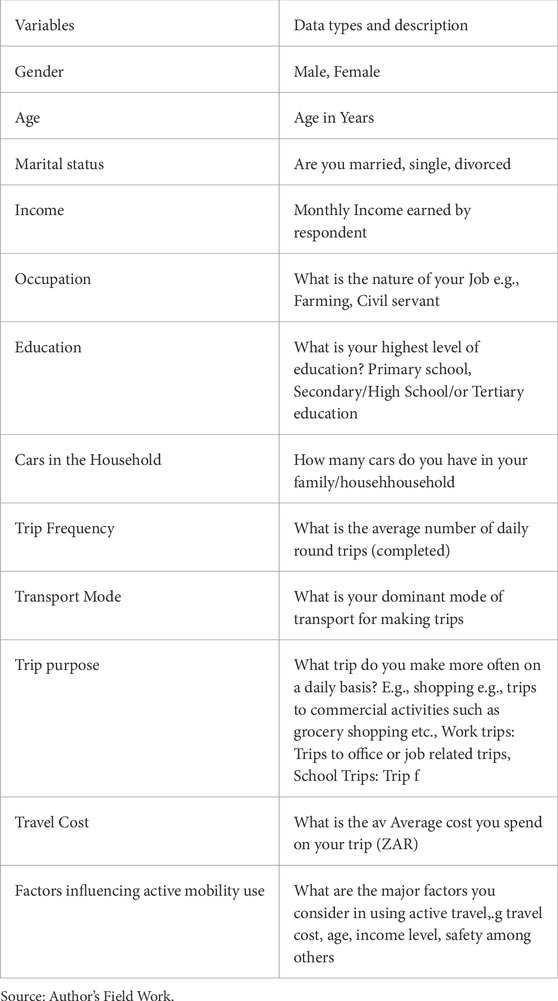
Table 2. Data types and Variables description.
3 Results
3.1 Socio-Economic Characteristics of Respondents
Survey data on residents’ socio-economic profile (see Figure 2) includes age, marital status, education, income, occupation, and car ownership. Most women (52%) are aged 31–40, while most men (55%) are 41–50. Few respondents were 61–70 (7% men, 10% women), likely due to retirement and limited online participation.
Men are generally more educated, with 61% holding postgraduate degrees compared to 35% of women. Government employment is higher among men (55%) than women (45%), reflecting a gender gap in public sector jobs. This also affects income: 65% of men earn over R50,000 monthly, while 65% of women earn between R20,000 and R30,000. This is because majority of women in the study who are not employed with the government engage in buyng and selling activities which does not yield high income compared to their male counterparts in government owned businesses or organisations. Car ownership further illustrates socio-economic disparities: 72% of men have access to a car compared to 45% of women, indicating greater automobile dependency among men. Moreover, while 45% of women have at least one vehicle in their household, 50% do not have any access to a vehicle.
3.2 Travel characteristics of household
Over time, women display distinct travel patterns from men in mode choice, trip purpose, timing, distance, routes, and trip chaining, highlighting the importance of gender-based travel analysis. Our study shows women make more trips—65% take two round trips daily—while 58% of men make one, challenging the notion that men travel more.
Travel distances also differ: 53.5% of women travel about 1 km, while 58.2% of men cover 2–3 km. Only 27.6% of women travel that far. In terms of mode, 65% of women use active mobility (walking or cycling) versus 28.7% of men, with women more likely to walk for all trips. Furthermore, 48% of women spend about 30 min on active mobility, compared to 22% of men. This may be due to the fact that women in our study do not make long distance trips compared to their male counterparts.
The value of VIF is 1< VIF <5; (see Table 3); it specifies that the variables are moderately correlated to each other. The small values of VIF corresponding to the variables show that there is no problem of collinearity. A condition index greater than 5 denotes a probable problem of multicollinearity. The higher condition index is 7.102 but the variance proportions of variables are not associated with this value. This shows there is no evidence of collinearity among majority of the variables as majority of the socio-economic variables such as income, age, car ownership which have often been found to have or suspect multicollinearity does not exist in our work.
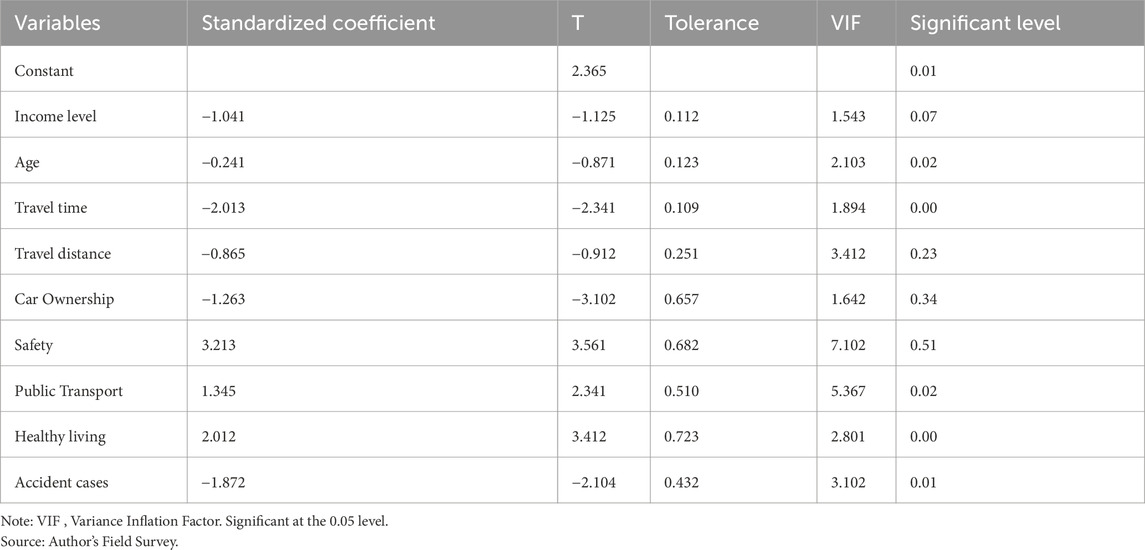
Table 3. Collinearity Test for the relationship between the use of non-motorised transport and some independent variables.
3.3 Mode choice pattern of respondents
3.3.1 Importance of factors that affect mode choice of respondents
This section analyses key factors influencing active travel mode choice, ranked in Table 4. Ten factors, drawn from prior studies (Deike, 2002; GIZ, 2021), were assessed using Likert scales and binomial logistic regression to evaluate the impact of individual, household, and trip-related attributes on non-motorised transport adoption.
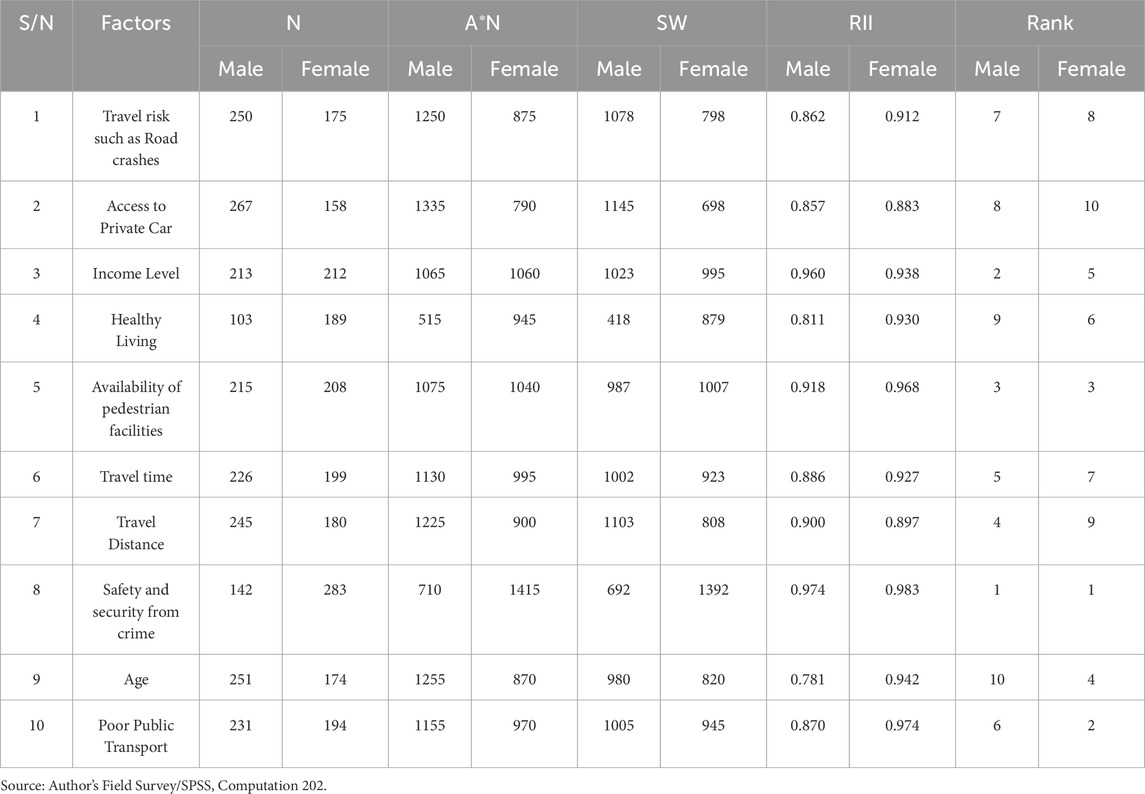
Table 4. RII index table for factors influencing the decision to use active mode.
Table 4 reveals notable gender differences. Safety from crime was the top concern for both genders (indices: 0.974 for men, 0.983 for women). For men, income ranked second; for women, inadequate public transport was more influential. This reflects women’s greater reliance on active travel and vulnerability to poor, unregulated transport systems. Men, mostly private vehicle users, rated public transport lower (6th). The reason for income ranking (2nd place) is not far fetched as most men consider a high income as a way of owning their private vehciles which may discourage them from utilizing active mobility. Likewise, women ranked poor public transport condition (2nd place) due to the fact that the nature of public transport operation in the study area is not reliable, convenient, hence, discouraging its use and promoting the use of active mobility.
3.4 Binomial logistics regression (BNL) result for factors influencing the use of active mobility by gender
The Binomial Logistic Regression (BNL) model examines factors influencing user behaviour changes towards AM in the study area. It analyses the relationship between independent variables and the probability of the event of interest. Negative coefficients (see Table 5) indicate a lower likelihood of the response category than the reference, while positive coefficients suggest a higher likelihood. The dependent variable is gender (Female (Rosenbloom et al., 1993), Male [0]), with independent variables including travel risk, income, private car usage, health benefits, travel time, travel distance, pedestrian facilities, age, safety, and public transport—factors affecting respondents’ propensity for active mobility (walking or cycling).
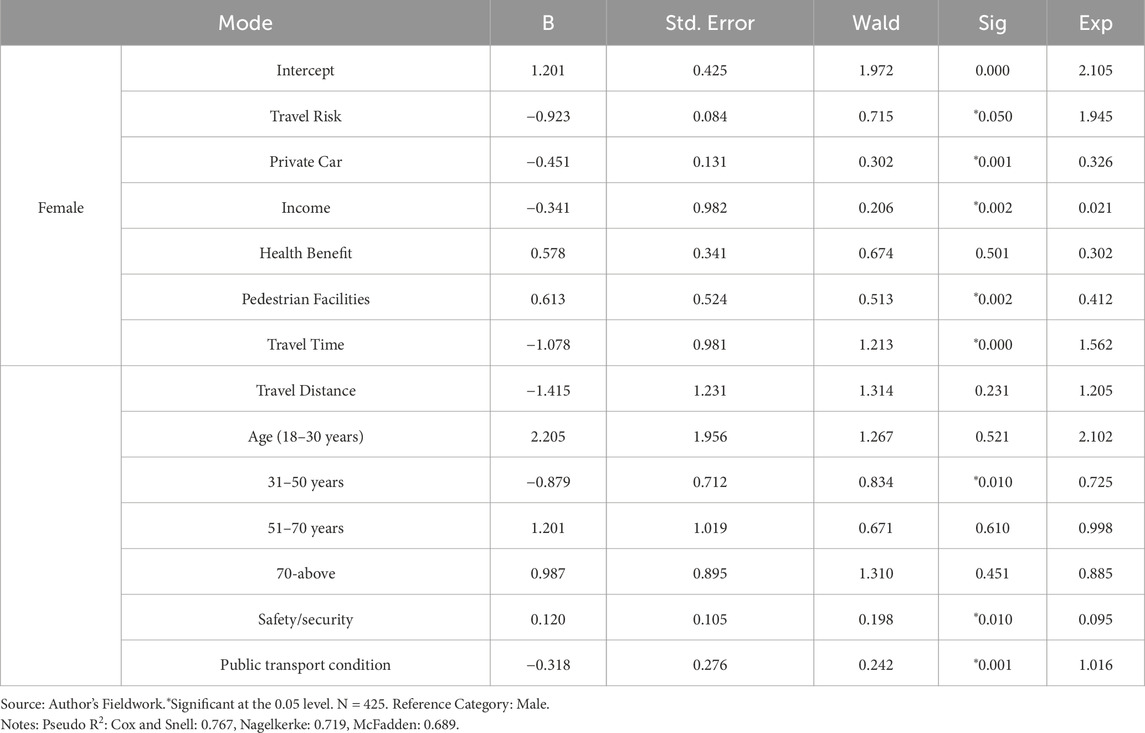
Table 5. Model development (parameter estimates) for active travel use of respondents.
Model equations and parameter estimates reveal key influences on women’s active mobility compared to men. Negative coefficients for private car (−0.451), income (−0.341), travel time (−1.312), age (−0.879), and public transport condition (−0.318) reduce the likelihood of women adopting active mobility. The negative coefficients for private car, income, age among others for women indicates that a unit decrease in such factors by −0.451 for private car, −0.341 for income and −0.879 for age will potend a decrease in the use of active mobility. This indicates that once income, accessibility to private automibilies and age decreases for women, they tend to utilize the active mode of transport more, hence, age, income level, private vehicle ownership or accessibility plays a crucial factor in the adoption of active travel. Women are also more likely to prefer improved public transport over active mobility. Conversely, a unit increase in pedestrian facilities (0.613) and safety (0.120) enhances the likelihood of women adopting active mobility. Hence, pedestrian facilities such as rest point, shade areas, cycle paths, sidewalks oftentime encourages prople to utilize active mobility, thus, proper provisions should be made for its provision and availability. All these facilities also serves as a way of promoting the safety of active mobility users by preventig or reducing the risk of accident during trip making, as there will be little or no competiton between cars and pedestrians while walking or cycling.
The model’s goodness of fit was evaluated using Nagelkerke R Square, where values closer to 1 indicate better fit. Our logit model, with significant variables from Table 5, had a Nagelkerke R Square of 0.719 (p < 0.05), meaning about 71.9% of the variance in travel behavior change towards active mobility is explained by these variables. The significance (p < 0.05) confirms the model’s reliability and the meaningful impact of the independent variables. Thus, the significant factors explain approximately 71.9% of women’s adoption of active travel. This could better assist policymakers in ensuring that these factors such as good pedestrian facilities, prioritization of safety from crime or accident during the use of active travel should be given special considerations while formulating transport or urban design policies.
4 Discussion
Our study on gender differences in active mobility found that more men were educated than women, consistent with Evans et al. (2021), who highlight persistent lower education levels for women globally. This is partly due to women’s greater family duties in Africa, limiting postgraduate enrollment after marriage. Employment disparities reflect Aderibigbe and Gumbo (2022) findings of more men in government jobs. Income gaps also mirror education and employment differences, as noted by Van Dijk (2005), Ragnedda et al. (2019), Aderibigbe (2021), linking socio-economic factors to the gendered digital divide. Women’s preference for non-motorised transport aligns with Jennings et al. (2020) and Aderibigbe and Gumbo (2024), who report women often avoid motorised travel to save money and manage households. This is evident in our findings where women earn lower income compared to the male counterparts, which may further influence the use of non-motorised travel by women compared to the male counterparts. Overall, gender disparities in education, employment, income, and car ownership are evident.
Our findings on trip frequency differ from Best and Lanzendorf (2005), Boarnet and Sarmiento (1998), and Ng and Acker (2018), who found men make more trips in developed countries. In contrast, in developing cities like Johannesburg, women make more trips due to school runs and shopping. Levy (2013) observed similar patterns in Hanoi, where women’s trip chaining and off-peak travel increase trip frequency. Ng and Acker (2018) also linked shorter female commutes to trip chaining. Our results on active mobility support Goel et al. (2023) and Ko et al. (2019), showing women walk more and use active mobility for short trips, relying on public transport for longer journeys.
Women identified safety and security as the most significant factors influencing active mobility use, particularly in developing cities like Johannesburg, where crime is a shared concern for both genders. Prior studies (Haynes et al., 2019; Ontario Professional Planning Institute OPPI, 2012; Jennings et al., 2020; Oliveira and Lima, 2023; Carriel et al., 2022) also highlight safety as a key issue in active travel as this discourages its use or adoption, particularly, when they are either being attacked on the road or when they are prone to accidents from vehicles during active mobility. Men, who mostly use private vehicles, ranked public transport conditions lower (6th position), reinforcing findings by Fasina et al. (2020) and Aderibigbe et al. (2024) that poor public transport in Johannesburg and Nigeria pushes commuters towards active travel or private cars. Our findings challenge Potoglou and Arslangulova (2017) on the impact of travel distance in active mobility, as women ranked it 9th, compared to 4th for men, likely due to their shorter trips reducing reliance on motorised transport. The study of Potoglou and Arslangulova (2017) which noted that women consider their trip distance, as long distance trips do not encourage them to use non-motorised transport (walking/cycling), however, our study challenges this assertion as women from our study do not prirotize travel distance or give it a major consideration as a significant factor in using active mobility. This may be as a result of the short distance trips (less than or 1 km) that women in johannesburg undertake compared to the men who often travel longer distances (over 2 km), hence, may not have an adverse effect on the adoption of active travel as a mode of transport. Although, trip distance is often considered in the use of active travel as identified by Aderibigbe and Gumbo (2024), this study contradicts such assertion probably due to the age of women involved and the precise location, as rural women who are elderly (60 years and above) in the studies of Aderibigbe and Gumbo (2024), Aderib et al. (2025) which asserted that older women who use active mobility does that during long distance trips.
Factors such as safety, pedestrian facilities, travel time, private vehicle availability, income level, and public transport conditions significantly influence active mobility choices, supporting findings by Haynes et al. (2019), Jennings et al. (2020), Oliveira and Lima (2023), Carriel et al. (2022), and Meesit et al. (2023). To enhance active mobility for women making shorter trips, rest areas along pedestrian and bicycle paths, with tree shading, should be provided to improve comfort and reduce fatigue during travel.
5 Conclusion and recommendations
Current strategies to promote active living at the population level are shifting from individual behavior interventions and experimental research designs towards real-world natural experiments that produce transferable evidence. These experiments increasingly incorporate in-depth qualitative analyses to understand the underlying factors that can drive changes and promote active travel, which offers numerous benefits to individuals and cities. This study examined the decision-making process and adoption of active mobility with a focus on gender differences. Our findings provide timely insights for stakeholders seeking to implement policies that enhance active travel by addressing gender-specific needs. We found that factors influencing mobility and the use of non-motorized transport, such as safety, travel time, availability of pedestrian facilities, and travel risks like accidents, differ by gender. These variations significantly impact the adoption of active mobility. Hence, any sustainable mobility approach needs to retain women’s current habits of walking, through making the mode more attractive and safer. For instance, understanding the impact of significant variables such as availability of pedestrian facilities (sidewalks, cycle paths among others), provision of a good public transport system which gives priority to women can better influence the utilization and adoption of active travel. Moreso, women often gives consideration to walking distance against their male counterparts because most women often make trips with children and earn lower than the men which may not give them the luxury of owning or utilizing private vehicles.
Therefore, it is crucial for Governments and stakeholders must consider gender differences in travel behavior when shaping policies. This includes promoting green spaces with rest points, cycle paths, and shade for active mobility users to rest and socialize. Additionally, enforcing safety measures like mandatory helmet use for cyclists is essential to reduce fatalities from accidents during active mobility.
6 Limitations and agenda for future research
This study is limited to gender variation in the use of active mobility within a developing country context, characterized by distinct socio-economic factors and limited investment in active infrastructure compared to developed countries. Future research could include additional variables, such as socio-psychological factors like feelings of prestige, influencing active mobility use. Comparative studies examining disparities in active travel between developed and developing nations are also recommended. Future research should also consider non-internet users who may be active mobility users, as our study relied on google forms which can only be addressed by internet users. Additionally, this study did not address the specific gender issues which can encourage the promotion of active mobility such as provision of bike as a prize or gift to women to support and encourage cycling activities, hence future studies could look into this as a way of promoting the use of active mobility among women.
Data availability statement
The raw data supporting the conclusions of this article will be made available by the authors, without undue reservation.
Author contributions
O-OA: Conceptualization, Data curation, Formal Analysis, Methodology, Validation, Visualization, Writing – original draft, Writing – review and editing. TG: Conceptualization, Funding acquisition, Investigation, Supervision, Validation, Visualization, Writing – review and editing.
Funding
The author(s) declare that no financial support was received for the research and/or publication of this article.
Conflict of interest
The authors declare that the research was conducted in the absence of any commercial or financial relationships that could be construed as a potential conflict of interest.
Generative AI statement
The author(s) declare that no Generative AI was used in the creation of this manuscript.
Publisher’s note
All claims expressed in this article are solely those of the authors and do not necessarily represent those of their affiliated organizations, or those of the publisher, the editors and the reviewers. Any product that may be evaluated in this article, or claim that may be made by its manufacturer, is not guaranteed or endorsed by the publisher.
References
Aboyeji, O. J., and Aguda, A. S. (2024). Impact of rural accessibility on yields and income of cassava farmers in a part of North Central, Nigeria. Dicov. 60, 1–17. doi:10.54905/disssi.v60i335.e16d1429
Aderibigbe, O. (2021). Are telecommunications and travel substitutes or complements? An empirical analysis of a developing city in Nigeria. Transp. Find. doi:10.32866/001c.30742
Aderibigbe, O. O., Fadare, S. O., and Gumbo, T. (2024). “Transport situation in the global South: insights from Nigeria, South Africa and India: in emerging technologies for smart cities,” in Sustainable transport planning in the global North and global South. doi:10.1007/978-3-031-66943-9_3
Aderibigbe, O.-O., and Gumbo, T. (2022). Variations in mode choice of residents prior and during COVID-19: an empirical evidence from johannesburg, South Africa. Sustainability 14, 16959. doi:10.3390/su142416959
Aderibigbe, O.-O., and Gumbo, T. (2023). Geospatial analysis of telecommunication and travel behaviour of households: lessons from a developing city in Nigeria. J. Sustain. Dev. Transp. Logist. 8 (2), 71–85. doi:10.14254/jsdtl.2023.8-2.5
Aderibigbe, O.-O., and Gumbo, T. (2024). Exploring the use of active mobility in selected rural areas of Nigeria. TeMA - J. Land Use, Mobil. Environ. 17 (3), 439–452. doi:10.6093/1970-9870/10928
Aderibigbe, O. O. B., and Gumbo, T. (2025). Gender variation in telecommunication use and sustainable mobility in the rural areas of Nigeria: towards a just transition and climate action. Transp. Plan. Technol., 1–17. doi:10.1080/03081060.2025.2482051
Albayati, N., Waisi, B., Al-Furaiji, M., Kadhom, M., and Alalwan, H. (2021). Effect of COVID-19 on air quality and pollution in different countries. J. Transp. and Health 21, 101061. doi:10.1016/j.jth.2021.101061
Aldred, R., Elliott, B., Woodcock, J., and Goodman, A. (2017). Cycling provision separated from motor traffic: a systematic review exploring whether stated preferences vary by gender and age. Transp. Rev. 37 (1), 29–55. doi:10.1080/01441647.2016.1200156
Alessandretti, L., Aslak, U., and Lehmann, S. (2020). The scales of human mobility. Nature 587 (7834), 402–407. doi:10.1038/s41586-020-2909-1
Althof, T., Sosič, R., Hicks, J. L., King, A. C., Delp, S. L., Leskovec, J., et al. (2020). Gender gaps in urban mobility. Nat. Hum. Behav. 547 (7663), 336–339. doi:10.1038/s41562-020-0875-0
Astrop, A. (1998). “Urban travel behavior and constraints of low-income households and females in Pune, India,” in Proceedings from the second national conference on women’s travel issues, Baltimore, october 1996. Washington, D.C.: Federal Highway Administration.
Best, H., and Lanzendorf, M. (2005). Division of labour and gender differences in metropolitan car use: an empirical study in Cologne, Germany. J. Transp. Geogr. 13 (2), 109–121. doi:10.1016/j.jtrangeo.2004.04.007
Boarnet, M. G., and Sarmiento, S. (1998). Can land-use policy really affect travel behaviour? A study of the link between non-work travel and land-use characteristics. Urban Stud. 35/7, 1155–1169. doi:10.1080/0042098984538
Buehler, R., Pucher, J., Gerike, R., and Götschi, T. (2017). Reducing car dependence in the heart of Europe: lessons from Germany, Austria, and Switzerland. Transp. Rev. 37 (1), 4–28. doi:10.1080/01441647.2016.1177799
Bull, F. C., Al-Ansari, S. S., Biddle, S., Borodulin, K., Buman, M. P., Cardon, G., et al. (2025). World.
Carriel, V., Lufin, M., and Pérez-Trujillo, M. (2022). Do workers negative self-select when they commute? Evidence for the Chilean case of long-distance commuting. Ann. regional Sci. 69 (1), 255–279. doi:10.1007/s00168-022-01121-1
Deike, P. (2002). “Gender and transport in less developed countries: a background paper in preparation for CSD-9,” in Background paper for the expert workshop gender perspectives for earth summit 2002: energy, transport, information for decision-making. Berlin, Germany. Available online at: www.earthsummit2002.org/workshop.
Evans, D. K., Akmal, M., and Jakiela, P. (2021). Gender gaps in education: the long view. IZA J. Dev. Migr. 12, 01. doi:10.2478/izajodm-2021-0001
Fasina, S. O., Salisu, U. O., Odufuwa, B. O., and Akanmu, A. A. (2020). Travel behaviour and mobility challenges of disabled elderly in selected cities of ogun state, Nigeria. LOGI – Sci. J. Transp. Logist. 11 (1 2020), 25–36. doi:10.2478/logi-2020-0003
Fernando, P. (1997). “Balancing the load,” in Gender issues in rural transport. London: International Forum for Rural Transport and Development IFRTD.
Garrard, J., Rose, G., and Lo, S. K. (2008). Promoting transportation cycling for women: the role of bicycle infrastructure. Prev. Med. 46 (1), 55–59. doi:10.1016/j.ypmed.2007.07.010
Gauvin, L., Tizzoni, M., Piaggesi, S., Young, A., Adler, N., Verhulst, S., et al. (2020). Gender gaps in urban mobility. Hum. Soc. Sci. Commun. 7 (1), 11–13. doi:10.1057/s41599-020-0500-x
Gekoski, A., Gray, J. M., Adler, J. R., and Horvath, M. A. H. (2017). The prevalence and nature of sexual harassment and assault against women and girls on public transport: an international review. J. Criminol. Res. Policy Pract. 3, 3–16. doi:10.1108/jcrpp-08-2016-0016
GIZ (2021). Active mobility in South Africa: snapshots and perspectives. Germany: Deutsche Gesellschaft für Internationale Zusammenarbeit (GIZ) GmBH, Bonn and Eschborn.
Godard, X., and Cusset, J.-M. (1996). Des Systèmes de transport urbain au Vietnam à la recherche de la modernité. Cah. Sci. Hum. 32 (3), 555–557.
Goel, R., Goodman, A., Aldred, R., Nakamura, R., Tatah, L., Garcia, L., et al. (2021). Cycling behaviour in 17 countries across 6 continents: levels of cycling, who cycles, for what purpose, and how far? Transp. Rev. 2021, 58–81. doi:10.1080/01441647.2021.1915898
Goel, R., Oyebode, O., Foley, L., Tatah, L., Millett, C., and Woodcock, J. (2023). Gender differences in active travel in major cities across the world. Transportation 50, 733–749. doi:10.1007/s11116-021-10259-4
Goenaga, B., Matini, N., Karanam, D., and Underwood, B. S. (2021). Disruption and recovery: initial assessment of COVID-19 traffic impacts in North Carolina and Virginia. J. Transp. Eng. Part A Syst. 147, 06021001. doi:10.1061/jtepbs.0000518
Haynes, E., Green, J., Garside, R., Kelly, M. P., and Guell, C. (2019). Gender and active travel: a qualitative data synthesis informed by machine learning. Int. J. Behav. Nutr. Phys. Act. 16, 135. doi:10.1186/s12966-019-0904-4
Hensher, D. A., and Johnson, L. W. (2018). Applied discrete-choice modelling. London: Routledge. doi:10.4324/9781351140768
Iqbal, S., Woodcock, A., and Osmond, J. (2020). “The effects of gender transport poverty in Karachi”. J. Transp. Geogr. 84, 102677. doi:10.1016/j.jtrangeo.2020.102677
Jennings, G., Allen, H., and Arogundade, E. (2020). Gaining or Losing Ground: ensuring that post-COVID-19 transportation serves the needs of women in low income in African cities. High Volume Transp. Appl. Res.
Kinyingi, J., Mug- wima, N., and Karanja, D. (2020). Walkable streets: a study of pedestrians’ perception, and attitude towards ngei street in ma-chakos town. Curr. Urban Stud. 8, 381–395. doi:10.4236/cus.2020.83021
Ko, J., Lee, S., and Byun, M. (2019). Exploring factors associated with commute mode choice: an application of city-level general social survey data. Transp. Policy 75, 36–46. doi:10.1016/j.tranpol.2018.12.007
Kwan, M. (2000). Gender differences in space-time constraints. Area 32 (2), 145–156. doi:10.1111/j.1475-4762.2000.tb00125.x
Law, R. (2002). Gender and daily mobility in a New Zealand city, 1920–1960. Geogr 3 (4), 425–445. doi:10.1080/1464936021000032441,
Lee, J., Baig, F., and Pervez, A. (2021). Impacts of COVID-19 on individuals’ mobility behavior in Pakistan based on self-reported responses. J. Transp. Health 22, 101228. doi:10.1016/j.jth.2021.101228
Levy, C. (2013). Travel choice reframed: deep distribution and gender in urban transport. Environment and Urbanization25 (1), 47–63. doi:10.1177/0956247813477810
Liu, Z., and Stern, R. (2021). Quantifying the traffic impacts of the COVID-19 shutdown. J. Transp. Eng. 147, 147. doi:10.1061/jtepbs.0000527
McHenry, H., Vega, A., and Swift, C. (2023). Understanding mobility in rural towns: development of a mobility index for the west of Ireland. Transp. Res. Procedia 72, 3730–3737. doi:10.1016/j.trpro.2023.11.545
Meesit, R., Puntoomjinda, S., Chaturabong, P., Sontikul, S., and Arunnapa, S. (2023). Factors affecting travel behaviour change towards active mobility: a case study in a Thai university. Sustainability 15, 11393. doi:10.3390/su15141139
Motherwell, S. (2018). Are we nearly there yet? Explor. Gend. Act. Travel. Available online at: https://www.sustrans.org.uk/media/2879/2879.pdf.
Ng, W., and Acker, A. (2018). “Understanding urban travel behaviour by gender for efficient and equitable transport policies. ITF discussion paper 2018-01 — © OECD/ITF 2018,” in International transport forum. Paris, France. Available online at: https://www.itf-oecd.org/sites/default/files/docs/urban-travel-behaviour-gender.pdf (Accessed on April 25, 2023).
Oliveira, M. L., and Lima, J. P. (2023). A multinomial logistic regression model for public transportation use in a medium-sized Brazilian city. Production 33, e20230027. doi:10.1590/0103-6513.20230027
Olojede, O., Yoade, A., and Olufemi, B. (2017). Determinants of walking as an active travel mode in a Nigerian city. J. Transp. and Health 6 (2017), 327–334. doi:10.1016/j.jth.2017.06.008
Ontario Professional Planning Institute (OPPI) (2012). Call to action: planning and implementing active transportation in Ontario communities.
Pentikainen, P. (2013). “Planning policies to support the role of active transportation in building complete communities within the town of innisfil,” in Theses and dissertations.
Peters, D. (2011). “Gender and sustainable urban mobility,” in Thematic study prepared for global report on human settlements 2013.
Phadke, S. (2013). Unfriendly bodies, hostile cities: reflections on loitering and gendered public space. Econ. Pol. Wkly. 48 (39), 50–59.
Potoglou, D., and Arslangulova, B. (2017). Factors influencing active travel to primary and secondary schools in Wales. Transp. Plan. Technol. 40 (1), 80–99. doi:10.1080/03081060.2016.1238573
Ragnedda, M., Ruiu, M. L., and Addeo, F. (2019). Measuring digital capital: an empirical investigation. New Media Soc. 22 (5), 793–816. doi:10.1177/1461444819869604
Ravensbergen, L., Buliung, R., and Laliberté, N. (2019). Toward feminist geographies of cycling. Geogr. Compass 13 (7), 1–24. doi:10.1111/gec3.12461
Rosenbloom, S. (1993). “Women’s travel pattern at various stages of their lives,” in Full circles: geographies of women over the life course. Editors C. Katz, and J. Monk (London and New York: Routledge), 208–242.
Roth, M. A., Millett, C. J., and Mindell, J. S. (2012). The contribution of active travel (walking and cycling) in children to overall physical activity levels: a national cross sectional study. Prev. Med. 54 (2), 134–139. doi:10.1016/j.ypmed.2011.12.004
Roulet, P. D., Chenal, J., Munyaka, J. B., and Pudasaini, U. (2024). Mapping rural mobility in the global South: a participatory gis approach for assessments of daily movement needs and practice. doi:10.20944/preprints202408.2229.v1
Sahlqvist, S., Song, Y., and Ogilvie, D. (2012). Is active travel associated with greater physical activity? The contribution of commuting and non-commuting active travel to total physical activity in adults. Prev. Med. 55 (3), 206–211. doi:10.1016/j.ypmed.2012.06.028
Spitzner, M. (1998). “Die Krise der Reproduktions-Arbeit: Herausforderung an eine öko-soziale Stadtplanung,” in Deutscher Städtetag, Kommission “Frauen in der Stadt,” Frauen verändern ihre Stadt (Cologne: DST-Beiträge zur Frauenpolitik, Reihe L).
Statistics South Africa (2021). Gender series vol VIII: gender patterns in transport, 2020 report. Available online at: http://www.statssa.gov.za/ January 2025.
Strava Metro (2023). Cycling and walking data. Available online at: https://stravametro.zendesk.com/hc/en-us (Accessed December, 2023).
Terlinden, U. (1994). “Frauengerechte stadtplanung,” in Paper presented at the wuppertal Institute, wuppertal, Germany.
Van Dijk, J. A. G. M. (2005). The deepening divide: inequality in the information society. London: Sage.
Wang, Q., and Li, S. (2021). Nonlinear impact of COVID-19 on pollution – evidence from wuhan, New York, milan, Madrid, bandra, London, Tokyo and Mexico city. Sustain. Cities Soc. 65, 102629. doi:10.1016/j.scs.2020.102629
Warburton, D. E. R., and Bredin, S. S. D. (2017). Health benefits of physical activity: a systematic review of current systematic reviews. Curr. Opin. Cardiol. 32 (5), 541–556. doi:10.1097/HCO.0000000000000437
World Population Review (2022). Johannesburg population 2022. Available online at: https://worldpopulationreview.com/world-cities/johannesburg-population.
Keywords: active travel, mobility, gender, transport planning, sustainable development
Citation: Aderibigbe O-O and Gumbo T (2025) Gender variation in active mobility: experience from Johannesburg South Africa. Front. Built Environ. 11:1603221. doi: 10.3389/fbuil.2025.1603221
Received: 31 March 2025; Accepted: 25 June 2025;
Published: 10 July 2025.
Edited by:
Panrawee Rungskunroch, Rajamangala University of Technology Thanyaburi, ThailandReviewed by:
Serdar Dindar, Yıldırım Beyazıt University, TürkiyeYihsuan Lin, University of Birmingham, United Kingdom
Copyright © 2025 Aderibigbe and Gumbo. This is an open-access article distributed under the terms of the Creative Commons Attribution License (CC BY). The use, distribution or reproduction in other forums is permitted, provided the original author(s) and the copyright owner(s) are credited and that the original publication in this journal is cited, in accordance with accepted academic practice. No use, distribution or reproduction is permitted which does not comply with these terms.
*Correspondence: Oluwayemi-Oniya Aderibigbe, b2Jvbml5YUB1ai5hYy56YQ==, b25peWFvYkBnbWFpbC5jb20=