 Shu Peng
- China Railway 18th Bureau Group Corp, Ltd., Tianjing, China
When the pipelines are subjected to shallow tunnel underpassing and ground traffic loads, the void effect will significantly amplify the dynamic response and safety risks of pipelines. A three-dimensional finite element model was established to quantify the adverse impact of tunnelling and vehicle load coupling. Then, based on the settlement distribution characteristics, a revised Peck formula is established to estimate the pipelines’ settlement in different depths and positions. The results reveal that the settlement of soil and pipeline caused by tunnelling decreases with decreasing burial depth; the dynamic settlement of the sewage pipe and ground surface is decreasing rapidly as the burial depth increases. Whether the pipeline is buried close to the surface or tunnel, it should be noted that the pipeline’s dynamic settlement or cumulative settlement may exceed the safety limit, and the safety risks of pipelines will be greatly underestimated by ignoring the dynamic settlement and its adverse impacts on the pipeline joints. When the depth is less than 1.5 m or the distance apart from the tunnel arch is less than 1.0 m, the pipelines’ settlement would exceed the limit.
1 Introduction
Subway entrances and ventilation tunnels are usually located in urban core areas with busy upper traffic, numerous underground pipelines, and complex environments. In order to reduce the impact on ground traffic, the underground excavation method is often used for construction. When there is not tunnel or void under the lower part of the pipeline, the dynamic response of the pipeline under vehicle load is relatively small (Zhang et al., 2022; Zhai et al., 2012), the degradation of the pipeline is gradual rather than immediate (Wang et al., 2020; Ma et al., 2021). And once a shallow buried tunnel passes under the pipeline, not only will tunnel excavation cause settlement and deformation of the pipeline (Xu et al., 2022), but the dynamic response of the pipeline under vehicle will also increase significantly (Wang et al., 2024; Liu et al., 2020). Especially in soft ground environments, when subway tunnels are excavated and buried in ultra-shallow depths and nearby the pipelines, the surrounding rock is more challenging to maintain the stability (Hou et al., 2015), so a series of collapses due to subway construction have been reported (Fang et al., 2011; Peck, 1969; Li et al., 2024), which should be taken seriously by subway engineers.
In terms of research on deformation of existing pipelines caused by under-passing tunnelling, the Peck formula (Peck, 1969) is the most widely used for predicting surface settlement caused by tunnelling nowadays. Then a series of improvements of the Peck formula are conducted by scholars (Li et al., 2024; Zhou et al., 2021; Kong et al., 2021), but these formulas mainly focus on the static settlement caused by tunnelling only; the formula for estimating a pipeline’s dynamic settlement distribution or the coupling effect with tunnelling is rare in literature.
In the aspect of numerical study, Wang et al. (2011) examined the tunnelling effects on buried pipelines by using numerical simulation, and proposed a method to estimate the maximum pipe bending strain which is induced by tunnelling. Sun et al. (2024) conducted centrifuge model tests and numerical simulations to study the brittle damage of buried pipelines induced by side-by-side twin tunneling; the results reveal that a pipeline with a smaller diameter and shallower burial depth has a higher capacity to resist damage under twin tunnelling. Combined with laboratory tests and finite element analyses, Wham et al. (2016) investigated the pipeline settlement induced by tunnelling; the result reveals that the pipeline joint rotations and maximum tensile strains in sand are three times larger than those in clay; cast iron pipelines crossing the tunnel centerline are most vulnerable to leakage from joint rotation. Through numerical simulation, Wang et al. (2023) indicate the pipeline settlement is more significant than a single tunnel underpass; then a semi-empirical approach is proposed to predict on the longitudinal pipe bending behavior under twin-tunneling effects. Taking the underground excavation project of Huangzhuang Station on Beijing Metro Line 10 as an example, Luo et al. (2007) verified through numerical simulation and monitoring data that the surface settlement caused by the underground excavation tunnel was 94.7 mm. Strong support and grouting reinforcement measures must be taken to reduce disturbance to the pipeline. Liu et al. (2022) proposed an analytical solution to predict the spatiotemporal deformation of the existing pipeline parallel above the new shield tunnel. Zhan et al. (2023) used ABAQUS finite element software to analyze the settlement of pipelines caused by tunnelling; the results showed that the smaller the difference in pipe soil stiffness, the more consistent the settlement area between the pipeline and the soil. When the difference in stiffness between the two is larger, the pipeline will resist the deformation of the formation, resulting in greater stress.
Based on numerical simulations and model tests, a series of analytical and empirical solutions are proposed to estimate the pipe response under tunnelling effects. Based on an improved Winkler modulus, Huang et al. (2019) developed a Winkler solution to estimate the response of jointed pipelines induced by tunnelling. Lin and Huang. (2019); Lin et al. (2020) developed an analytical solution to estimate the deflection and bending moment of jointed pipes subjected to tunnelling. Yang et al. (2020) analyzed the relationship between soil and pipeline stiffness, tunnel diameter, pipeline clearance, and pipeline settlement by establishing a three-dimensional finite element model of pipe soil, and proposed a simple calculation formula for the maximum bending moment and maximum settlement of pipelines.
In the aspect of safety control standards for pipeline settlement when subway tunnel are underpassing, Fang et al. (2011) suggested the maximum deflection for pipelines above the tunnel should be controlled to be within 2 mm/m and the maximum settlement for the pipelines should be less than 30 mm. Yao and Wang. (2006) found through extensive investigations that pipeline damage rarely occurs when the ground settlement value caused by tunnel excavation is below 80 mm, and a few pipeline damages also occur at the T-shaped interface. Zhu, (2012) proposed a ground reinforcement and pipeline suspension protection scheme using horizontal rotary jet grouting piles and deep hole curtain grouting for the sub-high-pressure gas pipeline under shallowly buried tunnels. Although the maximum settlement value exceeded the standard limit of 20 mm, stress monitoring data showed that the sub-high-pressure gas pipeline was within the safe operating range. In soft soil and shallow buried environment, especially subjected to heavy vehicle loads, it is very important to choose appropriate tunnelling method and reinforcement measures, so as to control the risk and settlement induced by tunnelling. Through field monitoring and numerical simulation, Zhang et al. (2023) suggested that by applying advanced grouting (Xu et al., 2025; Cao et al., 2025) in shallow buried soft soil tunnel, the effect of the CRD (Cross Diaphragm) excavation method on surface settlement can be controlled.
The above literature mainly focuses on the research of pipeline deformation caused by tunnelling; the formulas for estimating a pipeline’s dynamic settlement distribution or the coupling effect with tunnelling is rare in literature. When the tunnel is buried in a super shallow depth and very close to the pipelines, this coupling effect may significantly increase the dynamic response of the pipeline, which has adverse effects on pipeline operation safety.
Based on this engineering background, in order to study the dynamic response of adjacent dense pipelines under the coupling effect of subway tunnel excavation and vehicle load, and ensure pipeline safety, a three-dimensional finite element numerical model will be established, to explore the influence of tunnel construction on the dynamic response of adjacent pipelines under different vehicle axle loads and speeds, and propose a revised Peck formula to estimate the dynamic and coupling settlement induced by tunnelling and vehicle load.
2 Peck’s formula for settlement estimation
Based on a large amount of data on surface settlement caused by tunnel excavation, Peck (Peck, 1969) believes that surface settlement follows a Gaussian distribution and surface settlement is caused by geological losses, shown in Figure 1. Then the famous Peck’s formula was proposed to estimate surface settlement caused by tunnel excavation, shown in Equation 1.
where: Sx is the surface settlement at a distance of x from the centerline of the tunnel (mm); Smax is the maximum settlement of the surface; x is the distance from the centerline of the tunnel (m); i is the width coefficient of the surface subsidence trough, or the distance from the center of the tunnel to the inflection point of the settlement curve (m).
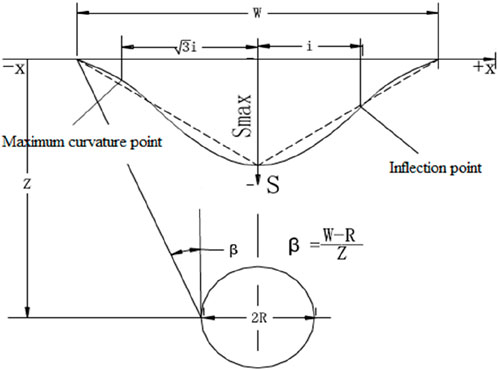
Figure 1. Settlement trough caused by tunnel excavation.
The surface maximum settlement Smax is determined by Equation 2.
where: V is the geological loss per unit length of tunnel caused by construction (m3/m).
i is determined by Equation 3.
where: k is the width coefficient of the subsidence trough; z is the burial depth at the center of the tunnel (m); φ is the friction angle within the soil.
V is determined by Equation 4.
where: Vl is the loss rate of formation volume (%); R is the diameter of the tunnel (m).
When i and V are obtained, the surface settlement caused by tunnel excavation can be determined by using the Peck’s formula. The parameters of the Peck’s formula can be established by fitting the measured settlement curve.
3 Engineer background
3.1 Horizontal and vertical sections
The entrance tunnel of the subway passes through the main urban road. Due to the high traffic, dense underground pipelines, and difficulty in relocation, underground excavation construction is adopted. The surrounding plane environment of the underground excavation tunnel is shown in the following figure.
According to geological drilling in Figure 2, the construction scope of the underground excavation section consists of a 2.6 m thick backfill soil layer, a 6.5 m thick silty clay layer, a 6.9 m thick medium sand layer, a 12.8 m thick coarse sand layer, and a clayey siltstone layer from top to bottom. During tunnel construction, the groundwater level is about 6 m below the bottom plate of the tunnel structure. Therefore, during the construction period, precipitation is not considered, and only ground drainage measures are taken.
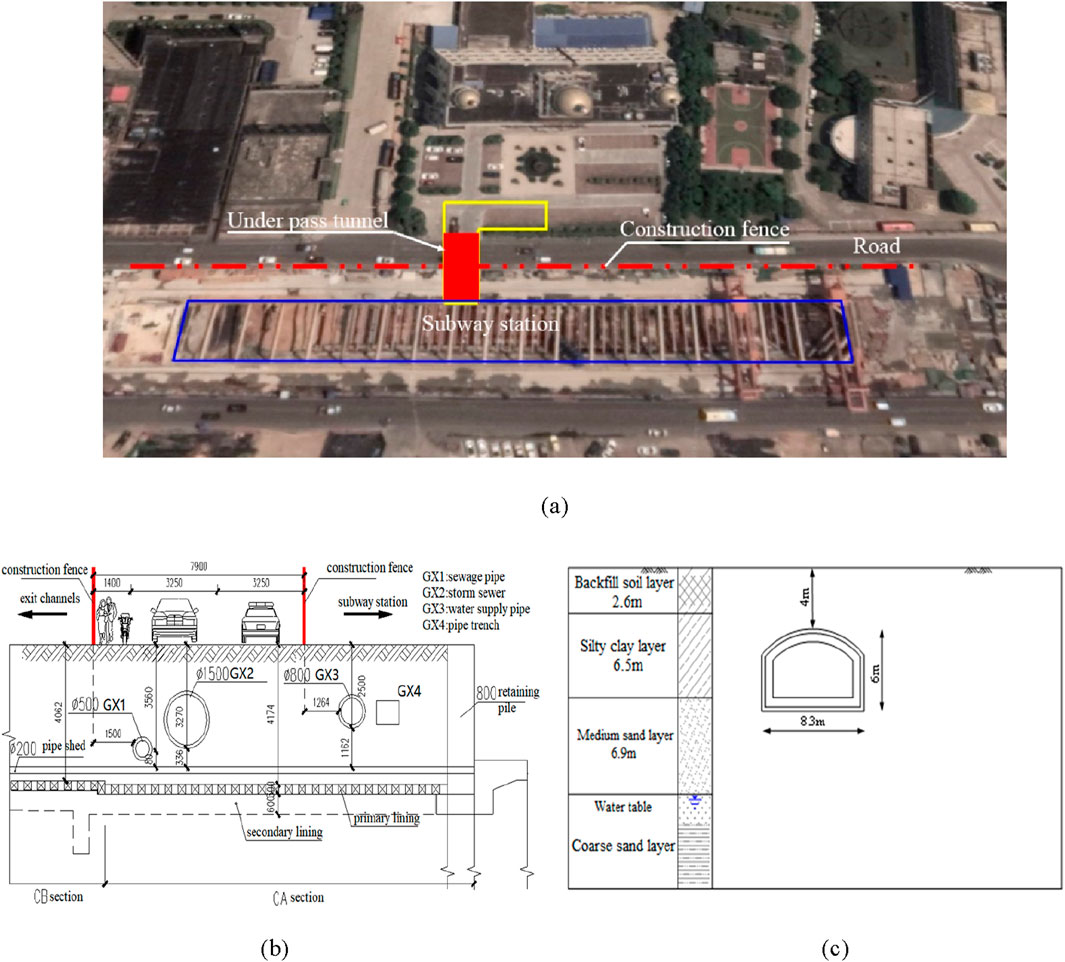
Figure 2. Cross-section and profile of underground passage: (a) Layout plan of the tunnel; (b) Section crossing the road; (c) Section crossing the tunnel.
3.2 Tunnel structure and construction methods
The exit section of the shallow buried tunnel is an arch with straight walls, constructed by the Cross Diaphragm (CRD) method. Large pipe shed and small leading conduits with grouting were used to reduce surface subsidence caused by tunnel excavation. The initial support of the tunnel consists of a grid steel frame, a φ25 feet-lock bolt, and 30 cm thick sprayed concrete. The middle partition and temporary arch are temporarily supported by I22a steel, and the secondary lining is 60 cm thick C35 reinforced concrete. The tunnel structure and construction sequence are shown in Figure 3.
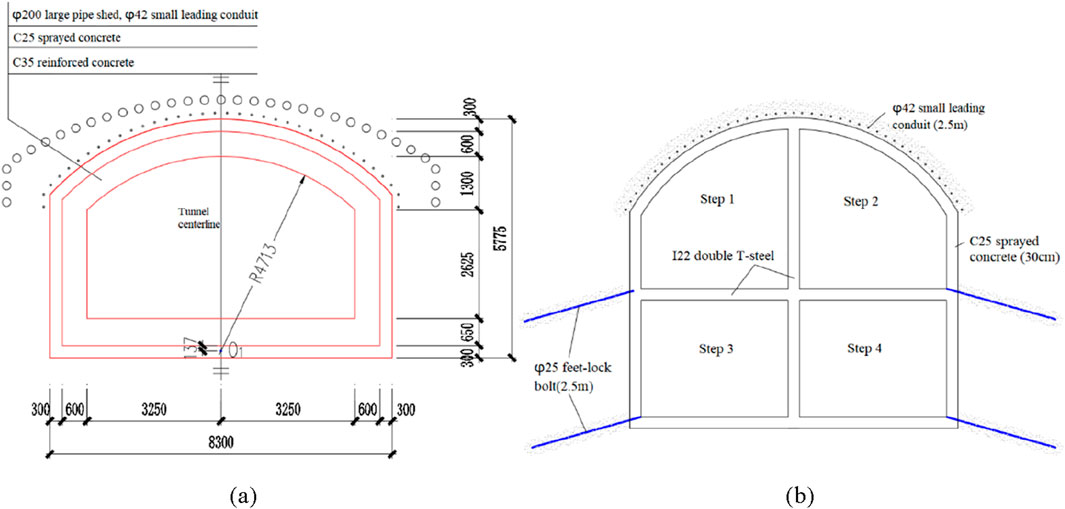
Figure 3. Schematic diagram of the tunnel structure and construction: (a) Tunnel structure; (b) Excavation method.
4 Numerical model
4.1 Three-dimensional model
Using FEM software ABAQUS (Dassault Simulia, Providence, RI, United States), a three-dimensional tunnel model was established, shown as Figure 4. The overall model is 80 m wide in the X direction, 52 m high in the Y direction, and 23 m long in the Z direction. The hidden tunnel is excavated along the Z direction, and surface vehicles travel along the X direction. The tunnel is constructed using the CRD method, with a drilling depth of 2 m per excavation cycle and a lag distance of 4 m between each heading. The surrounding rock adopts the Mohr-Coulomb elastoplastic constitutive model, and the pipeline and support structure are simulated using the linear elastic model. The surrounding rock and tunnel support structure are simulated using C3D8R solid elements, which is an three dimensional eight-node first-order linear hexahedral element. The pipe shed and small leading conduit are simulated using S4R shell elements, which is a four-node reduced integration quadrilateral shell element for thin or thick shell structures. The feet-lock bolt is simulated using B31 beam elements, which is a two-node unit based on the Timoshenko beam theory. To eliminate the reflection effect of dynamic waves at the boundary, C3D8I infinite element boundaries are set around the model and the bottom surface, and the top surface is a free boundary, as shown in Figure 4b.
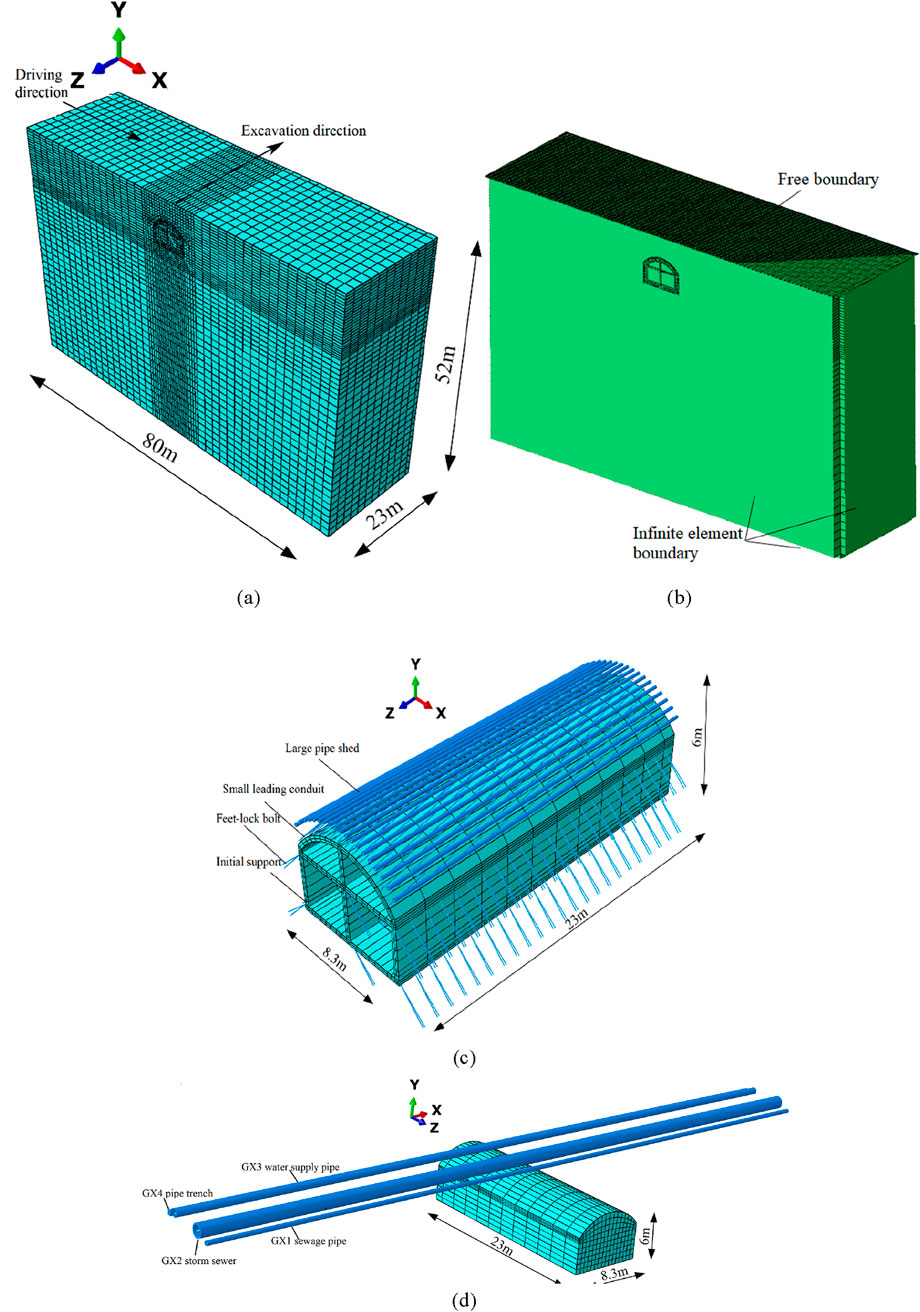
Figure 4. Numerical model: (a) Model dimension; (b) Boundary condition; (c) Tunnel support structure; (d) Location relationship between pipelines and tunnels.
4.2 Mechanical parameters
Based on geological survey data and design data (An et al., 2022), the mechanical parameters of the surrounding rock are determined. The mechanical parameters of concrete pipelines and tunnel support structures are sourced from literature (Ministry of Housing and Urban-Rural Development of the People’s Republic of China, 2010), and the parameters of cast iron pipes are taken from the specifications (State Administration for Market Regulation, 2019). The physical and mechanical parameters of the model are shown in Tables 1, 2.
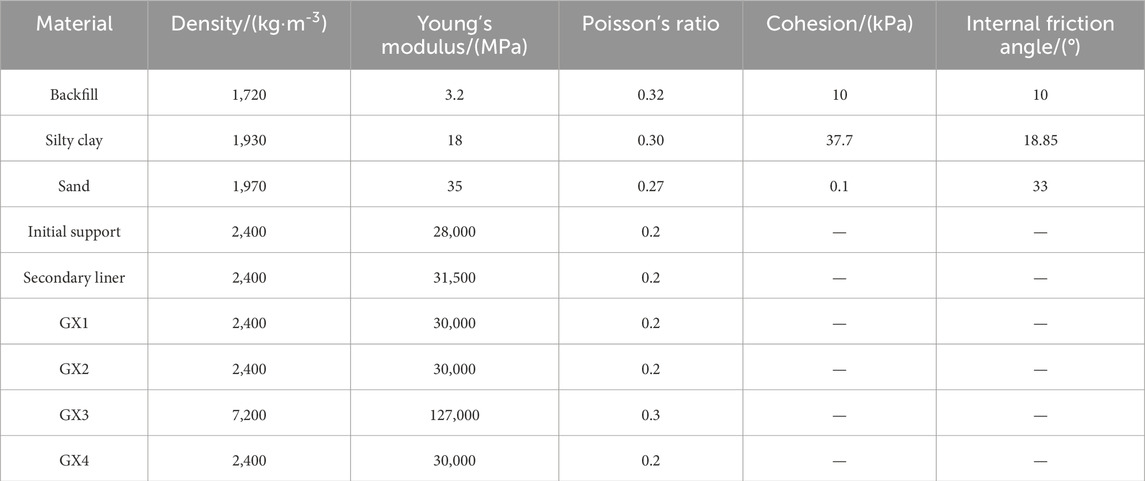
Table 1. Physical and Mechanical parameters of tunnel and ground.
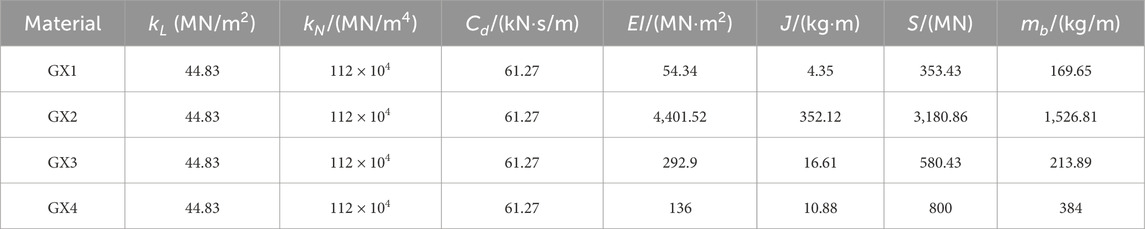
Table 2. Parameters for solving pipeline dynamic response.
4.3 Vehicle load
A vehicle load model is derived from the actual types of engineering vehicles and the parameters of the heavy-duty truck given in the specifications (CCCC Highway Consultants Co, 2015). The tires are 295/80R22.5 and the truck is driven on the road surface directly above the pipeline. The parameters of the heavy-duty truck are shown in Table 3.

Table 3. Truck parameters.
Time domain harmonic loads can reflect the dynamic characteristics of actual vehicle loads acting in time and space. The formula for time-domain harmonic load (Huang, 1998) is shown in Equation 5, and the periods of the load is shown in Equation 6:
where: p is the wheel pressure (MPa), t is the wheel action time, T is the wave load action period (s), L is the equivalent circle radius of the wheel contact area, generally taken as 15 cm, and V is the vehicle driving speed (m/s).
According to Table 2 and Equations 1, 2, the vehicle load can be obtained from Equation 7:
The corresponding vehicle load time history curve is shown in Figure 5.
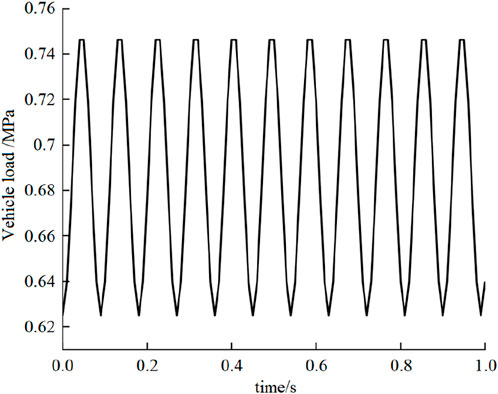
Figure 5. Time history curve of the vehicle load.
Based on Equation 3, use FORTRAN language to develop a subroutine to simulate vehicle loading.
4.4 Pipeline dynamic response
A simplified calculation model for underground pipelines under road traffic loads using Timoshenko beams. The dynamic response of pipelines under vehicle loads is shown in Equation 8 and Equation 9.
where:
4.5 Calculation cases
To study the influence of axle load and vehicle speed on the dynamic response of dense pipelines passing under shallow buried subway tunnels, the calculation cases are shown in Table 4.
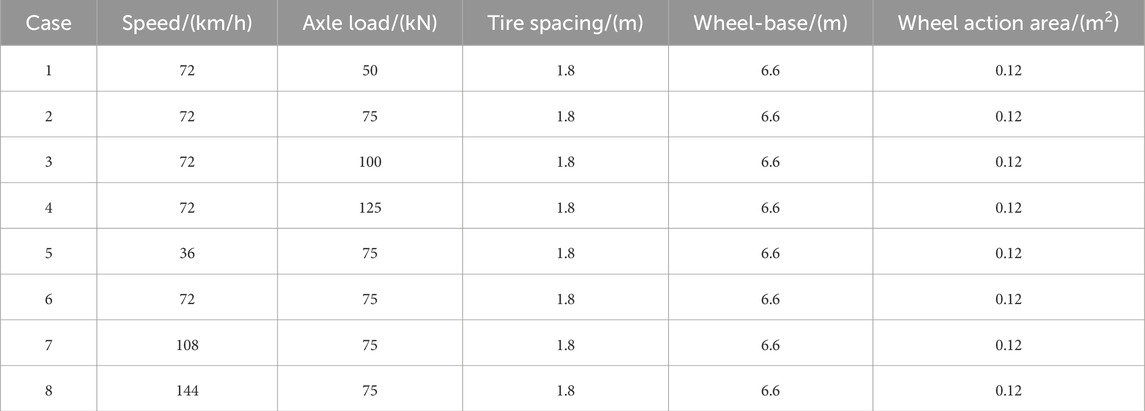
Table 4. Calculation cases.
4.6 Feature point
14 points are arranged to detect the surface settlement above the initial excavation face of the tunnel, and 18 points are arranged to detect the pipeline settlement. DB represents surface settlement monitoring points, GX1 represents sewage pipe settlement feature points, GX2 represents storm sewer feature points, GX3 represents water supply pipe feature points, and GX4 represents pipe trench feature points. There are 5 settlement monitoring points for sewage pipes, rainwater pipes, and pipe trenches, and 3 settlement monitoring points for water supply pipes, shown in Figure 6.
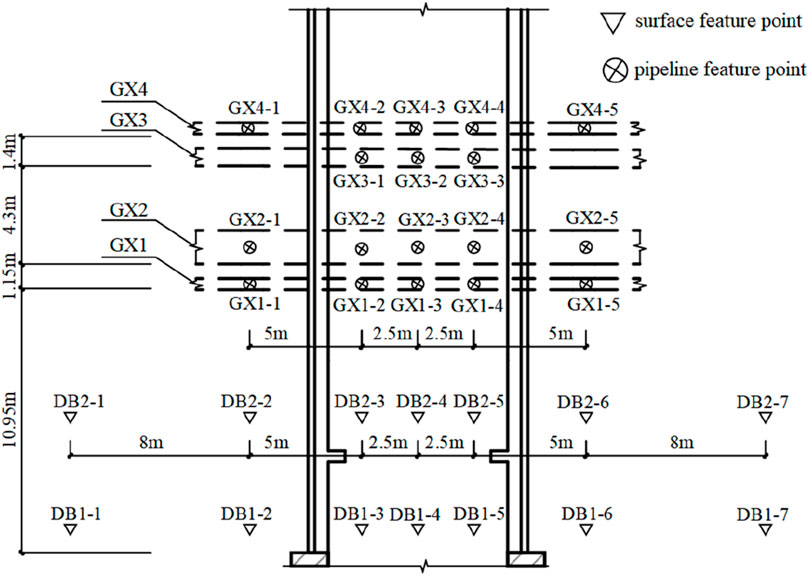
Figure 6. The monitoring points in the excavated section.
The maximum dynamic response of the surrounding rock and tunnel are not located at the center line of the tunnel, so the following feature points are selected to analyze the dynamic response of the surrounding rock under vehicle load. The distribution of feature point positions is shown in Figure 7.
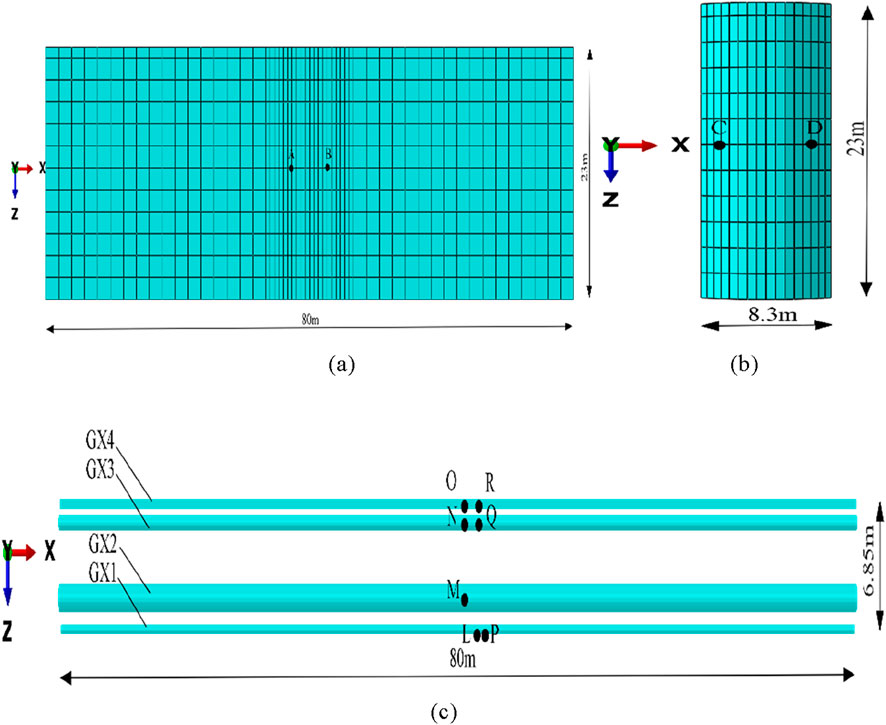
Figure 7. Distribution of feature points: (a) Road feature points; (b) Feature points of surrounding rock; (c) Feature point of pipe line.
4.7 Model verification
The measured maximum settlement of the surface and sewage are 12.72 mm and 9.98 mm. The maximum settlement of the surface obtained from numerical simulation is 10.89 mm, and the maximum settlement of the sewage pipe is 8.25 mm. The simulated settlement results are consistent with the measured data, but slightly smaller than the measured values, as shown in Figure 8, indicating that the established finite element model is reliable. In Figure 8, the measured settlement and numerical simulation settlement values are both caused by tunnel excavation, without considering the influence of surface vehicle loads.
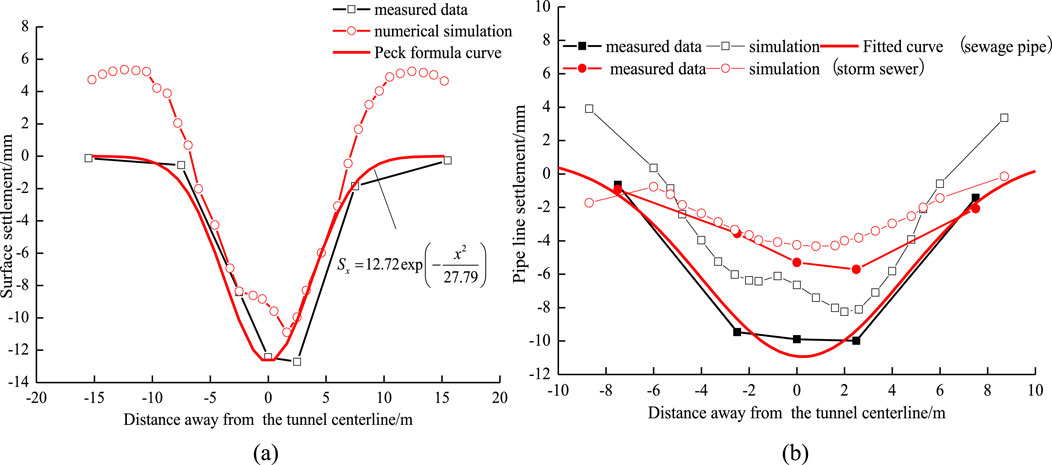
Figure 8. Comparison of settlement measurement and numerical simulation results: (a) Surface settlement; (b) Pipe line settlement.
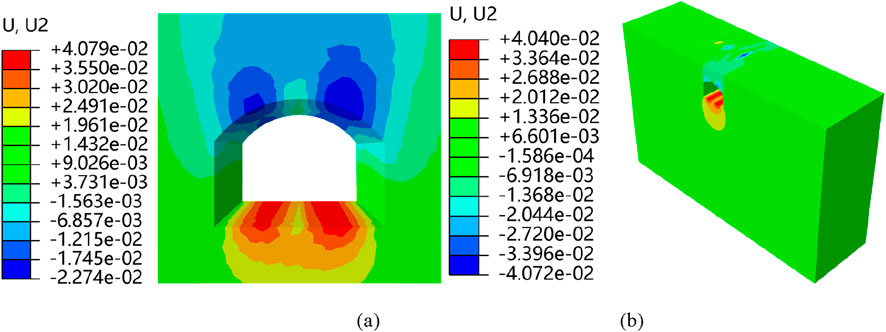
Figure 9. Settlement contour of surrounding rock: (a) Without vehicle passing; (b) Vehicle passing.
According to the parameters in Table 1 and the measured maximum settlement, the Peck formula can be established, shown in Equation 10.
The pipelines’ settlement caused by tunnelling also follows a Gaussian distribution, a formula was fitted to describe the sewage pipe’s settlement in a depth of 3.3 m, shown in Equation 11.
5 Results
5.1 Settlement of the tunnel and pipeline
According to the measured data and simulation results, when there are no vehicles passing through, the maximum surface settlement caused by tunnel excavation is 10.89 mm, and the settlement of the tunnel arch crown is 22.74 mm, as shown in Figure 9a. When a 75 kN axle load vehicle passes through at a speed of 72 km/h, it causes a maximum dynamic settlement of 33.58 mm at road feature point A and 1.42 mm at arch crown feature point C, as shown in Figure 9b.
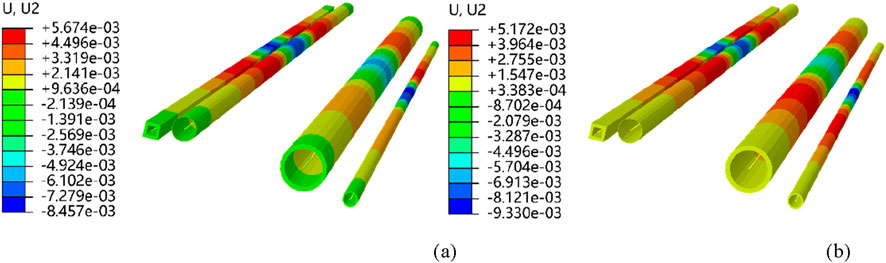
Figure 10. Settlement contour of surrounding rock before and under traffic load: (a) Without vehicle passing; (b) Vehicle passing (axle load 100 kN).
Figure 10a is the settlement contour of the pipeline which is caused by tunnel excavation only. When the vehicle passes above the tunnel, the pipeline’s settlement under the combined action of excavation and vehicle load is shown in Figure 10b.
The maximum settlement of the pipeline caused by tunnel excavation is 8.25 mm. When vehicles with axle loads of 50 kN, 75 kN, 100 kN, and 125 kN passes through, the maximum settlement of the pipeline is 9.08 mm, 9.49 mm, 9.91 mm, and 10.33 mm, respectively. The larger the axle load of the vehicle, the greater the dynamic settlement of the pipeline.
When a 75 kN vehicle load passes through at a speed of 72 km/h, the settlement time history curves of feature points are shown in Figure 11. The surface dynamic settlement is much higher than that at the tunnel arch, and decreases with increasing burial depth. The maximum dynamic settlement of surface feature point A is 33.58 mm, the maximum dynamic settlement of the storm sewer with a depth of 2.52 m is 1.62 mm; In depth of 3.31 m,the dynamic settlement of the sewage pipe is 1.23 mm.
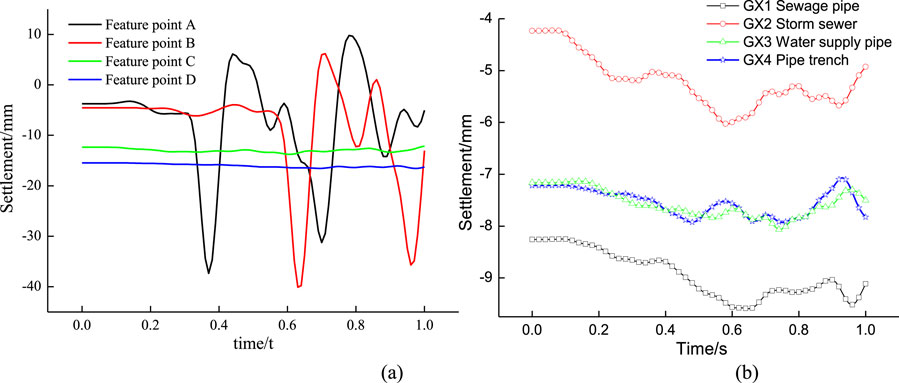
Figure 11. Settlement time-history curves of feature points: (a) Surrounding rock and tunnel structure; (b) Pipe line.
5.2 The influence of axle load
Due to the cumulative settlement and dynamic settlement of sewage pipe may exceed the potential safety allowable value; sewage pipes were selected for analysis in order to explore the impact of axle load on underground pipelines.
When a vehicle passes through at a speed of 72 km/h, Figure 12a shows the settlement distribution of the sewage pipeline above the underground tunnel under different axle loads, Figure 12b shows the settlement time history curve of the feature point L on the sewage pipeline under different axle loads. Figure 12c shows the relationship dynamic settlement and axle load.
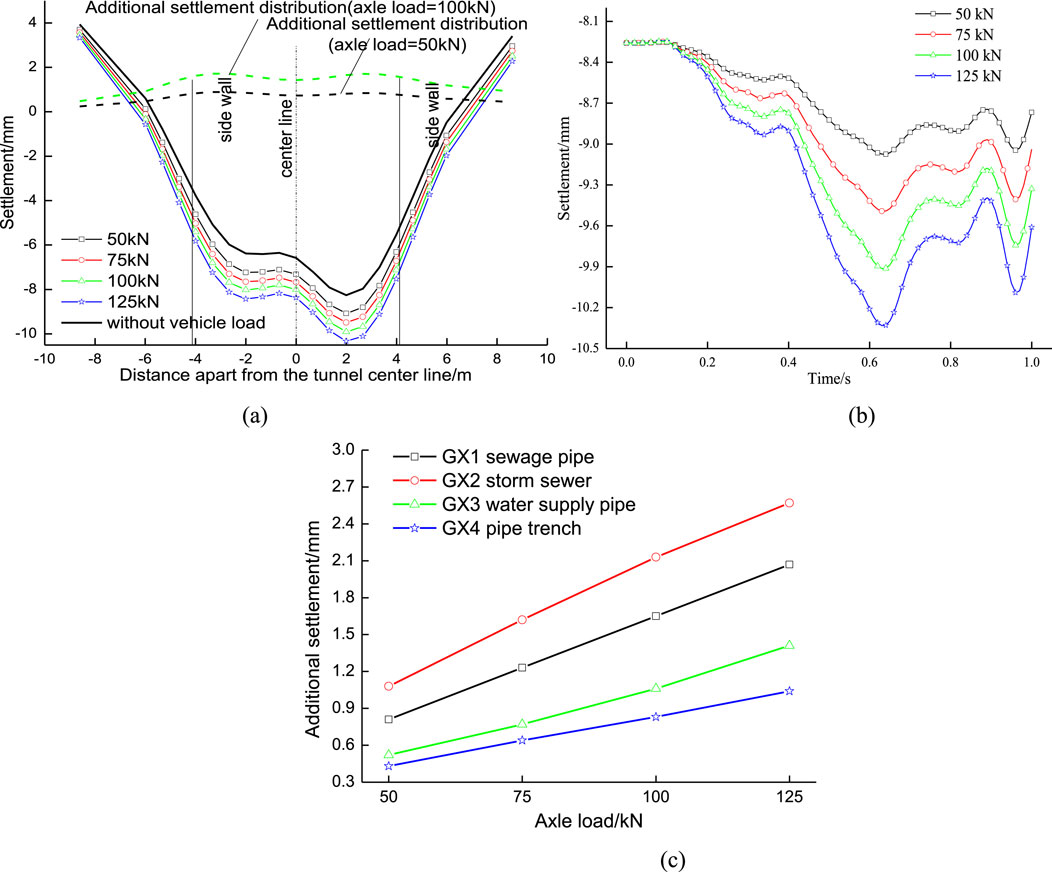
Figure 12. Settlement distribution of sewage pipe under different axle load: (a) Settlement distribution along the cross-section of the tunnel; (b) Settlement time history curves; (c) Axle load-dynamic settlement relationship.
According to Figure 12a, when a vehicle with an axle load of 50 kN travels at 72 km/h, the dynamic settlement values of the sewage pipe at the center line of the tunnel and 8.3 m from the center line are 0.81 mm and 0.24 mm, respectively; When the axle load is 100 kN, the dynamic settlement values of the sewage pipe at the center line of the tunnel and 8.3 m away from the center line are 1.65 mm and 0.48 mm, respectively.
Under the action of vehicle dynamic load, the dynamic settlement of the pipeline is significantly increased, and the dynamic settlement is higher at the tunnel span than at the unexcavated areas on both sides, indicating the existence of the underground tunnel, which exacerbates the dynamic response of the pipeline.
According to the dynamic settlement distribution curve in Figure 12a, it can be seen that the maximum dynamic settlement of the pipeline caused by vehicle load is located near the side wall of tunnel.
Figures 12b,c shows that the vehicle axle load has a significant impact on the dynamic response of the pipeline. When there are no vehicles passing through, the settlement value is caused by excavation. When vehicles pass through, the dynamic settlement increases with the increase of axle load.
5.3 The influence of speed
Figure 13a shows the settlement distribution of the sewage pipeline above the underground tunnel at different vehicle speeds, Figure 13b shows the settlement time history curve of the feature point L on the sewage pipeline at different vehicle speeds. Figure 13c shows the relationship dynamic settlement and speed.
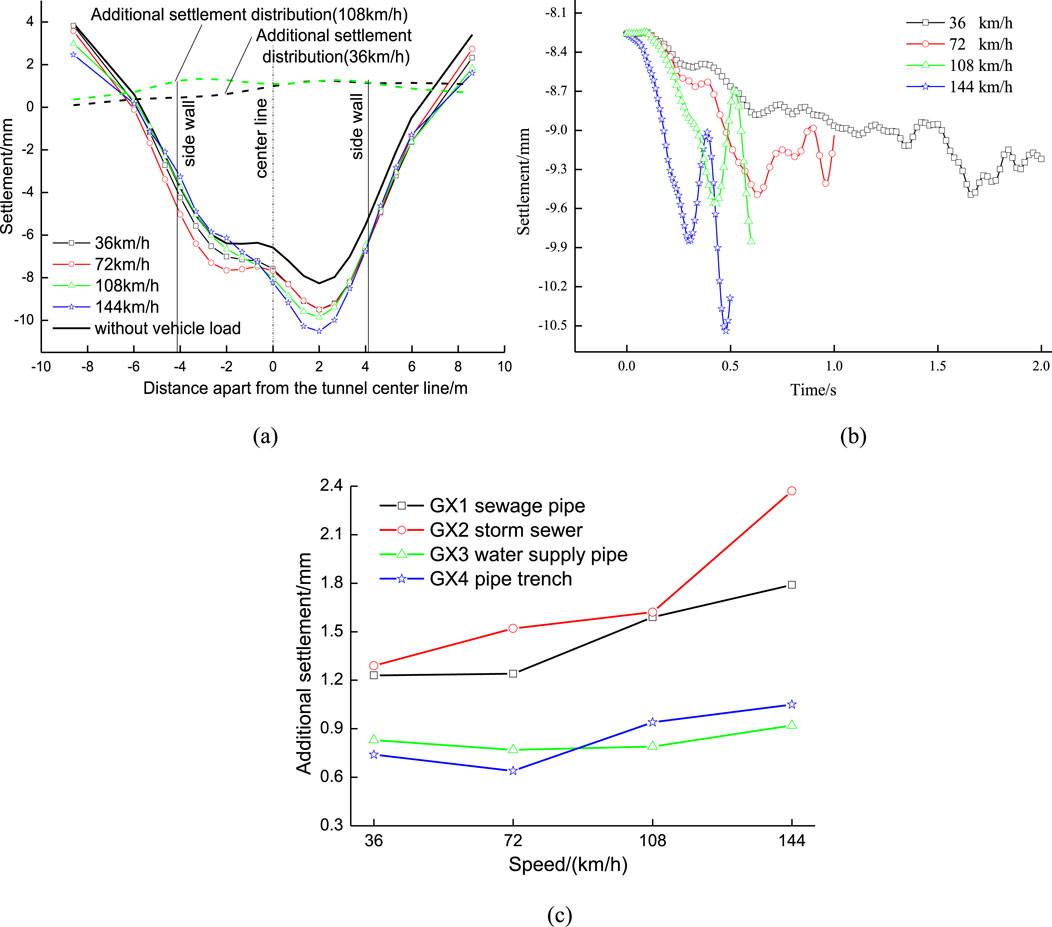
Figure 13. Settlement curves of sewage pipe under various speed: (a) Settlement distribution along the cross-section of the tunnel; (b) Settlement time history curves; (c) Speed-dynamic settlement relationship.
As shown in Figure 13a, the dynamic settlement of pipeline increases with the increase of vehicle speed, and the maximum dynamic settlement is also located near the center diaphragm of the tunnel.
When driving at a speed of 108 km/h through the center line of the tunnel, the dynamic settlement of the sewage pipe at the tunnel center line is 1.43 mm, the dynamic settlement value of the sewage pipe at a distance of 8.3 m from the centerline is 0.95 mm. Figure 13b shows that when the vehicle speed is below 72 km/h, the dynamic settlement of the pipeline is relatively stable. When the vehicle reaches 108 km/h, the faster the vehicle speed, the greater the dynamic settlement of the pipeline.
5.4 The influence of pipeline burial depth
When a 75 kN vehicle load passes through at a speed of 72 km/h, Figure 14a shows the settlement distribution of the sewage pipeline with different burial depths, and Figure 14b shows the settlement time history curve of the feature point L on the sewage pipeline with different burial depths, and Figure 14c shows the settlement variation with the burial depth of the sewage pipe.
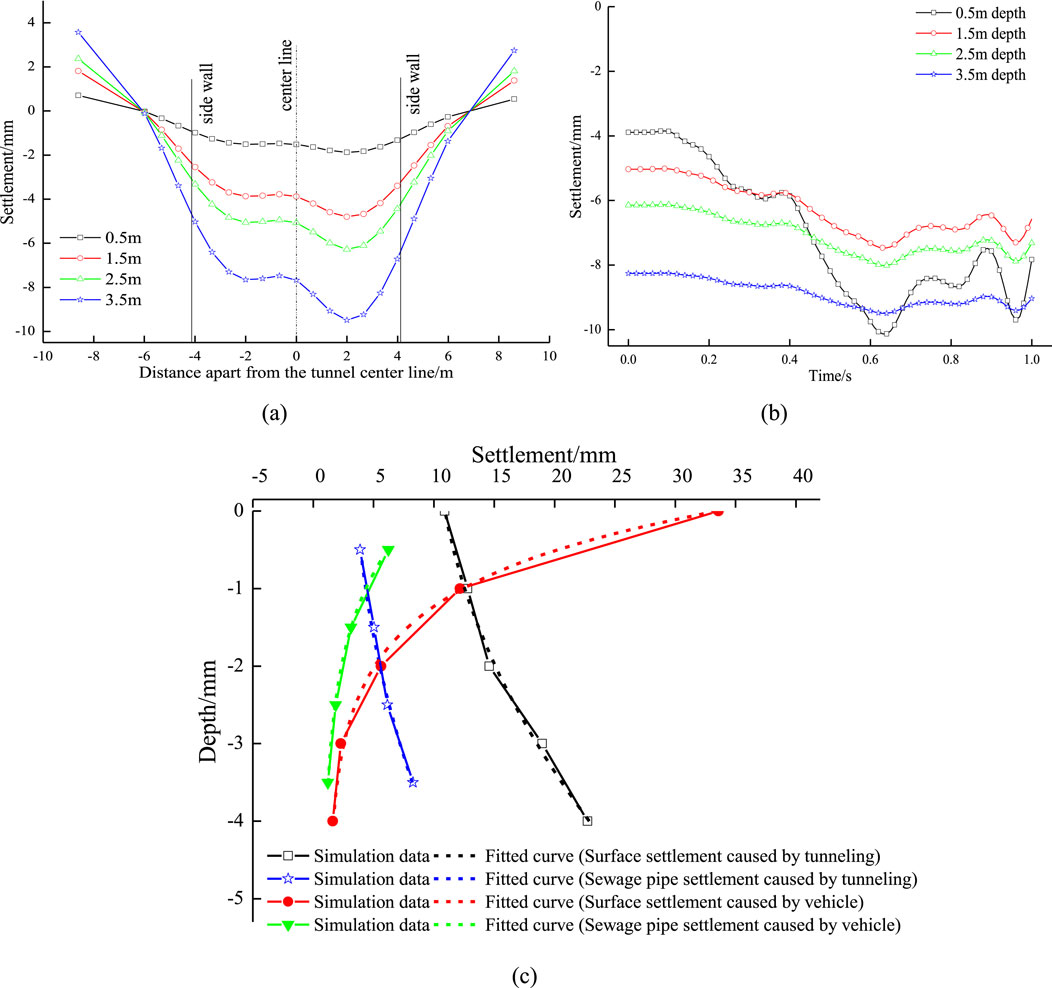
Figure 14. Settlement distribution of sewage pipe under different burial depth: (a) Settlement distribution along the cross-section of the tunnel; (b) Settlement time history curves; (c) Settlement -depth relationship and fitted formula curve.
According to Figure 14, as the distance apart from the tunnel arch increases, the settlement of the sewage pipe and ground surface caused by tunnelling is decreasing; the sewage pipe’s settlement caused by tunnelling is 8.26 mm at the depth of 4 m, and 3.89 mm at the depth of 0.5 m. Meanwhile, as the burial depth increasing, the dynamic settlement of the sewage pipe and ground surface is decreasing rapidly, the sewage pipe’s dynamic settlement is 6.22 mm at the depth of 0.5 m, and 1.23 mm at the depth of 3.5 m. At the same depth, the dynamic settlement and the settlement caused by excavation of sewage pipelines are both smaller than those of soil; the pipeline has a certain resistance effect on soil settlement.
5.5 Revised peck formula for settlement estimate
The maximum settlement of soil and sewage pipe along the depth direction, which is caused by tunnelling, can be calculated by using Equation 12 and Equation 13.
where: Smax,y is the soil’s maximum settlement caused by tunnelling at the depth of y (mm); Smax,Gx1,y is the Gx1’s maximum settlement caused by tunnelling at the depth of y (mm); y is the depth of soil or pipeline (m).
The maximum dynamic settlement of soil and sewage pipe are decayed with the depth increasing, can be calculated by using Equation 14 and Equation 15.
where: Smax,d,y is the soil’s maximum settlement caused by vehicle load at the depth of y (mm); Smax,d,Gx1,y is the Gx1’s maximum settlement caused by vehicle load at the depth of y (mm).
It should be noted that the shallower the pipeline is buried and the closer it is to the surface, the greater the dynamic settlement, which may cause the pipeline to exceed the safety limit. The deeper the pipeline is buried and the closer it is to the tunnel, the greater the settlement caused by tunnelling, which will also cause the pipeline to exceed the safety limit. Further more, if it is manual monitoring rather than automated monitoring, the dynamic settlement caused by vehicle loads will be ignored, and repeated dynamic impacts will be very detrimental to pipeline joints. Therefore, the safety risks of pipelines will be greatly underestimated, which deserves attention.
So based on Equations 10, 12 and 14, the final formula to estimate the coupling settlement of soil is shown in Equation 16.
Based on Equations 11, 13 and 15, the final formula to estimate the coupling settlement of sewage pipe is shown in Equation 17.
According to Equations 16 and 17, when x = 0, the maximum coupling settlement distribution is shown in Figure 15a; when y = 0.5, 1.0, 1.5, 2.5, 3.3 m, the maximum coupling settlement distribution is shown in Figure 15b, and the maximum dynamic settlement distribution is shown in Figure 15c.
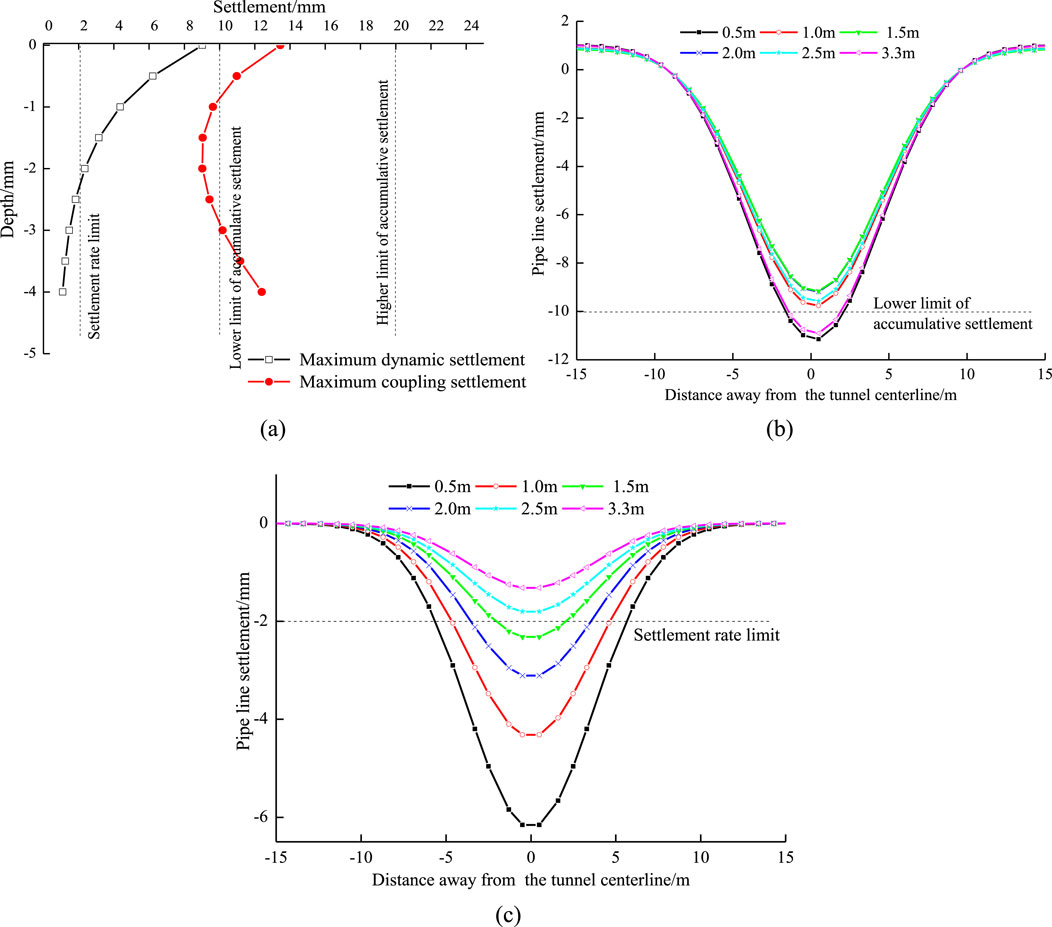
Figure 15. Settlement distribution of sewage pipe: (a) Verticle distribution of dynamic settlement; (b) Horizontal distribution of Coupling settlement; (c) Horizontal distribution of dynamic settlement.
6 Pipeline safety control standards
The settlement factors of pipelines are closely related to their materials. According to references (Fang et al., 2011; Ministry of Housing and Urban-Rural Development of th e People’s Republic of China, 2014; Ministry of Housing and Urban-Rural Development of the People’s Republic of China, 2002), the settlement standards for pipelines with different materials and diameters (side lengths) have been determined, as shown in Table 5.
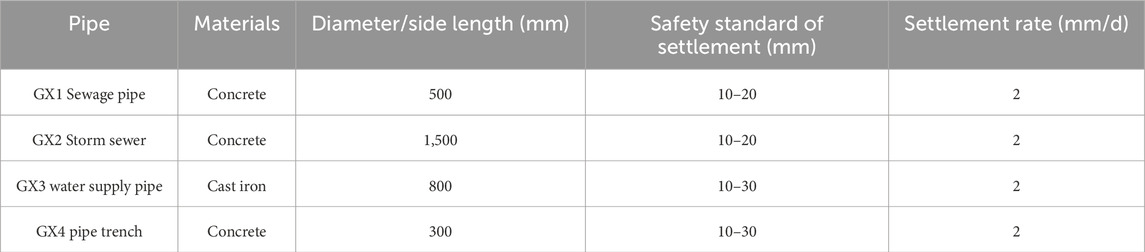
Table 5. Vertical settlement control standard for pipelines.
According to the coupling and dynamic settlement of the pipeline in Figure 15, it is revealed that: When the burial depth of the pipeline is less than 1.5 m, the settlement rate would exceed the safety limit; When the burial depth of the pipeline is less than 0.5 m or in the range of [3.0 m, 4.0 m], the coupling settlement of the pipeline in the tunnel range would exceed the accumulative limit.
Due to the continuous reciprocating impact of the upper vehicle’s dynamic load on the pipeline, the cumulative settlement safety allowable value should be taken as 10 mm. The analysis results show that: When there is a tunnel below the pipeline, the settlement caused by excavation and the dynamic settlement caused by vehicles are both relatively large, and both decrease with increasing distance from the tunnel center line.
When the axle load is 75 kN and the vehicle speed is below 108 km/h, without considering the cumulative effect of vibration cycles, the maximum settlement of the sewage pipe will not exceed the safety allowable value of 10 mm; when the axle weight is 100 kN and the vehicle speed is 72 km/h, the settlement is also close to the allowable value of 10 mm. At the same time, the dynamic settlement of the rainwater pipe caused by the vehicle’s dynamic load exceeds the safe allowable deformation rate of 2 mm/d. However, the speed of urban roads is generally low, and the increase in dynamic settlement of pipelines is limited. The calculation results show that when the speed reaches 144 km/h, the dynamic settlement of rainwater pipes reaches 2.37 mm, exceeding the allowable limit of change rate by 2 mm/d.
Due to the settlement of pipelines caused by tunnel excavation and the increased dynamic settlement of pipelines caused by the void effect of tunnel excavation, vibration control must be carried out in a certain area of the underground tunnel (preferably within the 2D range of the tunnel centerline) to ensure the safety of the pipeline. Firstly, the axle load of vehicles should be limited to below 75 kN, and secondly, the driving speed should be limited to below 72 km/h.
7 Conclusion
Based on a subway tunnel that passes through dense pipelines in the urban road, combined with measured data, a three-dimensional numerical simulation model is established. Using numerical simulation methods, the dynamic response characteristics of adjacent dense pipelines under the dual effects of tunnel excavation and road vehicle loads are analyzed, and proposed a revised Peck formula to estimate the pipelines’ settlement caused by tunnelling and vehicle load. The main conclusions are as follows.
1. The settlement of soil and pipeline caused by tunnelling decreases with decreasing burial depth. Meanwhile, as the burial depth increasing, the dynamic settlement of the sewage pipe and ground surface is decreasing rapidly.
2. The dynamic settlement of the pipeline enlarges with the vehicle axle load and speed increasing. The pipes’ dynamic settlement at the tunnel centerline is the largest, and decay towards both sides, indicating that tunnel void significantly increases the dynamic settlement of the pipeline.
3. Based on the settlement distribution characteristics, a revised Peck formula is established to estimate the pipelines’ settlement in different depths and positions. When the depth is less than 1.5 m or the distance apart from the tunnel arch is less than 1.0 m, the pipelines’ settlement would exceed the limit. It is also recommended to limit the axle load to below 75 kN and the speed to below 72 km/h within the 2D range of the tunnel centerline, so as to ensure the safety and stability of the pipeline.
4. Whether the pipeline is buried close to the surface or tunnel, it should be noted that the pipeline’s dynamic settlement or cumulative settlement may exceed the safety limit. In addition, if it is manual monitoring rather than automated monitoring, the safety risks of pipelines will be greatly underestimated by ignoring the dynamic settlement and its adverse impacts on the pipeline joints.
Data availability statement
The original contributions presented in the study are included in the article/Supplementary Material, further inquiries can be directed to the corresponding author.
Author contributions
SP: Writing – original draft, Writing – review and editing.
Funding
The author(s) declare that no financial support was received for the research and/or publication of this article.
Acknowledgments
In this section, you can acknowledge any support given which is not covered by the author contribution or funding sections. This may include administrative and technical support, or donations in kind (e.g., materials used for experiments).
Conflict of interest
Author SP was employed by China Railway 18th Bureau Group Corp, Ltd.
Generative AI statement
The author(s) declare that no Generative AI was used in the creation of this manuscript.
Any alternative text (alt text) provided alongside figures in this article has been generated by Frontiers with the support of artificial intelligence and reasonable efforts have been made to ensure accuracy, including review by the authors wherever possible. If you identify any issues, please contact us.
Publisher’s note
All claims expressed in this article are solely those of the authors and do not necessarily represent those of their affiliated organizations, or those of the publisher, the editors and the reviewers. Any product that may be evaluated in this article, or claim that may be made by its manufacturer, is not guaranteed or endorsed by the publisher.
Supplementary material
The Supplementary Material for this article can be found online at: https://www.frontiersin.org/articles/10.3389/fbuil.2025.1607111/full#supplementary-material
References
An, J. H., Yan, H. J., Zhao, Z. J., and Jiang, L. Z. (2022). Seismic response analysis of liquefiable soil layer on subway station structure. Sci. Technol. Eng. 22 (17), 7080–7088.
Cao, Z. Z., Xiong, Y., Xue, Y., Du, F., Li, Z. H., Huang, C. H., et al. (2025). Diffusion evolution rules of grouting slurry in mining-induced cracks in overlying strata. Rock. Mech. Rock. Eng. 58, 6493–6512. doi:10.1007/s00603-025-04445-4
CCCC Highway Consultants Co (2015). Ltd. General specifications for design of highway bridges and culverts: JTG D60-2015. Beijing, China: China Communications Press, 26–29.
Fang, Q., Zhang, D. L., and Wong, L. N. Y. (2011). Environmental risk management for a cross interchange subway station construction in China. Tunn. Undergr. Sp. Technol. 26 (6), 750–763. doi:10.1016/j.tust.2011.05.003
Hou, Y. J., Fang, Q., Zhang, D. L., and Wong, L. N. Y. (2015). Excavation failure due to pipeline damage during shallow tunnelling in soft ground. Tunn. Undergr. Sp. Technol. 46, 76–84. doi:10.1016/j.tust.2014.11.004
Huang, Y. X. (1998). Pavement analysis and design. Beijing, China: China Communications Press, 192–200.
Huang, M., Zhou, X., Yu, J., Leung, C. F., and Tanb, J. Q. W. (2019). Estimating the effects of tunnelling on existing jointed pipelines based on winkler model. Tunn. Undergr. Sp. Technol. 86, 89–99. doi:10.1016/j.tust.2019.01.015
Kong, F., Lu, D., Du, X., Li, X., and Su, C. (2021). Analytical solution of stress and displacement for a circular underwater shallow tunnel based on a unified stress function. Ocean. Eng. 219, 108352. doi:10.1016/j.oceaneng.2020.108352
Li, Y., F. Huang, C., F. Lu, H., and Mou, J. (2024). Deformation prediction model of existing tunnel structures with equivalent layered method–peck coupled under multiple factors. Mathematics 12 (10), 1479. doi:10.3390/math12101479
Lin, C., and Huang, M. (2019). Tunnelling-induced response of a jointed pipeline and its equivalence to a continuous structure. Soils Found. 59, 828–839. doi:10.1016/j.sandf.2019.02.009
Lin, C., Huang, M., Nadim, F., and Liu, Z. (2020). Tunnelling-induced response of buried pipelines and their effects on ground settlements. Tunn. Undergr. Sp. Technol. 96, 103193. doi:10.1016/j.tust.2019.103193
Liu, C., Lei, M. F., Peng, L. M., and Shi, C. H. (2020). Cavity influence on fatigue performance of heavy haul railway tunnel’s bottom structure. Constr. Build. Mater. 251 (8), 118886–12. doi:10.1016/j.conbuildmat.2020.118886
Liu, X., Jiang, A. N., Fang, Q., Wan, Y. S., Li, J. Y., and Guo, Y. P. (2022). Spatiotemporal deformation of existing pipeline due to new shield tunnelling parallel beneath considering construction process. Appl. Sciences-Basel 12 (1), 12010500. doi:10.3390/app12010500
Luo, J. J., Zhang, D. L., Wang, M. S., and Zhang, C. P. (2007). Study on the influence of station subsurface excavation on underground pipelines in beijing metro. J. China Railw. Soc. (05), 127–132.
Ma, W., Chai, J., Zhu, Z., Han, Z., Ma, C., Li, Y., et al. (2021). Research on vibration law of railway tunnel substructure under different axle loads and health conditions. Shock Vib. 2021, 9954098. doi:10.1155/2021/9954098
Ministry of Housing and Urban-Rural Development of the People’s Republic of China (2014). Technical code for monitoring of urban rail transit engineering: GB 50911—2013. Beijing, China: China Construction Industry Press, 30.
Ministry of Housing and Urban-Rural Development of the People’s Republic of China (2002). Structural design code for pipelines of water supply and waste water engineering: GB 50332-2002. Beijing, China: China Construction Industry Press.
Ministry of Housing and Urban-Rural Development of the People’s Republic of China (2010). Code for design of concrete structures: GB 50010-2010. Beijing, China: China Construction Industry Press, 20.
Peck, R. ; B. (1969). Deep excavation and tunneling in soft ground, state of the art report. In: Proceedings of the 7th International Conference on Soil Mechanics and Foundation Engineering. Mexico City: On Soil Mechanics and Foundation Engineering, 225–290.
State Administration for Market Regulation (2019). Ductile iron pipes, fittings and accessories for water or gas applications: GB/T 13295-2019. Beijing, China: Standards Press of China, 94–100.
Sun, W., Lin, E. P., Yang, Z. Q., Ni, P. P., and Chen, Y. (2024). Damage analysis of buried pipelines subjected to side-by-side twin tunneling based on centrifuge and numerical modeling. Tunn. Undergr. Sp. Technol. 146, 105647. doi:10.1016/j.tust.2024.105647
Wang, J. Q., An, J. T., Zhang, S. Y., Ge, R. Y., Xie, Q. W., Chen, Q. S., et al. (2023). Numerical investigation and prediction of side-by-side tunneling effects on buried pipelines. Sustainability 15 (1), 15010353. doi:10.3390/su15010353
Wang, Y., Shi, J., and Ng, C. W. W. (2011). Numerical modeling of tunneling effect on buried pipelines. Can. Geotech. J. 48, 1125–1137. doi:10.1139/t11-024
Wang, A., Shi, C., Zhao, C., Deng, E., Yang, W., and He, H. (2020). Response characteristics of cross tunnel lining under dynamic train load. Appl. Sci. 10, 4406. doi:10.3390/app10124406
Wang, M., Liu, R. T., Xu, X. J., Li, W. H., Li, X., Zhang, L. Z., et al. (2024). Mechanical response of pavements with voids under traffic load. Iran. J. Sci. Technology-Transactions Civ. Eng. 48 (2), 1083–1104. doi:10.1007/s40996-024-01359-z
Wham, B. P., Argyrou, C., and O’Rourke, T. D. (2016). Jointed pipeline response to tunneling-induced ground deformation. Can. Geotech. J. 53, 1794–1806. doi:10.1139/cgj-2016-0054
Xu, J. C., Xue, H. H., and Rui, G. R. (2022). Theoretical analysis of rock blasting damage in construction of tunnels closely under-passing sewage box culverts. Appl. Sciences-Basel 12 (19), 9875. doi:10.3390/app12199875
Xu, P., Guo, Y. K., Ding, Y. H., Li, H., Chen, T. Y., and Wang, H. K. (2025). Effect of polymeric aluminum chloride waste residue and citric acid on the properties of magnesium oxychloride cement. J. Build. Eng. 101, 111864. doi:10.1016/j.jobe.2025.111864
Yang, C. Y., Dong, Y., Cheng, L., Qiu, M. L., and Zhang, L. Z. (2020). Analysis of co-deformation law between pipelines and soil due to traversing construction. J. Railw. Eng. Soc. 37 (01), 93–100. doi:10.3969/j.issn.1006-2106.2020.01.016
Yao, X. D., and Wang, M. S. (2006). Statistic analysis of guideposts for ground settlement induced by shallow tunnel construction. Chin. J. Rock Mech. Eng. 10, 2030–2035.
Zhai, S. H., Zheng, J. C., and Xin, T. (2012). Analysis of the impact of underground cavity evolution on existing underground pipelines. Water and Wastewater Eng. 48 (S1), 436–438.
Zhan, T., Wu, B., Wu, B. B., Zheng, W. Q., Qin, J., and Xie, Y. J. (2023). Deformation of underground dense pipelines and solum adjacent to shallow buried underground subway tunnels. Sci. Technol. Eng. 23 (11), 4755–4764. doi:10.3969/j.issn.1671-1815.2023.11.032
Zhang, X., Cheng, H., Xu, Y. J., and Li, H. L. (2022). A case study on performances of overlying pipelines due to shallow tunnels excavation in water-rich gravel ground. Ain Shams Eng. J. 13 (5), 101746. doi:10.1016/j.asej.2022.101746
Zhang, L., Pan, Y. G., Chen, K. Z., Zheng, G. Q., Gao, Y., Chen, P., et al. (2023). The effect of CRD method and auxiliary construction on surface settlement in shallow-buried tunnels. Front. Earth. Sc.-Switz. 10, 998717. doi:10.3389/feart.2022.998717
Zhou, Z., Ding, H., Miao, L., and Gong, C. (2021). Predictive model for the surface settlement caused by the excavation of twin tunnels. Tunn. Undergr. Space Technol. 114, 104014. doi:10.1016/j.tust.2021.104014
Keywords: Peck’s formula, subway tunnels, pipelines, settlement, control standards
Citation: Peng S (2025) Revised Peck’s formula for estimating pipeline’s settlement under the coupling effect of tunnelling and vehicle load. Front. Built Environ. 11:1607111. doi: 10.3389/fbuil.2025.1607111
Received: 07 April 2025; Accepted: 29 August 2025;
Published: 08 October 2025.
Edited by:
Abolghassem Zabihollah, Tarleton State University, United StatesReviewed by:
Zhengzheng Cao, Henan Polytechnic University, ChinaAbolghassem Zabihollah, Tarleton State University, United States
Copyright © 2025 Peng. This is an open-access article distributed under the terms of the Creative Commons Attribution License (CC BY). The use, distribution or reproduction in other forums is permitted, provided the original author(s) and the copyright owner(s) are credited and that the original publication in this journal is cited, in accordance with accepted academic practice. No use, distribution or reproduction is permitted which does not comply with these terms.
*Correspondence: Shu Peng, NDM0NjkxNzI1QHFxLmNvbQ==