 Siska Wulandari1,2
 Firman Pratama1
 Neil Andika3
 Piter Wongso1
 Winda Wijayasari1
 Faizal Immaddudin Wira Rohmat1,4*
- 1Water Resources Development Center, Directorate of Research and Innovation, Institut Teknologi Bandung, Bandung, Indonesia
- 2Department of Integrated Water Management Engineering, Institut Teknologi Sumatera, Lampung, Indonesia
- 3Department of Civil and Environmental Engineering, Gadjah Mada University, Yogyakarta, Indonesia
- 4Water Resources Research Group, Faculty of Civil and Environmental Engineering, Institut Teknologi Bandung, Bandung, Indonesia
Makassar City, a fast-growing urban center in Eastern Indonesia, is highly vulnerable to flooding due to a combination of extreme rainfall, urban expansion, sedimentation, and a limited flood management system. This study investigates the main contributors to flooding in Makassar, based on the city’s extreme flood event in January 2019 and evaluates the effectiveness of the Bili-Bili Reservoir in mitigating flood impacts through integrated hydrologic–hydrodynamic modeling. A combination of HEC-HMS and HEC-RAS 2D was used to simulate the rainfall runoff processes and model flood inundation. GSMaP satellite rainfall data, land cover, soil type, and topographic information (FABDEM + river cross-section) were integrated into the model. Additional terrain data from OSM-B highlights urban areas characterized by dense building development. The validation process was conducted by comparing the modeling output against the inundation maps provided by the local government. Scenario simulations with 20-year return period (Q20) discharges from the Tallo River, Jenelata River, and Bili-Bili Reservoir outflow were used to assess their individual and combined impacts on flooding. Findings indicate that the Tallo River is the dominant contributor to flooding, while reservoir releases and Jenelata River inflow triggered additional inundation in downstream areas. The Bili-Bili Reservoir reduced upstream flooding but was less effective under high-inflow conditions. Discrepancies between model results and reported flood extents in several districts suggest other contributing mechanisms, including urban drainage inadequacies. This study’s findings emphasize the need for more targeted flood mitigation strategies, underscoring the importance of optimizing reservoir operations, managing sedimentation, and exploring storage interventions within Makassar City’s river system to strengthen urban flood resilience.
Introduction
Disasters, which include both natural and human-induced disasters, have affected communities worldwide, leading to significant loss of life, economic loss, and environmental damage (Birkmann et al., 2022; Cvetković et al., 2024). According to the United Nations Office for Disaster Risk Reduction (UNDRR), over the past 2 decades, disasters have resulted in approximately 1.3 million casualties and affected more than 4 billion individuals globally, with economic losses exceeding $2.97 trillion (UNDRR, 2018; UNDRR, 2022). Climate change has worsened these impacts by making hydrometeorological disasters such as floods, storms, and droughts more frequent and intense. Additionally, rapid urbanization and rising population densities in hazard-prone areas have further increased disaster potential. Among these disasters, floods resulted in the most direct economic losses, reaching $51,457 billion. Such losses primarily affect regions in South Asia, South America, and Africa (UNDRR, 2021). The socio-economic implications of floods are extensive, leading to population displacement (Manzoor et al., 2022), disruption of daily activities and transportation, destruction of infrastructure, damage to property, agricultural impact, and environmental consequences, including groundwater quality deterioration due to alluvial deposits and the effect on groundwater recharge (Vyas et al., 2024; Jodhani et al., 2025). Additionally, floods compromise clean water availability and disrupt ecosystems (Raphela and Matsididi, 2024), result in public health issues (Raza et al., 2023), threaten food security (Atanga and Tankpa, 2021), and can trigger secondary disasters such as land erosion and landslides. A World Bank report highlights this alarming trend, noting that approximately 1.47 billion people are exposed to at least moderate flood risk, with 89% residing in low- and middle-income countries (World Bank, 2020). This disproportionate burden highlights the urgent need for strategic resource allocation and knowledge sharing to strengthen global flood resilience.
Indonesia, like many other countries, is highly vulnerable to floods. As part of the Maritime Continent, Indonesia is prone to extreme rainfall events due to its tropical and monsoonal climatological conditions (Rohmat et al., 2023; Sudarman et al., 2024), often resulting in severe flooding (Paski et al., 2020; Hermawan et al., 2022; Purwaningsih et al., 2022; Senior et al., 2023). This vulnerability is intensified by high population density. Indonesia is the fourth most populous country in the world, with approximately 285 million people in 2025 (World Population Review, 2025), while also ranks fourth globally in terms of population exposure to high flood risk, following China, India, and Bangladesh (Rentschler and Salhab, 2020; Rentschler et al., 2022). This positions Indonesia as the most flood-prone country in Southeast Asia, with approximately 75.7 million people (27% of the total population) facing high flood risk. Moreover, the Indonesian National Agency for Disaster Management (Badan Nasional Penanggulangan Bencana, BNPB) reported that in 2 decades (2005–2024), floods have been the most frequent disaster in Indonesia, with approximately 16,359 recorded events, resulting in 4,316 fatalities, 923 missing persons, 185,827 injuries, and 48,301,293 individuals affected, along with 7,444,566 evacuees (BNPB, 2025). Given the extensive impacts of flooding, investing in comprehensive disaster mitigation strategies is essential to effectively minimize flood-related losses.
Makassar (Figure 1a) exemplifies a city prone to flooding, reflecting Indonesia’s broader vulnerability to hydrometeorological disasters. Located in South Sulawesi Province, the city has experienced recurrent flood events over the years, often with severe consequences for both its population and infrastructure. Prior studies indicate that flooding in Makassar is driven by a combination of natural and anthropogenic factors, including extreme rainfall, inadequate drainage infrastructure, poor watershed management, low community participation, and challenges in institutional coordination (Musliadi et al., 2021; Wahid et al., 2021; Indrayani et al., 2023; Mursalin and Natsir, 2024). These events are typically characterized by rapid water accumulation in low-lying urban areas, overflow from major rivers (Figure 1a), and prolonged inundation caused by limited outflow capacity, suboptimal river conveyance from sedimentation, delayed institutional responses, and land cover changes (Patanduk, 2013; Nurdin et al., 2019; Widodo et al., 2021). Upstream of Makassar City, three major river systems contribute to the city’s flood vulnerability: the Jeneberang, Jenelata, and Tallo Rivers (Figure 1c). The Jeneberang River, which flows to the south of Makassar, is regulated by the Bili-Bili Dam. The Jenelata River converges with the Jeneberang River downstream of the dam, adding additional discharge volume. In contrast, the Tallo River flows to the north of the city and is not regulated by a major upstream dam. The interaction between these rivers presents a complex hydrological setting that influences flood behavior across various zones of Makassar.
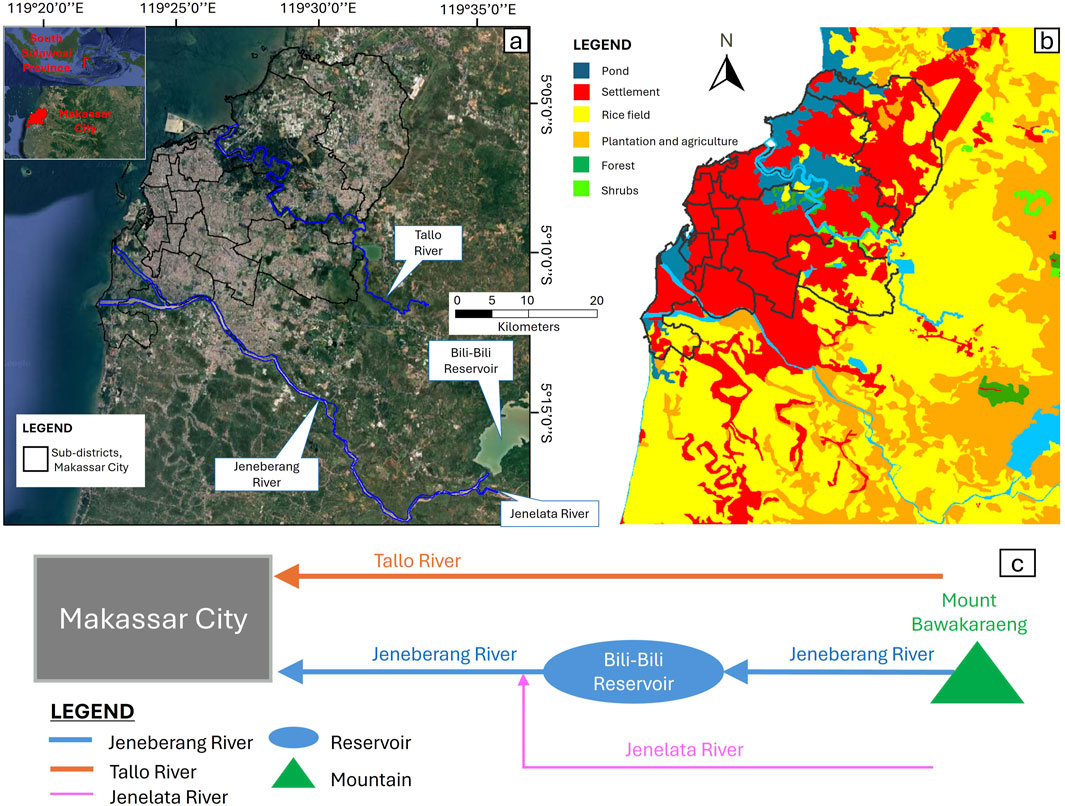
Figure 1. (a) Makassar City in South Sulawesi Province, Indonesia, is flowed by two main rivers: the Jeneberang River and the Tallo River. The Jenelata River is located below the Bili-Bili Reservoir and flows into the Jeneberang River. (b) Land cover map of Makassar City and the surrounding area. (c) The river system flows into Makassar City.
This study aims to address the understanding of how multiple river systems interact to cause flooding in Makassar. Specifically, it investigates the relative contributions of the Jeneberang, Jenelata, and Tallo Rivers to the January 2019 flood event in Makassar City. It also explores how these river systems interact under extreme rainfall conditions and how such interactions influence the spatial extent and depth of flooding across the city. The study develops an integrated hydrologic and hydrodynamic model of Makassar’s flood system and simulates the January 2019 flood event using the Global Satellite Mapping of Precipitation (GSMaP) satellite rainfall data, land cover data, soil type, topographic data (combined Forest and Buildings Removed Copernicus DEM (FABDEM), river cross-section, and Building-OpenStreetMap (OSM-B)), and official flood extent maps for validation, analyzing the impact of discharge from each river system. The Hydrologic Engineering Center’s Hydrologic Modeling System (HEC-HMS) is used to simulate rainfall-runoff processes and generate inflow hydrographs for the contributing catchments (USACE Hydrologic Engineering Center, 2024a). These are then input into the Hydrologic Engineering Center’s River Analysis System (HEC-RAS), which simulates flood propagation, inundation extent, and depth across the city (USACE Hydrologic Engineering Center, 2024b). The validated model was then used as the basis for several scenarios of Q20 discharge release among the Tallo River, Jenelata River, and the outflow of the Bili-Bili Reservoir to determine the most contributing factor to flooding in Makassar City while assessing the Bili-Bili Reservoir’s effectiveness in mitigating urban flooding. The outcomes of this research are expected to provide evidence-based insights that can inform more targeted and integrated flood risk management strategies for Makassar City.
Materials and methods
Study area
Makassar City, the capital of South Sulawesi Province, is the largest urban center in eastern Indonesia and ranks as the eighth-largest city in the country. Geographically, this city is situated in zone 50 S of the Universal Transverse Mercator (UTM) coordinate system, based on the World Geodetic System 1984 (WGS 84) datum, specifically located between 119°24′25.6″ E and 5°8′7.4″ S. Covering an area of 175.77 km2, the city comprises 15 sub-districts and 153 wards (Statistics Indonesia, 2024). According to data from the Pompengan-Jeneberang River Basin Agency (Balai Besar Wilayah Sungai, BBWS), Makassar is passed through by two major rivers: the Jeneberang River to the south and the Tallo River to the north (Figure 1a). Makassar’s topography ranges from flat coastal plains with slopes of 0°–2° in the western and northern parts to hilly terrain with slopes of 3°–15° in the east. Lowland areas, situated at elevations between 0 and 40 m above sea level, are densely populated and dominated by residential settlements. In contrast, the eastern and upland areas are characterized by a mix of rice fields, plantations, and agricultural land, with only a small portion of the remaining forest cover (Figure 1b) (Djamaluddin et al., 2020). The city’s location, combined with rapid urbanization and limited green space, intensifies surface runoff and reduces infiltration, increasing flood risk.
Makassar’s climate is classified as tropical monsoonal, with a pronounced wet season. Based on the past decade of meteorological records, January is the wettest month with an average monthly rainfall of 369 mm, while August is the driest (Statistics Indonesia, 2024). Flooding often occurs during the rainy season, especially when heavy rainfall coincides with high tides. Several sub-districts experience recurrent inundations due to the city’s low-lying topography and inadequate drainage infrastructure. The situation is intensified by Makassar’s population density, which reached approximately 1.46 million in 2025, with an average of 8,300 people per square kilometer, which is above the threshold for a “very dense” urban area (>1,500 people/km2) (Statistics Indonesia, 2024).
Makassar’s vulnerability is part of a broader regional trend. Sulawesi, the fourth largest and third-most-populated island in Indonesia, is home to nearly 20 million people, with approximately 9 million residing in South Sulawesi Province. In the last 10 years, 2015 to 2024, floods contributed at least 30 percent of all natural disasters in the province (BNPB, 2025). The flood event of January 2019 was particularly severe, not only affecting Makassar City but also impacting other regions across South Sulawesi, including the Makassar Peninsula (Doyle et al., 2023). This extreme event highlights the urgency of understanding the hydrological dynamics and contributing factors behind flooding in Makassar as a basis for future mitigation planning.
Case study: the extreme flooding in Makassar City in January 2019
In January 2019, Makassar experienced its most severe flooding event in over 2 decades. According to a report from the Indonesian Ministry of Public Works (PU), nine out of 15 Makassar’s sub-districts were affected. These areas were identified based on local community survey reports, reporting overflows coming from the Jeneberang and Tallo Rivers. Latos et al. (2021) described the flood because of prolonged heavy rainfall from 16:00 UTC on January 20 to 08:00 UTC on January 23, primarily affecting the southern Makassar Peninsula, which discharges into the Makassar Strait. Rainfall data recorded by the PU and the Meteorology, Climatology, and Geophysics Agency (BMKG) indicated that on 22 January 2019, the daily rainfall far exceeded the historical average daily annual maximum of 150 mm/day. Lengkese, Bawakaraeng, and Limbungan rainfall gauges recorded 329, 308, and 328 mm/day, respectively. The disaster, which affected an estimated area of 3,700 km2 in the Makassar Peninsula, resulted in 53 fatalities, 47 injuries, and the displacement of over 14,000 people across South Sulawesi Province. Within Makassar City alone, there was at least 1 recorded fatality, 9,328 affected individuals, and 1,000 displaced residents (Doyle et al., 2023).
Several studies have identified contributing factors to the flood, including sedimentation in rivers and reservoirs, unregulated mining activities, unregulated land cover changes, and increased landslide risk in upstream areas (Nurdin et al., 2019). The Bili-Bili Reservoir, which receives inflow from the Jeneberang River originating from the erosion-prone Bawakaraeng mountain, had a substantial role during the event (Dhanio et al., 2008). The reservoir experienced extreme inflow, pushing its storage capacity near the operational limit. Water levels reached 101.87 m, just below the maximum allowable level of 103 m, which put the reservoir in a warning state. In response, the reservoir spillway gates needed to be fully opened to prevent overtopping. The recorded spillway discharges ranged from 1,200 m3/s to the reservoir’s maximum spillway capacity of 2,200 m3/s.
In addition to the Bili-Bili outflow, the Jenelata River contributed a peak discharge of approximately 1,200 m3/s during the event, compounding downstream flood conditions in Makassar (Kompas.id, 2019). According to BNPB reports, inundation depths ranged from 1.5 to 4 m in affected areas, causing extensive damage to infrastructure, homes, and agricultural lands. A total of 32 houses were completely swept away, 25 were severely damaged, 14 were moderately damaged, and 55 were buried by landslides. In addition, 2,694 houses and 114.33 km2 of farmland were inundated. Numerous public facilities, roads, and bridges suffered significant structural damage, further worsening the impact on affected communities.
Methodology
To model flood inundation in Makassar City during the extreme flood event of January 2019, several key steps were undertaken, as illustrated in Figure 2. These steps included data collection, flood modeling, visualization and validation, scenario-based simulations, and subsequent analysis of the modeling results. The data collection process involved obtaining topographic data, rainfall data, historical flood inundation maps, land cover maps, and soil type maps. The flood modeling comprised both hydrological and hydraulic simulations. Hydrological modeling was used to generate runoff from rainfall events, while hydraulic modeling simulated flood propagation and inundation extent across the urban landscape. The visualization and validation phase focused on calibrating the model to replicate the January 2019 flood event, ensuring that the simulation accurately reflected observed conditions. Once validated, the model was used to simulate several scenarios involving Q20 design discharge combinations from the Tallo River, the Jenelata River, and the Bili-Bili Reservoir outflow. These scenarios aimed to identify the primary contributors to flooding in Makassar City. Furthermore, the scenario results were used to evaluate the role and effectiveness of the Bili-Bili Reservoir in mitigating flood impacts during extreme rainfall events.
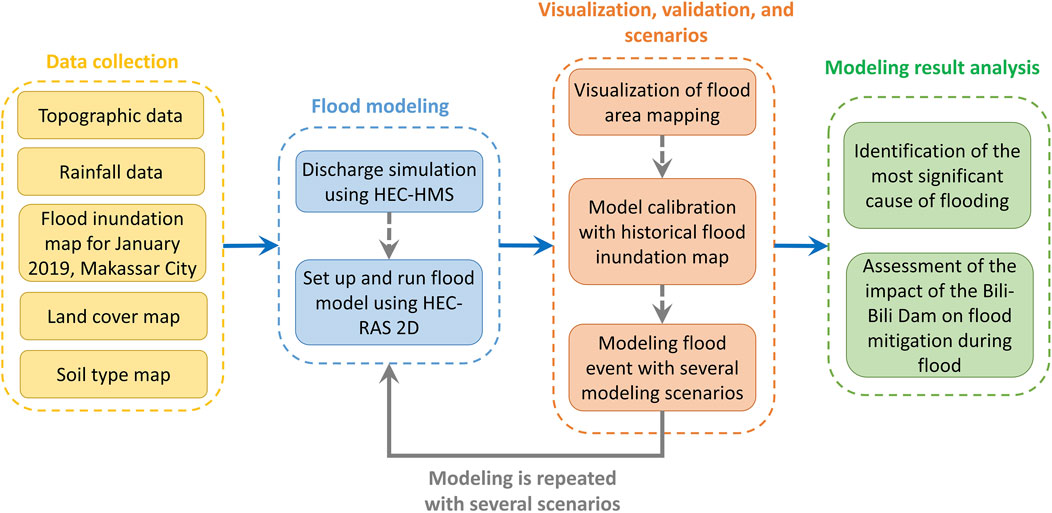
Figure 2. The general methodology for the modeling and analysis of extreme flood events in Makassar City in January 2019.
Data collection
In this study, these datasets were used to support hydrological and hydraulic modeling. Additionally, a historical flood inundation map was utilized to validate the simulation results. Hydrological data, particularly rainfall data, were also essential for driving the flood discharge scenarios. The types of data, their descriptions, specifications, and sources used in this study are summarized in Table 1. Topographic data were derived from the FABDEM, a global Digital Elevation Model (DEM) product with forest and building features removed. FABDEM has a spatial resolution of 1 arc-second (∼30 m) (Hawker et al., 2022; Uhe et al., 2022). To improve the accuracy of urban topography, the FABDEM dataset was complemented with cross-section data obtained from the PU and building footprint data from OpenStreetMap (OSM-B) (Haklay and Weber, 2008; OpenStreetMap, 2025). The integration of FABDEM and OSM-B layers allowed for a more realistic representation of Makassar’s densely built urban environment, which is crucial for simulating flood behavior in city settings.
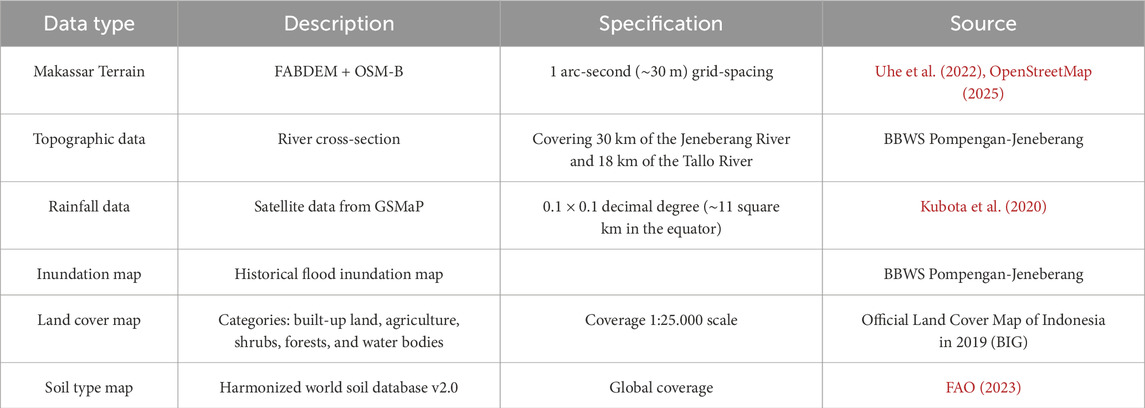
Table 1. Data type, description, specification, and source used in this study.
Hydrological data in this study consisted primarily of rainfall data. Precipitation information was obtained from the GSMaP product, developed by the Japan Aerospace Exploration Agency (JAXA). This data offers consistent and high-resolution spatiotemporal coverage (Kubota et al., 2020), which is especially valuable in data-limited settings such as Makassar. Specifically, version 7 of GSMaP was used, which provides high-resolution satellite-based rainfall estimates. To capture the temporal dynamics of the January 2019 extreme flood event, hourly rainfall data for the period of 20–26 January 2019 were extracted using a custom script (Rohmat, 2024). This period was selected to represent conditions before, during, and after the peak flood event. The rainfall data were then used in HEC-HMS to simulate runoff and generate river discharge inputs for the flood modeling scenarios. The historical flood inundation map was obtained from BBWS Pompengan–Jeneberang. This map, which represents observed flood extents during the January 2019 event, was used as a benchmark to validate the model outputs. It is important to note that the information used to develop this map was gathered from eyewitness reports, based on observations of flood inundations in their respective areas.
Hydrologic and hydraulic modeling
This study employed an integrated hydrologic–hydrodynamic modeling approach to simulate the January 2019 flood event. The hydrologic simulation was carried out using HEC-HMS version 4.1.1 (USACE Hydrologic Engineering Center, 2024a). HEC-HMS is a widely used physically based model developed by the U.S. Army Corps of Engineers (USACE), it processes rainfall, evapotranspiration, and watershed characteristics such as area, slope, and land use to simulate runoff generation, infiltration (using the SCS Curve Number method), and hydrograph transformation (using the SCS Unit Hydrograph method). Flow routing is also incorporated to simulate water movement through channels and reservoirs, accounting for interflow and baseflow contributions (Table 2) (Abdelkebir et al., 2024; Belina et al., 2024; Guduru and Mohammed, 2024; Rohmat et al., 2025). HEC-HMS was used to model the hydrologic response of the Tallo, Jenelata, and Jeneberang Rivers. Special attention to the Bili-Bili Reservoir, which regulates outflows into the Jeneberang River. FABDEM terrain data were used to extract watershed parameters such as flow paths and time of concentration. GSMaP rainfall intensity, distribution, and duration were critical for simulating runoff generation. Technical information on the Bili-Bili Reservoir (Table 3) was also integrated to simulate its operation during the event. The resulting discharge hydrographs were then used as upstream inputs for hydraulic simulation using HEC-RAS.
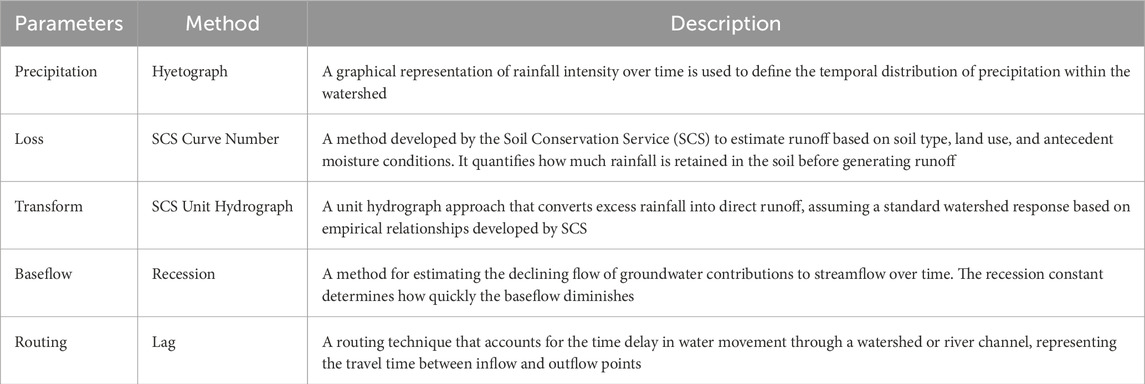
Table 2. Selected hydrological modeling set-up in HEC-HMS.
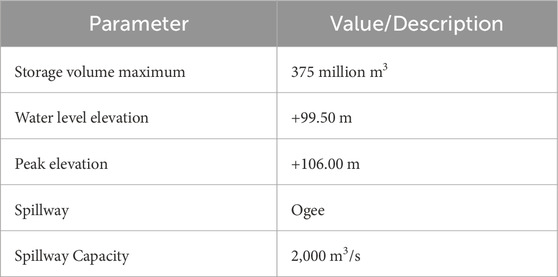
Table 3. Technical data of the Bili-Bili Reservoir set-up in HEC-HMS.
The hydraulic modeling was conducted using HEC-RAS version 6.4.1, which supports two-dimensional unsteady flow simulation (USACE Hydrologic Engineering Center, 2024b). HEC-RAS is widely applied in flood studies for its capabilities in modeling water surface profiles, sediment transport, and hydrodynamic processes (Pinos and Timbe, 2019; Garcia et al., 2020; Rohmat et al., 2022; Peker et al., 2024; Pratiwi et al., 2024; Zainal and Talib, 2024). In this study, the terrain model was developed by integrating FABDEM elevation data with OSM-B data. Since OSM-B lacks elevation attributes, average building heights were estimated using zonal statistics derived from FABDEM. A uniform height of 4 m was added to represent typical single-story structures. The combined dataset was resampled to a 1-m resolution to improve spatial accuracy in urban areas.
This modified terrain enabled HEC-RAS to simulate more realistic flood propagation by accounting for the presence of buildings, ensuring that flow is routed around structures rather than through them. Such detail is particularly important in densely built environments like Makassar, where urban features significantly influence water movement and inundation patterns. The resulting flood model geometry included 2D flow areas, break lines, terrain elevations, and unsteady flow boundary conditions derived from HEC-HMS outputs. Figure 3 illustrates the difference between the original FABDEM and the modified version incorporating OSM-B. Figure 3b highlights elevated features corresponding to buildings, capturing Makassar’s urban complexity and allowing for improved simulation of flood extents and depths.
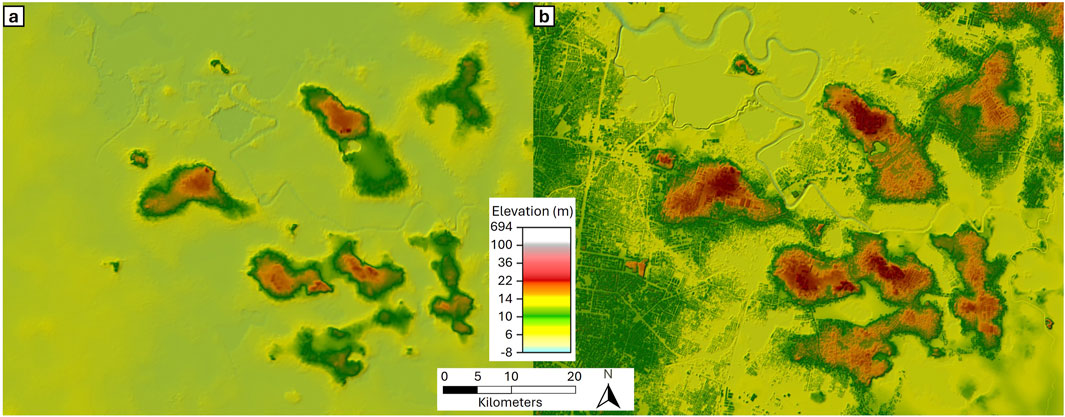
Figure 3. (a) Original FABDEM; (b) FABDEM modified with OSM-B and river cross-section.
The hydraulic simulation in this study was configured using HEC-RAS 2D using the Shallow Water Equations using the Explicit Leapfrog Method (SWE-ELM), which is optimized for computational speed without sacrificing solution stability or accuracy. Time steps were dynamically adjusted based on the Courant number to ensure numerical stability and convergence throughout the simulation domain. Flow resistance was represented using variable Manning’s roughness coefficients assigned according to land cover classifications, which were extracted from spatial land cover datasets. Infiltration losses were modeled using the SCS Curve Number method, consistent with the hydrologic modeling approach in HEC-HMS. The computational domain was discretized using a curvilinear mesh, which allows for better alignment with natural and urban terrain features, improving model realism in areas with complex topography. Accurate flood modeling requires comprehensive data on flood inundation parameters. The selected hydraulic model setup parameters used in HEC-RAS 2D are summarized in Table 4.
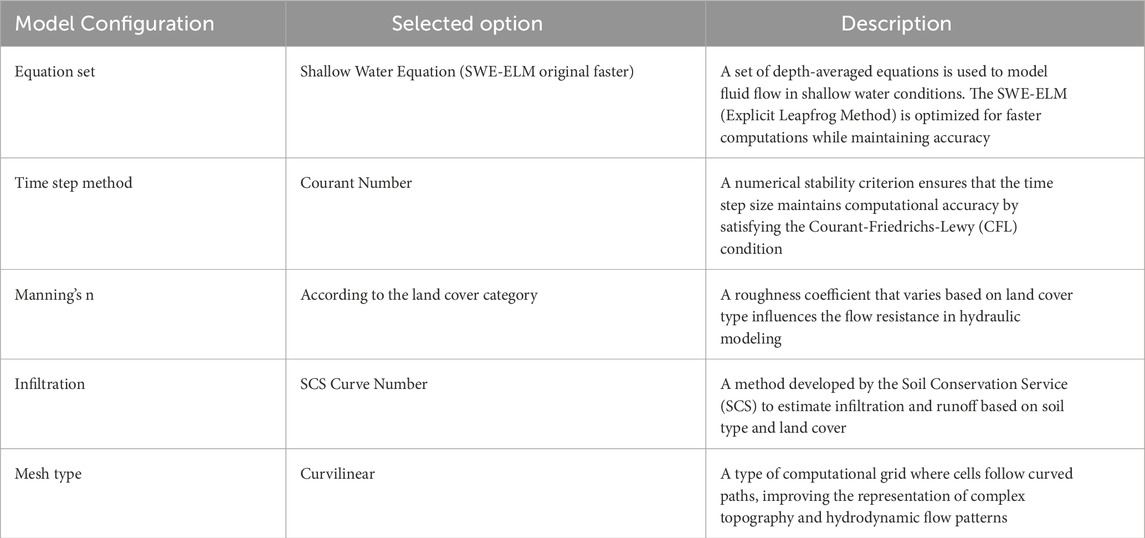
Table 4. Selected hydraulic modeling setup in HEC-RAS 2D.
Model validation and scenarios
Flood modeling in study area was conducted in two main stages: (1) simulation of the observed January 2019 flood, and (2) simulation of various discharge scenarios. The first stage simulated a 7-day period corresponding to the January 2019 flood, and the resulting inundation extents were validated using the PU flood inundation map. Validation aimed to ensure that the model represented observed flood conditions. Once the model was validated, it was used to simulate hypothetical discharge scenarios based on Q20. As outlined in Table 5, Q0 represents a condition in which no water flows in the river (dry conditions), while Q20 refers to flow conditions equivalent to a 20-year discharge event. The selection of Q20 follows PU guidelines, which suggest that rivers passing through provincial capitals should be designed for at least Q20 discharges. The rivers modeled in these scenarios include the Tallo River, the Jenelata River, and the Bili-Bili Reservoir outflow through the Jeneberang River. The purpose of these scenarios was to assess the relative contribution of each river system to urban flooding and to evaluate the effectiveness of the Bili-Bili Reservoir in mitigating flood impacts.
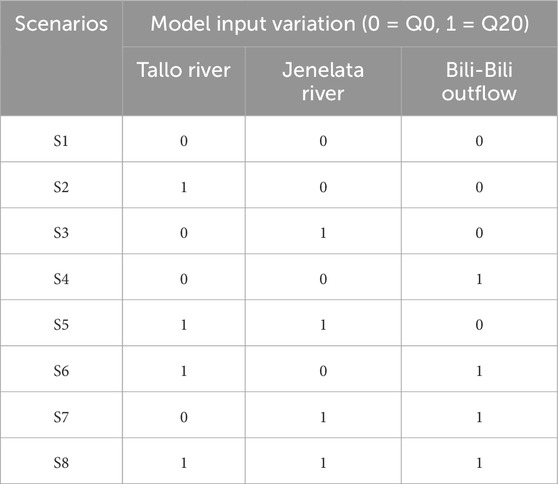
Table 5. Scenario of the Q20 flood model in Makassar City.
Results
Hydrologic modeling in the study area
Hydrologic simulations were conducted to convert rainfall data into river discharge, providing essential input for flood modeling. The primary outputs of this stage are the discharge hydrographs for the Tallo and Jenelata Rivers, as shown in Figure 4. These hydrographs illustrate the temporal variations in flow during the flood event and highlight the differing responses of each river system to extreme rainfall. The discharge results from HEC-HMS were subsequently used as input for the hydrodynamic simulations in HEC-RAS, enabling a detailed spatial analysis of flood propagation during the January 2019 event. To ensure the reliability of the model, the simulation results were compared with existing reports. Notably, the peak discharge simulated for the Jenelata River, which was approximately 1,000 m3/s, was consistent with the report from BBWS Pompengan–Jeneberang (Kompas.id, 2019), indicating that the HEC-HMS model was suitable for further hydraulic simulation. Following the validation of the hydrologic model, additional simulations were performed using a 20-year return period discharge (Q20) under multiple scenarios to evaluate the potential impact of future flood events of greater magnitude.
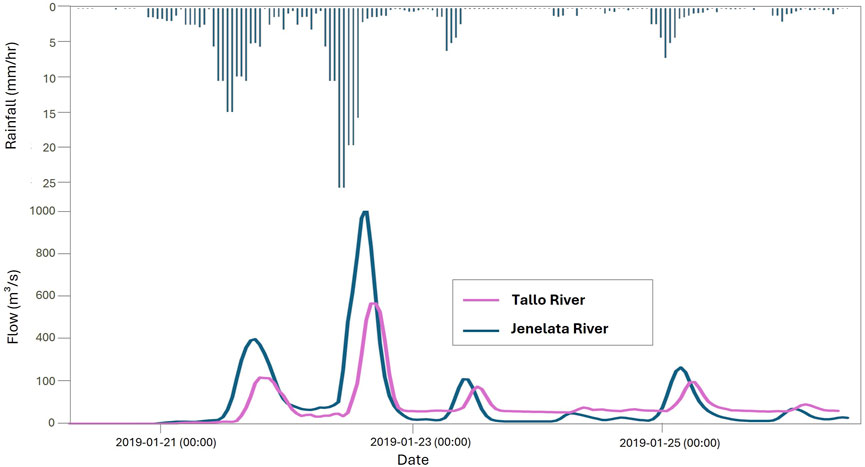
Figure 4. Hourly discharge simulation of the Tallo and Jenelata Rivers based on GSMaP v7 rainfall data over a 7-day period during the January 2019 flood event.
Hydraulic simulation: validation of inundation area of modeling results with historical flood inundation map
The hydraulic simulation was validated by comparing the modeled flood inundation extents with the official flood inundation map for the January 2019 event, provided by the PU. The historical map displays flooded areas using a red hatch (Figure 5), which serve as reference points based on eyewitness reports collected during the event. Locations without red squares were considered unaffected by flooding during that time. The simulation results from HEC-RAS are shown on the same map using shades of blue, where darker shades indicate greater flood depth (Figure 5). The validation showed a strong agreement between the simulation and reported flood extents in three sub-districts: Manggala, Tamalanrea, and Biringkanaya (labeled 1, 2, and 3), suggesting that the model accurately represented riverine flood mechanisms in these areas. However, discrepancies were observed in six other sub-districts, i.e., Panakkukang, Tallo, Rappocini, Tamalate, Mamajang, and Makassar (labeled 4–9), where the simulation did not fully match the reported inundation extents.
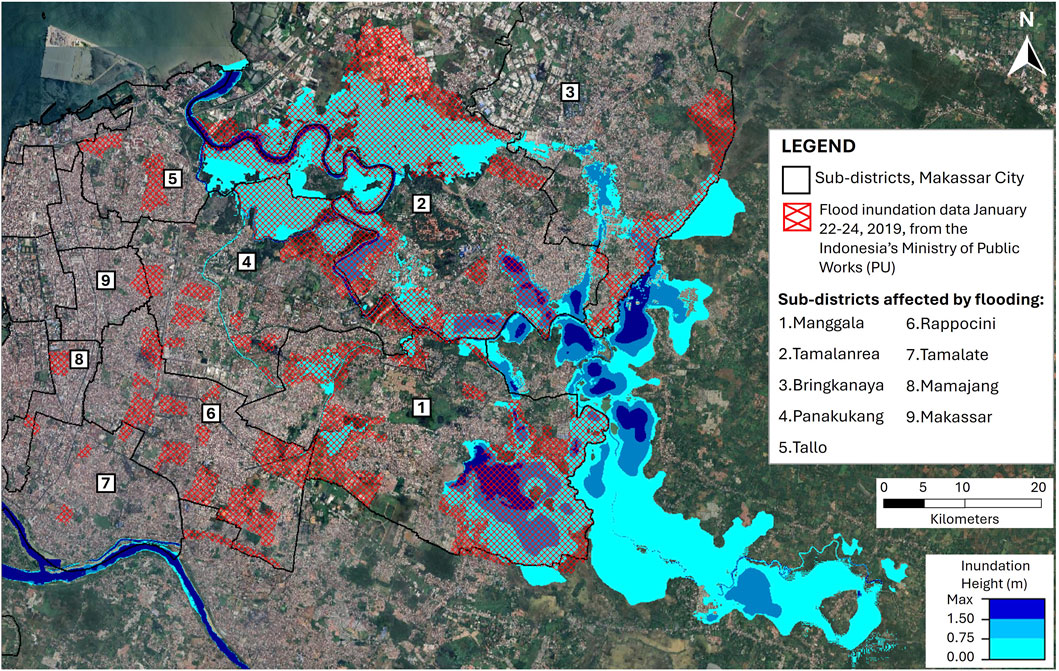
Figure 5. Validation of flood modeling in Makassar City using historical flood inundation data from January 22–24, 2019. The simulation period covers January 20–26, 2019.
The differences in the result point to the possibility that flooding in these locations may not have been caused primarily by river overflow, or there are discrepancies between the report and the actual flood, which comparably reported in the similar case study region (Rohmat et al., 2022). The spatial distribution of the discrepancies suggests that the observed flood events were likely driven by urban drainage system limitations rather than fluvial processes. Localized flooding in these areas could have resulted from high-intensity rainfall exceeding the capacity of the drainage network, leading to surface water accumulation independent of river discharge levels. This interpretation is supported by the non-correlation between observed flood locations and river-based inundation patterns. To confirm this hypothesis, a separate analysis incorporating urban drainage infrastructure would be required to assess system performance during extreme rainfall conditions.
Further discrepancies were identified in rural or non-urban zones, particularly agricultural areas such as rice fields, as shown by the yellow squares in Figure 6. While the model indicated inundation in these areas, the official flood map did not report any flooding. This inconsistency is likely due to underreporting, as rural flooding often lacks direct observation or formal documentation. Additionally, rice fields are routinely inundated during the planting season (October–March) (Susilowati, 2017), making it difficult to distinguish between agricultural water management and actual flood events. This highlights a common limitation in flood reporting systems: rural and agricultural areas are frequently overlooked, as official attention is typically focused on residential and urban zones. Consequently, the absence of recorded data from these areas can lead to discrepancies during model validation. This underscores the importance of improving ground-based flood observations and validation protocols, especially in rural landscapes, to ensure that modeling results accurately reflect real-world conditions.
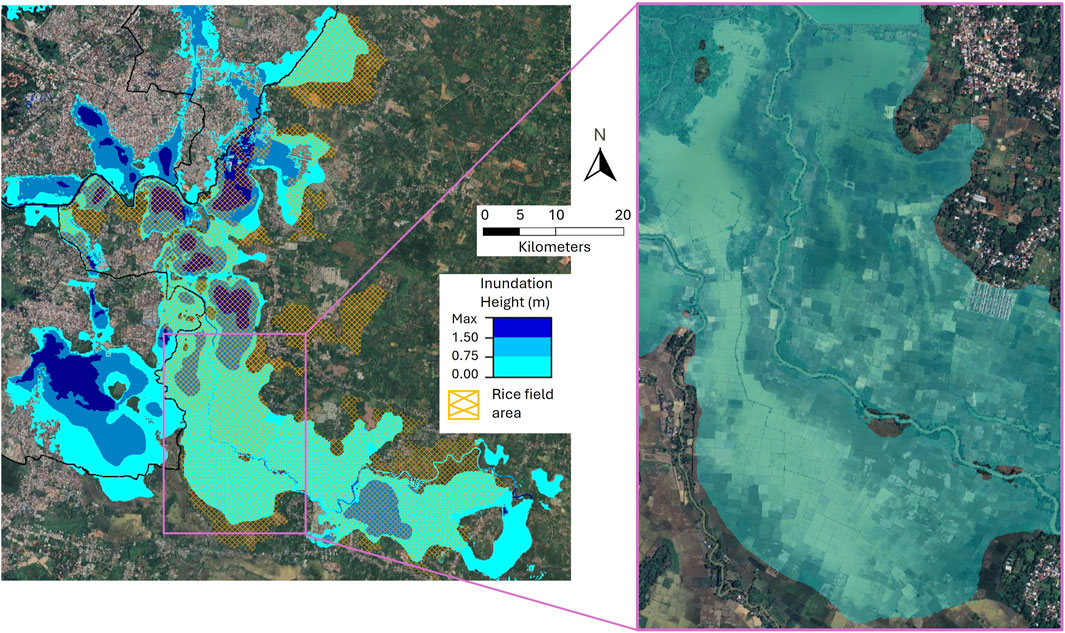
Figure 6. Discrepancy between flood model results and the official flood map in rice field areas, which are typically inundated during the planting season. The PU report only recorded flooding in urban areas, highlighting the need to include agricultural zones flood inundation report in observed flood data.
Identification of flooding main contributors and assessment of the Bili-Bili Reservoir effectiveness in mitigating floods in Makassar City
Following model validation, further simulations were conducted using modified discharge inputs to identify the primary contributors to flooding in Makassar City and assess the role of the Bili-Bili Reservoir in mitigating flood impacts. Eight scenarios were tested using a 20-year return period discharge (Q20), as detailed in Table 5. The simulation results are presented in Figure 7, showing a range of inundation depths from 0 to 1.5 m, with “max” areas indicating depths exceeding 1.5 m. Among the eight scenarios, four (Scenarios 2, 5, 6, and 8) resulted in substantial inundation. These scenarios all involved Q20 discharge from the Tallo River, strongly indicating that the Tallo River is the dominant contributor to flooding in Makassar City.
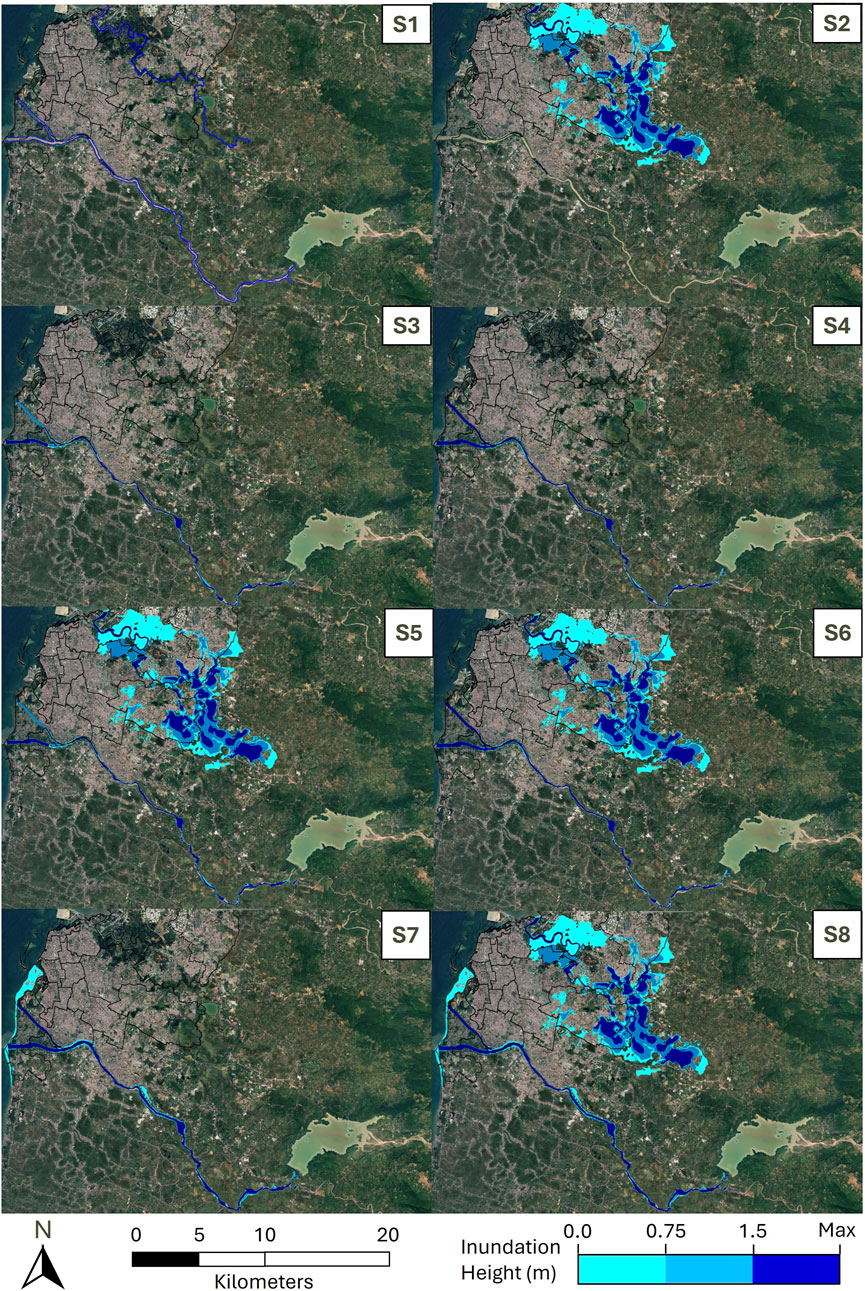
Figure 7. Flood modeling results for Makassar City under multiple Q20 discharge scenarios from the Tallo River, Jenelata River, and Bili-Bili outflow.
A comparative analysis of Scenarios 3 and 5 (no release from the Bili-Bili Reservoir) versus Scenarios 7 and 8 (with reservoir releases) highlights the reservoir’s influence on downstream flooding. While Scenarios 3 and 5 show relatively limited inundation, Scenarios 7 and 8 simulate wider flood extents, particularly in coastal and nearshore areas. These findings highlight that while the Bili-Bili Reservoir is operational, its current management may be suboptimal for effective flood control. Factors such as the timing and volume of releases or coordination with downstream channel capacity may be limiting its effectiveness.
Further insights can be drawn from scenarios where the Jenelata River was excluded (Scenarios 2, 4, and 6). Scenario 2, which excludes both the Jenelata River and Bili-Bili outflow, shows no inundation along the Jeneberang River, indicating the downstream area is primarily affected by reservoir and tributary flows. In contrast, Scenarios 4 and 6 include controlled releases from Bili-Bili and show inundation along the Jeneberang. With the addition of flow from the Jenelata River in Scenarios 7 and 8, flooding extends toward the coastal zones, confirming the cumulative effect of multiple sources on downstream flood severity.
The patterns observed in Scenarios 7 and 8 emphasize that although the Bili-Bili Reservoir plays a key regulatory role, it alone is insufficient under extreme conditions. This calls for reevaluation of reservoir operations and consideration of complementary measures such as upstream retention basins or diversion channels. Furthermore, the Jenelata River should be included in future flood mitigation planning due to its significant contribution during high rainfall events. Assessing the Jeneberang River’s capacity to accommodate combined flows is also critical, particularly for protecting low-lying coastal areas vulnerable to sedimentation, subsidence, and tidal influences (Isma et al., 2024; Nugroho et al., 2024).
Scenario 8 produced the most severe flooding, resulting from the combined effects of Tallo River discharge, Jenelata River flow, and Bili-Bili reservoir releases. This confirms the Tallo River as the most influential flood source in the city. Therefore, mitigation efforts should prioritize both the Tallo and Jenelata Rivers. Additionally, further research into urban drainage capacity is necessary to identify other flood mechanisms, particularly pluvial flooding caused by insufficient stormwater infrastructure (Liu et al., 2022; Zhang et al., 2024).
Discussion
Flooding in urban areas is often driven by a combination of interrelated factors, including intense rainfall (Rohmat et al., 2022), land cover change (Farid et al., 2022), sedimentation that reduces river capacity (Pirsouw et al., 2023), land subsidence (Putri et al., 2024), and the failure of flood control infrastructure (Yakti et al., 2018). Flood vulnerability can worsen due to flood vulnerability indicators such as variability in land use and land cover, distance to health facilities, and population density. Makassar City is particularly vulnerable due to the compounding effects of extreme rainfall, rapid urbanization, unplanned land use changes, inadequate drainage systems, and ineffective water management practices (Ismayanti and Aljurida, 2023). Among these, high-intensity rainfall frequently acts as the primary trigger, whether occurring directly over the city or in its upstream catchments (Rana and Routray, 2018). Hydraulic modeling results indicate that Manggala, Tamalanrea, and Biringkanaya sub-districts were the worst affected, with flooding primarily sourced from the Tallo River. This river has likely experienced a significant loss in capacity due to sediment accumulation. In addition, prior research (Rimba et al., 2023) highlights the role of an uncoordinated urban drainage system in worsening flooding in these areas (Hendra et al., 2024).
Meteorologically, daily rainfall exceeding 100 mm occurs more than once annually (Rahim et al., 2019). This extreme precipitation is often influenced by equatorial atmospheric phenomena, particularly Kelvin and Westward-moving Mixed Rossby–Gravity (WMRG) waves (Ferrett et al., 2019). A study by Latos et al. (2021) identified these waves as major contributors to the January 2019 flood event. The interaction of these equatorial waves with the topography of southwestern Sulawesi intensifies the rainfall, particularly in the Tallo River basin (Musliadi et al., 2021). The study found that 92% of floods and 76% of extreme rainfall events during the December–February period were preceded by positive low-level westerly wind anomalies linked to these atmospheric disturbances. In terms of resilience, Thoban and Hizbaron (2020) classified Makassar as having a moderate level of urban resilience, with significant variation across districts. Physical resilience is affected by factors such as building density and the availability of green spaces. Areas with high-density development and limited open space tend to exhibit lower resilience. Combined with outdated drainage systems, blocked drains, and land subsidence, these factors intensify flood risks in the city (Hassan et al., 2022; Rohmat et al., 2022).
Sedimentation is also a key concern, as it reduces the storage capacity and operational effectiveness of rivers and reservoirs (Perera et al., 2022; Hamidifar et al., 2024; Nugroho et al., 2025; Pratama et al., 2025). The Bili-Bili Reservoir, constructed in 1999 to control flooding from the Jeneberang River, has a design capacity of 375 million m3 and an effective capacity of 346 million m3. It receives inflows from a 384.40 km2 catchment area. However, extensive erosion in the upstream reaches of the Jeneberang River has led to severe sedimentation, with an estimated sedimentation rate of 813.1 tons/ha/year, which far exceeds the tolerable threshold of 22.9 tons/ha/year (Lukman et al., 2020; Aisyah et al., 2022). By 2011, approximately 84.81 million m3 of sediment had accumulated in the reservoir, significantly reducing its effective capacity (Achsan et al., 2015). During the January 2019 flood, the Bili-Bili Reservoir reached a water level of 101.87 m, just below its design maximum of 103 m. To prevent overtopping and potential dam failure, the reservoir gates were opened, releasing large volumes of water downstream. While necessary, this release contributed to flooding in downstream areas, particularly in Makassar City. The situation was further worsened by high inflows from the Jenelata River (reaching 1,200 m3/s), which joins the Jeneberang River downstream of the dam.
The findings emphasize the need for further investigation into the capacity of the rivers and their ability to accommodate extreme discharge events. This includes evaluating cross-sectional profiles, sedimentation levels, and flow conveyance efficiency, as well as assessing the effectiveness of existing flood control structures along these rivers. With climate variability expected to increase the frequency and intensity of extreme rainfall, such assessments are critical to ensuring that the river networks remain resilient and capable of mitigating flood risks in densely populated urban areas like Makassar City. Makassar’s flood resilience ultimately depends on the combined strength of its physical, institutional, social, and environmental systems. Institutional resilience, in particular, centers on the availability of flood hazard maps and functional Early Warning Systems (EWS), which are critical for enhancing community preparedness and minimizing disaster impacts (Asri et al., 2023). Expanding and improving Flood Early Warning Systems (FEWS) across the region should be a top priority to ensure timely evacuation and effective response, especially for vulnerable populations.
The limitation of this research lies in its focus solely on riverine-based flooding, which does not sufficiently capture the complexity of the urban drainage system that contributes to flooding. Future research should focus on additional sources of flooding that were not included in the current study, such as pluvial flooding due to urban drainage failure and contributions from other unmodeled rivers. This modeling can be achieved by integrating stormwater drainage models such as Storm Water Management Model (SWMM), which allows a detailed representation of rainfall events and their impact on the drainage systems (Yang et al., 2022; Zhang et al., 2024; USEPA, 2025). This approach can provide a comprehensive assessment of the pluvial flooding contribution. Combining this with the HEC-RAS domain can yield a more holistic understanding of both fluvial and pluvial flood dynamics.
The modeling results reveal discrepancies between the modeling results and the flood maps in certain areas. The modeling validation process based on the initial quantitative metrics of suitability evaluation should have been taken into account, rather than just from a visual point of view. However, due to the limited data, such as inundation depth data, not being available, the application of metrics such as Root Mean Square Error (RMSE) was not feasible.
Moreover, while FABDEM and OSM-B provide valuable terrain and building data, their current resolution may not capture micro-drainage features such as small roadside gutters or underground culverts. Future work could benefit from integrating Light Detection and Ranging (LiDAR) or higher-resolution Unmanned Aerial Vehicles (UAV)-based DEMs to delineate finer drainage pathways that influence surface runoff patterns (Esin et al., 2021; Li et al., 2021). It is also essential to assess the feasibility of constructing additional upstream reservoirs in the Tallo and Jenelata River catchments to improve water retention during extreme rainfall events. A deeper understanding of watershed-scale hydrological processes will be crucial for designing effective, long-term flood mitigation strategies in Makassar. In conclusion, a comprehensive approach that combines infrastructure improvements, urban planning, hydrological modeling, and atmospheric analysis is needed to build long-term flood resilience. Integrating physical infrastructure with an improved understanding of local hydrological and climatic conditions will be vital to protecting Makassar City from future flood disasters and advancing sustainable urban development in the region (Kardhana et al., 2024).
Conclusion
This study investigated the primary contributors to the extreme flood event in Makassar City in January 2019 and assessed the effectiveness of the Bili-Bili Reservoir in mitigating flood impacts through an integrated hydrologic–hydrodynamic modeling approach. Hydrological simulations were conducted using HEC-HMS, with outputs used as inputs for hydraulic modeling in HEC-RAS 2D. The model was first validated using historical flood inundation maps provided by the Ministry of Public Works. Once validated, the model was applied to simulate eight flood scenarios using a 20-year return period (Q20) discharge for the Tallo River, Jenelata River, and Bili-Bili outflow.
The simulation results showed strong agreement with observed flood extents in three sub-districts, i.e., Manggala, Tamalanrea, and Biringkanaya. In contrast, discrepancies in six other sub-districts, i.e., Panakkukang, Tallo, Rappocini, Tamalate, Mamajang, and Makassar, suggest that flooding in these areas may have been driven by other mechanisms, such as pluvial flooding due to inadequate drainage. In agricultural areas, such as rice fields, the absence of recorded inundations in official maps is likely due to the seasonal nature of agricultural flooding, which is often unreported unless it causes damage. These findings highlight challenges in flood data collection and the need for improved ground-based observation, especially in non-urban zones.
Across all scenarios, modeled flood depths ranged from 0 to 1.5 m, with some areas exceeding 1.5 m. The most severe inundation was observed in locations influenced by discharge from the Tallo River, reinforcing its role as a major contributor to flooding in Makassar City. The Bili-Bili Reservoir demonstrated effectiveness in reducing flooding along the Jeneberang River under normal operations. However, when combined with additional inflow from the Jenelata River, downstream flooding intensified, particularly in low-lying coastal areas, suggesting that current reservoir operations may require further optimization to address compound flood risks.
The results underscore the complex and interconnected nature of flood dynamics in Makassar City. Future flood mitigation strategies should prioritize the Tallo and Jenelata Rivers, while also investigating other potential flood sources, including urban drainage performance and unmodeled tributaries. Further studies should explore sedimentation processes that reduce the conveyance and storage capacity of rivers and reservoirs and assess the feasibility of constructing additional upstream reservoirs in the Tallo and Jenelata catchments to support the Bili-Bili Reservoir in attenuating peak flows. Furthermore, prediction-based models will provide better guidance for the future by integrating climate projections or a real-time forecasting framework (e.g., data from the European Centre for Medium-Range Weather Forecasts (ECMWF). This comprehensive understanding of flood causation and mitigation in Makassar City provides a foundation for more targeted, data-driven decision-making among policymakers, urban planners, and disaster risk management authorities. Strengthening these efforts will be crucial for enhancing flood resilience and ensuring sustainable urban development in the years to come.
Data availability statement
The datasets presented in this study are available at https://doi.org/10.5281/zenodo.15208535
Author contributions
SW: Writing – original draft, Formal Analysis, Visualization. FP: Writing – original draft, Software, Data curation, Visualization. NA: Supervision, Writing – review and editing, Resources, Project administration, Funding acquisition. PW: Writing – original draft, Software, Data curation. WW: Writing – review and editing. FR: Formal Analysis, Methodology, Project administration, Investigation, Validation, Resources, Writing – review and editing, Conceptualization.
Funding
The author(s) declare that financial support was received for the research and/or publication of this article. The Faculty of Civil and Environmental Engineering, Institut Teknologi Bandung (FTSL ITB), supported the APC for this research through its P2MI program.
Acknowledgments
We acknowledge BBWS Pompengan-Jeneberang and Pusat Monitoring Bendungan (Dam Monitoring Center) of the Ministry of Public Works of the Republic of Indonesia for their correspondence.
Conflict of interest
The authors declare that the research was conducted in the absence of any commercial or financial relationships that could be construed as a potential conflict of interest.
Generative AI statement
The author(s) declare that no Generative AI was used in the creation of this manuscript.
Publisher’s note
All claims expressed in this article are solely those of the authors and do not necessarily represent those of their affiliated organizations, or those of the publisher, the editors and the reviewers. Any product that may be evaluated in this article, or claim that may be made by its manufacturer, is not guaranteed or endorsed by the publisher.
References
Abdelkebir, B., Mokhtari, E., and Engel, B. (2024). Assessment of land use and land cover changes on hydrological responses in the Wadi Soummam watershed, Algeria using the HEC–HMS model. Water Pract. Technol. 19, 3555–3577. doi:10.2166/wpt.2024.224
Achsan, A., Bisri, M., and Suhartanto, E. (2015). Analisis Kecenderungan Sedimentasi Waduk bili-bili dalam Upaya Keberlanjutan Usia Guna Waduk. Jurnal Teknik Pengairan. J. Water Resour. Eng. 6, 30–36. Available online at: https://jurnalpengairan.ub.ac.id/index.php/jtp/article/view/224 (Accessed April 2, 2025).
Aisyah, B. N., Baskoro, D. P. T., and Murtilaksono, K. (2022). Pendugaan Erosi Tanah dan Perencanaan Tutupan Lahan Hulu DAS Jeneberang, Sulawesi Selatan. J. Ilmu Pertan. Indones. 27, 302–310. doi:10.18343/jipi.27.2.302
Asri, A. A. O., Rohmat, F. I. W., Kardhana, H., Kuntoro, A. A., and Farid, M. (2023). Analyzing lead time for flood early warning system in the upstream Citarum River. E3S Web Conf. 467, 02004. doi:10.1051/e3sconf/202346702004
Atanga, R. A., and Tankpa, V. (2021). Climate change, flood disaster risk and food security nexus in northern Ghana. Front. Sustain Food Syst. 5, 706721. doi:10.3389/fsufs.2021.706721
Belina, Y., Kebede, A., and Masinde, M. (2024). Comparative analysis of HEC-HMS and machine learning models for rainfall-runoff prediction in the upper Baro watershed, Ethiopia. Hydrology Res. 55, 873–889. doi:10.2166/nh.2024.032
Birkmann, J., Jamshed, A., McMillan, J. M., Feldmeyer, D., Totin, E., Solecki, W., et al. (2022). Understanding human vulnerability to climate change: a global perspective on index validation for adaptation planning. Sci. Total Environ. 803, 150065. doi:10.1016/j.scitotenv.2021.150065
BNPB (2025). Data informasi Bencana Indonesia (DIBI). Available online at: https://dibi.bnpb.go.id/statistik_menurut_bencana (Accessed January 21, 2025).
Cvetković, V. M., Renner, R., Aleksova, B., and Lukić, T. (2024). Geospatial and temporal patterns of natural and man-made (technological) disasters (1900–2024): insights from different socio-economic and demographic perspectives. Appl. Sci. 14, 8129. doi:10.3390/app14188129
Dhanio, L., Mizuyama, T., Kosugi, K., and Rampisela, A. (2008). Changes in sediment discharge after the collapse of Mt. Bawakaraeng in south Sulawesi, Indonesia. J. Jpn. Soc. Eros. Control Eng. 61, 32–38. doi:10.11475/sabo.61.4_32
Djamaluddin, I., Indrayani, P., and Caronge, M. A. (2020). A GIS analysis approach for flood vulnerability and risk assessment index models at sub-district scale. IOP Conf. Ser. Earth Environ. Sci. 419, 012019. doi:10.1088/1755-1315/419/1/012019
Doyle, J. D., Reynolds, C. A., Flatau, M., and Latos, B. (2023). Sensitivity and predictability of an extreme rainfall event in Sulawesi, Indonesia. SOLA 19A, 17–26. doi:10.2151/sola.19A-003
Esin, A. İ., Akgul, M., Akay, A. O., and Yurtseven, H. (2021). Comparison of LiDAR-based morphometric analysis of a drainage basin with results obtained from UAV, TOPO, ASTER and SRTM-based DEMs. Arabian J. Geosciences 14, 340–15. doi:10.1007/s12517-021-06705-3
FAO (2023). Harmonized world soil database v2.0. Available online at: https://www.fao.org/soils-portal/data-hub/soil-maps-and-databases/harmonized-world-soil-database-v20/en/(Accessed April 14, 2025).
Farid, M., Pratama, M. I., Kuntoro, A. A., Adityawan, M. B., Rohmat, F. I. W., and Moe, I. R. (2022). Flood prediction due to land cover change in the ciliwung River Basin. Int. J. Technol. 13, 356. doi:10.14716/ijtech.v13i2.4662
Ferrett, S., Yang, G. Y., Woolnough, S. J., Methven, J., Hodges, K., and Holloway, C. E. (2019). Linking extreme precipitation in Southeast Asia to equatorial waves. Q. J. R. Meteorological Soc. 146, 665–684. doi:10.1002/qj.3699
Garcia, M., Juan, A., and Bedient, P. (2020). Integrating reservoir operations and flood modeling with HEC-RAS 2D. Water (Basel) 12, 2259. doi:10.3390/w12082259
Guduru, J. U., and Mohammed, A. S. (2024). Hydrological modeling using HEC-HMS model, case of tikur wuha River Basin, rift valley River Basin, Ethiopia. Environ. Challenges 17, 101017. doi:10.1016/j.envc.2024.101017
Haklay, M., and Weber, P. (2008). OpenStreet map: user-generated street maps. IEEE Pervasive Comput. 7, 12–18. doi:10.1109/MPRV.2008.80
Hamidifar, H., Nones, M., and Rowinski, P. M. (2024). Flood modeling and fluvial dynamics: a scoping review on the role of sediment transport. Earth Sci. Rev. 253, 104775. doi:10.1016/j.earscirev.2024.104775
Hassan, B. T., Yassine, M., and Amin, D. (2022). Comparison of urbanization, climate change, and drainage design impacts on urban flashfloods in an arid region: case study, new Cairo, Egypt. Water (Basel) 14, 2430. doi:10.3390/w14152430
Hawker, L., Uhe, P., Paulo, L., Sosa, J., Savage, J., Sampson, C., et al. (2022). A 30 m global map of elevation with forests and buildings removed. Environ. Res. Lett. 17, 024016. doi:10.1088/1748-9326/ac4d4f
Hendra, P., Ilham, A., and Intan, A. (2024). “Flood analysis based on the influence of geomorphology and rainfall patterns in the Tallo River flow area, makassar city, South Sulawesi province, Indonesia. 45th Asian Conference on Remote Sensing, ACRS 2024. Colombo, Sri Lanka: Asian Conference on Remote Sensing (ACRS 2024).
Hermawan, E., Lubis, S. W., Harjana, T., Purwaningsih, A., Ridho, A., Andarini, D. F., et al. (2022). Large-scale meteorological drivers of the extreme precipitation event and devastating floods of early-february 2021 in semarang, central java, Indonesia. Atmos. (Basel) 13 1092. doi:10.3390/atmos13071092
Indrayani, P., Djamaluddin, I., and Cai, Y. (2023). Employing a local framework and GIS to evaluate the flood risk index maps of Makassar City, Indonesia. Arabian J. Geosciences 16, 568–25. doi:10.1007/s12517-023-11664-y
Isma, F., Kusuma, M. S. B., Nugroho, E. O., and Adityawan, M. B. (2024). Flood hazard assessment in kuala langsa village, langsa city, aceh province-Indonesia. Case Stud. Chem. Environ. Eng. 10, 100861. doi:10.1016/j.cscee.2024.100861
Ismayanti, I., and Aljurida, A. M. A. (2023). Urgency in urban flood disaster mitigation: response and policy initiation by makassar city government. J. Gov. Local Polit. (JGLP) 5, 155–163. doi:10.47650/jglp.v5i2.954
Jodhani, K. H., Gupta, N., Dadia, S., Patel, H., Patel, D., Jamjareegulgarn, P., et al. (2023). Sustainable groundwater management through water qualityindex and geochemical insights in Valsad India. Sci Rep 15, 1–15. doi:10.1038/s41598-025-92053-1
Kardhana, H., Lihawa, A. W. I., Rohmat, F. I. W., Wulandari, S., Harjupa, W., Adiprawita, W., et al. (2024). Water balance analysis in the majalaya watershed: two-step calibration and application of the SWAT+ model for low-flow conditions. Water (Basel) 16, 3498. doi:10.3390/w16233498
Kompas.id (2019). Memahami penyebab banjir bili-bili dan makassar. Available online at: https://www.kompas.id/baca/utama/2019/03/02/memahami-penyebab-banjir-bili-bili-dan-makassar/?status=sukses_login&login=1740622873111&open_from=header_button&loc=header_button (Accessed March 3, 2025).
Kubota, T., Aonashi, K., Ushio, T., Shige, S., Takayabu, Y. N., Kachi, M., et al. (2020). Global satellite mapping of precipitation (GSMaP) products in the GPM era. Adv. Glob. Change Res. 67, 355–373. doi:10.1007/978-3-030-24568-9_20
Latos, B., Lefort, T., Flatau, M. K., Flatau, P. J., Permana, D. S., Baranowski, D. B., et al. (2021). Equatorial waves triggering extreme rainfall and floods in southwest Sulawesi, Indonesia. Mon. Weather Rev. 149, 1381–1401. doi:10.1175/MWR-D-20-0262.1
Li, B., Hou, J., Li, D., Yang, D., Han, H., Bi, X., et al. (2021). Application of LiDAR UAV for high-resolution flood modelling. Water Resour. Manag. 35, 1433–1447. doi:10.1007/s11269-021-02783-w
Liu, J., Cao, Z., Li, X., Wang, W., Hou, J., Li, D., et al. (2022). Modelling urban flooding integrated with flow and sediment transport in drainage networks. Sci. Total Environ. 850, 158027. doi:10.1016/j.scitotenv.2022.158027
Lukman, M., Tanan, B., and Saing, Z. (2020). Transport sediment analysis using bed-load: case study bilibili reservoir. Civ. Eng. Archit. 8, 456–465. doi:10.13189/cea.2020.080408
Manzoor, Z., Ehsan, M., Khan, M. B., Manzoor, A., Akhter, M. M., Sohail, M. T., et al. (2022). Floods and flood management and its socio-economic impact on Pakistan: a review of the empirical literature. Front. Environ. Sci. 10, 1021862. doi:10.3389/fenvs.2022.1021862
Mursalin, M., and Natsir, N. (2024). Koordinasi Lintas Sektor dalam Pengelolaan Daerah Aliran Sungai (DAS) Tallo di Makassar. Student Sci. Creativity J. 2, 172–181. doi:10.55606/SSCJ-AMIK.V2I5.4067
Musliadi, M., Chaerul, M., and Gusty, S. (2021). Study on flood simulation of Tallo watershed, makassar city, South Sulawesi province. J. Phys. Conf. Ser. 1899, 012063. doi:10.1088/1742-6596/1899/1/012063
Nugroho, E. O., Pranatan, A. Y., Soekarno, I., Moerwanto, A. S., Wulandari, S., Nurkhaerani, F., et al. (2024). The effect of discharge, sediment transport, tidal and land subsidence in The River flood risk management: case study of sayung river. J. Phys. Conf. Ser. 2916, 012017. doi:10.1088/1742-6596/2916/1/012017
Nugroho, J., Pirsouw, M. N., Wulandari, S., Soekarno, I., Kuntoro, A. A., Aisyah, S., et al. (2025). Analysis of sediment characteristics and flow dynamics after normalization of the citarum-majalaya River in Indonesia. GEOMATE J. 28, 52–60. doi:10.21660/2025.126.4764
Nurdin, P. F., Kubota, T., and Soma, A. S. (2019). Investigation of flood and landslide in the Jeneberang catchment area, Indonesia in 2019. Int. J. Eros. Control Eng. 12, 13–18. doi:10.13101/ijece.12.13
OpenStreetMap (2025). OSM buildings. Available online at: https://osmbuildings.org/(Accessed April 14, 2025).
Paski, J. A. I., Alfahmi, F., Permana, D. S., and Makmur, E. E. S. (2020). Reconstruction of extreme rainfall event on september 19-20, 2017, using a weather radar in bengkulu of sumatra island. Sci. World J. 2020, 1–6. doi:10.1155/2020/1639054
Patanduk, J. (2013). A study on design-flood discharge of tello River in makassar-Indonesia. Int. J. Sci. Eng. Investigations 2. Available online at: www.IJSEI.com.
Peker, İ. B., Gülbaz, S., Demir, V., Orhan, O., and Beden, N. (2024). Integration of HEC-RAS and HEC-HMS with GIS in flood modeling and flood hazard mapping. Sustainability 16, 1226. doi:10.3390/su16031226
Perera, D., Williams, S., and Smakhtin, V. (2022). Present and future losses of storage in large reservoirs due to sedimentation: a country-wise global assessment. Sustainability 15, 219. doi:10.3390/su15010219
Pinos, J., and Timbe, L. (2019). Performance assessment of two-dimensional hydraulic models for generation of flood inundation maps in mountain river basins. Water Sci. Eng. 12, 11–18. doi:10.1016/j.wse.2019.03.001
Pirsouw, M. N., Nugroho, J., Wira Rohmat, F. I., Burnama, N. S., Kuntoro, A. A., Farid, M., et al. (2023). “Study of sediment transport distribution pattern after normalization in the Majalaya Area, Citarum River,” in 9th International Conference on Climate Change, ICCC 2023 (Surakarta, Indonesia: E3S Web of Conferences, EDP Sciences). doi:10.1051/e3sconf/202346701028
Pratama, F., Wulandari, S., and Rohmat, F. I. W. (2025). Modeling sediment accumulation in Pare Reservoir using HEC-RAS 2D: assessing storage capacity over a 10-year period. Results Eng. 25, 104333. doi:10.1016/j.rineng.2025.104333
Pratiwi, A. P., Rohmat, F. I. W., Nugroho, E. O., Farid, M., and Kusuma, M. S. B. (2024). Flood hazard comparison based on geomorphic flood index and hydraulic HEC-RAS (Case study in Ciliwung Watershed, Jakarta). IOP Conf. Ser. Earth Environ. Sci. 1314, 012084. doi:10.1088/1755-1315/1314/1/012084
Purwaningsih, A., Lubis, S. W., Hermawan, E., Andarini, D. F., Harjana, T., Ratri, D. N., et al. (2022). Moisture origin and transport for extreme precipitation over Indonesia’s new capital city, nusantara in August 2021. Atmos. (Basel) 13, 1391. doi:10.3390/ATMOS13091391
Putri, S. I. P., Syakira, H., Nugroho, E. O., Layaliya, H. N., Soeharno, A. W. H., Kusuma, M. S. B., et al. (2024). An overview of flood risk components: the Land subsidence case of Pekalongan City. E3S Web Conf. 513, 01001. doi:10.1051/e3sconf/202451301001
Rahim, A., Bakri, B., Mutholib, A., and Haerunnisa, A. (2019). Characteristic of extreme rainfall in makassar, province of South Sulawesi. J. Phys. Conf. Ser. 1341. 092017. doi:10.1088/1742-6596/1341/9/092017
Rana, I. A., and Routray, J. K. (2018). Multidimensional model for vulnerability assessment of urban flooding: an empirical study in Pakistan. Int. J. Disaster Risk Sci. 9, 359–375. doi:10.1007/s13753-018-0179-4
Raphela, T. D., and Matsididi, M. (2024). The causes and impacts of flood risks in South Africa. Front. Water 6, 1524533. doi:10.3389/frwa.2024.1524533
Raza, M., Fatima, A., Habiba, U., and Shah, H. H. (2023). Public health implications of severe floods in Pakistan: assessing the devastating impact on health and the economy. Front. Environ. Sci. 11, 1091998. doi:10.3389/fenvs.2023.1091998
Rentschler, J., and Salhab, M. (2020). People in harm’s way flood exposure and poverty in 189 countries. Washington, D.C. Available online at: http://documents.worldbank.org/curated/en/669141603288540994/People-in-Harms-Way-Flood-Exposure-and-Poverty-in-189-Countries (Accessed February 3, 2025).
Rentschler, J., Salhab, M., and Jafino, B. A. (2022). Flood exposure and poverty in 188 countries. Nat. Commun. 13 (1), 3527–11. doi:10.1038/s41467-022-30727-4
Rimba, A. B., Arumansawang, A., Utama, I. P. W., Chapagain, S. K., Bunga, M. N., Mohan, G., et al. (2023). Cloud-based machine learning for flood policy recommendations in makassar city, Indonesia. Water (Basel) 15, 3783. doi:10.3390/w15213783
Rohmat, F. I. W. (2024). Lightweight and parallelized R-based GSMaP precipitation data processor. Available online at: https://github.com/faizalrohmat/GSMaP_processor (Accessed January 30, 2025).
Rohmat, F. I. W., Harjupa, W., Rohmat, D., and Rohmat, F. I. W. (2023). The impacts of global atmospheric circulations on the water supply in select watersheds in the Indonesian Maritime Continent using SPI. Heliyon 9, e15604. doi:10.1016/j.heliyon.2023.e15604
Rohmat, F. I. W., Löhr, A. J., Pratama, F., Burnama, N. S., and Kuntoro, A. A. (2025). Quantifying time-dependent flood resilience index in a densely populated urban environment in Manado, Indonesia. Int. J. Disaster Risk Reduct. 116, 105112. doi:10.1016/j.ijdrr.2024.105112
Rohmat, F. I. W., Sa’adi, Z., Stamataki, I., Kuntoro, A. A., Farid, M., and Suwarman, R. (2022). Flood modeling and baseline study in urban and high population environment: a case study of Majalaya, Indonesia. Urban Clim. 46, 101332. doi:10.1016/j.uclim.2022.101332
Senior, N. V., Matthews, A. J., Webber, B. G. M., Webster, S., Jones, R. W., Permana, D. S., et al. (2023). Extreme precipitation at Padang, Sumatra triggered by convectively coupled Kelvin waves. Q. J. R. Meteorological Soc. 149, 2281–2300. doi:10.1002/qj.4506
Sudarman, G. G., Hadi, T. W., Ningsih, N. S., Sopaheluwakan, A., Syahputra, M. R., and Marpaung, F. (2024). Nonstationary changes in annual rainfall over Indonesia’s Maritime continent. Adv. Meteorology 2024, 1–11. doi:10.1155/2024/9392844
Susilowati, S. H. (2017). Perdagangan Antarpulau Beras di Provinsi Sulawesi Selatan. Anal. Kebijak. Pertan. 15, 19–41. doi:10.21082/akp.v15n1.2017.19-41
Thoban, M. I., and Hizbaron, D. R. (2020). Urban resilience to floods in parts of Makassar, Indonesia. E3S Web Conf. 200, 01007. doi:10.1051/e3sconf/202020001007
Uhe, P., Hawker, L., Paulo, L., Sosa, J., Sampson, C., and Neal, J. (2022). FABDEM - a 30m global map of elevation with forests and buildings removed. EGU general assembly 2022. EGU22-8994. doi:10.5194/egusphere-egu22-8994
UNDRR (2018). Economic losses, poverty and disasters: 1998-2017 | UNDRR. Available online at: https://www.undrr.org/publication/economic-losses-poverty-disasters-1998-2017 (Accessed March 14, 2025).
UNDRR (2021). 2020 global natural disaster assessment report. Available online at: https://www.preventionweb.net/publication/2020-global-natural-disaster-assessment-report (Accessed March 14, 2025).
UNDRR (2022). Global assessment report on disaster risk reduction 2022: our world at risk: transforming governance for a resilient future. Available online at: https://www.undrr.org/gar/gar2022-our-world-risk-gar (Accessed March 14, 2025).
USACE Hydrologic Engineering Center (2024a). HEC-HMS user’s manual. Available online at: https://www.hec.usace.army.mil/confluence/hmsdocs/hmsum/latest (Accessed November 10, 2024).
USACE Hydrologic Engineering Center (2024b). HEC-RAS user’s manual. Available online at: https://www.hec.usace.army.mil/confluence/rasdocs/rasum/latest (Accessed February 3, 2025).
USEPA (2025). Storm water management model (SWMM). Available online at: https://www.epa.gov/water-research/storm-water-management-model-swmm (Accessed May 15, 2025).
Vyas, U., Patel, D., Vakharia, V., and Jodhani, K. H. (2024). Integrating GEE and IWQI for sustainable irrigation: a geospatial water quality assessment. Groundw. Sustain Dev. 27, 101332. doi:10.1016/j.gsd.2024.101332
Wahid, S. K. M., Malalassam, D., and Barkey, R. A.Baharuddin (2021). Impact of human and environmental interactions on flooding incident in the Jeneberang River South Sulawesi. IOP Conf. Ser. Earth Environ. Sci. 886, 012105. doi:10.1088/1755-1315/886/1/012105
Widodo, T. N., Zubair, H., and Padjung, R. (2021). Land use change study and the increased risk of floods disaster in Jeneberang watershed at Gowa Regency, South Sulawesi, Indonesia. IOP Conf. Ser. Earth Environ. Sci. 824, 012045. doi:10.1088/1755-1315/824/1/012045
World Bank (2020). 1.47 billion people face flood risk worldwide: for over a third, it could be devastating. Available online at: https://blogs.worldbank.org/en/climatechange/147-billion-people-face-flood-risk-worldwide-over-third-it-could-be-devastating (Accessed January 21, 2025).
World Population Review (2025). Total population by country 2025. Available online at: https://worldpopulationreview.com/countries (Accessed March 14, 2025).
Yakti, B. P., Adityawan, M. B., Farid, M., Suryadi, Y., Nugroho, J., and Hadihardaja, I. K. (2018). 2D modeling of flood propagation due to the failure of way ela natural dam. MATEC Web Conf. 147, 03009. doi:10.1051/matecconf/201814703009
Yang, Q., Ma, Z., and Zhang, S. (2022). Urban pluvial flood modeling by coupling raster-based two-dimensional hydrodynamic model and SWMM. Water 14, 1760–14. doi:10.3390/w14111760
Zainal, N. N., and Talib, S. H. A. (2024). Review paper on applications of the HEC-RAS model for flooding, agriculture, and water quality simulation. Water Pract. Technol. 19, 2883–2900. doi:10.2166/wpt.2024.173
Keywords: flood modeling, hydrologic simulation, hydrodynamic simulation, HEC-HMS, HEC-RAS 2D, Makassar City, riverine flooding
Citation: Wulandari S, Pratama F, Andika N, Wongso P, Wijayasari W and Rohmat FIW (2025) Identifying dominant river contributions to urban flooding: a scenario-based study of Makassar City. Front. Built Environ. 11:1612416. doi: 10.3389/fbuil.2025.1612416
Received: 15 April 2025; Accepted: 19 June 2025;
Published: 07 July 2025.
Edited by:
Benedetta Moccia, Sapienza University of Rome, ItalyReviewed by:
Pradnya Dixit, Vishwakarma Institute of Technology, IndiaKeval Jodhani, Nirma University, India
Copyright © 2025 Wulandari, Pratama, Andika, Wongso, Wijayasari and Rohmat. This is an open-access article distributed under the terms of the Creative Commons Attribution License (CC BY). The use, distribution or reproduction in other forums is permitted, provided the original author(s) and the copyright owner(s) are credited and that the original publication in this journal is cited, in accordance with accepted academic practice. No use, distribution or reproduction is permitted which does not comply with these terms.
*Correspondence: Faizal Immaddudin Wira Rohmat, ZmFpemFscm9obWF0QGl0Yi5hYy5pZA==