 Norma Wihdatun Nikmah
 Maaz Abdullah
 Sadique Khan
 Mohamed Abdulqadir Mohamed
 Amin Al-Fakih
- 1Department of Civil and Environmental Engineering, King Fahd University of Petroleum and Minerals, Dhahran, Saudi Arabia
- 2Interdisciplinary Research Center for Construction and Building Materials, King Fahd University of Petroleum and Minerals, Dhahran, Saudi Arabia
The growing demand for sustainable construction materials and the urgent need for effective municipal solid waste (MSW) management have led to the exploration of MSW incorporation into masonry unit production. This review critically evaluates various MSW-derived materials, including paper sludge, food waste, plastics, rubber, leather, and glass waste, in fabricating bricks and blocks. The study compares data from numerous case studies, examining how MSW integration affects physico-mechanical properties such as bulk density, compressive, tensile, flexural strength, thermal conductivity, water absorption, and porosity. The findings indicate that while including MSW often reduces density and improves thermal insulation, it can negatively impact mechanical strength beyond certain thresholds. Thermal conductivity values in MSW-based bricks were decreased significantly across a wide range of waste types, achieving values as low as 0.17 W/mK, demonstrating enhanced insulating capabilities that support energy-efficient building design. However, with optimized mix proportions and processing techniques, many MSW-based masonry units meet or exceed performance standards for specific structural and non-structural applications. This review underscores the need for further research into waste compatibility, long-term performance, and standardization to enable large-scale adoption of MSW-based construction materials.
1 Introduction
Municipal solid waste (MSW) management is a critical aspect of urban sustainability, addressing the challenges posed by households and businesses’ increasing volume of waste (Azevedo et al., 2021). With ongoing economic development and improved living standards, the volume of MSW generated annually in the United States has shown significant changes over time (Ashraf et al., 2019), as illustrated in Figure 1. MSW encompasses various materials that households, businesses, and institutions discard, including food scraps, packing, and other everyday items (Silva de Souza Lima Cano et al., 2022). Effective MSW management encompasses multiple processes, including waste collection, recycling, and disposal, which are essential for minimizing public health risks and environmental impacts (Nanda and Berruti, 2021a). The goal is to minimize environmental impact while maximizing resource recovery (Cremiato et al., 2018). Key strategies involve reducing waste generation at the source, promoting recycling and composting, and ensuring safe disposal methods such as landfilling and incineration (Mohanty et al., 2022). Recent studies emphasize integrating waste management with urban planning to enhance efficiency and sustainability (da Silva et al., 2019).
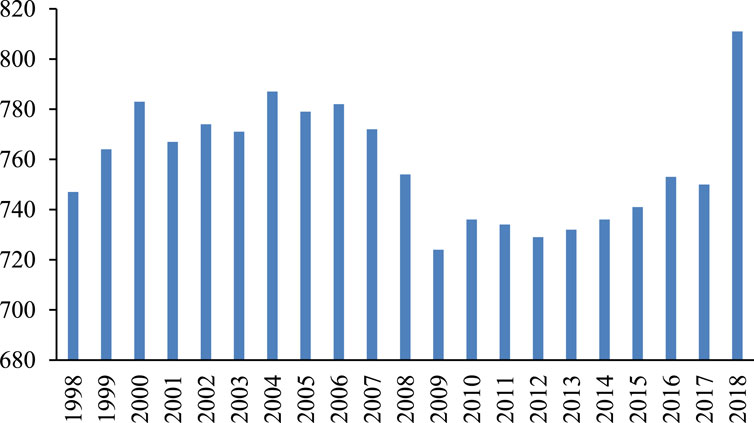
Figure 1. MSW generation trends in the United States (1998–2018) source: the OECD (Organization for Economic Co-operation and Development).
The construction industry is one of the most significant contributors to greenhouse gas emissions, so integrating sustainable practices into MSW management is increasingly important (Zhong et al., 2021). The shift towards sustainable construction materials is driven by the need to reduce the carbon footprint associated with traditional building practices, which often rely heavily on resource-intensive materials like concrete and steel (Khan and McNally, 2023).
Conventional brick and block production is a well-established method that utilizes raw materials such as clay, sand, and cement (Murmu and Patel, 2018). Production typically involves several stages: raw material preparation, mixing, molding, drying, and firing. Each stage is crucial for ensuring the quality and durability of the final products (Yuan et al., 2018). The brick and blocks produced are essential for various construction applications, providing structural integrity and aesthetic value (Hao et al., 2024). However, the traditional methods often lead to significant environmental concerns, including high energy consumption and carbon emissions from firing processes (Zhang et al., 2018). The need for sustainable alternatives has led to increased interest in incorporating recycled materials, particularly those derived from MSW, into brick-and-block production (Himabindu et al., 2024). This integration not only addresses waste management issues but also contributes to the development of eco-friendly construction materials (Soni et al., 2022). The potential of utilizing MSW in brick-and-block production is significant (Zheng et al., 2017). By recycling waste materials, the construction industry can reduce its reliance on virgin resources, lower production costs, and minimize environmental impacts (Lizárraga-Mendiola et al., 2022). Incorporating MSW into construction materials can help divert waste from landfills, reduce greenhouse gas emissions, and promote a circular economy (Ahmed, 2023; Cho et al., 2022). This approach aligns with global sustainability goals and offers a viable solution to the pressing challenges of waste management and resource depletion (Bengtsson et al., 2018).
The objectives of this review are to comprehensively analyze the utilization of MSW in brick and block production, assess the mechanical properties and environmental and economic benefits of this approach, and identify the challenges and opportunities associated with its implementation. The scope of the study includes a thorough examination of existing literature, case studies, and current practices in the field. The significance of this research lies in its potential to contribute to sustainable construction practices, enhance waste management strategies, and promote the adoption of innovative materials that can help mitigate the environmental impact of the construction industry.
2 Methodology
The literature review conducted in this study presents a comprehensive analysis of MSW utilization in brick and block production. As shown in Figure 2, our systematic search strategy encompassed multiple MSW types, using targeted databases (Google Scholar, Scopus, and ScienceDirect) with specific keywords and search contexts to ensure thorough coverage.
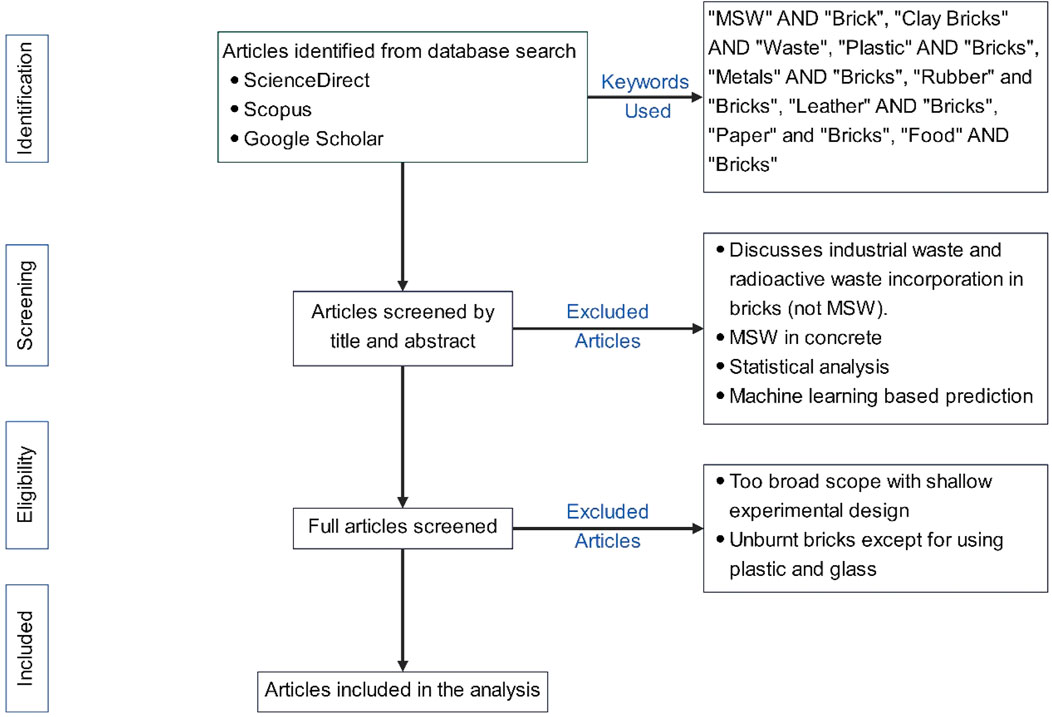
Figure 2. Flowchart for the identification of literature in the review.
Using VOSViewer software to analyze references from these databases, we methodically evaluated research published in 2015–2024. The generated visualization (Figure 3) reveals several interconnected research clusters centered around the topic of compressive strength of bricks, with significant nodes in thermal conductivity, sustainability, and material properties. Consider breaking this into shorter sentences for better readability (1) a pavement construction cluster (red) centered around “cement”, “pavement blocks”, and “density”, representing structural applications research; (2) a sustainability manufacturing cluster (orange) focusing on “fired clay bricks”, “sustainability”, and “environmentally friendly” processes, highlighting eco-conscious production methods; (3) a recycling optimization cluster (yellow) dominated by “recycling”, “clay bricks”, “kaolin”, and “paper sludge”, showing waste material utilization research; (4) a plastic waste integration cluster (blue) related to “plastic waste”, “plastic brick”, and “construction material”, indicating polymer-based research directions; (5) a concrete building cluster (green) involving “concrete bricks”, “crumb rubber”, and “building” applications, representing composite material studies; and (6) a thermal insulation cluster (purple) emphasizing “thermal insulation” and “alkaline activation” processes. The network mapping reveals that “compressive strength” and “thermal conductivity” serve as the two central research hubs, with extensive interconnections linking mechanical performance to thermal properties and sustainability aspects. The analysis identified critical research gaps, particularly in:
• The integration of multiple waste types
• Hazardous waste safety protocols
• Organic waste optimization
• Economic feasibility studies for large-scale implementation
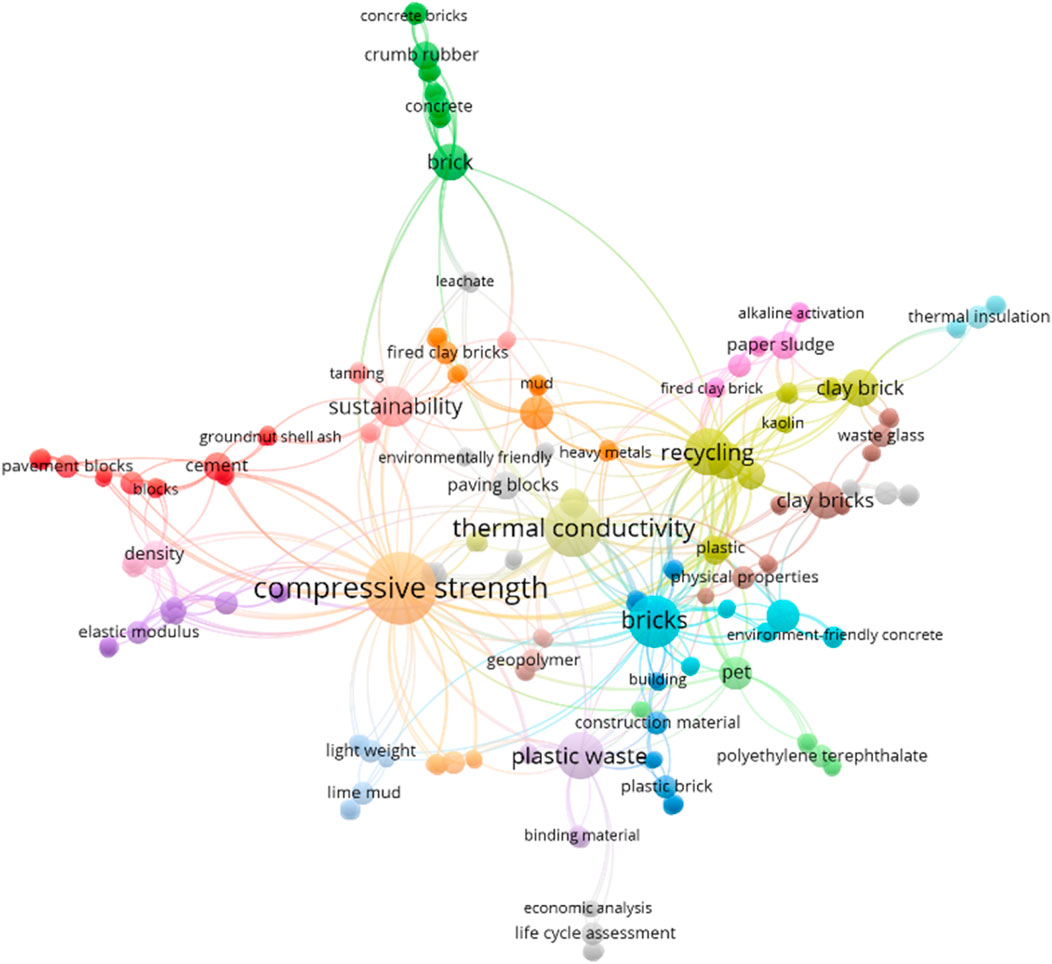
Figure 3. Current state of the literature in the utilization of MSW in bricks making.
The network mapping also highlights emerging research directions in eco-friendly binding materials, innovative waste pre-processing methods, life cycle assessments, and performance enhancement techniques. These findings illustrate the current state of knowledge and areas requiring further investigation in MSW-incorporated construction materials, providing a foundation for future research in sustainable building materials.
3 MSWs in construction
MSW is usually called refuse or waste. In 2018, the United States produced 292.4 million tons, representing an increase of around 23.7 million tons compared to 2017 of MSW. MSW comprises organic materials, including paper, cardboard, food, yard trimmings, plastics, and inorganic materials such as metal and glass. Figure 4 illustrates the composition of MSW produced in the United States in 2018.
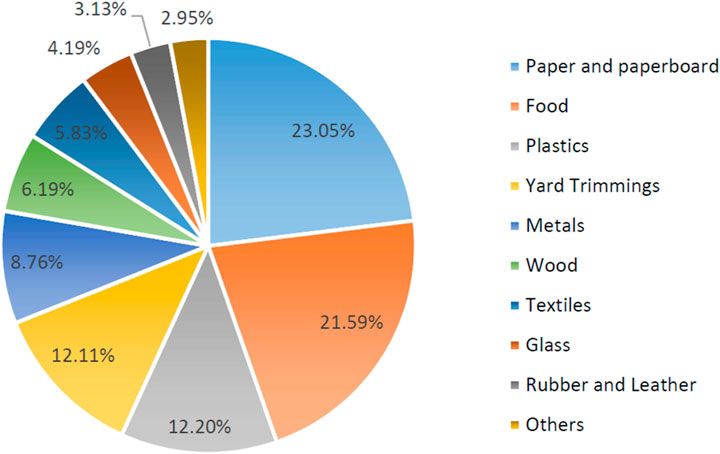
Figure 4. Distribution of MSW produced in the United States in 2018. 292.4 Million Tons (Before Recycling). Source: Environmental Protection Agency (EPA), https://www.epa.gov/facts-and-figures-about-materials-waste-and-recycling/national-overview.
The composition of MSW in the Kingdom of Saudi Arabia (KSA) exhibits various components, as depicted in Figure 5. Organic materials represent the predominant segment of the waste stream, comprising 40.5% of the total MSW generated. A notable percentage of plastics constitutes 5.2%, underscoring the ubiquity of plastic trash in the nation. Wood trash constitutes 8.0% of the total, and glass accounts for 4.6% of the waste composition. Textiles constitute 6.4% of MSW, signifying a significant presence of fabric and apparel in the waste stream. Metals and minerals constitute 8.3% of the waste, indicating the disposal of diverse metallic and mineral-based products. Notably, 2.0% of the waste is categorized as others, including items that do not fit into the primary classifications. Analyzing MSW composition in Saudi Arabia offers critical information for waste management strategies and prospective recycling activities, especially considering the substantial proportion of organic waste and the notable availability of recyclable materials, including plastics, metals, and glass. Figure 6 provides an overview of the references used for each type of MSW.
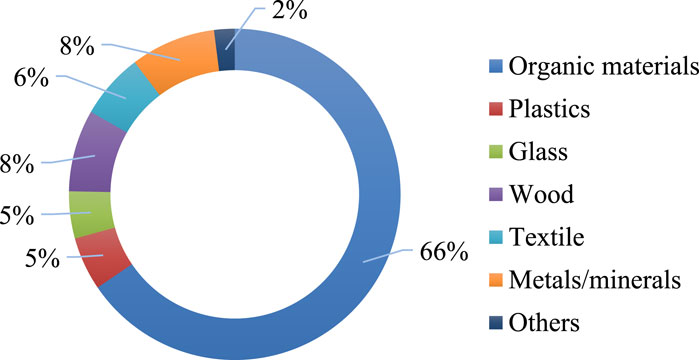
Figure 5. Composition of MSW produced in KSA.
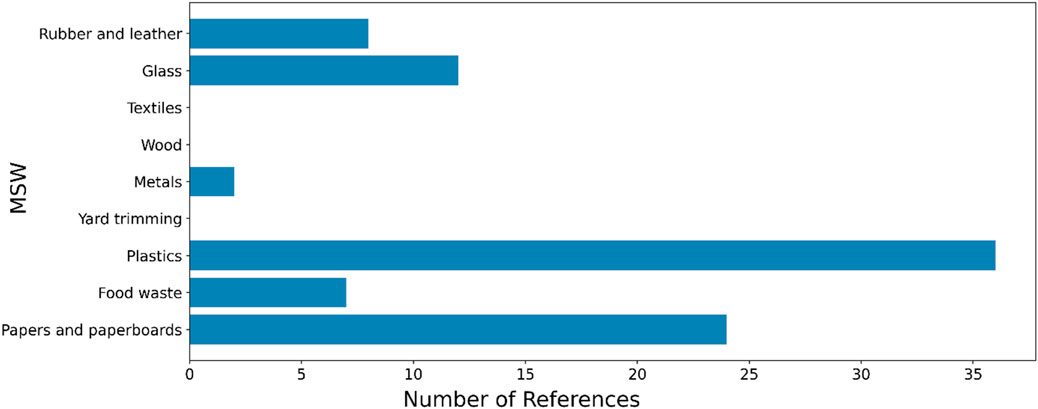
Figure 6. References used for different types of MSW in the literature.
Paper and paperboard (PPB) products constitute one of the main components of MSW. PPB mainly consists of lignin, cellulose, and hemicellulose (lignocellulose) (Gonzalez-Estrella et al., 2017). Food waste (FW) primarily originates from households, restaurants, cafeterias, processing enterprises, and markets (Lv et al., 2021). Global industrial production of plastics has risen by around 80% since 2002. Plastics are categorized into seven primary types based on their recyclability: polyethylene terephthalate, high-density polyethylene, polyvinyl chloride, low-density polyethylene, polypropylene, polystyrene, and miscellaneous plastics (Nanda and Berruti, 2021b). In the United States, tree debris is classified as MSW known as “yard trimmings,” including grass, leaves, and brush. In 2017, the estimated national generation of yard trimmings was 31.9 million tons, constituting approximately 13.1% of total municipal solid garbage (Schmitt-Harsh and Wiseman, 2020). The concentrations of six heavy metals, namely Zn, Cu, Mn, Pb, Cr, and Cd, diminished in all the simulated landfills (Wang et al., 2021). Ferrous metals (iron and steel) are the predominant group of metals in MSW by weight. The principal sources of ferrous metals in MSW are durable products, including appliances, furniture, and tires. Containers and packaging represent an additional source of ferrous metals in MSW (Ghanbarzadeh et al., 2024). Wood sources in MSW comprise furniture, durable goods (such as cabinets for electrical devices), wood packaging (including crates and pallets), and various miscellaneous items (Aziz et al., 2021; Teacă et al., 2023). Nonetheless, as indicated by Indhiradevi et al. (2020), the wood ash utilized in this investigation was not sourced from MSW but from combustion procedures, which are especially intended for ash production for construction applications. Additionally, other research has examined the application of wood ash, not derived from MSW, in manufacturing bricks and blocks, emphasizing its capacity to enhance strength, diminish environmental effects, and reduce production costs. The majority of the goods that are classified as textiles in MSW are products that have been thrown, including but not limited to rugs, footwear, sheets, and towels (Lee et al., 2023).
4 Physical properties of MSW-based masonry bricks
4.1 Bulk density
Bulk density (BD) changes due to temperature variations during testing is one of the prime concerns in eco-friendly brick manufacturing. Generally, MSW addition results in a decrease in the density of bricks. Multiple studies report density reductions following the addition of solid waste. Addition of paper mill sludge (PMS), as done by Goel and Kalamdhad (2018), noted a significant decrease in the density from 1560 to 640 kg/m3 on inclusion of 30% sludge by weight. Similar results were drawn for other research incorporating paper mill or sludge waste. This was also inferred by Singh et al. (2018). The reduction in the density is probably due to the burning of de-inking PMS, leaving the pores behind as a residue. The addition of food waste, like tea waste (TW), also resulted in a decrease in the density of fired clay brick (Hussien et al., 2024). The density decreased from 1963.91 kg/m3 to 1602.18 kg/m3 on adding 0%–10% TW, respectively. Similarly, bricks made with spent oyster mushrooms as additives exhibited a reduction in density, with values decreasing from 1870 at 0% to 1370 kg/m3 at 15% oyster mushrooms by volume, indicating that higher concentrations of organic waste contribute to a less dense structure (Chung et al., 2021).
Adding eggshell powder to waste glass-based bricks also decreased density, with bricks incorporating 5% eggshell powder showing a notable decline in density compared to the control (Tangboriboon, 2019). Furthermore, TW in fired clay bricks led to a marked reduction in BD, dropping from 1860 at 0% TW to 1580 kg/m3 at 12% TW when the firing temperature was 1250°C and 1590 at 0% TW to 1370 kg/m3 at 12% TW when firing temperature was 950°C, demonstrating that higher TW content reduces the compactness of the material (Ozturk et al., 2019). Similarly, the use of wine lees (WL) and grape seeds (GS) in clay bricks decreased the BD, with the values for WL ranging between 1320–1460 kg/m3 at 10% content, while GS resulted in even lower density values of 1170–1200 kg/m3 at the same concentration (Taurino et al., 2019). When considering plastic-based waste materials like plastic dust and high density polyethylene (HDPE), the value for BD ranged from 1654 to 1298 kg/m3 for addition of 0%–15% plastic dust by volume and 2000 to 1360 kg/m3 on 0%–50% by volume incorporation of HDPE (Idrees et al., 2023; Sarwar et al., 2023). Introducing cassava peel bio-solid waste (CP) into clay bricks decreased density, with the lowest values observed at 16% CP, highlighting the effect of organic additives in reducing material density (Adazabra et al., 2024) Furthermore, in the case of incorporation of sago fine waste (SFW) mixed with cement decreased the density of the resulting bricks, with values dropping from 2103–2127 kg/m3 at 0% SFW to the range of 1687–1796 kg/m3 at 10% SFW, further emphasizing the influence of waste materials on the BD of construction materials (Norhayati et al., 2023). These findings collectively suggest that the incorporation of various waste materials into construction bricks and pellets reduces BD, which could impact the final product’s structural and thermal properties.
Figure 7 illustrates the variation in BD with increasing concentrations of MSW for a diverse set of waste-derived ashes, each treated at varying calcination temperatures. A consistent trend is evident across all materials: as the MSW content increases, the BD of the composite material significantly decreases. This behavior is primarily attributed to the lower specific gravity and increased internal porosity of MSW ashes compared to conventional cementitious binders or aggregates. The porous structure of MSW-based ashes, often resulting from the combustion of organic matter and volatile components during thermal treatment, leads to a looser particle packing arrangement, thus reducing the overall density. At 0% MSW, the highest bulk densities are observed in materials like high-density polyethylene and leather buffing dust, both exceeding 2200 kg/m3 and reaching up to 2400 kg/m3. These materials initially offer compact and denser structures, likely due to their thermoplastic or fibrous origins, which result in tighter interparticle packing and less void content. However, as MSW increases, their bulk densities drop markedly, indicating that the incorporation of MSW disrupts the matrix and introduces greater void space. On the other end of the spectrum, waste-paper ash and oyster mushroom ash exhibit considerably lower bulk densities even at minimal MSW levels, with values falling below 1200 kg/m3 at higher MSW concentrations. This suggests these ashes are inherently lighter and more porous, and their structural contribution in terms of density is minimal. PMS and paper pulp residue (PPR) follow a similar trend, showing significant reductions from approximately 1800–1900 kg/m3 to below 1400 kg/m3 as MSW percentages reach 20%–30%. TW ash, calcined at various temperatures ranging from 950°C to 1250°C, displays a more gradual and controlled reduction in BD. This indicates that higher calcination temperatures may promote partial sintering or particle densification, which slightly stabilizes BD despite increasing MSW content. Additionally, CP ash treated at both 800°C and 1000°C demonstrates intermediate behavior, starting from moderate densities and showing a steady decrease, reflecting the influence of organic content and thermal reactivity.
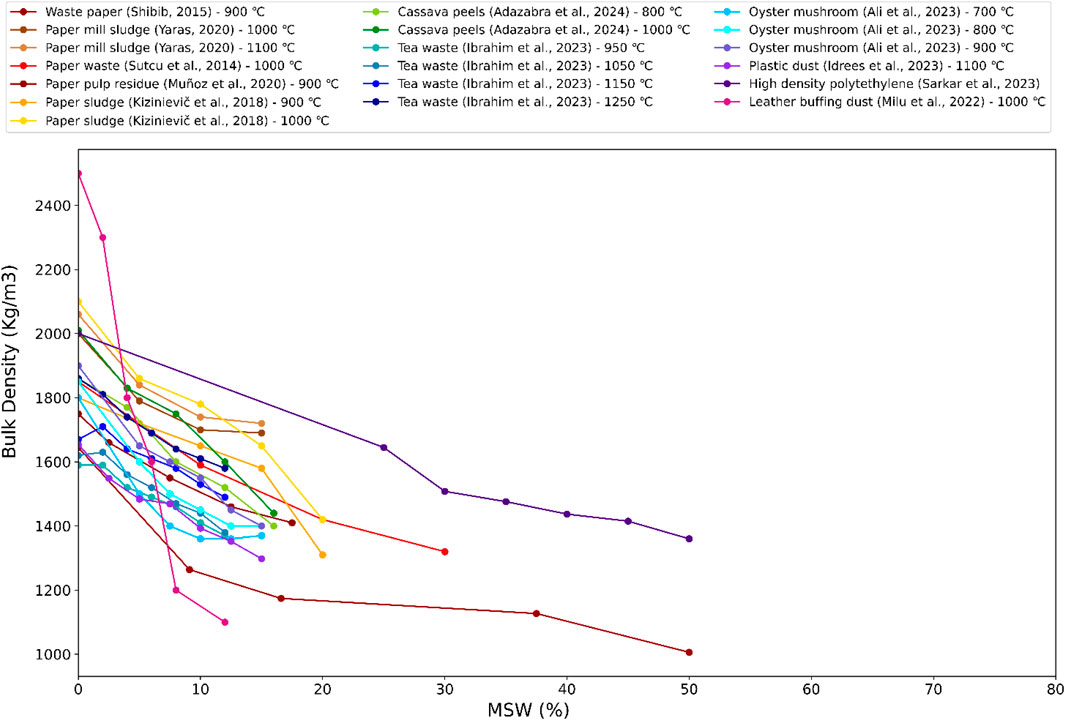
Figure 7. Variation of BD with addition of MSW concentration.
Overall, the incorporation of MSW-derived ash leads to a reduction in BD across all types of waste materials, highlighting their potential application in the development of lightweight construction materials. While this property is advantageous for reducing dead loads and enhancing thermal insulation, it is critical to balance these benefits with the need to maintain acceptable levels of strength, durability, and overall performance for structural applications. The observed data supports the idea that material selection and processing temperature play a crucial role in controlling BD and tailoring mix designs to meet specific engineering requirements.
4.2 Porosity
Incorporating waste materials into construction significantly affects their porosity, often increasing the void space within bricks and pellets. For instance, bricks containing TW showed a substantial increase in porosity, with values rising from 16.14% at 0% TW to 28.87% at 10% TW (Hussien et al., 2024). This suggests that the organic nature of TW enhances the porous structure of the bricks, which may improve thermal insulation but reduce overall strength. Similarly, bricks incorporating SCG and TW also exhibited increased porosity. With SCG content rising from 0% to 10%, the porosity increased from 12.27% to 32.62%, highlighting the influence of organic waste in creating more air pockets within the material (Chung et al., 2021). In another study, eggshell powder used in waste glass-based bricks led to a higher porosity in the resulting materials, with the control brick showing a porosity of 9.47%, while the brick containing 5% eggshell powder had a porosity of 17.73%, illustrating how the addition of waste materials can create a more porous structure (Tangboriboon, 2019).
In bricks made with TW, the porosity increased as the TW percentage rose, from 25.1% at 0% TW to 33.3% at 12.5% TW, further confirming the role of organic materials in expanding the internal void spaces of the brick (Ozturk et al., 2019). Similarly, including wine lees (WL) and grape seeds (GS) in clay bricks resulted in a rise in porosity. For WL, the porosity ranged from 37.5% at 10% content to 43.9% at 20% content, while GS-based bricks exhibited even higher values, reaching up to 50.1% at 10% GS (Taurino et al., 2019). This increase in porosity will likely reduce the material’s weight and potentially improve its insulation properties, though it may also affect its mechanical strength. The effect of plastic waste on porosity depends on the type of plastic and the mix design. While hydrophobic and dense plastics like HDPE and LDPE often reduce porosity when combined with other materials such as bottom ash, copper slag, ceramic or foundry sand (Monish et al., 2021; Aneke and Shabangu, 2021), others, such as plastic dust or mixed waste, as done by Subhani et al. (2024) increase the value for porosity.
4.3 Thermal conductivity
Thermal conductivity is an essential property for assessing the insulating qualities of building materials. Waste materials frequently help lower thermal conductivity, which is advantageous for energy efficiency when mixed into clay bricks or pellets. Because of their larger porosity and air pockets that act as thermal insulators, organic waste materials have been shown in numerous studies to considerably impact thermal conductivity in construction materials, usually lowering it. The incorporation of paper-based materials also influences the thermal conductivity of bricks. Waste paper and paper sludge (PS) reduce the thermal conductivity of bricks, making them more efficient as thermal insulators. For instance, PS bricks had a thermal conductivity range of 0.396–0.555 W/mK, with higher paper content leading to a lower thermal conductivity (Ospina Salazar et al., 2023) This reduction in thermal conductivity is beneficial for energy-efficient construction, as it helps maintain a stable indoor temperature. Similarly, other studies reported decreased thermal conductivity, ranging from 0.15 W/mK to 0.39 W/mK depending on the paper content and the firing temperature (Goel and Kalamdhad, 2018; Sutcu et al., 2014). Additionally, wine lees (WL) and grape seeds (GS) reduced thermal conductivity in bricks constructed with these components. While GS-based bricks showed even more notable improvements, with values as low as 0.73 W/mK at 10% GS, the thermal conductivity for WL decreased from 1.05 W/mK at 10% content to 0.84 W/mK at 20% content (Taurino et al., 2019). By increasing the bricks’ porosity, these organic waste ingredients improve their insulation properties and slow the pace heat moves through them. The impact of organic waste on thermal conductivity was also noted in clay pellets. The thermal conductivity of clay pellets decreased by adding groundnut shells, coffee grinds, and cork powder. Thermal conductivity decreased from 0.68 W/mK to 0.46 W/mK in pellets containing larger percentages of groundnut shells, demonstrating the organic material’s insulating properties (Cobo-Ceacero et al., 2023). A similar pattern was seen when CP biosolid was added to clay bricks; the thermal conductivity dropped from 1.02 W/mK at 0% CP to 0.92 W/mK at 16% CP, confirming the notion that waste materials might enhance the thermal performance of construction materials (Adazabra et al., 2024). The incorporation of plastic waste into construction bricks significantly impacts thermal conductivity, typically leading to a reduction due to the low thermal conductivity of plastic materials. This property enhances the insulation performance of plastic-based bricks, making them suitable for energy-efficient construction applications (Aneke and Shabangu, 2021; Alaloul et al., 2020). Also, as micro-voids serve as insulating barriers, bricks manufactured with larger percentages of plastic dust exhibit better thermal performance (Idrees et al., 2023).
4.4 Water absorption
Water absorption (WA) is another critical factor impacted by paper-based materials. Bricks with higher paper content tend to exhibit increased water absorption, which is linked to the higher porosity of the bricks. For example, bricks with PPRs demonstrated water absorption values ranging from 20% to 35%, depending on the content and curing conditions (Akinwande et al., 2021). Similarly, other studies observed 8% and 37% water absorption rates, with PS content increasing the brick’s porosity and water uptake (Goel and Kalamdhad, 2018; Sarkar et al., 2017). Regarding paper waste, it has been reported that the water absorption in bricks with wastepaper inclusion is much more than that of PMS (Sutcu et al., 2014; Shibib, 2015; Yaras, 2020; Kizinievič et al., 2018a). In the case of food waste-based MSW incorporation, the value generally varied for a range of approximately 8%–15% on inclusion of 10% waste as reported by the study through TW and CP (Adazabra et al., 2024; Ibrahim et al., 2023). Due to plastic’s hydrophobic nature, adding plastic trash to bricks and other building materials considerably lowers water absorption. For instance, bricks manufactured from recycled HDPE or PP plastic waste have remarkably low water absorption rates—0.752% for HDPE and 0.370% for PP (Kulkarni et al., 2022). Similarly, water absorption rates as low as 1.5%–4.9% are achieved by LDPE-based composites with bottom ash, ceramic, or copper slag, significantly lower than traditional clay bricks (Monish et al., 2021). Preserving compatibility with second-class brick standards, including plastic dust as a partial substitute for clay also keeps water absorption within acceptable bounds, with values staying below 20% even at greater plastic dust levels (Idrees et al., 2023). Conversely, leather and tannery result in comparatively less water absorption.
Figure 8 presents the variation in WA with increasing MSW concentration for a range of waste-derived ashes treated at different calcination temperatures. A clear upward trend is observed across nearly all materials, indicating that as the proportion of MSW increases, the WA capacity of composite materials also rises. This increase in WA is largely attributed to the porous and hydrophilic nature of MSW-derived ashes, which contain a high volume of micro-voids, unburnt organic residues, and loosely packed particles. These characteristics promote moisture penetration and retention, thereby increasing the overall water uptake. The most prominent increase is observed in high-density polyethylene ash, where WA exceeds 80% at 50% MSW concentration, highlighting its extremely porous and water-retentive structure. Similarly, tannery sludge ashes, particularly those treated at 900°C and 950°C, show high absorption values, surpassing 40% at higher MSW content. These results suggest that thermally treated organic-rich wastes tend to produce ashes with large pore networks, which significantly elevate capillary absorption. Waste-paper ash and plastic dust also display steep increases, indicating that these materials are less dense and contain higher internal voids, making them more susceptible to water ingress. In contrast, materials such as CPs, PS, and TW ash exhibit more moderate increases in WA with MSW addition. Their lower absorption rates, even at higher MSW percentages, suggest relatively better thermal transformation and possibly denser ash morphology. The behavior of TW ash, particularly at higher treatment temperatures (up to 1250°C), indicates that controlled calcination can improve ash quality by reducing unburnt carbon and decreasing pore connectivity, thus restraining excessive water absorption.
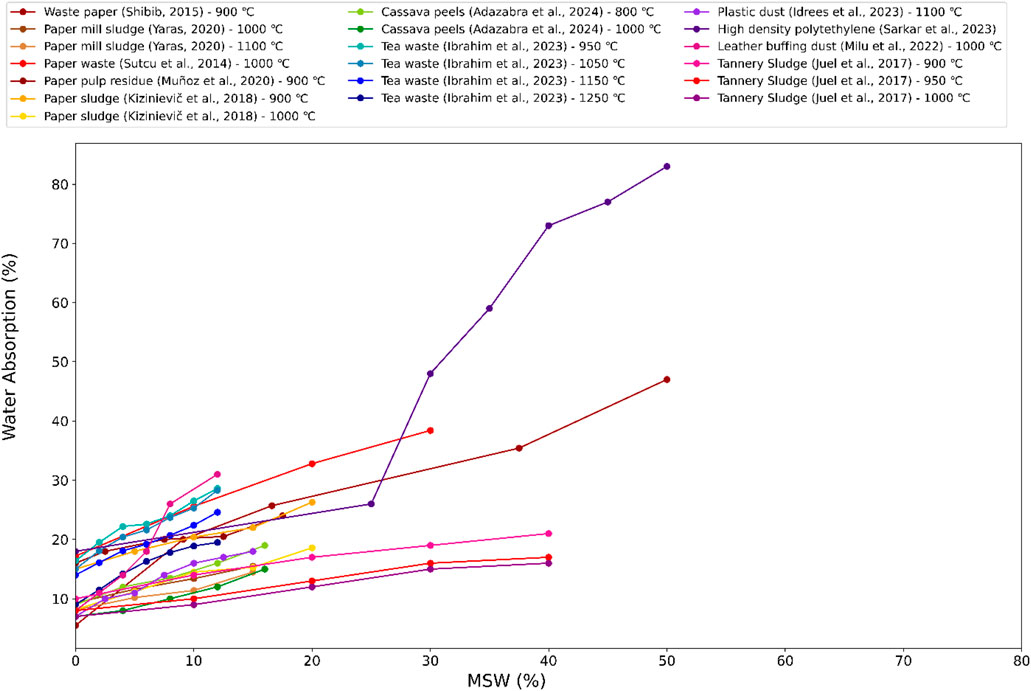
Figure 8. Variation of water absorption with the addition of MSW concentration.
Overall, the rising trend of WA with increasing MSW concentration demonstrates the influence of ash structure and composition on moisture interaction. While elevated WA may enhance internal curing in certain lightweight or non-structural applications, excessive absorption poses challenges in terms of durability, dimensional stability, and long-term strength retention. Therefore, careful optimization of MSW content and calcination conditions is essential when developing sustainable construction composites using waste-derived ashes.
5 Mechanical properties of MSW-based masonry bricks
5.1 Compressive strength
Compressive strength is deemed the most essential quality index for a brick (Shi and Zheng, 2007; Saikia and De Brito, 2012). For normal weather conditions, the minimum compressive strength of brick according to ASTM C62-13a standard is 10.3 MPa. The addition of paper-based admixtures to bricks generally results in lower compressive strength (Tables 1–5). For example, bricks made from a mixture of paper pulp (47.5%–50%) and banana fiber exhibited compressive strength values up to 6.7 MPa, significantly lower than conventional clay bricks (Akinwande et al., 2021). Similarly, other studies found that increasing paper content in brick mixtures led to decreased mechanical strength, with compressive strengths ranging from 2.4 MPa to 36.7 MPa depending on the type and concentration of paper admixture (Yaras, 2020; Sutcu et al., 2023). Notably, certain combinations of paper and other materials, such as fly ash or banana fibers, can partially offset the reduction in strength by enhancing the bonding properties of the matrix. For food waste like TW, the compressive strength tends to decrease as the percentage of waste increases. For example, bricks with 10% TW content exhibited a compressive strength reduction from 29.55 MPa (at 0% TW) to 17.71 MPa (at 10% TW), indicating that the addition of organic waste reduces the brick’s overall load-bearing capacity (Hussien et al., 2024). Conversely, adding waste materials such as eggshell powder (EP) in glass-based bricks increased compressive strength. For example, adding 5% eggshell powder to waste glass-based bricks raised the compressive strength from 25.73 MPa (for the control brick) to 27.83 MPa, representing a modest improvement in strength (Tangboriboon, 2019). The control mix using glass and plastic waste achieves 40 MPa, while the 55% by mass additional of glass reduces it to 22 MPa. A combined mix of 25% glass and 2% plastic achieves a balanced 25 MPa (Zhang et al., 2022) Rauniyar et al. (2024) used polypropylene waste fibers and noted that the strength is maximum at 10% addition of waste, and reported it to be 16.85 MPa, compared to the 13.44 MPa at 5% and 12.62 MPa at 15%. Similarly, an addition of 30% SPW noted a compressive strength of 30% SPW (Aneke and Shabangu, 2021). Overall, plastic waste usage is deemed beneficial for clay brick manufacture.

Table 1. Physico-mechanical properties of masonry units incorporating MSW materials namely: Paper and Paperboard.
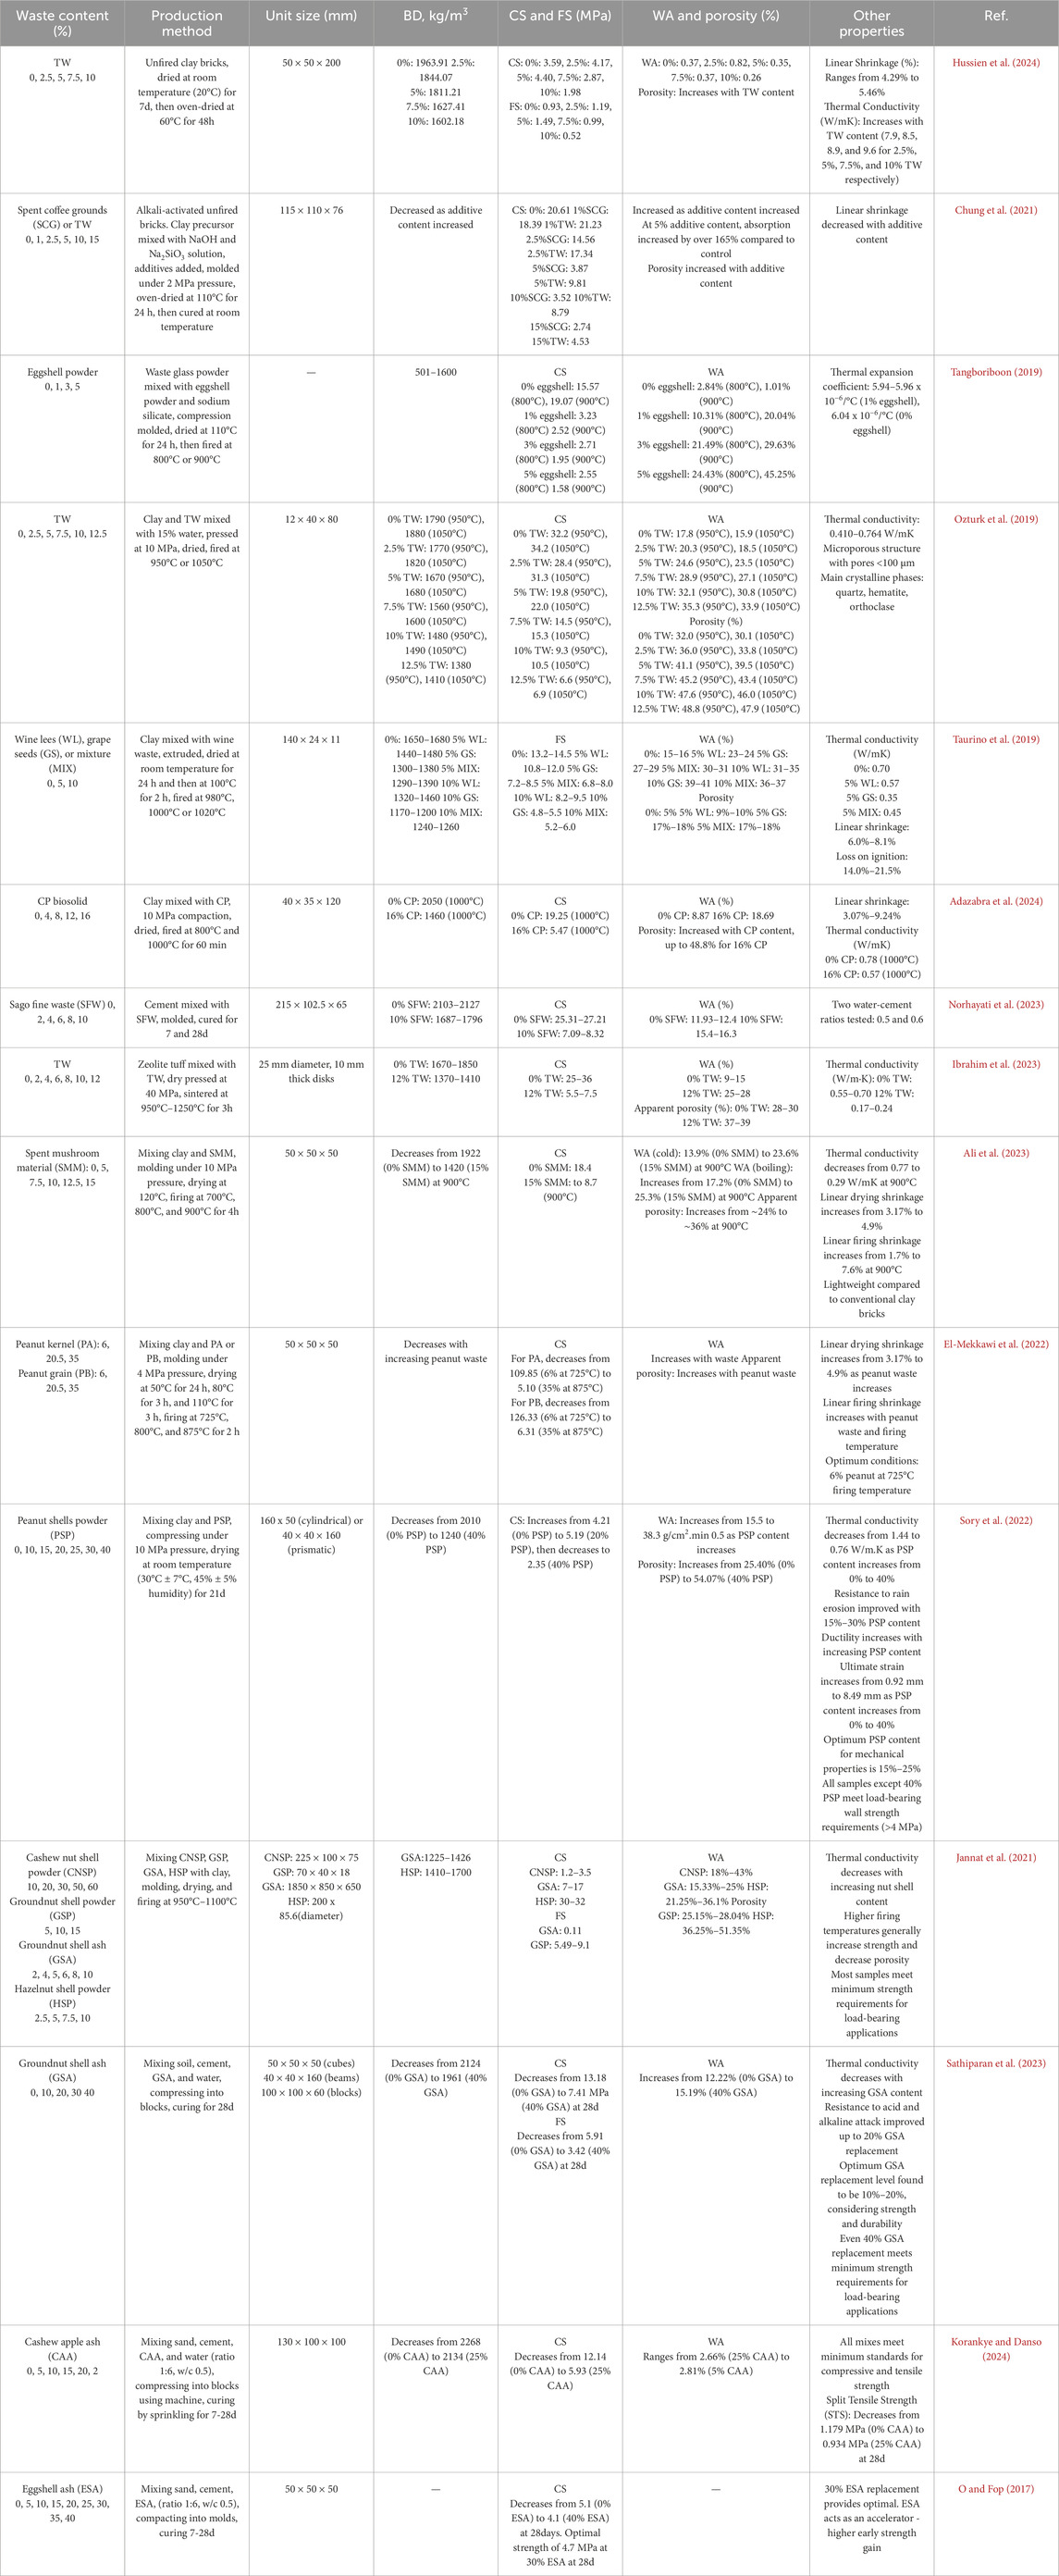
Table 2. Physico-mechanical properties of masonry units incorporating MSW materials namely: Food Waste.
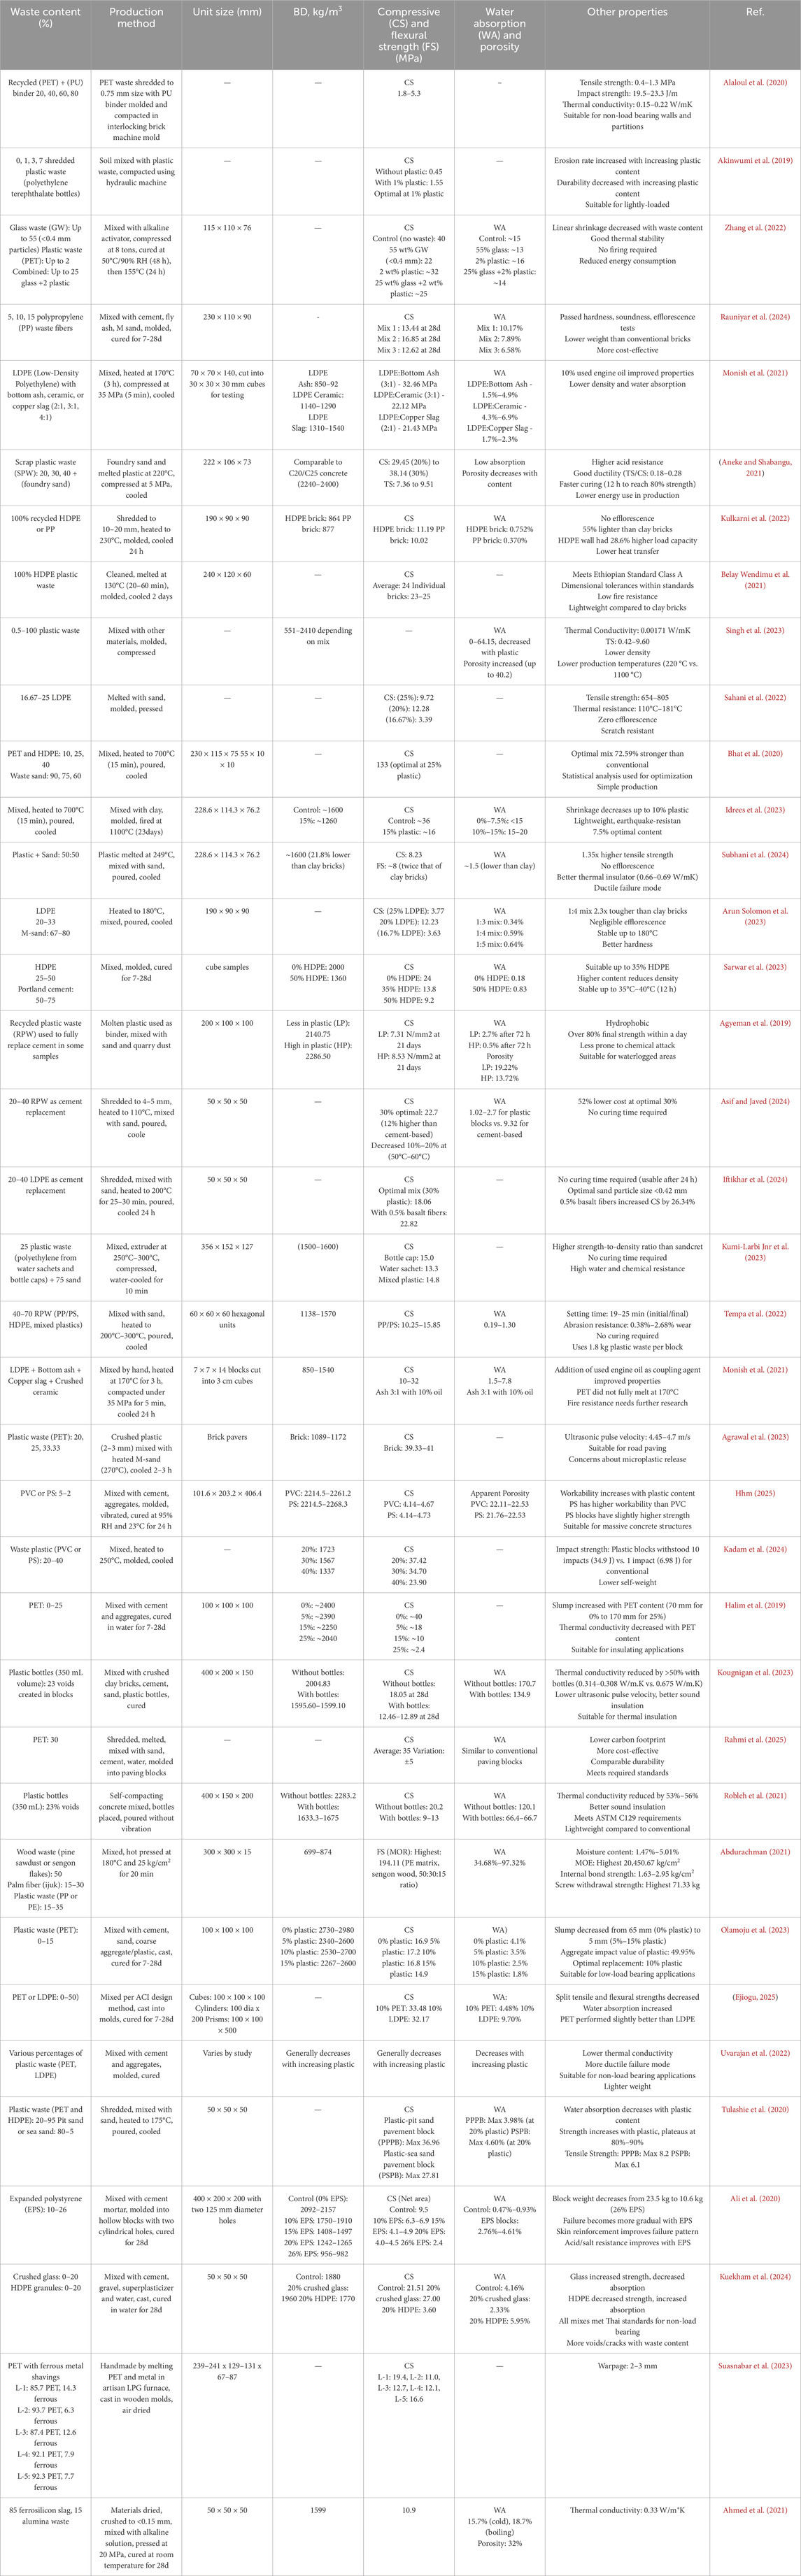
Table 3. Physico-mechanical properties of masonry units incorporating MSW materials, namely: Plastic Waste.

Table 4. Physico-mechanical properties of masonry units incorporating MSW materials namely: Glass Waste.
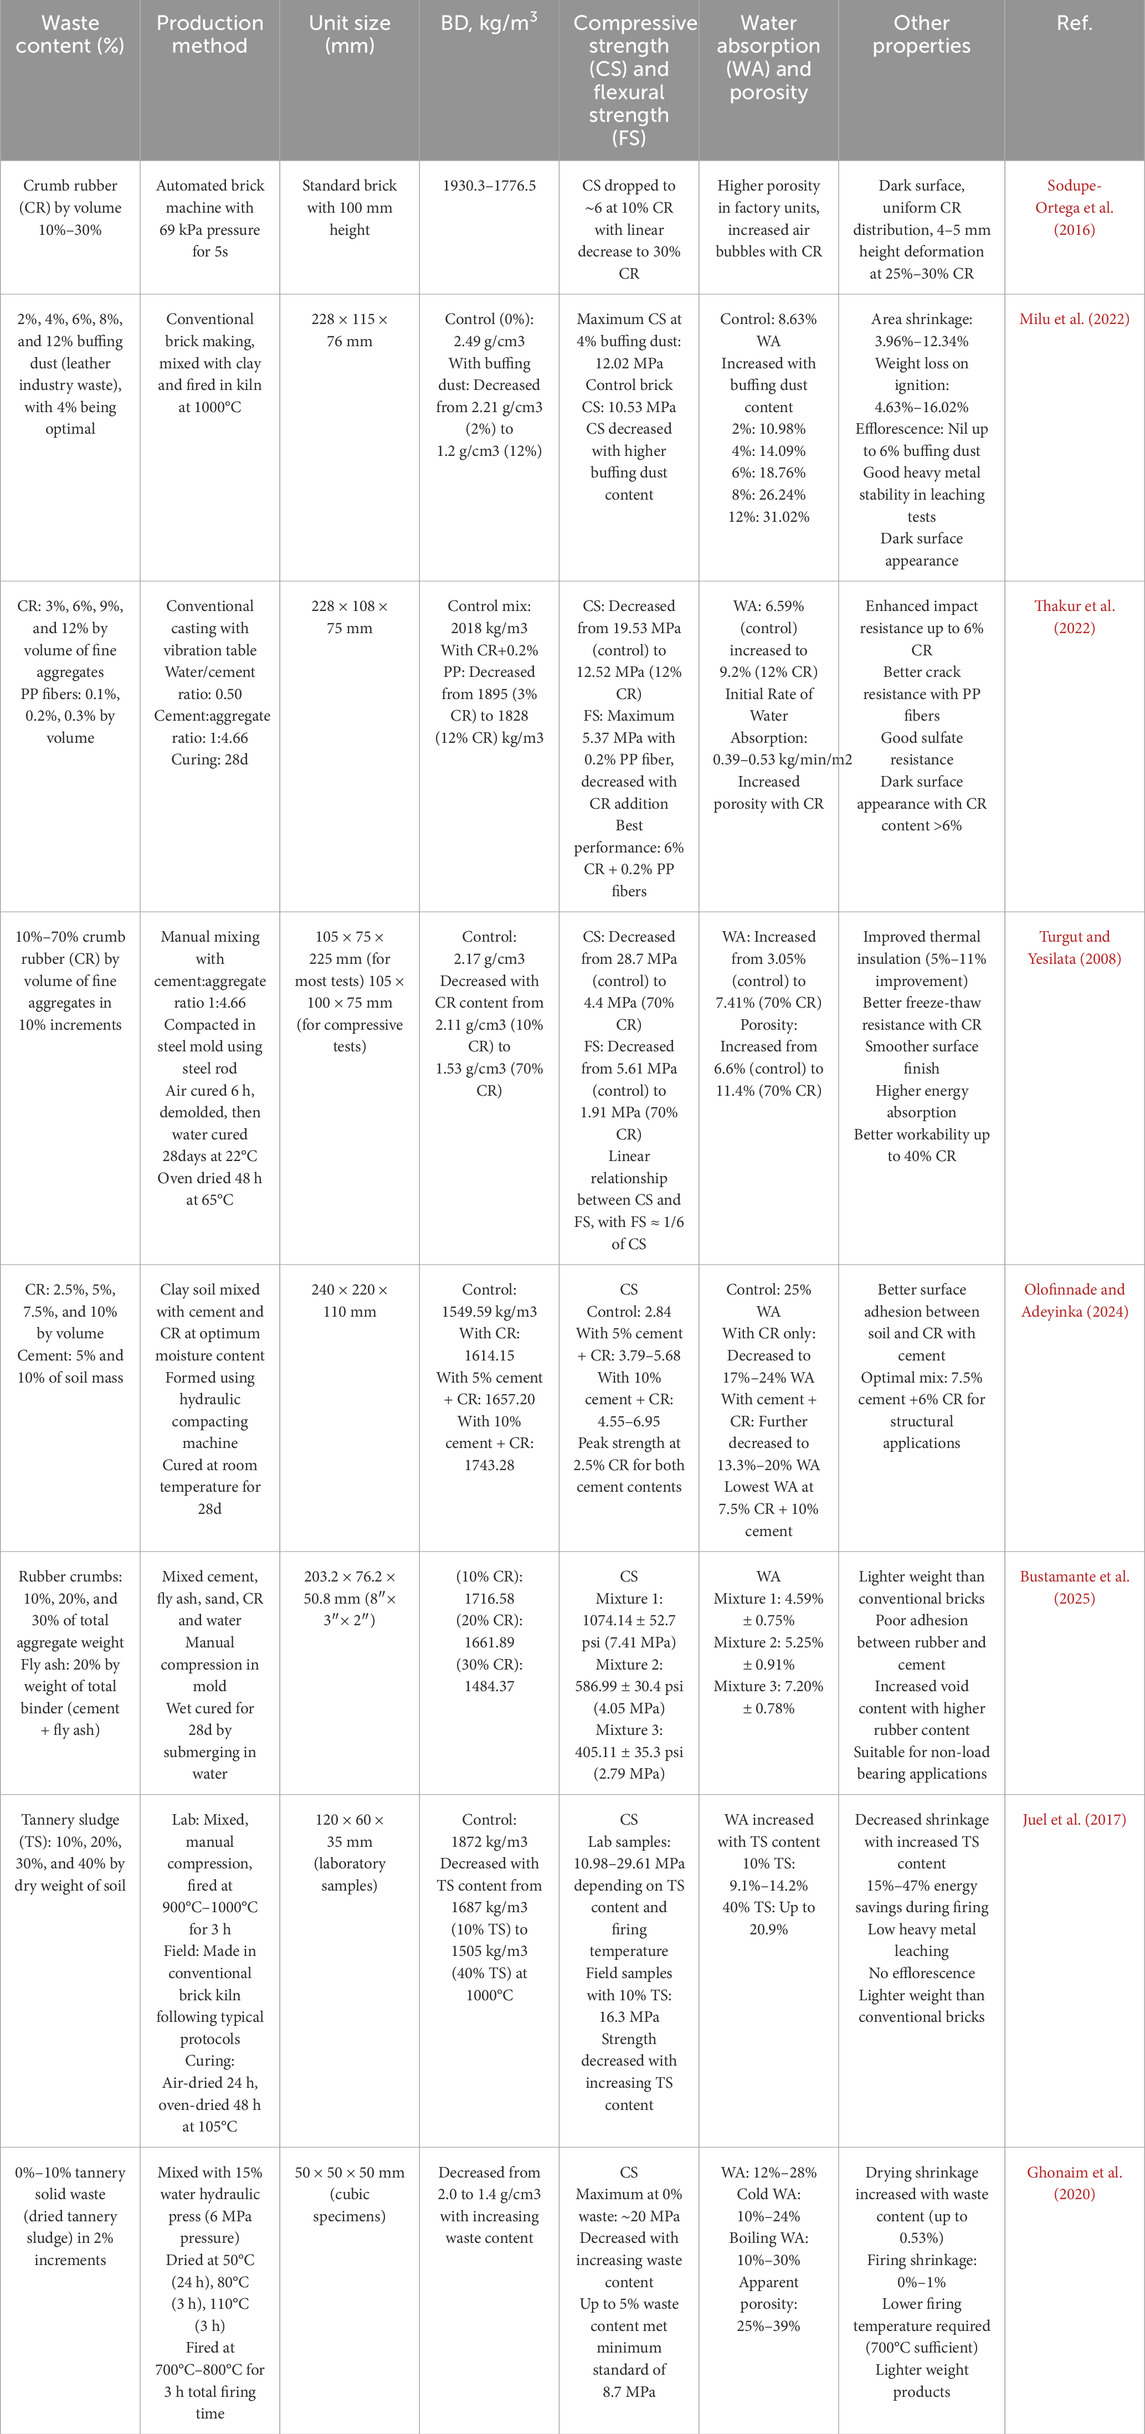
Table 5. Physico-mechanical properties of masonry units incorporating MSW materials namely: Rubber and Leather.
Figure 9 illustrates the variation in compressive strength of bricks with increasing concentrations of MSW for a variety of waste-derived ashes treated at different temperatures. A general downward trend is observed across all materials, indicating that higher MSW content typically results in reduced compressive strength. This decline can be attributed to several factors, including the reduced binding capacity, poor particle interlocking, and increased porosity introduced by the incorporation of lightweight and organic-rich ash materials. As MSW content rises, the structural matrix becomes less compact and more heterogeneous, leading to a decrease in load-bearing capacity. Among the materials tested, leather buffing dust and high-density polyethylene initially show the highest compressive strengths, with values exceeding 45 MPa and 40 MPa respectively at 0% MSW, primarily reflecting their higher baseline control strengths rather than inherent material advantages. These materials also maintain relatively higher strengths even at elevated MSW contents, which may be attributed to their stronger initial matrix in addition to favorable particle morphology, better bonding characteristics, or partial sintering effects during calcination. In contrast, materials such as oyster mushroom ash and paper sludge exhibit significantly lower compressive strength values from the outset, which decline rapidly with increasing MSW. This suggests that these ashes may lack sufficient pozzolanic reactivity or cohesive properties to form a dense and durable brick matrix. Tannery sludge, across various temperatures (900°C–1000°C), demonstrates a moderately strong initial performance but shows noticeable reductions in compressive strength beyond 20%–30% MSW, indicating limited tolerance to high ash content. Tea waste ash, processed at different calcination temperatures, reveals varied results: while higher temperatures (e.g., 1250°C) slightly improve initial compressive strength, the overall trend still indicates a loss in strength as MSW concentration increases. Similarly, paper mill sludge and paper waste ashes follow a consistent downward pattern, with compressive strength dropping to as low as 10 MPa or below at higher MSW levels.
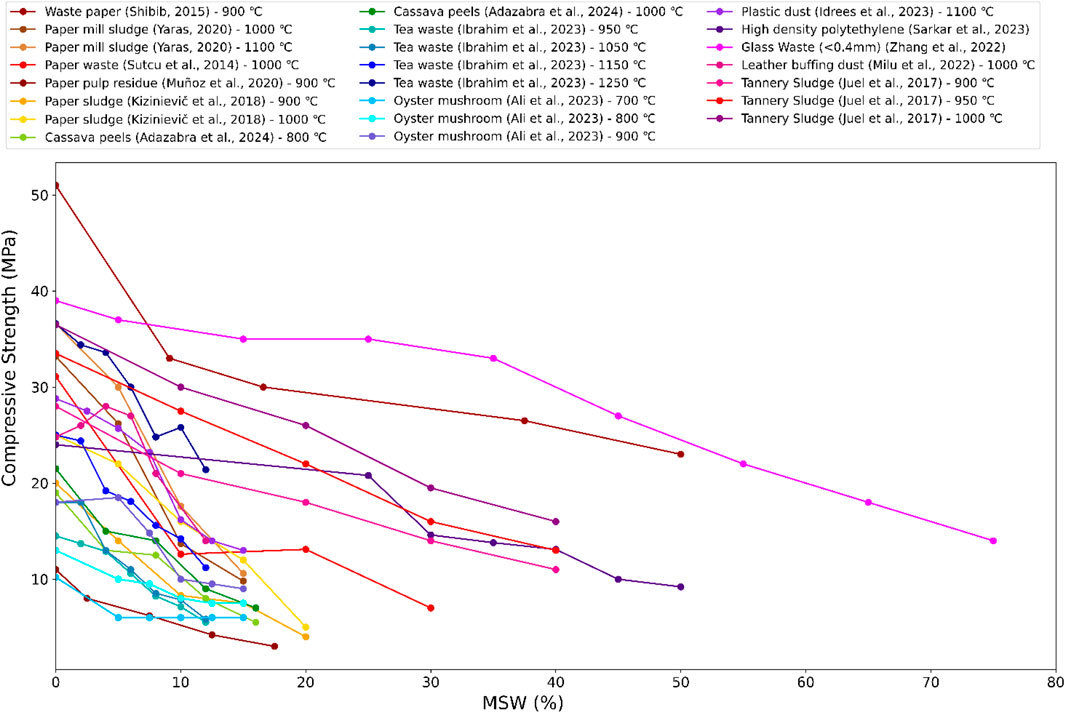
Figure 9. Variation of compressive strength of bricks with the addition of MSW concentration.
The normalized strength analysis reveals distinct performance categories when baseline differences are eliminated. High-density polyethylene demonstrates exceptional retention (98% at 10% MSW, 85% at 50% MSW), while most paper-based materials maintain 68%–88% of control strength at 10% MSW content. Organic waste shows moderate performance with tea waste retaining 82%–88% and cassava peels 78%–80% at 10% MSW. Conversely, paper mill sludges exhibit the steepest decline (65%–68% retention at 10% MSW), whereas leather buffing dust uniquely shows initial improvement (110% at 10% MSW) before declining. This normalized comparison eliminates baseline bias and provides unbiased material performance ranking essential for practical engineering applications.
The observed reductions in compressive strength highlight the critical need for optimizing MSW replacement levels to balance sustainability with structural performance. While incorporating waste materials supports circular economy goals and reduces the environmental footprint of construction materials, excessive MSW content can compromise the mechanical integrity of the bricks. Therefore, establishing optimal replacement thresholds and refining calcination conditions are essential for ensuring that waste-derived bricks meet the required standards for load-bearing applications.
5.2 Tensile strength
Fibrous additives like banana fiber or cellulose improve tensile properties by reinforcing the material matrix. However, porosity limits tensile performance at higher waste levels. Therefore, more porous materials often lead to less tensile strength. On the addition of 0%–12% of deinking PS (DPS), the value for tensile strength is not reported. Still, the characteristic indicated by increasing porosity reflects that the value for tensile strength will be depleted (Makni et al., 2024). At 10% TW content, the tensile strength of bricks decreased significantly from 1.45 MPa (for control bricks) to 0.85 MPa, reflecting the negative impact of TW on the material’s ability to resist tensile forces (Hussien et al., 2024). This reduction is attributed to introducing porous spaces within the material, which weakens the overall matrix and makes it more susceptible to stretching and pulling. Similarly, SCG also causes a decrease in tensile strength. Bricks with 10% SCG content exhibited a reduction from 1.66 MPa to 1.10 MPa (Chung et al., 2021). The addition of such waste materials introduces micro-voids, which reduce the material’s resistance to stretching forces, thus lowering its overall tensile strength. On the other hand, certain inorganic waste materials, such as EP, can enhance tensile strength when mixed with other construction materials. Adding 5% eggshell powder to waste glass-based bricks increased tensile strength from 1.60 MPa to 1.80 MPa (Tangboriboon, 2019). Meanwhile, the variability of tensile strength for clay bricks depends on the plastic type used and the particle size. PET and PU mixed waste decreased the tensile strength of clay bricks as noted by Alaloul et al. (2020). Conversely, the tensile strength increased from 7.36 MPa to 9.51 MPa, increasing the scrap plastic waste (SPW) from 20% to 30%. Subhani et al. (2024) conducted a study investigating the mixture of plastic waste, including HDPE, PET, and LDPE. They inferred that the value of tensile strength is about 1.35 times that of traditional clay bricks. This result is further supported by the results drawn from research on LDPE by Arun Solomon et al. (2023).
Overall, as shown in Tables 1–5, the impact of MSW-derived additives on tensile strength varies based on material type, porosity, and bonding characteristics. Organic wastes such as TW and spent coffee grounds (SCG) generally reduce tensile strength due to the formation of internal voids and weak matrix cohesion, with declines reaching up to 40%–50% at higher replacement levels. Paper-based residues, while not always directly measured for tensile strength, exhibit similar tendencies due to increased porosity. In contrast, certain inorganic additives like eggshell powder and scrap plastic waste have demonstrated improvements in tensile properties. For example, bricks with eggshell powder showed slight increases in tensile strength, while those with optimized levels of plastic waste exhibited significantly higher values compared to traditional clay bricks. These outcomes highlight the critical role of material compatibility, particle structure, and bonding efficiency in determining tensile performance in MSW-integrated masonry units.
5.3 Flexural strength
In most cases, waste materials improve flexural strength at lower contents by enhancing bonding and densification. Excessive content often leads to porosity increases, reducing bending resistance. On addition of recycled PS (RPS) and expanded perlite (EP), the value of flexural strength ranged from 10.2 MPa to 34.6 MPa, depending on firing conditions. The combination of RPS and EP provides strength and reduces weight while maintaining flexibility (Sutcu et al., 2023). The flexural strength value ranges from 2 MPa to 4 MPa, with higher PPR (PPR) contents moderately increasing bending strength due to the material’s elasticity (Muñoz et al., 2020a). Bricks made with TW exhibited a reduction in flexural strength as the percentage of TW increased. At 10% TW, the flexural strength decreased from 3.62 MPa (for the control bricks) to 2.12 MPa (Hussien et al., 2024). This reduction is consistent with the observed decrease in compressive and tensile strength, as the TW particles likely introduce voids and disrupt the overall bond strength of the material, making it more prone to bending and failure under load. In a similar study, bricks made with SCG showed a decrease in flexural strength from 4.20 MPa (at 0% SCG) to 2.95 MPa (at 10% SCG), which is again consistent with the negative impact of organic waste on the flexural properties of the material (Chung et al., 2021). The presence of SCG in the brick mix likely reduces the overall cohesion between the particles, which weakens the material’s resistance to bending. On the other hand, some inorganic wastes can have a strengthening effect. For instance, bricks containing EP demonstrated improved flexural strength. Adding 5% EP to waste glass-based bricks increased the flexural strength from 3.40 MPa to 3.90 MPa (Tangboriboon, 2019). This improvement can be attributed to the reinforcing nature of eggshell powder, which enhances the material’s structural integrity and helps resist bending forces. On the other hand, the mixture of different types of plastic waste (HDPE, LDPE, and PET) showed approximately double the value of conventional clay bricks, i.e., 8 MPa.
Generally, flexural strength in MSW-incorporated masonry units (Tables 1–5) generally benefits from low to moderate waste content, which can enhance bonding, matrix cohesion, and elasticity. Materials like recycled PS, expanded perlite, and PPRs have demonstrated moderate to significant increases in flexural strength, especially under controlled firing conditions. However, organic additives such as TW and spent coffee grounds tend to reduce flexural performance at higher concentrations due to the introduction of voids and disruption in particle bonding. This reduction is often in line with decreases observed in compressive and tensile strengths, reflecting the overall weakening of the structural matrix. In contrast, inorganic additives like eggshell powder and mixed plastic wastes (e.g., HDPE, LDPE, PET) have shown improved flexural strength, with some formulations achieving values nearly double that of conventional clay bricks. These results suggest that the type, proportion, and physical interaction of the waste material with the binder matrix are critical in determining flexural performance outcomes.
6 Optimization strategies for MSW-based masonry bricks
The successful integration of MSW into masonry brick production requires systematic optimization approaches to achieve optimal performance while maintaining economic viability and environmental benefits. Mix design optimization represents the most critical factor, where the proportion of MSW to conventional materials must be carefully balanced based on waste type and intended application. Research demonstrates that optimal MSW content typically ranges between 10%–30% by weight, with paper sludge showing peak performance at 15%–20% replacement, plastic waste achieving best results at 10%–15% incorporation, and glass waste effectively utilized up to 25% replacement. The key to successful optimization lies in understanding the individual characteristics of each waste stream and tailoring mix proportions to maximize beneficial properties while mitigating potential drawbacks such as increased porosity or reduced bonding strength.
Processing parameter optimization involves careful control of manufacturing conditions to maximize MSW integration benefits. Critical parameters include firing temperature optimization (900°C–1050°C depending on waste type), moisture content control during curing (85%–95% relative humidity), and article size management (typically 0.5–2.0 mm for optimal packing density). Quality enhancement techniques such as waste pre-processing, surface treatment of hydrophobic materials, and strategic use of binding agents (cement 5%–10%, lime 3%–7%) significantly improve performance outcomes. Economic optimization considerations encompass waste procurement costs, energy consumption during manufacturing, and market acceptance factors, with studies indicating 15%–30% cost savings compared to conventional alternatives when properly optimized. These systematic approaches ensure that MSW-based masonry units achieve acceptable performance standards while contributing to sustainable construction practices and waste diversion goals.
7 Limitations
The heterogeneity of MSW introduces variability in product quality, requiring thorough sorting and pre-processing methods. Concerns about leachate, long-term durability, and performance under extreme environmental conditions must also be addressed. The scalability of MSW integration into industrial processes is another critical factor, demanding investment in advanced technologies and infrastructure. Moreover, it can be inferred from the case studies that the long-term behaviour of MSW-incorporated construction materials under environmental stresses such as freeze-thaw cycles, chemical exposure, and UV radiation remains insufficiently studied.
8 Future research
Despite the comprehensive review presented, several critical research gaps warrant future investigation to advance MSW integration in masonry brick production. Innovations in waste segregation technologies, such as automated sorting and chemical separation, can improve the purity of MSW inputs, enabling more consistent and high-quality material production. Pre-processing techniques like thermal treatment, pyrolysis, and bio-stabilization can also mitigate raw MSW’s variability and contaminant issues. Research into blending MSW with other industrial by-products, such as fly ash, slag, or construction demolition waste, as done by a few researchers, can create synergistic effects that enhance the mechanical and thermal properties of bricks. Tailoring the mix ratios based on intended applications, such as load-bearing or insulation, can maximize material efficiency. Additionally, rigorous LCA is essential to evaluate the environmental benefits and trade-offs of incorporating MSW into construction materials. These assessments should cover all stages of the material’s lifecycle, from waste collection and processing to manufacturing, use, and end-of-life disposal. Long-term durability studies exceeding 10 years are essential to establish performance reliability under various environmental conditions. Standardized testing protocols designed for MSW-based construction materials need development to ensure consistent quality assessment. Economic feasibility studies incorporating regional waste management costs, material processing expenses, and market acceptance factors would facilitate commercial implementation. Finally, the development of automated quality control systems for MSW sorting and processing would enhance the consistency and scalability of MSW-based brick production.
9 Conclusion
This review has systematically examined the utilization of various municipal solid waste (MSW) components—including PS, food waste, plastics, rubber, leather, and glass waste—in the development of masonry bricks and blocks. The comprehensive analysis of physico-mechanical properties highlights the following key insights:
BD and Porosity: The inclusion of MSW generally reduces BD due to increased internal porosity, leading to the development of lightweight masonry units. This characteristic is particularly beneficial for non-load-bearing and thermally insulating applications.
Mechanical Performance: Compressive, tensile, and flexural strengths tend to decrease with higher MSW content, especially for organic and fibrous wastes. However, several optimized formulations, particularly those involving treated or inert wastes like glass and select plastics, were found to meet or exceed conventional standards for structural applications.
Water Absorption and Durability: Increased porosity typically results in higher water absorption, which could adversely affect long-term durability. Hydrophobic materials such as plastic waste can mitigate this issue, improving moisture resistance and dimensional stability.
Thermal Properties: A consistent reduction in thermal conductivity was observed across most MSW-integrated masonry units, with some formulations achieving values as low as 0.17 W/mK. This indicates a strong potential for enhanced thermal insulation in energy-efficient construction.
Material Optimization: The performance of MSW-based bricks is highly dependent on the type, proportion, and treatment of the waste materials, as well as the firing or curing process. Optimal mix designs can achieve a balance between sustainability and mechanical performance.
This review confirms the technical feasibility of incorporating MSW into masonry unit production while identifying critical research gaps. Future studies should focus on standardized testing protocols, long-term durability assessments, leachability and environmental safety, and the integration of life cycle assessment (LCA) to validate the environmental benefits. Establishing clear guidelines for waste segregation, processing, and incorporation methods will be essential for the industrial-scale implementation of MSW-derived construction materials.
Author contributions
NN: Conceptualization, Data curation, Methodology, Visualization, Writing – original draft. MA: Data curation, Formal Analysis, Methodology, Visualization, Writing – original draft. SK: Data curation, Formal Analysis, Visualization, Writing – original draft, Writing – review and editing. MM: Validation, Writing – original draft, Writing – review and editing. AA-F: Conceptualization, Methodology, Supervision, Writing – review and editing.
Funding
The author(s) declare that financial support was received for the research and/or publication of this article. The authors express their gratitude to the Interdisciplinary Research Center for Construction and Building Materials (IRC-CBM), KFUPM, Saudi Arabia, for supporting this work under Grant No. INCB2520. They also extend their appreciation to the Department of Civil and Environmental Engineering, KFUPM, for their support.
Conflict of interest
The authors declare that the research was conducted in the absence of any commercial or financial relationships that could be construed as a potential conflict of interest.
Generative AI statement
The author(s) declare that Generative AI was used in the creation of this manuscript. The AI was used for rephrasing and English writings enhancement.
Publisher’s note
All claims expressed in this article are solely those of the authors and do not necessarily represent those of their affiliated organizations, or those of the publisher, the editors and the reviewers. Any product that may be evaluated in this article, or claim that may be made by its manufacturer, is not guaranteed or endorsed by the publisher.
References
Abdurachman, J. M. (2021). The utilization of ijuk fibre and sawdust for manufacturing composite block with plastic waste as the matrix. IOP Conf. Ser. Mater Sci. Eng. 1088, 012112. doi:10.1088/1757-899x/1088/1/012112
Adazabra, A. N., Viruthagiri, G., and Banyibala, V. (2024). Influence of cassava peels biosolid addition on the technological properties, thermal performance, and microstructural characteristics of fired clay bricks. J. Mater. Civ. Eng. 36. doi:10.1061/jmcee7.mteng-16626
Agrawal, R., Singh, S. K., Singh, S., Prajapat, D. K., Sudhanshu, S., Kumar, S., et al. (2023). Utilization of plastic waste in road paver blocks as a construction material. CivilEng 4, 1071–1082. doi:10.3390/civileng4040058
Agyeman, S., Obeng-Ahenkora, N. K., Assiamah, S., and Twumasi, G. (2019). Exploiting recycled plastic waste as an alternative binder for paving blocks production. Case Stud. Constr. Mater. 11, e00246. doi:10.1016/j.cscm.2019.e00246
Ahmed, M. M., El-Naggar, K. A. M., Tarek, D., Ragab, A., Sameh, H., Zeyad, A. M., et al. (2021). Fabrication of thermal insulation geopolymer bricks using ferrosilicon slag and alumina waste. Case Stud. Constr. Mater. 15, e00737. doi:10.1016/j.cscm.2021.e00737
Ahmed, N. (2023). Utilizing plastic waste in the building and construction industry: a pathway towards the circular economy. Constr. Build. Mater 383, 131311. doi:10.1016/j.conbuildmat.2023.131311
Akinwande, A. A., Adediran, A. A., Balogun, O. A., Olusoju, O. S., and Adesina, O. S. (2021). Influence of alkaline modification on selected properties of banana fiber paperbricks. Sci. Rep. 11, 5793. doi:10.1038/s41598-021-85106-8
Akinwumi, I. I., Domo-Spiff, A. H., and Salami, A. (2019). Marine plastic pollution and affordable housing challenge: shredded waste plastic stabilized soil for producing compressed Earth bricks. Case Stud. Constr. Mater. 11, e00241. doi:10.1016/j.cscm.2019.e00241
Alaloul, W. S., John, V. O., and Musarat, M. A. (2020). Mechanical and thermal properties of interlocking bricks utilizing wasted polyethylene terephthalate. Int. J. Concr. Struct. Mater 14, 24. doi:10.1186/s40069-020-00399-9
Ali, S. A., Fahmy, M. K., Zouli, N., Abutaleb, A., Maafa, I. M., Yousef, A., et al. (2023). Fabrication of thermal insulation bricks using Pleurotus Florida spent mushroom. Materials 16, 4905. doi:10.3390/ma16144905
Ali, Y. A. Y., Fahmy, E. H. A., AbouZeid, M. N., Shaheen, Y. B. I., and Mooty, M. N. A. (2020). Use of expanded polystyrene wastes in developing hollow block masonry units. Constr. Build. Mater 241, 118149. doi:10.1016/j.conbuildmat.2020.118149
Aneke, F. I., and Shabangu, C. (2021). Green-efficient masonry bricks produced from scrap plastic waste and foundry sand. Case Stud. Constr. Mater. 14, e00515. doi:10.1016/j.cscm.2021.e00515
Arslan, C., Gencel, O., Borazan, I., Sutcu, M., and Erdogmus, E. (2021). Effect of waste-based micro cellulose fiber as pore maker on characteristics of fired clay bricks. Constr. Build. Mater 300, 124298. doi:10.1016/j.conbuildmat.2021.124298
Arun Solomon, A., Shelton, J. J., and Daniel, C. (2023). Turning low-density polyethylene plastic waste into plastics bricks for sustainable development. Mater Today Proc. doi:10.1016/j.matpr.2023.03.482
Ashraf, M. S., Ghouleh, Z., and Shao, Y. (2019). Production of eco-cement exclusively from municipal solid waste incineration residues. Resour. Conserv. Recycl 149, 332–342. doi:10.1016/j.resconrec.2019.06.018
Asif, U., and Javed, M. F. (2024). Optimizing plastic waste inclusion in paver blocks: balancing performance, environmental impact, and cost through LCA and economic analysis. J. Clean. Prod. 478, 143901. doi:10.1016/j.jclepro.2024.143901
Azevedo, B. D., Scavarda, L. F., Caiado, R. G. G., and Fuss, M. (2021). Improving urban household solid waste management in developing countries based on the German experience. Waste Manag. 120, 772–783. doi:10.1016/j.wasman.2020.11.001
Aziz, H. A., Abu Amr, S. S., Vesilind, P. A., Wang, L. K., and Hung, Y.-T. (2021). Introduction to solid waste management, 1–84. doi:10.1007/978-3-030-84180-5_1
Belay Wendimu, T., Neguse Furgasa, B., and Mohammed Hajji, B. (2021). Suitability and utilization study on waste plastic brick as alternative construction material. J. Civ. Constr. Environ. Eng. 6, 9. doi:10.11648/j.jccee.20210601.12
Bengtsson, M., Alfredsson, E., Cohen, M., Lorek, S., and Schroeder, P. (2018). Transforming systems of consumption and production for achieving the sustainable development goals: moving beyond efficiency. Sustain Sci. 13, 1533–1547. doi:10.1007/s11625-018-0582-1
Bhat, R., Raghavendra Kamath, C., Mohan, N., Naik, N., Mulimani, P., and Fei, K. M. (2020). Experimental analysis of mechanical properties of the unconventional sand-plastic bricks using statistical method. J. Eng. Sci. Technol. Rev. 13, 13–16. doi:10.25103/jestr.132.02
Bhushan, B., Kanwar, M., John, S., and Kanwar, V. S. (2021). “Development of bricks from lime sludge of paper industry and assessment of indoor air quality of buildings made of them,” in AIP conf proc (American Institute of Physics Inc.). doi:10.1063/5.0072850
Bustamante, A., Arazo, R. O., Dablo, G. M., Sia, R., and Arazo, R. (2025). Physical and mechanical properties of composite brick from cement mortar, fly ash, and rubber crumbs Physical and mechanical properties of composite brick from cement mortar. FLY ASH RUBBER CRUMBS. Available online at: http://www.ijret.org/volumes/2015v04/i10/IJRET20150410001.pdf.
Cho, N., El Asmar, M., and Aldaaja, M. (2022). An analysis of the impact of the circular economy application on construction and demolition waste in the United States of America. Sustain. Switz. 14, 10034. doi:10.3390/su141610034
Chung, L. L. P., Wong, Y. C., and Arulrajah, A. (2021). The application of spent coffee grounds and tea wastes as additives in alkali-activated bricks. Waste Biomass Valorization 12, 6273–6291. doi:10.1007/s12649-021-01453-7
Cobo-Ceacero, C. J., Moreno-Maroto, J. M., Guerrero-Martínez, M., Uceda-Rodríguez, M., López, A. B., Martínez García, C., et al. (2023). Effect of the addition of organic wastes (cork powder, nut shell, coffee grounds and PS) in clays to obtain expanded lightweight aggregates. Bol. La Soc. Espanola Ceram. Vidr. 62, 88–105. doi:10.1016/j.bsecv.2022.02.007
Cremiato, R., Mastellone, M. L., Tagliaferri, C., Zaccariello, L., and Lettieri, P. (2018). Environmental impact of municipal solid waste management using life cycle assessment: the effect of anaerobic digestion, materials recovery and secondary fuels production. Renew. Energy 124, 180–188. doi:10.1016/j.renene.2017.06.033
da Silva, L., Prietto, P. D. M., and Korf, E. P. (2019). Sustainability indicators for urban solid waste management in large and medium-sized worldwide cities. J. Clean. Prod. 237, 117802. doi:10.1016/j.jclepro.2019.117802
Dondi, M., Guarini, G., Raimondo, M., and Zanelli, C. (2009). Recycling PC and TV waste glass in clay bricks and roof tiles. Waste Manag. 29, 1945–1951. doi:10.1016/j.wasman.2008.12.003
Ejiogu, I. K. (2025). Environmental waste management through the utilization of waste plastics polyethylene terephthalate (PET) and low density polyethylene (LDPE) as partial replacement of sand in the. Available online at: http://www.akamaiuniversity.us/PJST.htm.
Ekong, S. A., Oyegoke, D. A., Edema, A. A., and Robert, U. W. (2022). Density and water absorption coefficient of sandcrete blocks produced with waste paper ash as partial replacement of cement. Adv. Mater. Sci. 22, 85–97. doi:10.2478/adms-2022-0021
El-Mekkawi, S. A., Sebaei, A. S., and Amin, S. K. (2022). Green waste recycling of peanuts highly contaminated with aflatoxins in clay brick manufacturing. Bull. Natl. Res. Cent. 46, 91. doi:10.1186/s42269-022-00780-6
Ghanbarzadeh Lak, M., Ghaffariraad, M., and Jahangirzadeh Soureh, H. (2024). “Characteristics and impacts of municipal solid waste (MSW),” in Technical landfills and waste management: volume 1: landfill impacts, characterization and valorisation (Springer), 31–92.
Ghonaim, S. A., Abadir, M. F., Ghoneim, I. A., and Amin, S. K. (2020). The use of tannery solid waste in the production of building bricks. Available online at: http://www.ripublication.com.
Goel, G., and Kalamdhad, A. S. (2018). Paper mill sludge (PMS) and degraded municipal solid waste (DMSW) blended fired Bricks–A review. MOJ Civ. Eng. 4, 81–85. doi:10.15406/mojce.2018.04.00101
Gonzalez-Estrella, J., Asato, C. M., Stone, J. J., and Gilcrease, P. C. (2017). A review of anaerobic digestion of paper and paper board waste. Rev. Environ. Sci. Biotechnol. 16, 569–590. doi:10.1007/s11157-017-9436-z
Halim, N. F. A., Azis*, Z. A., Taib, N., and Ismail, H. (2019). “Development of sustainable building material by incorporating plastic waste in concrete block,” in Cognitive-crcs, 415–424. doi:10.15405/epms.2019.12.40
Hao, Y., Yao, Z., Wu, R., and Bao, Y. (2024). Damage and restoration technology of historic buildings of brick and wood structures: a review. Herit. Sci. 12, 301. doi:10.1186/s40494-024-01422-y
Himabindu, M., Raj, V. H., Dutt, A., Chandra, P. K., Sethi, V. A., and Mohammad, Q. (2024). “Recycling waste into building materials: innovations and prospects in brick production for sustainable construction,” in E3S web of conferences. Les Ulis, France: (EDP Sciences). doi:10.1051/e3sconf/202450504001
Hussien, A., Al Zubaidi, R., Jannat, N., Ghanim, A., Maksoud, A., and Al-Shammaa, A. (2024). The effects of tea waste additive on the physical and mechanical characteristics of structural unfired clay bricks. Alexandria Eng. J. 101, 282–294. doi:10.1016/j.aej.2024.05.090
Ibrahim, J. E. F. M., Tihtih, M., Şahin, E. İ., Basyooni, M. A., and Kocserha, I. (2023). Sustainable zeolitic tuff incorporating tea waste fired ceramic bricks: development and investigation. Case Stud. Constr. Mater. 19, e02238. doi:10.1016/j.cscm.2023.e02238
Idrees, M., Akbar, A., Saeed, F., Gull, M., and Eldin, S. M. (2023). Sustainable production of low-shrinkage fired clay bricks by utilizing waste plastic dust. Alexandria Eng. J. 68, 405–416. doi:10.1016/j.aej.2023.01.040
Iftikhar, B., Alih, S. C., Vafaei, M., Alkhattabi, L., Althoey, F., Ali, M., et al. (2024). Sustainable use of plastic waste in plastic sand paver blocks: an experimental and modelling-based study. Structures 62, 106285. doi:10.1016/j.istruc.2024.106285
Indhiradevi, P., Manikandan, P., Rajkumar, K., and Logeswaran, S. (2020). “A comparative study on usage of cowdung ash and wood ash as partial replacement in flyash brick,” in Mater today proc (Elsevier Ltd), 1190–1194. doi:10.1016/j.matpr.2020.06.355
Jamshidi, A., Kurumisawa, K., Nawa, T., and Igarashi, T. (2016). Performance of pavements incorporating waste glass: the current state of the art. Renew. Sustain. Energy Rev. 64, 211–236. doi:10.1016/j.rser.2016.06.012
Jannat, N., Latif Al-Mufti, R., Hussien, A., Abdullah, B., and Cotgrave, A. (2021). Utilisation of nut shell wastes in brick, mortar and concrete: a review. Constr. Build. Mater 293, 123546. doi:10.1016/j.conbuildmat.2021.123546
Juel, M. A. I., Mizan, A., and Ahmed, T. (2017). Sustainable use of tannery sludge in brick manufacturing in Bangladesh. Waste Manag. 60, 259–269. doi:10.1016/j.wasman.2016.12.041
Kadam, P. P., Maske, M. M., and Patil, S. N. (2024). “Development of eco-friendly paving blocks using waste plastic and construction demolition waste,” in AIP conf proc (American Institute of Physics). doi:10.1063/5.0221582
Kazmi, S. M. S., Munir, M. J., Wu, Y. F., Hanif, A., and Patnaikuni, I. (2018). Thermal performance evaluation of eco-friendly bricks incorporating waste glass sludge. J. Clean. Prod. 172, 1867–1880. doi:10.1016/j.jclepro.2017.11.255
Khan, M., and McNally, C. (2023). A holistic review on the contribution of civil engineers for driving sustainable concrete construction in the built environment. Dev. Built Environ. 16, 100273. doi:10.1016/j.dibe.2023.100273
Khokhar, S. A., Khan, A., Siddique, A., Khushnood, R. A., and Malik, U. J. (2023). A predictive mimicker for mechanical properties of eco-efficient and sustainable bricks incorporating waste glass using machine learning. Case Stud. Constr. Mater. 19, e02424. doi:10.1016/j.cscm.2023.e02424
Kizinievič, O., Kizinievič, V., Boris, R., Girskas, G., and Malaiškienė, J. (2018b). Eco-efficient recycling of drinking water treatment sludge and glass waste: development of ceramic bricks. J. Mater Cycles Waste Manag. 20, 1228–1238. doi:10.1007/s10163-017-0688-z
Kizinievič, O., Kizinievič, V., and Malaiškienė, J. (2018a). Analysis of the effect of paper sludge on the properties, microstructure and frost resistance of clay bricks. Constr. Build. Mater 169, 689–696. doi:10.1016/j.conbuildmat.2018.03.024
Korankye, P., and Danso, H. (2024). Properties of sandcrete blocks stabilized with cashew Apple ash as a partial replacement for cement. Sci. Rep. 14, 6804. doi:10.1038/s41598-024-55031-7
Kougnigan, A. M. J. N., Mwero, J., and Mutuku, R. (2023). Modeling of thermal performance and mechanical properties of concrete blocks incorporating plastic bottle waste with crushed clay bricks as coarse aggregates. Cogent Eng. 10. doi:10.1080/23311916.2023.2283334
Kuekham, P., Peeraphunkuldech, N., and Supakata, N. (2024). Paving blocks produced with crushed glass and high-density polyethylene: a case study of glass bottle and plastic waste management on Si Chang Island. Case Stud. Chem. Environ. Eng. 10, 100969. doi:10.1016/j.cscee.2024.100969
Kulkarni, P., Ravekar, V., Rama Rao, P., Waigokar, S., and Hingankar, S. (2022). Recycling of waste HDPE and PP plastic in preparation of plastic brick and its mechanical properties. Clean. Mater. 5, 100113. doi:10.1016/j.clema.2022.100113
Kumari, S., Kumar, A., Kumar, R., and Scholar, R. (2019). Comparative study of normal clay bricks. Fly Ash Bricks Pap. Bricks. Available online at: https://www.researchgate.net/publication/367541212.
Kumi-Larbi Jnr, A., Mohammed, L., Tagbor, T. A., Tulashie, S. K., and Cheeseman, C. (2023). Recycling waste plastics into plastic-bonded sand interlocking blocks for wall construction in developing countries. Sustain. Switz. 15, 16602. doi:10.3390/su152416602
Lee, H. S., Jung, S., Lin, K. Y. A., Kwon, E. E., and Lee, J. (2023). Upcycling textile waste using pyrolysis process. Sci. Total Environ. 859, 160393. doi:10.1016/j.scitotenv.2022.160393
Lizárraga-Mendiola, L., López-León, L. D., and Vázquez-Rodríguez, G. A. (2022). Municipal solid waste as a substitute for virgin materials in the construction industry: a review. Sustain. Switz. 14, 16343. doi:10.3390/su142416343
Lv, Y., Chang, N., Li, Y. Y., and Liu, J. (2021). Anaerobic co-digestion of food waste with municipal solid waste leachate: a review and prospective application with more benefits. Resour. Conserv. Recycl 174, 105832. doi:10.1016/j.resconrec.2021.105832
Makni, H., Khlif, M., Becquart, F., Abriak, N. E., and Bradai, C. (2021). Leaching test for assessing compliance with environmental requirements of fired clay bricks incorporated by deinking paper sludge. Constr. Build. Mater 289, 123155. doi:10.1016/j.conbuildmat.2021.123155
Makni, H., Khlif, M., and Bradai, C. (2024). Effect of deinking paper sludge on thermal, energetic, and mechanical properties of fired clay bricks. J. Mater. Civ. Eng. 36. doi:10.1061/jmcee7.mteng-18112
Małek, M., Kluczyński, J., Jasik, K., Kardaszuk, E., Szachogłuchowicz, I., Łuszczek, J., et al. (2024). An eco-friendly and innovative approach in building engineering: the production of cement–glass composite bricks with recycled polymeric reinforcements. Materials 17, 704. doi:10.3390/ma17030704
Mao, L., Guo, H., and Zhang, W. (2018). Addition of waste glass for improving the immobilization of heavy metals during the use of electroplating sludge in the production of clay bricks. Constr. Build. Mater 163, 875–879. doi:10.1016/j.conbuildmat.2017.12.177
Martínez, C., Cotes, T., and Corpas, F. A. (2012). Recovering wastes from the paper industry: development of ceramic materials. Fuel Process. Technol. 103, 117–124. doi:10.1016/j.fuproc.2011.10.017
Milu, M. S., Hashem, M. A., Payel, S., and Hasan, M. A. (2022). Leather buffing dust in brick production: solid waste management in tanneries. Case Stud. Constr. Mater. 17, e01625. doi:10.1016/j.cscm.2022.e01625
Mohanty, S., Saha, S., Santra, G. H., and Kumari, A. (2022). “Future perspective of solid waste management strategy in India,” in Handbook of solid waste management: sustainability through circular economy (Springer), 191–226.
Monish, K., Jesuran, J. J., and Kolathayar, S. (2021). “A sustainable approach to turn plastic waste into useful construction blocks,” in Lecture notes in civil engineering (Springer Science and Business Media Deutschland GmbH), 55–62. doi:10.1007/978-981-15-5001-0_5
Munir, M. J., Kazmi, S. M. S., Gencel, O., Ahmad, M. R., and Chen, B. (2021). Synergistic effect of rice husk, glass and marble sludges on the engineering characteristics of eco-friendly bricks. J. Build. Eng. 42, 102484. doi:10.1016/j.jobe.2021.102484
Muñoz, P., Letelier, V., Bustamante, M. A., Marcos-Ortega, J., and Sepúlveda, J. G. (2020a). Assessment of mechanical, thermal, mineral and physical properties of fired clay brick made by mixing kaolinitic red clay and PPRs. Appl. Clay Sci. 198. doi:10.1016/j.clay.2020.105847
Muñoz, P., Letelier, V., Muñoz, L., and Bustamante, M. A. (2020c). Adobe bricks reinforced with paper and pulp wastes improving thermal and mechanical properties. Constr. Build. Mater 254, 119314. doi:10.1016/j.conbuildmat.2020.119314
Muñoz, P., Letelier, V., Zamora, D., and Morales, M. P. (2020b). Feasibility of using PPRs into fired clay bricks. J. Clean. Prod. 262. doi:10.1016/j.jclepro.2020.121464
Murmu, A. L., and Patel, A. (2018). Towards sustainable bricks production: an overview. Constr. Build. Mater 165, 112–125. doi:10.1016/j.conbuildmat.2018.01.038
Nanda, S., and Berruti, F. (2021a). Municipal solid waste management and landfilling technologies: a review. Environ. Chem. Lett. 19, 1433–1456. doi:10.1007/s10311-020-01100-y
Nanda, S., and Berruti, F. (2021b). Thermochemical conversion of plastic waste to fuels: a review. Environ. Chem. Lett. 19, 123–148. doi:10.1007/s10311-020-01094-7
Norhayati, A. W., Suraya Hani, A., Abdul Hadi Izaan, I., Mazizah Ezdiani, M., Mohamad Hairi, O., Zalipah, J., et al. (2023). “Properties of cement bricks containing sago fine waste (SFW) with different water-cement ratio,” in IOP conf ser Earth environ sci, institute of physics. doi:10.1088/1755-1315/1205/1/012050
O, A. J., and Fop, O. (2017). Investigating the effect of eggshell ash on the properties of sandcrete block. Available online at: www.eajournals.org.
Olamoju, O., Afolayan, R. O., and Taiye, A. (2023). Partial replacement of coarse aggregates with plastic waste in paver blocks. Orig. Article J. Sustain. Environ. Manag. 2, 92–97. doi:10.3126/josem.v2i2.55201
Olofinnade, O., and Adeyinka, O. (2024). The utilization of pulverized waste tire rubber in a soil–cement composite for sustainable compressed Earth brick production. Discov. Civ. Eng. 1, 69. doi:10.1007/s44290-024-00075-x
Oriyomi, O. M., David, O. A., and Jamal, K. M. (2025). Strength and stiffness properties of the optimum mix composition of Cement-less Wastepaper-based lightweight block (CWLB),
Ospina Salazar, A. M., Valencia Isaza, A., Restrepo Montoya, J. W., Mejía Arcila, J. M., and Valencia García, M. F. (2023). Upcycling fly ash, red clay brick waste, and paper sludge as feedstock for manufacturing a lightweight extruded composite: design and characterization. Buildings 13, 2291. doi:10.3390/buildings13092291
Ozturk, S., Sutcu, M., Erdogmus, E., and Gencel, O. (2019). Influence of tea waste concentration in the physical, mechanical and thermal properties of brick clay mixtures. Constr. Build. Mater 217, 592–599. doi:10.1016/j.conbuildmat.2019.05.114
Phonphuak, N., Kanyakam, S., and Chindaprasirt, P. (2016). Utilization of waste glass to enhance physical-mechanical properties of fired clay brick. J. Clean. Prod. 112, 3057–3062. doi:10.1016/j.jclepro.2015.10.084
Rahmi, S. T., Amelya, M., and Aisya, R. (2025). Utilization of PET plastic waste as an environmentally friendly paving block material. doi:10.54482/ATMOSPHERE/
Rauniyar, A., Nakrani, R. K., Narpala, S. R., and Arun, S. (2024). An evaluation of the use of plastic waste in the manufacture of plastic bricks. Discov. Civ. Eng. 1, 43. doi:10.1007/s44290-024-00045-3
Raut, S. P., Sedmake, R., Dhunde, S., Ralegaonkar, R. V., and Mandavgane, S. A. (2012). Reuse of recycle paper mill waste in energy absorbing light weight bricks. Constr. Build. Mater 27, 247–251. doi:10.1016/j.conbuildmat.2011.07.053
Robleh, A. O., Koteng, D. O., and Kabubo, C. K. (2021). Effect of plastic bottle arrangement on the performance in self-compacting concrete block. Int. J. Civ. Eng. 8, 7–13. doi:10.14445/23488352/ijce-v8i9p102
Sahani, K., Joshi, B. R., Khatri, K., Magar, A. T., Chapagain, S., and Karmacharya, N. (2022). Mechanical properties of plastic sand brick containing plastic waste. Adv. Civ. Eng. 2022. doi:10.1155/2022/8305670
Saikia, N., and De Brito, J. (2012). Use of plastic waste as aggregate in cement mortar and concrete preparation: a review. Constr. Build. Mater 34, 385–401. doi:10.1016/j.conbuildmat.2012.02.066
Sarkar, R., Kurar, R., Gupta, A. K., Mudgal, A., and Gupta, V. (2017). Use of paper mill waste for brick making. Cogent Eng. 4, 1405768. doi:10.1080/23311916.2017.1405768
Sarwar, S., Shaibur, M. R., Hossain, M. S., Hossain, M. R., Ahmmed, I., Ahmed, F. F., et al. (2023). Preparation of environmental friendly plastic brick from high-density polyethylene waste. Case Stud. Chem. Environ. Eng. 7, 100291. doi:10.1016/j.cscee.2022.100291
Sathiparan, N., Anburuvel, A., Selvam, V. V., and Vithurshan, P. A. (2023). Potential use of groundnut shell ash in sustainable stabilized Earth blocks. Constr. Build. Mater 393, 132058. doi:10.1016/j.conbuildmat.2023.132058
Schmitt-Harsh, M. L., and Wiseman, E. (2020). Household perceptions and practices of recycling tree debris from residential properties. Sustain. Switz. 12, 6476. doi:10.3390/su12166476
Shi, C., and Zheng, K. (2007). A review on the use of waste glasses in the production of cement and concrete. Resour. Conserv. Recycl 52, 234–247. doi:10.1016/j.resconrec.2007.01.013
Shibib, K. S. (2015). Effects of waste paper usage on thermal and mechanical properties of fired brick. Heat Mass Transfer/Waerme- Und Stoffuebertragung 51, 685–690. doi:10.1007/s00231-014-1438-6
Silva de Souza Lima Cano, N., Iacovidou, E., and Rutkowski, E. W. (2022). Typology of municipal solid waste recycling value chains: a global perspective. J. Clean. Prod. 336, 130386. doi:10.1016/j.jclepro.2022.130386
Singh, A., Srivastava, A. K., Singh, G., Singh, A. D., Singh, H. K., Kumar, A., et al. (2023). Utilization of plastic waste for developing composite bricks and enhancing mechanical properties: a review on challenges and opportunities. Adv. Polym. Technol. 2023, 1–24. doi:10.1155/2023/6867755
Singh, R. J., Raut, A., Murmu, A. L., and Jameel, M. (2021). Influence of glass powder incorporated foamed geopolymer blocks on thermal and energy analysis of building envelope. J. Build. Eng. 43, 102520. doi:10.1016/j.jobe.2021.102520
Singh, S. K., Kulkarni, S., Kumar, V., and Vashistha, P. (2018). Sustainable utilization of deinking paper mill sludge for the manufacture of building bricks. J. Clean. Prod. 204, 321–333. doi:10.1016/j.jclepro.2018.09.028
Sodupe-Ortega, E., Fraile-Garcia, E., Ferreiro-Cabello, J., and Sanz-Garcia, A. (2016). Evaluation of crumb rubber as aggregate for automated manufacturing of rubberized long hollow blocks and bricks. Constr. Build. Mater 106, 305–316. doi:10.1016/j.conbuildmat.2015.12.131
Soni, A., Das, P. K., Hashmi, A. W., Yusuf, M., Kamyab, H., and Chelliapan, S. (2022). Challenges and opportunities of utilizing municipal solid waste as alternative building materials for sustainable development goals: a review. Sustain Chem. Pharm. 27, 100706. doi:10.1016/j.scp.2022.100706
Sory, N., Ouedraogo, M., Messan, A., Sanou, I., Sawadogo, M., Jeremy Ouedraogo, K., et al. (2022). Mechanical, thermal and hydric behavior of the bio-sourced compressed Earth block (B-CEB) added to peanut shells powder. Adv. Mater. 11, 1. doi:10.11648/j.am.20221101.11
Suasnabar, E. H. A., Durand, F. J. V., Silvera, E. R. L., Cumpa, R. O., Saldaña, T. E., and Benites-Alfaro, E. (2023). Ferrous and polyethylene terephthalate waste in the production of ecological bricks: characterization. Chem. Eng. Trans. 101, 205–210. doi:10.3303/CET23101035
Subhani, H. A., Khushnood, R. A., and Shakeel, S. (2024). Synthesis of recycled bricks containing mixed plastic waste and foundry sand: physico-Mechanical investigation. Constr. Build. Mater 416, 135197. doi:10.1016/j.conbuildmat.2024.135197
Sutcu, M., Del Coz Díaz, J. J., Álvarez Rabanal, F. P., Gencel, O., and Akkurt, S. (2014). Thermal performance optimization of hollow clay bricks made up of paper waste. Energy Build. 75, 96–108. doi:10.1016/j.enbuild.2014.02.006
Sutcu, M., Ozturk, S., and Gencel, O. (2023). Synergic effect of recycled paper sludge and expanded perlite on the engineering properties of porous clay bricks: a new mathematical modelling approach. Constr. Build. Mater 370, 130450. doi:10.1016/j.conbuildmat.2023.130450
Tangboriboon, N. (2019). Alternative green foam glass manufactured in brick form using bio-waste materials from food industries. Available online at: https://www.researchgate.net/publication/338139267.
Taurino, R., Ferretti, D., Cattani, L., Bozzoli, F., and Bondioli, F. (2019). Lightweight clay bricks manufactured by using locally available wine industry waste. J. Build. Eng. 26, 100892. doi:10.1016/j.jobe.2019.100892
Tayeh, B. A., Ahmed, S. M., and Hafez, R. D. A. (2023). RETRACTED: sugarcane pulp sand and paper grain sand as partial fine aggregate replacement in environment-friendly concrete bricks. Case Stud. Constr. Mater. 18, e01612. doi:10.1016/j.cscm.2022.e01612
Teacă, C. A., Shahzad, A., Duceac, I. A., and Tanasă, F. (2023). The Re-/Up-Cycling of wood waste in wood–polymer composites (WPCs) for common applications. Polym. (Basel) 15, 3467. doi:10.3390/polym15163467
Tempa, K., Chettri, N., Thapa, G., Gyeltshen, C., Norbu, D., Gurung, D., et al. (2022). An experimental study and sustainability assessment of plastic waste as a binding material for producing economical cement-less paver blocks. Eng. Sci. Technol. Int. J. 26, 101008. doi:10.1016/j.jestch.2021.05.012
Thakur, A., Senthil, K., and Singh, A. P. (2022). Evaluation of concrete bricks with crumb rubber and polypropylene fibres under impact loading. Constr. Build. Mater 315, 125752. doi:10.1016/j.conbuildmat.2021.125752
Torres de Rosso, L., and Victor Staub de Melo, J. (2020). Impact of incorporating recycled glass on the photocatalytic capacity of paving concrete blocks. Constr. Build. Mater 259, 119778. doi:10.1016/j.conbuildmat.2020.119778
Tulashie, S. K., Boadu, E. K., Kotoka, F., and Mensah, D. (2020). Plastic wastes to pavement blocks: a significant alternative way to reducing plastic wastes generation and accumulation in Ghana. Constr. Build. Mater 241, 118044. doi:10.1016/j.conbuildmat.2020.118044
Turgut, P., and Yesilata, B. (2008). Physico-mechanical and thermal performances of newly developed rubber-added bricks. Energy Build. 40, 679–688. doi:10.1016/j.enbuild.2007.05.002
Utilization of waste papers to produce ecofriendly bricks (2016). Int. J. Sci. Res. (IJSR) 5 92–96. doi:10.21275/art2016792
Uvarajan, T., Gani, P., Chuan, N. C., and Zulkernain, N. H. (2022). Reusing plastic waste in the production of bricks and paving blocks: a review. Eur. J. Environ. Civ. Eng. 26, 6941–6974. doi:10.1080/19648189.2021.1967201
Vieira, C. M. F., Pinheiro, R. M., Rodriguez, R. J. S., Candido, V. S., and Monteiro, S. N. (2016). Clay bricks added with effluent sludge from paper industry: technical, economical and environmental benefits. Appl. Clay Sci. 132–133, 753–759. doi:10.1016/j.clay.2016.07.001
Wang, Q., Ko, J. H., Liu, F., and Xu, Q. (2021). Leaching characteristics of heavy metals in MSW and bottom ash co-disposal landfills. J. Hazard Mater 416, 126042. doi:10.1016/j.jhazmat.2021.126042
Xin, Y., Robert, D., Mohajerani, A., Tran, P., and Pramanik, B. K. (2023). Utilizing rejected contaminants from the paper recycling process in fired clay brick production. Constr. Build. Mater 409, 134031. doi:10.1016/j.conbuildmat.2023.134031
Yaras, A. (2020). Combined effects of paper mill sludge and carbonation sludge on characteristics of fired clay bricks. Constr. Build. Mater 249, 118722. doi:10.1016/j.conbuildmat.2020.118722
Yuan, X., Tang, Y., Li, Y., Wang, Q., Zuo, J., and Song, Z. (2018). Environmental and economic impacts assessment of concrete pavement brick and permeable brick production process - a case study in China. J. Clean. Prod. 171, 198–208. doi:10.1016/j.jclepro.2017.10.037
Zhang, Z., Wong, Y. C., Arulrajah, A., and Horpibulsuk, S. (2018). A review of studies on bricks using alternative materials and approaches. Constr. Build. Mater 188, 1101–1118. doi:10.1016/j.conbuildmat.2018.08.152
Zhang, Z., Wong, Y. C., Sofi, M., and Mendis, P. (2022). Incorporation of glass and plastic waste into alkali-activated mill residue bricks. Sustain. Switz. 14, 16533. doi:10.3390/su142416533
Zheng, L., Wu, H., Zhang, H., Duan, H., Wang, J., Jiang, W., et al. (2017). Characterizing the generation and flows of construction and demolition waste in China. Constr. Build. Mater 136, 405–413. doi:10.1016/j.conbuildmat.2017.01.055
Zhong, X., Hu, M., Deetman, S., Steubing, B., Lin, H. X., Hernandez, G. A., et al. (2021). Global greenhouse gas emissions from residential and commercial building materials and mitigation strategies to 2060. Nat. Commun. 12, 6126. doi:10.1038/s41467-021-26212-z
Glossary
ASTM American society for testing and materials
LDPE Low-density polyethylene
BD Bulk density
MPa Megapascal
CAA Cashew apple ash
MSW Municipal solid waste
CF Cellulose fiber
PMS Paper mill sludge
CP Cassava peel
PP Polypropylene
CR Crumb rubber
PPR Paper pulp residue
CS Compressive strength
PS Paper sludge
DPMS Deinking paper mill sludge
PVC Polyvinyl chloride
EP Eggshell powder/expanded perlite (context-dependent)
RPS Recycled paper sludge
EPS Expanded polystyrene
SCG Spent coffee grounds
ESA Eggshell ash
SMM Spent mushroom material
FS Flexural strength
SPW Sludge paper wastewater
FW Food waste
STS Split tensile strength
GS Grape seeds
TW Tea waste
HDPE High-density polyethylene
WA Water absorption
KP Kaolinitic paper pulp
WL Wine lees
LCA Life cycle assessment
WPA Waste paper aggregate
Keywords: municipal solid waste, waste management, sustainable construction, masonry bricks, building materials, circular economy, waste utilization, physico-mechanical properties
Citation: Nikmah NW, Abdullah M, Khan S, Mohamed MA and Al-Fakih A (2025) A comprehensive review of the physico-mechanical properties of masonry units incorporating municipal solid waste. Front. Built Environ. 11:1621305. doi: 10.3389/fbuil.2025.1621305
Received: 30 April 2025; Accepted: 23 July 2025;
Published: 21 August 2025.
Edited by:
Saubhagya Kumar Panigrahi, Veer Surendra Sai University of Technology, IndiaReviewed by:
Amir Ali Shahmansouri, Washington State University, United StatesXiaochao Tang, Widener University, United States
Copyright © 2025 Nikmah, Abdullah, Khan, Mohamed and Al-Fakih. This is an open-access article distributed under the terms of the Creative Commons Attribution License (CC BY). The use, distribution or reproduction in other forums is permitted, provided the original author(s) and the copyright owner(s) are credited and that the original publication in this journal is cited, in accordance with accepted academic practice. No use, distribution or reproduction is permitted which does not comply with these terms.
*Correspondence: Amin Al-Fakih, YW1pbmFsaS5mYWtpaEBrZnVwbS5lZHUuc2E=