 Xiaoxi Jiang
 Yang Yang
- 1School of Highway, Chang′an University, Xi′an, China
- 2Design Institute III, China Airport Planning & Design Institute Co., Ltd., Beijing, China
Introduction: With the rapid growth of airport traffic, runway crossings bring about more severe efficiency losses and safety risks. End-Around Taxiways (EATs) have been introduced in some international hub airports, but their design and layout remain contentious.
Methods: This research takes Jinan Yaoqiang International Airport as a case to find the best EATs layout, considering site conditions, operational efficiency, and cost-benefit. First, it sums up EATs classifications and constraints, analyzing the airport’s master plan and site limitations. Then, models for taxiing distance, time, and fuel consumption under different EAT setups are established. Multiple EAT schemes are compared in terms of operation and economy.
Results and discussion: Results show that a 555-m EAT for Category C aircraft is the best choice for the current construction phase, meeting operations needs while cutting costs and fuel use. In conclusion, EAT design should balance technical requirements with factors like taxiing efficiency, fuel consumption, and investment to achieve airport sustainability. Future studies can optimize EATs via simulation and modeling.
1 Introduction
Since the 1980s, international hub airports have transitioned from intersecting to predominantly parallel runway layouts (LI Na, 2023). While this shift has made aircraft transfers between runways routine, it has also raised safety concerns due to runway incursion risks and reduced efficiency (Satyamurti, 2007). Traditional runway crossing methods involve complex interactions among aircraft, equipment, air traffic controllers, and ground vehicles, which can lead to human errors and incursion incidents (FAA, 2010; Kazda and Caves, 2017).
To address these challenges, major airports like Dallas, Atlanta, Detroit, Miami in the US, and Frankfurt in Europe began constructing End-Around Taxiways (EATs) in the early 20th century (Dönmez, 2024). EATs provide a dedicated path for aircraft to move from the runway to the apron without interfering with departing aircraft, thereby increasing runway capacity and reducing incursion risks (McNerney and Heinold, 2011; Uday et al., 2011; Chao, 2018; Dunlay and Xu, 2018). For instance, EAT implementation at Dallas/Fort Worth International Airport has reduced runway incursions by 40%, and they are widely used during peak hours at Atlanta Airport with utilization rates exceeding 50% (Feng, 2020; Feng and Johnson, 2021).
However, EAT construction remains controversial due to its land-intensive nature and potential to increase taxiing distances, negatively impacting taxiing efficiency. Previous research has mainly focused on EAT existence and utilization but lacks guidance on integrating EAT construction with operational demands and site conditions (Chen et al., 2025). Specifically, decision-making frameworks for EAT layout considering factors such as aircraft type, taxiing efficiency, and fuel consumption are insufficient. Existing EAT design guidelines do not specify design factors or provide recommended models, leading to significant global diversity in EAT designs with considerable variations in occupied areas and taxiing distances.
This study aims to fill these gaps by developing a systematic design framework for EATs, using Jinan Yaoqiang Airport’s EAT construction as a case study.
• Site conditions and airport requirements analyzing
Site and airport requirements analysis encompasses assessing the airport’s operational characteristics, design aircraft types, and takeoff/landing frequencies. It also scrutinizes site topography, drainage, and other constraints, and evaluates EAT classifications per ICAO standards, including shelter methods, approach light restrictions, and takeoff climb and approach surface limitations.
• EAT Model Construction and Parameter Assumptions
EAT model construction with parameter assumptions simplifies runway usage patterns and aircraft types to meet the requirements of the airport’s main design aircraft, clarifies the primary operational mode, and establishes the main EAT model.
• Lifecycle Cost Analysis Model Development
The cost - benefit analysis of different models considers taxiing distance, fuel consumption, emissions, and other factors from a lifecycle perspective to identify the most cost - effective solution.
Overall, this study provides a reference for developing EATdesign framework at other airports, promoting more efficient, environmentally friendly, and economically viable airport operations.
2 Research methodology
2.1 Classification and constraints requirements for end-around taxiway construction
When considering the interaction between aircraft operating on End - Around Taxiways (EATs) and those either taking off or landing on the runway, especially during go - around maneuvers, EATs can be categorized into three distinct types: Back - around Taxiways (BATs), Runway End - Around Taxiways (REATs), and Start - Around Taxiways (SATs). This classification method is highly favored in practical airport planning and design as it furnishes more explicit operational guidelines for the taxiway system (Zheng, 2015; Jiang and Hao, 2024).
BAT (Back - around Taxiways): These are situated behind the takeoff point of the runway. This strategic placement ensures that departing aircraft have no direct visual contact with the taxiing planes. For aircraft on the BAT, the main consideration is the potential impact of the jet blast from departing aircraft (Jiang and Hao, 2024). The jet blast wind speed of 56 km/h is tolerable for people, vehicles, or other movable devices (FAA, 2015). Only a few aircraft like the B747-8 and B777-200 require distances greater than 450 m (Pro, 2024). However, it should be taken into consideration that after the aircraft enters the runway, the takeoff starting point is typically situated about 70–80 m away from the runway threshold. The aircraft requires a certain distance to prepare for takeoff and reach full power. Given this, a length ranging from 350 to 385 m is generally deemed sufficient to stay within the jet blast safety limit, and it is currently being utilized at airports such as Beijing Daxing airport.
REAT (Runway End - Around Taxiway Mode): REATs are located in front of the departing runway end and the associated safety zone, also known as the “far-end of departing runway around taxiway.” Design considerations for REATs include the climb surface and the ILS (Instrument Landing System) lighting system. REAT is a proven and safe mode and is currently utilized at airports such as ATL, DFW, and DTW (Satyamurti and Mattingly, 2007; Fala et al., 2014).
SAT Mode (Start - Around Taxiway): Also known as the “near - end of landing runway around taxiway,” SATs involve taxiing around the area before the runway entrance, enabling normal aircraft landings. In comparison to REATs and BATs, the construction of SATs requires considering a broader range of factors, including the approach surface, lighting, and navigation systems. Initially, due to concerns about the impact of SATs on approaching aircraft, the FAA did not recommend this type. However, it is worth noting that the 2023 draft AC 150/5300 - 13B- Airport Design (FAA, 2020) now provides design guidance for EATs, including SATs, under the approach surface conditions.
A classification of EAT types worldwide was conducted based on EAT elevation and the elevation difference between EAT and runway ends. Airports are represented by their codes specified by the International Air Transport Association (IATA). Table 1 presents the classification results.
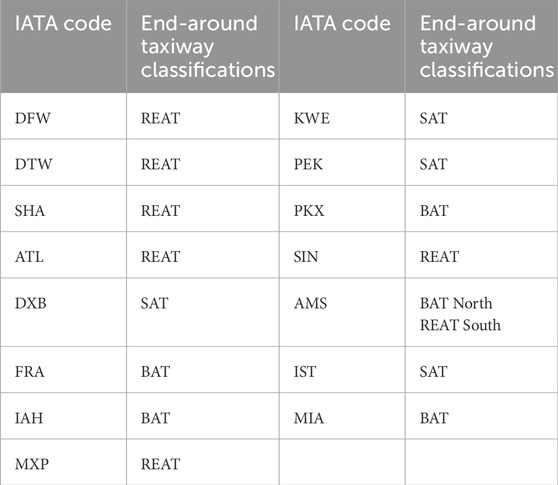
Table 1. Classification of major end-around taxiways worldwide.
2.2 Jinan Yaoqiang international airport master plan
Jinan Yaoqiang International Airport serves as the provincial capital airport of Shandong Province, China. The overall plan of Jinan Airport sets 2030 as the near - term target year and 2050 as the long - term target year. In the near - term, it is planned to handle 50 million passenger throughput, 500,000 tons of cargo and mail throughput, and 383,000 aircraft takeoffs and landings. In the long - term, it is planned to handle 80 million passenger throughput, 1.5 million tons of cargo and mail throughput, and 593,000 aircraft takeoffs and landings. The airport adopts a central terminal area layout. The main landing direction is from south to north, with a ratio of main to secondary landings of 5:4. Figure 1 shows the 2030 planning map of Jinan Yaoqiang Airport.
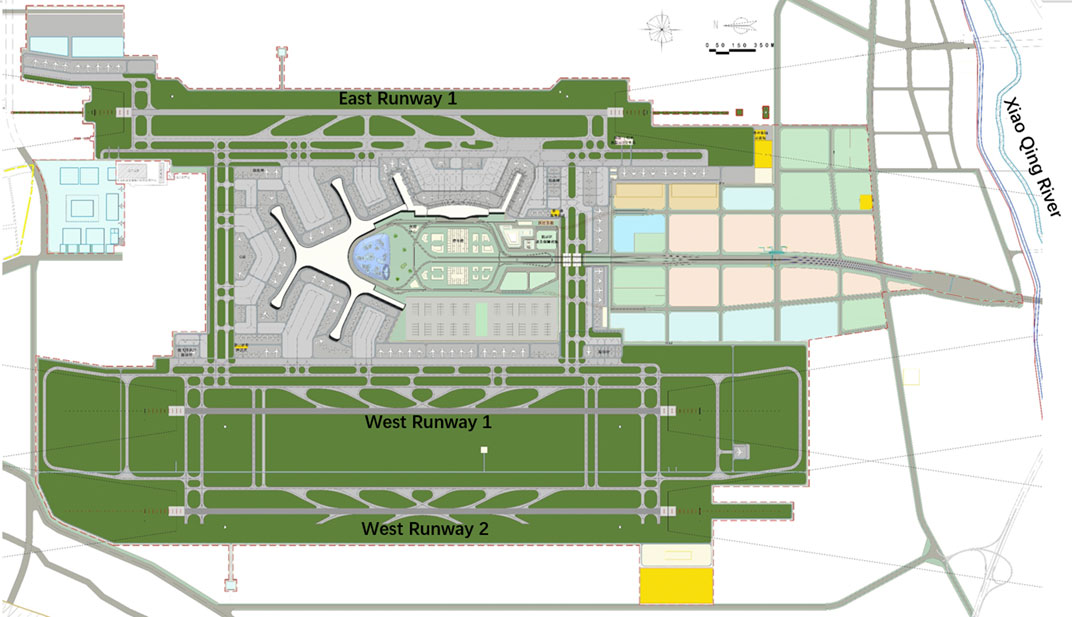
Figure 1. Planning map of Jinan Yaoqiang international airport in 2030.
For the near - term project, two medium - spaced runways with a spacing of 760 m are planned to be constructed in the west airfield area. A set (two) of end - around taxiways (EATs) are planned on both the south and north sides of the West Runway 1. West Runway 1 is located 2,260 m west of the existing runway (East Runway 1). The runway is 3,600 m in length and 45 m in width, and is constructed to the 4F - class standard. The runway number is 18L - 36R. The southern end of West Runway 1 is equipped with a Category III precision approach lighting system, and the runway entrance on the south side is relocated 180 m inwards. The northern end of West Runway 1 is equipped with a Category I precision approach lighting system. Both the north and south ends of West Runway 2 are equipped with Category I precision approach lighting systems. The predicted aircraft type proportions for 2030 operations are shown in Table 2.
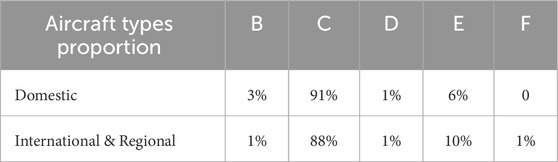
Table 2. Forecast of aircraft type proportions for 2030.
For the long - term target year of 2050, an East Second Runway will be added to the east of the existing east runway. A new terminal will be newly built to the south of the newly - constructed terminal.
2.3 Site restriction conditions
2.3.1 Topographic and geomorphic conditions
The study site is located within the Yellow River alluvial plain, presenting a predominantly flat topography. Elevations across the site typically range from 20 to 23 m. The terrain design is crafted in strict accordance with the principle of comprehensive earthwork equilibrium throughout the entire area. In the airfield zone, the filling and excavation activities are predominantly confined within a range of ±1 m. Through precise earthwork balance calculations, the elevation of the entire length of West Runway 1 is determined to be 24 m.
The site area pertains to a Quaternary - period modern alluvial plain of the Yellow River. The shallow - lying soil layers within the site are primarily composed of silt, which is notoriously difficult to compact. Foundation treatment mainly encompasses dynamic compaction techniques and replacement - filling methods. Due to the site area’s close adjacency to the above - ground stretch of the Yellow River, the groundwater table is relatively high. Groundwater - level data obtained from the end - around taxiway (EAT) regions indicate that the highest groundwater level in the northern EAT reaches 20.64 m. The southern EAT, being at a greater distance from the Yellow River, exhibits a marginally lower water level.
Airport flood - control measures rely on the coordinated protection provided by the Yellow River levee and the Xiaoqing River levee. Given that the Yellow River is an above - ground river, the airport’s storm water cannot be directly discharged into it. Instead, the airport’s storm water is channeled through the internal drainage network of the airport, passing beneath the South - to - North Water Diversion Main Canal before ultimately reaching the Xiaoqing River. The self - drainage water level is relatively elevated, thereby complicating the drainage process. Consequently, pump stations are necessary at certain outlets. Based on site - measurement data, the water - level elevation at the outlet of the northern EAT is 21.1 m, and that at the outlet of the southern EAT is 21.0 m. In the airfield drainage system, the designed water - surface elevation for a 5 - year recurrence interval is uniformly set at 21.3 m in both the northern and southern EAT regions (Lingling, 2024).
2.3.2 Airfield drainage
The minimum controlled elevation of the end - around taxiways (EATs) is calculated based on the groundwater level. Jinan Airport is located in a seasonally frozen - ground region. When designing the terrain of the site area, it is necessary to consider avoiding damage to the pavement caused by the freeze - thaw cycle of groundwater. Taking the northern EAT as an example, the elevation is calculated according to the flood - control requirements and the self-drainage water level. To meet the airport’s flood - control requirements for a 50-year recurrence interval and ensure the self - drainage of rainwater in the EAT area, considering the cross-slope requirements of the pavement and drainage ditches, the elevation should be no less than 21.3 + 0.5 = 21.8 (m). In summary, the minimum elevation of both the northern and southern EATs is determined to be 22 m. If this elevation requirement is met, there is no need to take measures to deal with groundwater and rainwater, and the height of earthwork filling and excavation in the EAT area is relatively small.
2.4 Limiting requirements in EATs design
2.4.1 Appendix 14 obstacle limitation surfaces (ILS surfaces)
The REAT is mainly utilized in front of the aircraft that is about to depart. The takeoff climb surface acts as the principal limitation surface for restrictive factors. Along the direction of the runway extension centerline, the main limiting factors consist of a limitation surface that commences 60 m from the end of the runway with a gradient of 2% (ICAO, 2022b).
BAT mode, as the aircraft taxis behind the departing one, there is no need to consider the obstacle - limitation surface. Instead, only the impact of the aircraft jet blast from the departing aircraft on the aircraft taxiing on the end - around taxiways (EATs) needs to be taken into account. Based on the analysis of BAT application cases and relevant research, when the distance between the BATs and the runway entrance exceeds 350m, the impact of the aircraft jet blast can be largely mitigated (Jiang and Hao, 2024).
2.4.2 Terrain-shielding
Visual impediments are an integral part of REAT operations. When the taxiing aircraft crosses in front of the departing aircraft, visual separators are needed between the runway end and REAT to block the view of aircraft on the REAT from the pilots.
FAA pioneered research into visual screens, guidance on siting and implementing visual screens was finally provided in AC150/5300-13B (FAA, 2020).
The guidelines set forth the dimensions and locations of metal visual shielding structures. The core principle is that when pilots are maneuvering the aircraft for takeoff, at a position equivalent to one - quarter of the runway length, they will not mistakenly identify the aircraft on the end - around taxiway as an obstacle, and the parts of the aircraft below the engine will be out of their sight. However, metal visual shielding structures may have an impact on ILS (Instrument Landing System) signals, radar signals, and so on. Therefore, it is essential to assess the potential impacts they might cause (James and Patterson, 2007; Yuan et al., 2020).
As large - scale metal reflectors, metal visual shielding screens, due to their metallic nature and impact on signals, need to be placed outside the ILS critical and sensitive areas. At this site, the north side of the runway is equipped with Category III precision approach. The critical area of the localizer beacon is 300 m (distance from the runway end) (CAAC, 2014), and the sensitive area extends beyond 500 m (distance from the runway end) (FAA, 2020; Tianqi et al., 2021). Consequently, the end - around taxiway needs to be pushed further away (from the runway end), resulting in a longer taxiing distance.
Taking into account the aforementioned factors, as an integral part of the end - around taxiway setup, the metal shielding structure restricts the inward - pushing of the end - around taxiway in terms of planar position and simultaneously increases the complexity of the end - around taxiway design. In this study, the terrain - shielding method described in FAA AC150/5300 - 13B was adopted. By adjusting the terrain height between the runway and the end - around taxiway, and gradually “raising” the height (while ensuring compliance with the slope requirements of the entire runway safety area), the objective of “shielding” was achieved.
In fact, considering only the construction cost, the cost of metal shielding structures is about 31.5 million yuan, based on the cost of metal shielding structures at Shanghai Hongqiao Airport in China. In contrast, when considering earthwork shielding structures, the volume of earthwork is limited, and the cost will be significantly reduced.
• Selection of Shielding point Location
According to relevant regulations, the lateral and longitudinal slope changes in the critical area should be within ±1%, with a smooth transition (CAAC, 2014). Achieving terrain shielding is difficult within this range. In this study, for the REAT plan, the slope change point was set 300 m from the ILS beacon critical zone (from the runway end), considering approach light spacing, at 330 m from the runway end. The closer the shielding position to the runway end, the better the shielding effect and the smaller the required shielding size. Terrain shielding is better than metal shielding because metal objects affect signals more and require considering a larger sensitive area, whereas terrain shielding only needs to consider the critical zone restrictions.
• Calculation of Shielding Point Elevation
The calculation of the shielding point elevation is carried out using the formula provided in FAA AC150/5300-13B (FAA, 2020).
Where:
HEYE = Height of the pilot’s eye above the runway.
HNACELLE = Height of the engine nacelle above the taxiway.
ELEVEAT = MSL elevation of the centerline of the EAT.
DEAT = Distance from the departure end of the runway to the screen.
LRWY = Length of the runway.
ELEVGAS = MSL elevation of the ground at screen.
Calculation parameters: The pilot’s line of sight height is 8.85 m. The shielding height of the engine is 2.75 m for Category C aircraft and 5.49 m for code E aircraft.
2.4.3 Site slope change requirements
The unpaved area in the airfield area should comply with the requirements that the slope of the runway end safety area should not exceed 5% and the slope of the ILS critical area should not exceed ±1%. Meanwhile, the ground elevation should meet the requirements of the light core elevation. The longitudinal slope of the end - around taxiway should not exceed 1.5% (CAAC, 2014).
2.4.4 Approach lighting system
The elevation requirements for the approach lighting system should be met. For Category I precision approach systems, within 300 m from the runway threshold, the light center of the lighting fixtures can have an ascending or descending slope of no more than 1:66. Beyond 300 m from the runway threshold, the light center can have an ascending slope of no more than 1:66 or a descending slope of no more than 1:40.
For Category III precision approach systems, within 450 m from the runway threshold, the light center of the lighting fixtures can have an ascending slope of no more than 1:66, but there should be no descending slope. Beyond 450 m from the runway threshold, the light center can have an ascending slope of no more than 1:66 or a descending slope of no more than 1:40 (FAA, 2018; CAAC, 2021).
The north end of Jinan Yaoqiang Airport is equipped with a Category I precision approach system, while the south end is equipped with a Category III precision approach system.
2.4.5 Visibility requirements
The end - around taxiways and obstructions should meet the visibility requirements for both the runway and the control tower.
Runway Visibility: From any point 3.0 m above the runway, it should be possible to see any other point 3.0 m above the runway within at least half the length of the runway (CAAC, 2021).
Control Tower Visibility: The control tower officers should be able to clearly see the key points and key targets (such as aircraft and vehicles) within the airport’s activity area, and they should not be obscured by objects (CAAC, 2020).
3 Model establishment and parameter assumptions
3.1 Parameter assumptions
3.1.1 The outer runway is designated for landing operations, while the inner runway is utilized for takeoffs
This operational configuration stands as the primary mode for a set of closely - spaced parallel runways. Although research has been conducted on the alternative mode of using the outer runway for takeoffs and the inner runway for landings (Feng, 2020), this arrangement is not employed internationally due to several critical drawbacks. When aircraft take off from the outer runway, they are required to taxi a considerable distance with full fuel loads, leading to excessive fuel consumption. Moreover, all departing aircraft must cross the inner runway, which is used for landings. This necessitates a more comprehensive assessment of the impact of taxiing on the approach surface of the inner runway. The approach surface is more stringent than the takeoff climb surface, and it also imposes greater stress on pilots.
3.1.2 Aircraft type simplification
Predicted data serves as the foundation for overall airport planning. For end - around taxiways (EATs), both the number of runway operations and the proportion of aircraft types are key factors in design. It is noteworthy that the predicted proportion of Category E aircraft at Jinan Yaoqiang International Airport are relatively low. This provides a certain possibility for the planning of EATs. The gradual discontinuation of Category D aircraft, along with the discontinuation of Category F aircraft such as the A380 and B747 - 8, implies that over - considering Category F aircraft is uneconomical.
To compare the taxiing efficiency of different schemes, the airport was simplified by no longer considering Category D and Category F aircraft. According to Table 2, by 2030, the ratio of Category C to Category E aircraft is 9:1. Therefore, the planning is based on the assumption that 90% of the aircraft are Category C. To intuitively compare the fuel consumption of different schemes, Category C and Category E aircraft were further concretized, with only typical models of Category C and Category E aircraft selected for fuel consumption calculations.
The ICAO Engine Emissions Databank provides specific information on the fuel consumption rates for all engines. However, fuel consumption is just a relative indicator for comparing EATs. Since only the differences between different schemes need to be compared, the aircraft types were simplified during the fuel consumption calculation to reduce the complexity of the calculation.
Figure 2 shows the number of operations of different aircraft types by all airlines in China in February 2024 (the month of the Chinese traditional festival Spring Festival, which is generally considered a peak travel month). Among them, narrow - body aircraft are mainly represented by Category C aircraft. According to the frequency of operations, the B737 - 800 and A320 were selected as the main representatives of Category C aircraft. To form comparable data, the basis for all model establishment is a 1:1 ratio of Category C aircraft B737 - 800 and A320. For wide - body aircraft, the A330 was selected as the main representative.
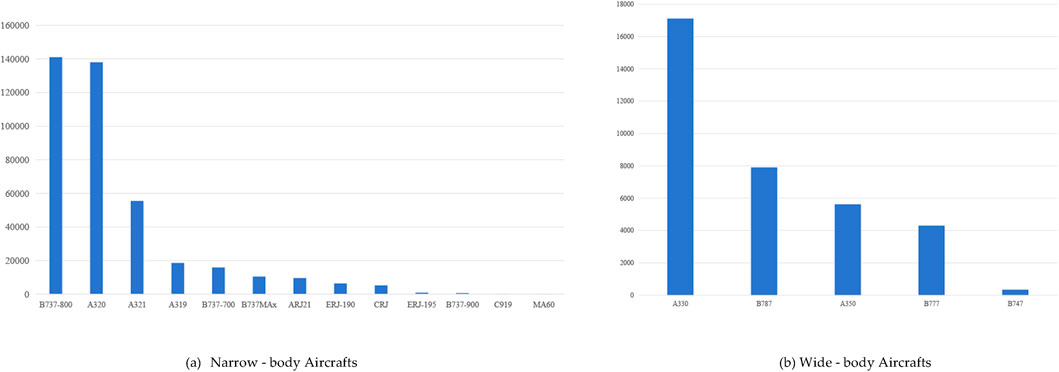
Figure 2. Number of Operations of Various Aircraft Types in China in February 2024. (A) Narrow - body Aircrafts; (B) Wide - body Aircrafts.
3.2 Establishment of the end - around taxiway model
As the differentiation of aircraft types increases, the adaptability of the end - around taxiways (EATs) at Yaoqiang Airport has more options. Given the different tail heights of Category C and Category E aircraft and considering the obstacle limitation surfaces, the impact of aircraft types on the location of the EAT is significant:
Option 1: Designated for use only by Category C aircraft and smaller. This can meet the needs of over 90% of the aircraft at the airport.
Option 2: Available for use by Category E aircraft and smaller. This can meet the needs of over 99% of the aircraft at the airport.
3.2.1 375 m BAT mode (back - around taxiway)
The BAT mode takes into account the jet blast impact and the restriction that the taxiway itself must not intrude into the ILS sensitive area. Drawing on the operational experiences of other airports, the BAT is positioned 375 m away from the runway threshold.
3.2.2 555 m REAT mode (runway end - around taxiway model)
The pavement dimensions and structure are designed in accordance with the specifications for Category E taxiways, and the operational mode of the end-around taxiway (EAT) is controlled according to Category C REAT (Runway End-Around Taxiway) requirements. Table 3 presents the evolution process of the proposal.
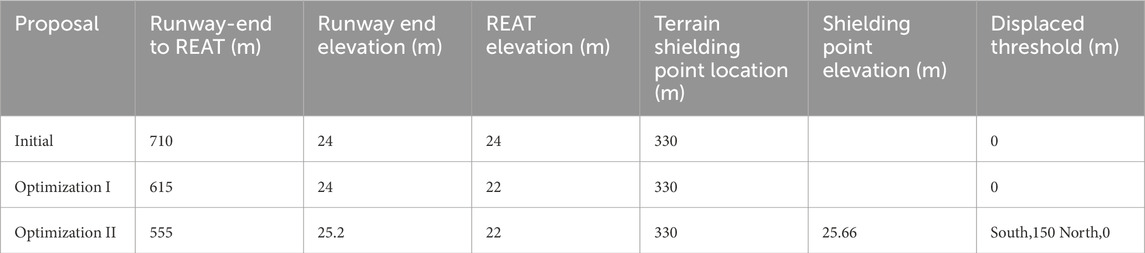
Table 3. Evolution process of category C REAT mode proposal.
3.2.2.1 Initial proposal
The initial proposal only considers meeting the tail height of Category C aircraft (13 m) and uses a 2% gradient for the takeoff climb surface. When the elevation of the taxiway is the same as that of the runway end, the distance between the runway end and the end-around taxiway is 710 m.
3.2.2.2 Optimization proposal I
To reduce the taxiing distance, this proposal increases the elevation difference between the taxiway and the runway end, thereby bringing the REAT closer. Specifically, for every 1-m increase in the elevation difference, the taxiway can be moved approximately 50 m closer. To ensure self-drainage of rainwater in the airfield, the taxiway elevation must not be lower than 22 m. The runway end elevation is set at 24.0 m based on earthwork balance. Additionally, considering the 30-m spacing of approach lights, the taxiway is positioned midway between two rows of lights, with its centerline located 615 m from the runway end. This proposal meets the slope requirements for terrain shielding and sensitive areas.
3.2.2.3 Optimization proposal II
This proposal aims to further increase the elevation difference between the runway end and the taxiway. The taxiway elevation remains at 22.0 m, while the runway elevation is raised to 25.2 m, resulting in an increase in the volume of earthwork. Due to the Category III precision approach at the southern end of the runway, the slope requirements for approach lights are not satisfied. Consequently, the runway entrance at the southern end needs to be displaced inward by 150 m. Under this proposal, the REAT can be positioned 555 m from the end of the runway.
An attempt was made to position the end-around taxiway (REAT) even closer, at 450 m from the runway end. However, this would require the runway end elevation to be increased to 27.4 m, resulting in a further increase in the earthwork volume. Considering the slope requirements for approach lights, the runway entrance would need to be displaced inward by 570 m. This would reduce the available landing runway length to 3,030 m, which would not meet the usage requirements of the landing aircraft. Therefore, this proposal is not feasible.
A runway used for landing must meet the requirements for threshold relocation without affecting the takeoff runway distance. Generally, landing aircraft require less runway length than takeoff aircraft. According to the aircraft performance analysis at Jinan Yaoqiang Airport, C and E category aircraft need 3,402 m on wet runways.
At hub airports with runways longer than 2,400 m, it is recommended that the threshold relocation be within 300 m. Considering the touchdown zone is typically around 300 m from the threshold (ICAO, 2022b), this reduces pilot glare from approach lights after landing.
After the evolution of the above proposals, the Category C REAT proposal recommends positioning the REAT 555 m from the runway end, and this proposal will be included in the comparison.
3.2.3 765+375 m category E REAT+BAT mode
Pavement Dimensions and Structure: The pavement dimensions and structure are designed in accordance with Category E taxiway specifications, and the end-around taxiway (REAT) mode is controlled according to Category E standards. Table 4 presents the evolution process of the proposal.
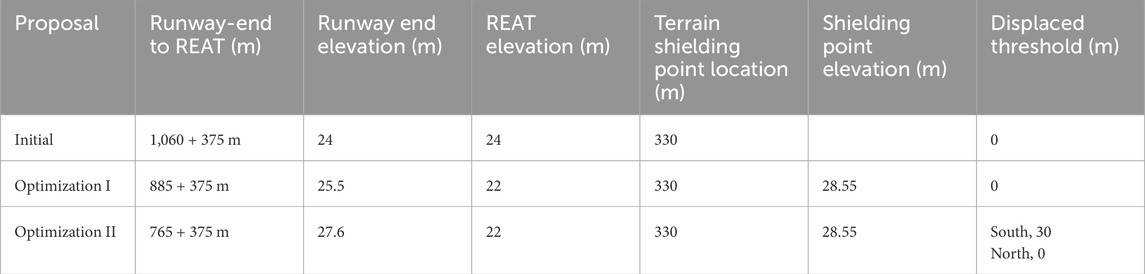
Table 4. Evolution process of category E REAT mode proposal.
3.2.3.1 Initial proposal
The taxiway elevation of 22.0 m meets the self-drainage requirements of the airfield. Considering the 20-m tail height of Category E aircraft and a 2% gradient for the takeoff climb surface, when the taxiway elevation is the same as the runway end elevation, the distance from the runway end to the REAT is 1,060 m.
3.2.3.2 Optimization proposal I
To reduce the taxiing distance, the elevation difference between the taxiway and the runway end is increased, bringing the taxiway closer to the runway end. The self-drainage requirements of the airfield are met, with the taxiway elevation maintained at 22.0 m. By raising the runway elevation to 25.5 m, the REAT can be positioned 885 m from the runway end. This meets the slope requirements of the approach lighting system, and there is no need to displace the runway entrance.
3.2.3.3 Optimization proposal II
Based on Proposal I, the runway elevation is further increased to 27.6 m, allowing the taxiway to be positioned 765 m from the runway end. At this point, the runway entrance at the southern end needs to be displaced inward by 30 m.
3.2.3.4 Further optimization
Based on Proposal II, the runway elevation is further increased to 31.8 m, resulting in an elevation difference of more than 5 m between the runway end and the REAT. This allows the taxiway to be positioned 555 m from the runway end. However, this would result in a large volume of earthwork, and both the Category III southern runway and the Category I northern runway would require the runway entrance to be displaced inward by 420 m. Consequently, the remaining runway length would be insufficient for landing aircraft, rendering this proposal impractical.
The runway elevation cannot be increased indefinitely. Excessive increases can make it difficult to achieve earthwork balance, as both filling and excavation volumes become excessively large. Additionally, displacing the runway entrance inward by a significant distance generally results in an insufficient landing runway length. Furthermore, excessively displacing the runway entrance inward would require some approach lights to be installed on the runway surface, potentially causing glare for pilots.
According to the layout of the Short - term Plan of Yaoqiang Airport, the newly constructed T2 terminal and the majority of the proximity parking positions will be predominantly located to the north. When aircraft land from the south to the north, the utilization of the Category E Runway End - Around Taxiway (REAT) holds significance. This is because it can potentially optimize the taxiing route, reducing taxiing time and enhancing overall operational efficiency.
Conversely, during the north - to - south traffic flow, a comparison of the taxiing efficiency between using the southern Category E REAT and the 375 - meter Back - Around Taxiway (BAT) on the north side becomes essential. The taxiing routes and distances associated with these two taxiway options may vary significantly, which could impact the overall taxiing time and fuel consumption.
To conduct a comprehensive analysis of the taxiing efficiency under different scenarios, this study proposes the establishment of a 375 - meter BAT on both the north and south sides of the runway. By doing so, a direct comparison of the taxiing efficiency can be made. This approach allows for a more accurate evaluation of the performance of different taxiway configurations, providing valuable insights for airport planners and operators to make informed decisions regarding taxiway design and usage.
As shown in Table 5, three models were developed based on site conditions, operational flow, and model - specific constraints.
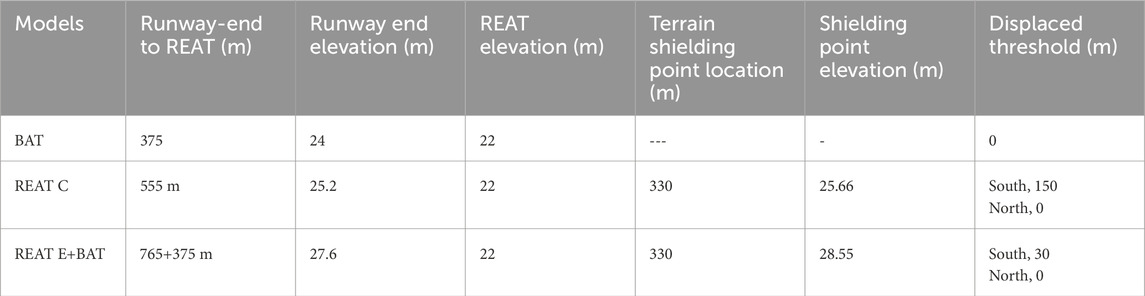
Table 5. Three models of end - around taxiway and related parameters.
4 Evaluation indicators
This section analyzes the research indicators for the end - around taxiway, focusing on three dimensions: taxiing efficiency, fuel consumption, and construction cost.
• Taxiing efficiency indicators: taxiing distance, taxiing time, and annual taxiing time.
• Fuel consumption indicator: Annual fuel consumption under different modes.
• Cost indicator: Construction cost of different schemes.
4.1 Taxiing efficiency indicators
4.1.1 Taxiing distance
4.1.1.1 Single - taxiing distances
The taxiing distance is determined by measuring the distance from leaving the runway to the fixed parking position in the terminal area. Obviously, the taxiing distance is related to the selected parking position. To ensure the consistency of the comparison, the bay on the north side of the new T2 terminal building was chosen as the target parking position. The reason is that, in the near - term target year (2030), the terminal area will be generally to the north. In the use of parking positions, the near - by positions will have a higher usage rate because passengers can directly reach the terminal building through the jet bridge instead of using a shuttle bus. Therefore, it can be foreseen that after the construction of the T2 terminal building, most of the planes landing in the west terminal area will be parked in the positions to the north of the T2 terminal building. Using the same endpoint for all comparison schemes helps to ensure the consistency of the comparison data.
For the long - term target year of 2050, a new terminal will be built south of the newly - constructed one, but with fewer aircraft stands than the north terminal. So even in 2050, the near - gate stand focus remains north - centered. Thus, for long - term layout, choosing north - side stands still aligns with the data.
The taxi distances of Category C aircraft in the main and secondary landing directions are denoted by Lc1 and Lc2, respectively. Similarly, Le1 and Le2 represent those of Category E aircraft. These values are determined by measuring the distance from the runway exit point to the aircraft stand after landing.
The calculation model for the taxiing distances under the primary and secondary landing flow lines in the BAT mode is shown in Figures 3, 4.
• The calculation model for the taxiing distances under the primary and secondary landing flow lines in the 555 m REAT mode is shown in Figures 5, 6.
• The calculation model for the taxiing distances under the primary and secondary landing flow lines in the765+375 m REAT mode is shown in Figures 7, 8.
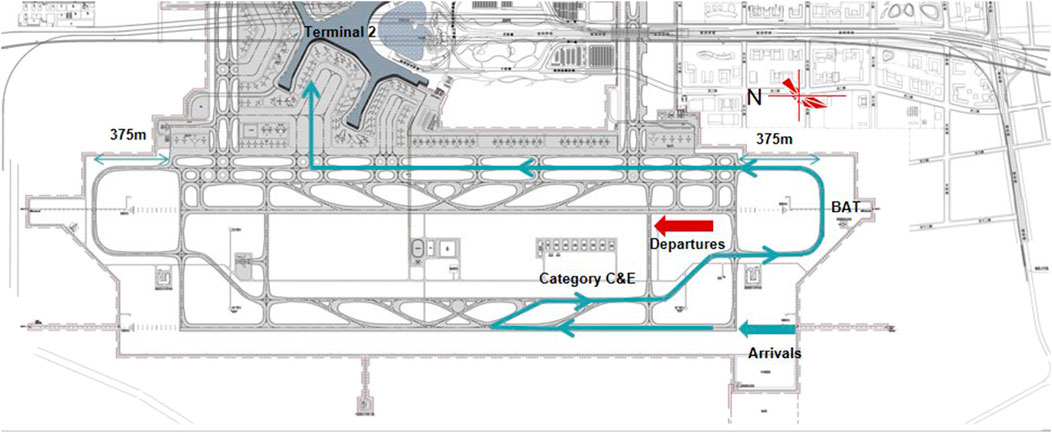
Figure 3. Taxi routes for Category C and Category E aircraft under the primary landing flow line in the BAT mode.
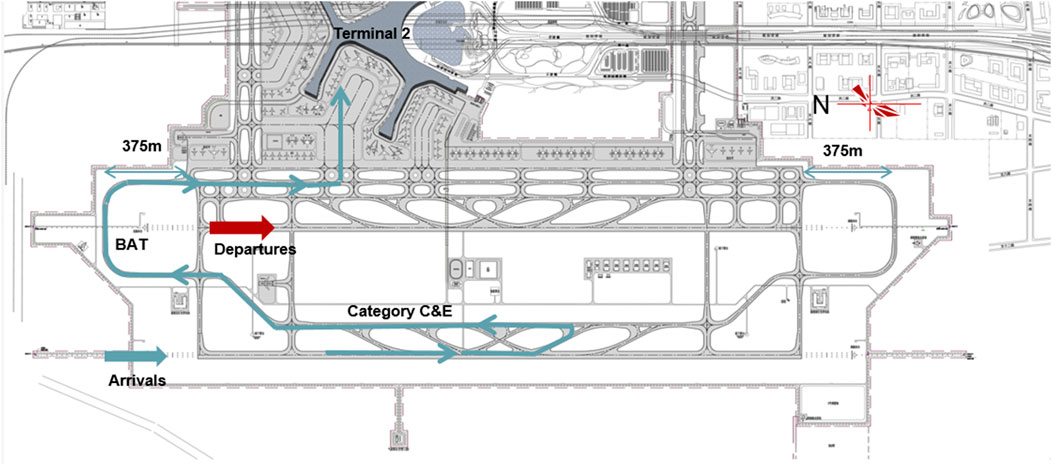
Figure 4. Taxi routes for Category C and Category E aircraft under the secondary landing flow line in the BAT mode.
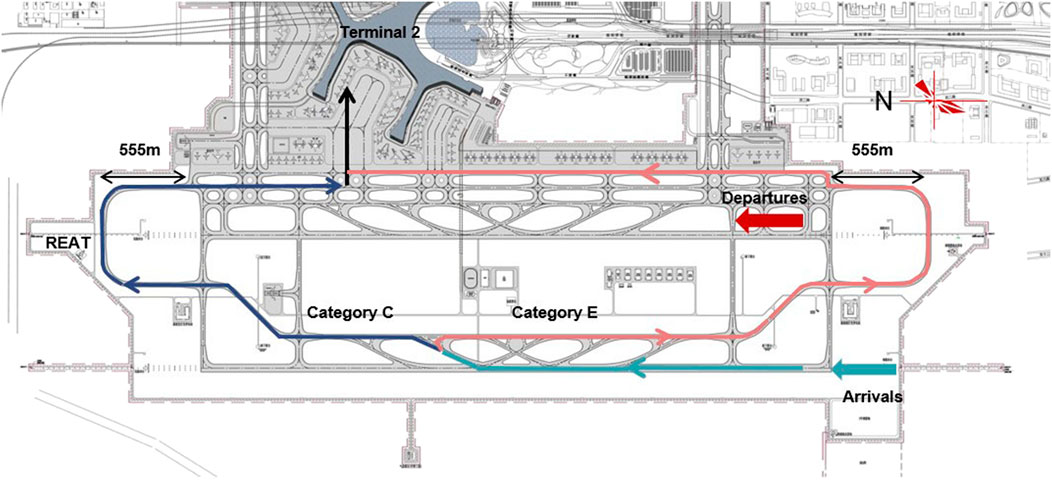
Figure 5. Taxi routes for Category C and Category E aircraft under the primary landing flow line in the 555 m REAT mode.
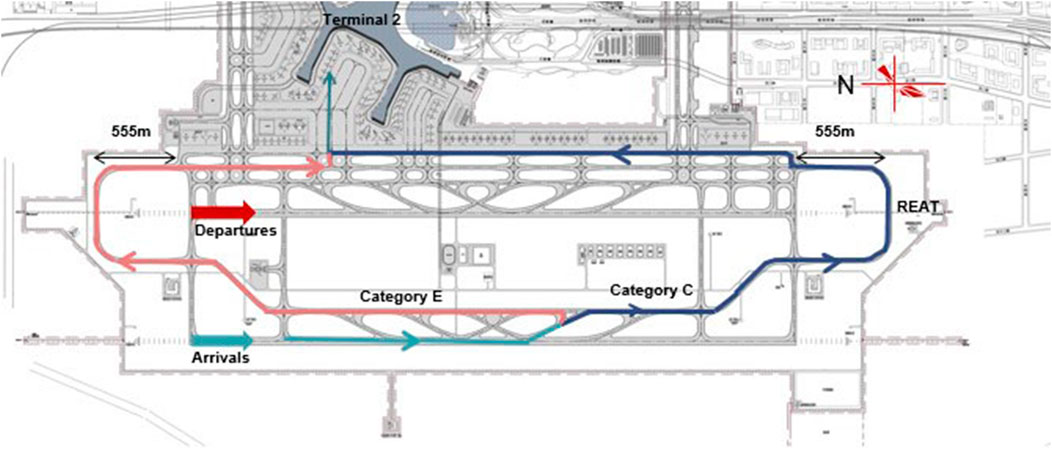
Figure 6. Taxi routes for Category C and Category E aircraft under the secondary landing flow line in the 555 m REAT mode.
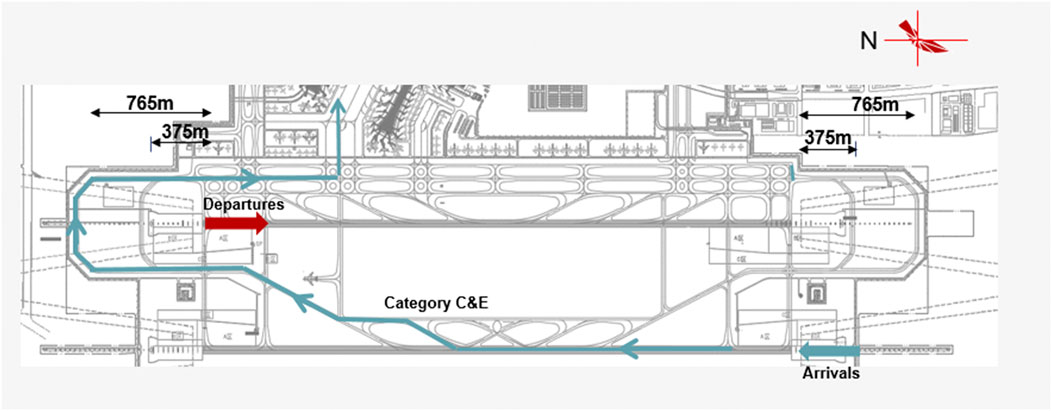
Figure 7. Taxi routes for Category C and Category E aircraft under the primary landing flow line in the 765mREAT+375mBAT mode.
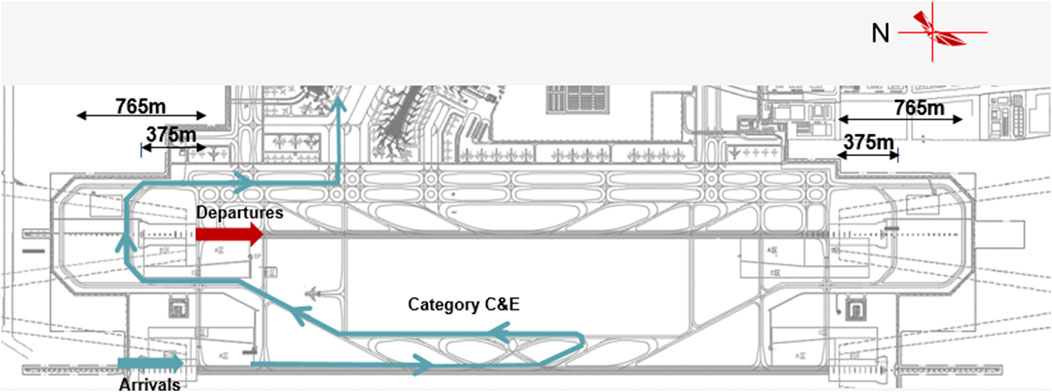
Figure 8. Taxi routes for Category C and Category E aircraft under the secondary landing flow line in the 765mREAT+375mBAT mode.
It should be particularly noted that in the 765 m REAT + 375 m BAT mode, the situation is different when using it for the secondary landing direction compared to the primary landing direction where the 765 m REAT is used. For the secondary landing direction, after landing, the aircraft turns around on the rapid exit taxiway and uses the 375 m BAT. This is where the advantage of the flexible use of a large bypass and a small bypass lies. Under the layout where the parking positions are generally to the north, at the location shown in the figure, using the 765 m bypass in front results in a taxiing distance that is about 600 m longer than using the 375 m BAT behind. Therefore, for the sake of scheme comparison, the path of using the 375 m route behind is adopted for taxiing.
4.1.1.2 Annual taxiing distance Ly
The calculation of the annual taxiing distance depends on both the taxiing distance per flight and the number of flights. Therefore, the number of landings in both the main and secondary directions is also taken into account.
• Main and secondary landing counts:
The main landing direction is from south to north, and the secondary direction is from north to south. Based on the projected 383,000 aircraft movements for 2030, it is assumed that 50% are landings, with all landing aircraft using end-around taxiways (EATs). The fleet composition is 90% Category C and 10% Category E aircraft, and the main - to - secondary landing ratio is 5:4.
The number of Category C aircraft taxiing movements for main landings from south to north is denoted as
For secondary landings from north to south, the number of Category C aircraft taxiing movements is represented by
The number of Category E aircraft taxiing movements for main landings from south to north is indicated by Ne1.
As for secondary landings from north to south, the number of Category E aircraft taxiing movements is marked as Ne2.
The annual taxiing distance (Ly) is computed by the formula:
Where:
4.1.2 Taxiing time
4.1.2.1 Single - taxiing time
Taxiing time is calculated as the taxiing distance divided by the average taxiing speed. The taxiing distance refers to the designed length of the taxiing route. The average taxiing speed is determined by comprehensively assessing the speed of aircraft from landing to reaching the parking position. According to the “Chinese Civil Aviation Flight Rules,” the ground taxiing speed of an aircraft shall not exceed 50 km/h, and when taxiing near obstacles, the speed shall not exceed 15 km/h (CAAC, 2001). The taxiing speed is directly related to the distance from obstacles and whether an End - Around Taxiway (EAT) is used. Previous research has found that when aircraft use the traditional crossing method, the average taxiing speed is 11.1–17.2 knots, while when using an EAT, the taxiing speed can be increased to 16.2–34.8 knots (Le and Marais, 2013). Some researchers have studied the surface taxiing speed of Pudong Airport and found that under normal weather conditions, the average taxiing speed of all flights at Pudong Airport is 16.206 knots (Qianwen, 2020), and Pudong Airport does not have an EAT. Considering the purpose of scheme comparison is to compare the planar configuration of the EAT. Taking into account the turning radius of the EAT in the scheme (ICAO, 2022a) the ground taxiing speed in this study is taken as 40 km/h (21.6 knots).
The single taxiing times for Category C and E aircraft in the main and secondary landing flow lines are respectively represented by Tc1 and Tc2.
4.1.2.2 Annual taxiing hours (Ty)
Ty is determined by the equation:
Where:
4.2 Fuel consumption indicator
Annual Fuel Consumption Fy: The data is based on the fuel consumption values for different engine types provided in The ICAO Engine Emissions Databank (ICAO, 2024). The ICAO Engine Emissions Databank is based on sea - level full - engine tests, providing engine performance and emission data. For the vast majority of jet and turbofan commercial engines, it provides fuel flow (kg/s) and emission indices (g of pollutants emitted per kg of fuel burned) at 7%, 30%, 85%, and 100% of the rated output power (Qianwen, 2020). In this study, the fuel consumption is based on the engine thrust fuel consumption during the idle phase. The engine types are obtained by querying the database (Pro, 2024). Both the B737 and A320 are equipped with CFM56 engines (Pro, 2024), with a fuel consumption rate of fc = 0.108 kg/scd per unit taxiing time; The A330 is equipped with Trent7000 engines, with a fuel consumption rate of fe = 0.256 kg/scd per unit taxiing time.
Annual fuel consumption (Fy) is calculated as follows:
Where:
4.3 Cost indicator
The project’s total investment, comprising land use, pavement area, and earthwork costs (including filling and excavation), is used to evaluate different options. Finally, the options are compared in terms of fuel consumption, efficiency, and total investment to determine the optimal solution.
5 Results and discussion
As shown in Table 6 and 7, the375 m BAT model reduces the capital investment by 1.5 billion yuan compared to 555 m REAT C model, however, it results in 7,000 additional annual taxiing hours and 1.77 million more tons of fuel consumed each year. At 6,000 yuan per ton for aviation fuel, this means an extra annual cost of 1.062 billion yuan. Since fuel consumption and emissions are directly linked during ground taxiing, the 555 m REAT C model is more environmentally and economically efficient.
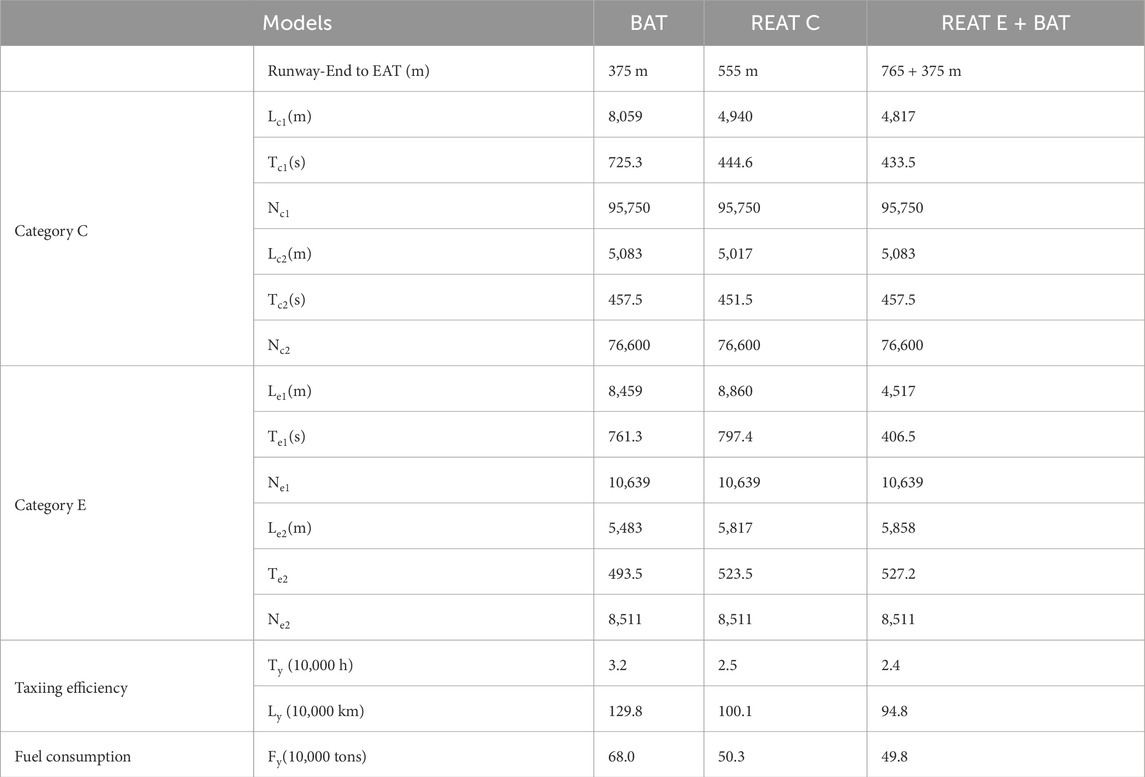
Table 6. Taxiing efficiency and fuel consumption indicators for three models of end - around taxiway.
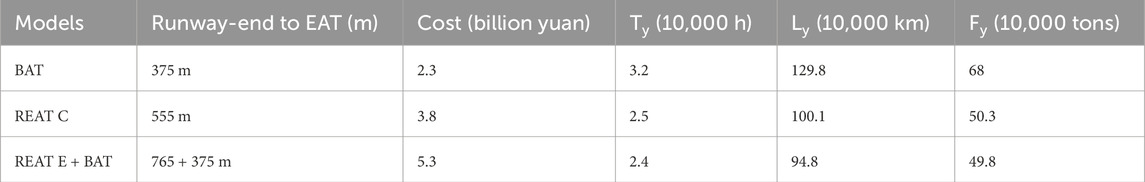
Table 7. Comparison of taxiing efficiency, fuel consumption, and cost indicator for three end-around taxiway models.
Although it has similar taxiing time and distance, its benefits are limited because E-category aircraft only account for 10% of operations. The choice of taxiing end position greatly affects taxiing path length. In this study, the northern stands of Terminal 2 were selected. The REAT E + BAT model saves time on secondary landings (north - to - south) by using the 375 m BAT to reach the northern stands. If stands were central or southern, the 765 m REAT option would be closer but less economical than the 555 m one, increasing taxiing distance and fuel consumption, and thus reducing economic efficiency compared to the 555 m REAT model.
Therefore, after a comprehensive evaluation of all relevant factors, the optimal choice for this project is to construct a Category C REAT 555 m from the runway end.
6 Conclusion
End-around taxiways (EATs) are designed to enhance airport safety and efficiency by minimizing runway crossings and reducing runway incursion risks. However, constructing EATs requires a balance between safety, operational efficiency, and cost-effectiveness. This study has proposed a systematic approach to designing EATs that are tailored to operational requirements, site-specific conditions, and cost considerations. The research highlights the importance of leveraging natural terrain variations and employing innovative construction methods, such as sunken EATs and displaced runway thresholds, to optimize taxiing distances while maintaining safety and efficiency. It also emphasizes the strategic importance of reserving space for EATs in the master planning of hub airports to accommodate future traffic growth and enhance operational flexibility. The analysis demonstrates that EAT planning must go beyond mere technical compliance. It necessitates a holistic, lifecycle perspective that incorporates multi-dimensional evaluations of taxiing distance, fuel consumption, emissions, and other relevant factors to identify the most cost-effective solution. Although various EAT configurations may appear advantageous for accommodating diverse aircraft types and operational scenarios, not all are economically viable.
This study’s findings are not only applicable to Jinan Yaoqiang International Airport but can also be migrated to other airports facing similar challenges. Future research can further enhance EAT planning by employing advanced simulation techniques and more detailed data analysis, contributing to more efficient, environmentally friendly, and economically sustainable airport operations.
Data availability statement
The original contributions presented in the study are included in the article/supplementary material, further inquiries can be directed to the corresponding author.
Author contributions
XJ: Conceptualization, Data curation, Formal Analysis, Methodology, Validation, Visualization, Writing – original draft, Writing – review and editing. YY: Data curation, Formal Analysis, Methodology, Resources, Visualization, Writing – original draft.
Funding
The author(s) declare that financial support was received for the research and/or publication of this article. This research was funded by “Research on End-Around Taxiways at Hub Airports” (Grant no. KY 2021-7), China Airport Planning and Design Institute Co., Ltd.
Conflict of interest
Authors XJ and YY were employed by China Airport Planning & Design Institute Co., Ltd.
Generative AI statement
The author(s) declare that no Generative AI was used in the creation of this manuscript.
Publisher’s note
All claims expressed in this article are solely those of the authors and do not necessarily represent those of their affiliated organizations, or those of the publisher, the editors and the reviewers. Any product that may be evaluated in this article, or claim that may be made by its manufacturer, is not guaranteed or endorsed by the publisher.
References
CAAC. (2014). Specification foraeronautical communication navigation and surveillance station siting criteria -Part 1: navigation.
Chao, Z. (2018). Analysis and suggestions on problems related to end-around taxiways. J. Civ. Aviat. 2 (03), 20–25.
Chen, Z., Zhao, Z., and Cheng, B. (2025). Modeling and simulation study of end around taxiway operation of Shanghai Hongqiao Airport. Aeronautical J. 129 (1331), 189–205. doi:10.1017/aer.2024.63
Dönmez, K. (2024). The operational dynamics of end-around taxiways: insights from Istanbul Airport. Case Stud. Transp. Policy 18, 101303. doi:10.1016/j.cstp.2024.101303
Dunlay, W. J., and Xu, H. M. (2018). “End-around taxiways—a win-win-win: enhanced safety, reduced aircraft delays and emissions,” in International conference on transportation and development (VA: American Society of Civil Engineers Reston), 99–109.
FAA (2010). Review of FAA's call to action plan for runway safety AV. Washington, DC: Office of the Secretary of Transportation, U.S. Department of Transportation.
FAA (2015). AC 150-5210-20a ground vehicle operations to include taxiing or towing an aircraft on airports.
Fala, N., Le, T. T., Marais, K., and Uday, P. (2014). Surface performance of end-around taxiways. Air Traffic Control Q. 22 (4), 327–351. doi:10.2514/atcq.22.4.327
Feng, Y. (2020). Simulation Analysis of end-around taxiway operations. Doctor of philosophy. West Lafayette, IN: Purdue University.
Feng, Y., and Johnson, M. E. (2021). Simulation analyses of end-around taxiway operations under four different runway and taxiway choices. J. Transp. Res. Board 2678, 2225–2234. doi:10.1177/03611981211018466
ICAO (2022a). Doc 9157 aerodrome design manual Part 3 — pavements third edition, 2022. Canada: International Civil Aviation Organization.
James, W., and Patterson, J. (2007). End-around taxiway screen evaluation DOT/FAA/AR-TN06/59. Washington, DC: U.S. Department of Transportation.
Jiang, X., and Hao, P. (2024). Hub airport end-around taxiway construction planning development: a review. Appl. Sci. 14 (8), 3500. doi:10.3390/app14083500
Le, T. T., and Marais, K. (2013). “Optimization of end-around taxiway for efficient operations and environmental benefits,” in 2013 aviation Technology, integration, and operations conference.
Li Na, Z. X. (2023). Operation efficiency analysis of narrow distance parallel double runways. J. Civ. Aviat. 7 (01), 65–68.
Lingling, Z. (2024). End-around taxiway design based on operation requirements and site conditions. J. Civ. Aviat. 8 (01), 52–55+83.
McNerney, M. T., and Heinold, D. (2011). “The case to build end-around taxiways at george bush intercontinental airport for air quality benefit,” in Transportation and development Institute congress 2011: integrated Transportation and Development for a better tomorrow, 339–352.
Qianwen, H. (2020). Research on surface taxiing mode and multi-objective optimization for aircraft fuel consumption and emission. Master Eng.
Satyamurti, S., and Mattingly, S. P. (2007). “Implementing a perimeter taxiway at dallas/fort worth international airport: evaluation of operating policy impacts,” in Aviation: a world of growth. (dissertation thesis), 23–36.
Satyamurti, S. D. (2007). Runway incursion mitigation, capacity enhancement, and safety improvements with perimeter taxiway operations at Dallas Fort Worth International Airport. The University of Texas at Arlington. Doctor of Philosophy PhD dissertation.
Tianqi, X., Hongrun, R., Qingtian, Z., Gang, S., and Hailiang, L. (2021). “Analysis on the effect of end-around taxiway screen on the signal of localizer,” in 2021 IEEE 3rd international Conference on Civil aviation Safety and information Technology (ICCASIT): ieee, 45–50.
Uday, P., Marais, K., and Burder, D. (2011). “Environmental benefits of end-around taxiway operations,” in 11th AIAA aviation Technology, integration, and operations (ATIO) conference, including the AIAA balloon systems Conference and 19th AIAA lighter-than, 7049.
Yuan, B., Li, Y., Lin, H., and Liang, F. (2020). “Study on the position of Visual screen in airport constructed End-Around Taxiway,” in 2020 IEEE 4th information Technology, networking, Electronic and automation control conference (ITNEC): ieee, 880–883.
Keywords: airport design, end-around taxiway (EATs), taxiway layout, runway incursion, fuel Consumption, taxiing distance, taxiing time
Citation: Jiang X and Yang Y (2025) Optimized framework for end-around taxiway design: site, efficiency, fuel: a case study at Jinan Yaoqiang airport. Front. Built Environ. 11:1621572. doi: 10.3389/fbuil.2025.1621572
Received: 01 May 2025; Accepted: 27 May 2025;
Published: 24 June 2025.
Edited by:
Bowei Sun, Civil Aviation University of China, ChinaReviewed by:
Wentong Wang, Shandong University of Science and Technology, ChinaHaiwei Zhang, Zhengzhou University of Aeronautics, China
Copyright © 2025 Jiang and Yang. This is an open-access article distributed under the terms of the Creative Commons Attribution License (CC BY). The use, distribution or reproduction in other forums is permitted, provided the original author(s) and the copyright owner(s) are credited and that the original publication in this journal is cited, in accordance with accepted academic practice. No use, distribution or reproduction is permitted which does not comply with these terms.
*Correspondence: Xiaoxi Jiang, amlhbmd4aWFveGllbGZAMTI2LmNvbQ==