 Chuloh Jung
 Gamal El Samanoudy
 Naglaa Sami Abdelaziz Mahmoud
- 1Department of Architecture, Prince Mohammad bin Fahd University, Alkhobar, Saudi Arabia
- 2Department of Interior Design, Ajman University, Healthy and Sustainable Built Environment Research Center, Ajman, United Arab Emirates
Indoor air quality (IAQ) is a critical determinant of public health, particularly in rapidly urbanizing regions where residents spend most of their time indoors. Formaldehyde (HCHO), a pollutant released from building materials and furnishings, has been linked to respiratory problems and sick building syndrome, making its control essential for sustainable housing. This study investigates the relationships between HCHO emissions and temperature and humidity in newly constructed residential houses in Dubai, utilizing single-point measurements in 50 houses and continuous monitoring in three representative houses. A distinctive feature of this research is the integration of large-scale cross-sectional data with continuous temporal monitoring, applied in the context of Dubai’s housing, to capture both spatial and temporal dynamics of emissions under actual residential climate control practices. In contrast to controlled laboratory simulations, the study evaluates emissions under artificially and autonomously regulated indoor climates. Results show that in artificially controlled environments (temperatures maintained below 25 °C), HCHO emissions correlate weakly with temperature but strongly with relative humidity, with concentrations increasing when RH falls below approximately 40%. Conversely, in autonomously controlled environments (temperatures above 25 °C), temperature becomes the dominant factor, with emissions increasing as the temperature rises. This dual dependency underscores the need for adaptive IAQ strategies tailored to both seasonal conditions and household management practices. By integrating temporal and spatial data, the study highlights the role of housing characteristics and management history in shaping emission behavior and outlines applicable, low-energy strategies to support resilient IAQ management frameworks aligned with sustainability goals for social housing in the Arabian Gulf.
1 Introduction
Formaldehyde (HCHO) is a toxic compound of concern in indoor environments (Jung and Awad 2021a; Awad and Jung 2021). The sources of HCHO found in rooms are highly varied, and this compound, typically released from building materials and furniture, continues to be emitted over extended periods due to material characteristics (Jung and Al Qassimi, 2022; Jung and Awad, 2021b). Accordingly, it is necessary to investigate the factors influencing indoor HCHO generation and identify effective control measures (Dubai Municipality, 2024, pp. 6–7; Jung et al., 2021c).
Dubai Municipality has established specific guidelines for indoor air quality to promote healthier living environments (Arar et al., 2022). These guidelines, known as HSD GU119“Technical Guidelines for Indoor Air Quality (IAQ) for Healthy Life,” were released in January 2023 (Arar and Jung 2022; Dubai Municipality, 2024). According to a Dubai Healthcare City report, 15% of Dubai residents have experienced symptoms of Sick Building Syndrome (SBS) caused by various indoor and outdoor air pollutants (Najini et al., 2020; Jung and Awad, 2023). In response, the Dubai Municipality initiated IAQ concentration standards (Dubai Municipality, 2022, p. 32). These standards specify that new houses, before occupancy, must have less than 0.08 ppm (parts per million) of HCHO, less than 300 μg/m3 of Total Volatile Organic Compound (TVOC), and less than 150 μg/m3 of Particulate Matter less than 10 microns (PM10) after 8 h of continuous monitoring (Dubai Municipality, 2024, pp. 31–33). These regulatory efforts align with broader strategies for pollutant mitigation in dense urban housing, as outlined by Jung and Abdelaziz Mahmoud (2023), who emphasize the role of ventilation design in maintaining healthy IAQ in Dubai’s high-rise residences.
Previous studies have shown that HCHO emissions are influenced by environmental factors, including temperature and humidity (Mushtaha and Helmy, 2017; Liang et al., 2016a). This aligns with previous research, which has also emphasized the broader role of material emissions, ventilation strategies, and microclimatic conditions in shaping indoor air quality (Batterman et al., 2017; Hussien et al., 2023b; Tagliabue et al., 2021; Yang et al., 2020). However, explaining the mechanism behind the impact of microclimate factors on the behavior of building materials used in Dubai houses remains a methodological challenge (Maghrabie et al., 2021). This is primarily due to the use of diverse building materials with varying compositions, types, and histories in real houses, as well as the implementation of various construction methods for each material (Kaunelienė et al., 2016).
While temperature and humidity control in indoor environments are fundamental measures to reduce HCHO generation, the influence of these factors on HCHO levels in Dubai houses has not been sufficiently documented (Jung and El Samanoudy, 2023; Al Qassimi and Jung, 2022). In particular, understanding the characteristics of HCHO generation based on actual indoor temperature control practices in Dubai residences control practices can be an effective means of proposing control strategies in indoor environments, such as houses (Mushtaha et al., 2021).
Dubai experiences extremely hot, long, windy, and humid summers, with an average high temperature of around 40 °C and overnight lows of around 30 °C in August, the hottest month. The region generally experiences sunny days every year (Jung et al., 2022a). Winters are relatively mild, with an average high of 24 °C and overnight lows of 14 °C in January, the coolest month (Jung et al., 2021a).
Due to the widespread use of air conditioning, actual indoor temperature and humidity control are often highly restricted (Jung et al., 2022e). Previous studies have produced inconsistent results regarding the relationship between temperature, humidity, and the generation of chemicals in residential spaces (Awad et al., 2022). This inconsistency can be attributed to reporting results in different situations and under varying conditions (Jung et al., 2022b). Therefore, it is necessary to systematically discuss these results to address the diversity of experiments, investigations, and analysis methods (Jung et al., 2021b). Consequently, this study aims to propose a plan for controlling HCHO in residential indoor environments by analyzing the dependencies of HCHO emissions on temperature and humidity under actual indoor temperature control practices in Dubai residences. The research adopts a dual approach: single-point measurements conducted in 50 newly constructed houses and continuous monitoring in three representative houses. This combined design provides both broad cross-sectional insights and in-depth temporal analysis, enabling a more comprehensive understanding of emission behaviors. By linking emission patterns with actual residential management practices, the study contributes to the development of adaptive, context-specific strategies for mitigating indoor HCHO pollution in hot-climate housing.
Hazardous substances are predicted to volatilize within building materials in high-temperature environments, resulting in an increased generation of indoor pollutants (Wang et al., 2021). This prediction is based on the general theory that the vapor pressure of chemicals rises with higher temperatures and absolute humidity, leading to volatilization (Wen et al., 2018). A study conducted by Śmiełowska et al. (2017) revealed that the release of chemical substances indoors is influenced by both environmental characteristics and the properties of building materials (Śmiełowska et al., 2017). The previous research by Khoshnava et al. (2020) emphasized that building materials are the primary source of harmful chemical emissions in indoor environments (Khoshnava et al., 2020). Additionally, Farzanian et al. (2016) reported that the release of chemical substances from building materials is associated with their internal composition and that the material properties contribute to variations in release intensity (Dabous et al., 2022). In other words, the content within the material determines the volatilization of chemical substances, which further varies due to the distinct characteristics of each material (Celeiro et al., 2018).
The emission of chemicals from indoor building materials is influenced by microclimate factors, including temperature, humidity, and ventilation (Hermawan and Švajlenka, 2022). These environmental conditions may lead to differences in HCHO emission, particularly in response to indoor temperature control practices (Salthammer, 2019). In Dubai, indoor air conditioning is maintained consistently throughout the year due to seasonal characteristics (D'Agostino et al., 2020). However, adjustments like natural ventilation are commonly employed during winter to regulate indoor environmental conditions (Monge-Barrio et al., 2022). Therefore, it is necessary to effectively examine the relationship between indoor temperature control practices and the emission characteristics of hazardous chemicals in residential buildings to manage IAQ (Hussien et al., 2023a; Patino and Siegel, 2018).
Notably, previous studies addressing the dependence of chemical emissions on indoor temperature and humidity conditions for residential buildings often adopted methodologies involving multiple houses measured at a single point within each house (Coggins et al., 2022; Földváry et al., 2017; Langer et al., 2016). However, these studies do not consistently report a conclusive relationship between chemical release, temperature, and humidity (Mie et al., 2017; Liang et al., 2016b). This inconsistency is likely due to variations in measurement and environmental conditions as well as differences in management history (Zhang et al., 2019; Kaunelienė et al., 2016).
Candanedo et al. (2017) examined how temperature and humidity dependencies differ when analyzed at the whole-house scale versus at the level of individual houses. It is preferable to analyze individual houses rather than all houses, as each house has distinct housing specifications and management histories (Jung et al., 2022c). Furthermore, the study aims to compare temperature–humidity dependence trends using both single-point measurements in multiple houses and continuous measurements within the same house. This dual approach provides insights that support the development of effective control strategies to suppress the release of hazardous chemicals indoors.
This study presents several key contributions to the understanding and mitigation of indoor air pollutants in social housing, particularly within the context of the Arabian Gulf. First, it analyzes HCHO emission behaviors under actual residential temperature and humidity control conditions, capturing the influence of actual residential temperature management—autonomous and artificial—rather than relying on controlled laboratory simulations. Second, it employs a comparative measurement methodology, combining single-point and multi-day continuous measurements across 50 newly constructed houses to reveal temporal dynamics and spatial variability in pollutant emissions. Third, the findings challenge the conventional focus on temperature by identifying humidity as a critical regulatory factor in HCHO release, especially in environments where indoor temperatures remain below 25 °C. Lastly, the study outlines applicable, low-energy mitigation strategies—such as humidity regulation and seasonal control planning—aligned with the climatic realities of the Arabian Gulf. As González-Lezcano (2023) highlights, building design prepared for future environmental and health challenges must balance between energy efficiency and occupant health. This study advances that aim by providing empirically grounded insights applicable to the design of efficient and health-conscious social housing. These insights contribute to the development of resilient, sustainable IAQ management frameworks for social housing in hot, humid environments.
2 Materials and methods
In this research, the analysis focused on temperature control behavior and the number of measurement points in the indoor environment of residential houses. This focus is consistent with previous IAQ studies that examined measurement protocols in similar contexts (Jung et al., 2022d; Al Horr et al., 2016). To minimize content variations, measurements were taken in newly constructed apartments with identical finishing materials and completed construction before occupancy, a practice also emphasized in earlier work (Kaunelienė et al., 2016). The measurement points were categorized into two groups—single measurement points and multiple consecutive measurement points—following established approaches in housing IAQ research (Földváry et al., 2017). A single measurement point involves taking measurements at a specific time in a house (Molina et al., 2020). Multiple consecutive measurement points refer to continuous measurements at various locations within the same house (Langer et al., 2016). The temperature control behavior was divided into autonomous and artificial control (Yousefi et al., 2017). These represent actual residential temperature management practices, in contrast to laboratory-imposed simulations. Autonomous temperature control refers to the natural adjustment of temperature without the use of air conditioning, relying on external air influences (D'Orazio and Maracchini, 2019). On the other hand, artificial temperature control involves deliberately manipulating the temperature using mechanical systems (Zhao et al., 2021).
Thus, the study focused on the relationship between temperature control behavior, humidity variations, and HCHO emissions, particularly emphasizing how different measurement methodologies capture IAQ dynamics (Dodson et al., 2017). Since temperature and humidity interact in real-world settings, the study systematically categorized measurements based on control mechanisms and the number of measurement points to analyze their impact on IAQ. The experiments and analyses were structured into six measurement scenarios, categorized by control type (artificial or autonomous) and measurement design (single or multiple points, including constant temperature maintenance).
1. Single measurement point with artificial temperature control (the artificial control section), where the effects of manually regulated temperature on IAQ were observed while monitoring humidity fluctuations.
2. A single measurement point with autonomous temperature control (the autonomous control section) allows for examining naturally occurring temperature and humidity interactions.
3. A single measurement point with total temperature control captures the overall indoor climate effects on HCHO emissions.
4. Multiple consecutive measurement points with artificial temperature control, enabling a time-dependent analysis of temperature-humidity-IAQ interactions under regulated conditions.
5. Multiple consecutive measurement points with autonomous temperature control provide insights into how environmental temperature changes over time influence IAQ.
6. Multiple consecutive measurement points with artificial constant temperature maintenance, allowing for a controlled assessment of long-term stability in IAQ under fixed temperature conditions.
2.1 Target buildings
The study was conducted in 50 residential houses across multiple districts in Dubai. The selected homes were categorized based on their proximity to major environmental influences, including industrial areas, highways, and coastal regions. The sampling locations were selected to capture a range of indoor air quality conditions, encompassing both urban and suburban settings.
Figure 1 presents the spatial distribution of the 50 monitored houses, mapped using ArcGIS. The overlay highlights key environmental features such as proximity to major roads, industrial zones, and coastal areas, providing context for potential external influences on indoor air quality.
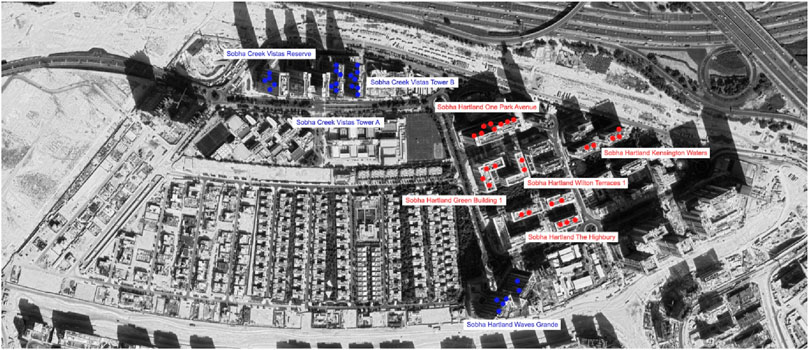
Figure 1. Spatial Distribution of the 50 Monitored Houses in Dubai. The map illustrates geographic locations with overlays of major roads, industrial zones, and coastal areas. This spatial representation contextualizes potential microclimatic influences—such as coastal humidity, urban heat island effects, and industrial emissions—on indoor air quality and formaldehyde behavior.
2.1.1 Single measurement house
For the single-measurement houses, we focused on 50 newly constructed residential units developed by Sobha Realty in Dubai between 2021 and 2023. These units were selected approximately 30 days before occupancy, in accordance with Dubai Municipality protocols for pre-handover indoor air quality assessment, a timing that is also consistent with approaches adopted in previous IAQ studies (Mohamed et al., 2021). This timing ensured that HCHO emissions captured in the study reflected emissions from construction and finishing materials without interference from occupant behavior or furnishings.
All 50 houses were sourced from various Sobha Hartland and Creek Vistas developments. Choosing a single developer allowed us to maintain consistency in construction materials, building systems, and quality control, reducing variability due to differences in design, finish, or project management (Alonso et al., 2021). This uniformity strengthens the reliability of comparative analysis across different environmental and seasonal conditions.
To ensure representative coverage, the homes were selected across multiple districts and building types, accounting for different urban contexts (e.g., proximity to highways, coastal zones, and industrial areas). The sample was divided by seasonal conditions, with 26 houses measured during summer and 24 during winter, and further categorized by temperature control type (artificial vs autonomous) (Militello-Hourigan and Miller, 2018; Barbosa et al., 2020).
This sampling strategy provided a controlled yet ecologically valid dataset, offering a robust foundation for analyzing real-world HCHO behavior in Dubai’s residential housing sector.
A summary of the retrofit interventions for each building is provided in Table 1, detailing insulation materials, window types, ventilation upgrades, and airtightness improvements.
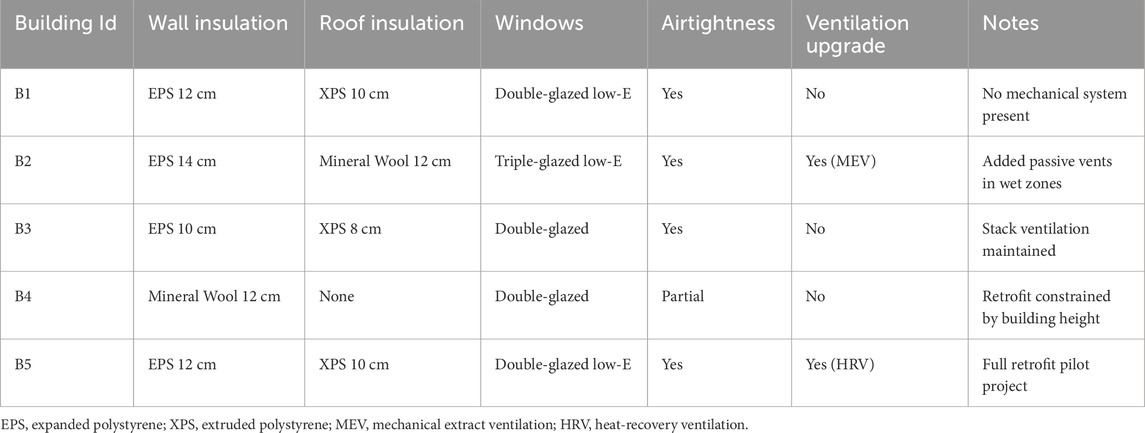
Table 1. Summary of retrofit measures across the five studied building blocks.
2.1.2 Multiple measurement house
Continuous temperature, humidity, and HCHO measurements were conducted in three representative houses: Sobha Creek Vistas Reserve (VR), Sobha Creek Vistas Tower A (TA), and Sobha Creek Vistas Tower B (TB). These homes were selected to capture detailed, multi-day data on temporal emission patterns under various indoor climate control scenarios. The continuous measurement approach complements the broader snapshot-based assessment of 50 homes by providing deeper insight into the dynamic behavior of pollutants over time.
The three selected homes represent varied temperature control types (autonomous, artificially controlled, and constant temperature), indoor layouts, and floor levels (VR – 12th floor, TA – 16th floor, TB – 15th floor). At the same time, all maintain a uniform area of 87 m2. This selection was deliberate to ensure environmental comparability while allowing analysis of distinct microclimate conditions. These homes were part of the same development and constructed approximately 30 days before their expected occupancy approval date, aligning with Dubai Municipality’s air quality inspection timeline (Singer et al., 2020).
Continuous measurements were conducted from February 8 to 29, 2022, to capture seasonal fluctuations and maintain controlled indoor settings. Environmental factors, such as ventilation and air circulation, were consistent across all homes, thereby minimizing external variability.
Only three homes were selected for this intensive monitoring due to the high resource requirements and logistical constraints of deploying continuous data logging equipment over extended periods. Additionally, access permissions and equipment calibration needs limited the number of feasible setups. However, these homes were strategically selected to reflect contrasting thermal behaviors and management conditions, thereby enhancing the study’s explanatory power despite the smaller sample size.
By combining extensive single-point measurements with targeted continuous monitoring, the study achieves both wide coverage and in-depth analysis, ensuring robust and context-relevant insights into indoor HCHO emissions in Dubai’s residential environments.
2.1.3 Building layouts and measurement locations
To enhance spatial understanding, images of the façades of each target building have been included to illustrate their architectural characteristics (Figure 2). Additionally, a floor plan of the measured residential units has been provided (Figure 3), marking the locations where HCHO measurement equipment was placed. These floor plans detail the positioning of temperature and humidity sensors, ventilation systems, and indoor air circulation pathways, ensuring transparency in measurement conditions. Including these visuals strengthens the study’s methodology by offering a more precise representation of environmental factors affecting IAQ measurements.
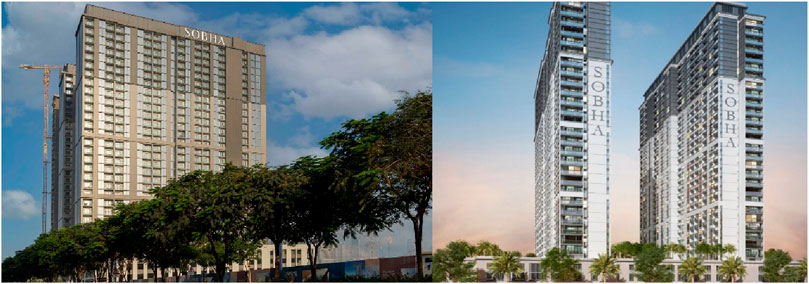
Figure 2. Sobha creek vistas façade in dubai.
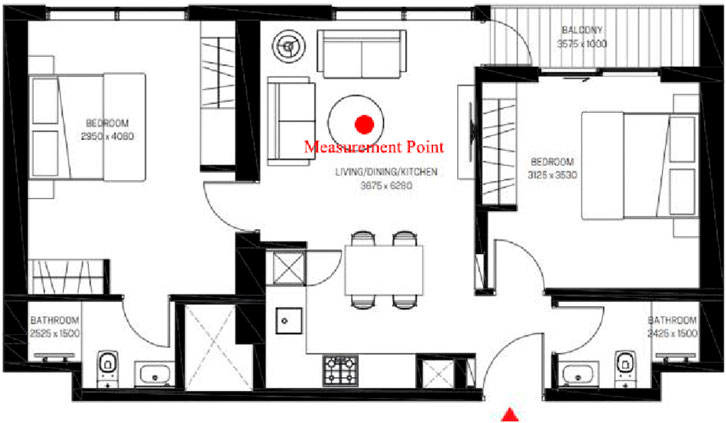
Figure 3. Sobha tower plan showing the measurement point in the living area.
This spatial distribution analysis is critical because microclimatic factors—such as higher humidity in coastal districts, heat accumulation in highway-adjacent zones, and varying ventilation opportunities in industrial surroundings—can significantly influence HCHO emissions. Incorporating these locational contexts ensures that the measured differences are interpreted not only as house-specific variations but also as reflections of broader microclimatic conditions.
2.2 Measurement of indoor air temperature, humidity, and HCHO
The indoor temperature and humidity in the single-measurement houses (50 houses) were measured simultaneously and at the exact location as the HCHO measurements (Alonso et al., 2022). For the multiple measurement houses (three houses), daily average data were calculated using temperature and humidity measurements taken at 30-minute intervals from 9:00 a.m. to 8:00 p.m. (Mendell et al., 2018). A digital thermo-hygrometer (Boston Instruments, U.S.) was employed to measure temperature and humidity, and each house underwent two rounds of repeated measurements (Singer et al., 2017).
HCHO was measured at the center point of the living room after 30 min of ventilation, followed by a 5-h sealing process, by the WHO test method for single-measurement houses (Zhang and Srinivasan, 2020). However, HCHO was continuously measured at the center point of the living room without any ventilation or airtight procedures for the house’s continuous measurements (Sui et al., 2021). HCHO measurements were taken twice, and the average value was calculated and utilized for analysis (Liang et al., 2016a).
For indoor air collection, carbonyl compounds were collected using an LpDNPHS10L cartridge (Supelco Inc., U.S.) (Chi et al., 2016). During this process, 21.0 L of indoor air from the living room were collected at a flow rate of 700 mL/min, utilizing a sampling pump equipped with a flow control device (Yu et al., 2017). For sample extraction, the DNPH-carbonyl derivative formed through reaction with DNPH was extracted using 5 mL of HPLC-grade acetonitrile, and immediate analysis was conducted following the extraction (Trocquet et al., 2019). The study of HCHO from the extracted DNPH derivatives was performed using High-Performance Liquid Chromatography (HPLC, Shimadzu) (Singer et al., 2020).
2.3 Measurement protocol
The measurements were conducted in both single- and multi-measurement houses across seasonal periods. For the multi-measurement group, continuous monitoring was conducted over 21 days. For the single-measurement group, 24-hour controlled-condition data were collected.
2.3.1 Sensor placement
All indoor sensors were placed in the main living room of each flat at breathing zone height (approximately 1.1–1.5 m from the floor). Sensors were positioned away from windows, doors, heating/cooling vents, direct sunlight, and any appliances that could distort readings. This setup ensured consistency across houses and minimized localized environmental interference.
2.3.2 Outdoor environmental conditions
Daily outdoor weather data, including temperature, relative humidity, and solar radiation, were collected from the nearest public meteorological station to contextualize indoor environmental patterns. These values were used to describe seasonal conditions but were not directly included in the regression or correlation models.
2.3.3 Occupancy and ventilation behavior
Basic information about flat occupancy was self-reported by residents. Pre- and post-measurement surveys were conducted to assess window opening behavior, use of mechanical ventilation, and general thermal comfort preferences. However, continuous monitoring of window states or occupant movement was not conducted due to privacy and equipment constraints.
2.3.4 Measurement duration recap
Multi-measurement homes were monitored continuously over a 21-day period. Single-measurement homes were observed for 24-hour intervals under controlled thermal conditions. Each house followed a uniform measurement protocol during the assigned monitoring period.
3 Results
3.1 Temperature, humidity, and HCHO emission characteristics of a single measurement house
Table 2 summarizes temperature, humidity, and HCHO dependence across control conditions, highlighting seasonal and methodological variations. In this section, we analyze the emission characteristics of HCHO with variations in temperature and humidity. The data for this analysis were obtained from measurements taken 30 days before occupancy in newly constructed houses from 2021 to 2023.
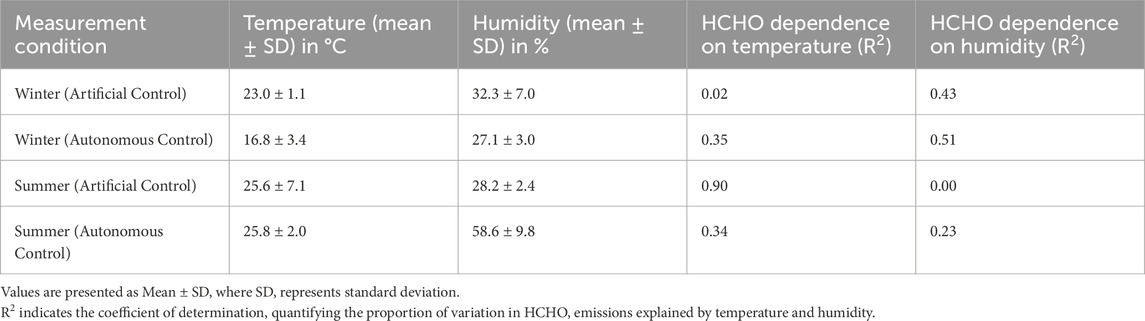
Table 2. Summary of temperature, humidity, and HCHO dependence across different control conditions.
The measurements were conducted separately for the winter and summer seasons. During the winter survey, we selected 24 houses from apartment complexes in four different locations. In the summer survey, we examined 26 houses from apartment complexes in five locations. The winter measurements were conducted between December and January, while the summer survey occurred between May and June, with slight variations across different years.
3.1.1 Temperature, humidity, and HCHO emission characteristics of a single measurement house in an artificially controlled section
Indoor air samples were collected during winter, maintaining a temperature of 20 °C or higher, using the Indoor Air Quality Process Test Method outlined by the World Health Organization (WHO).
Figure 4 illustrates the distribution of indoor temperatures for 24 houses measured during winter, specifically during the period of artificial adjustment. The average temperature recorded was 23.0 °C, with a Standard Deviation (SD) of ±1.1, within a temperature range of 20.8 °C–24.7 °C. Figure 5 displays the distribution of Relative Humidity (RH). The average humidity observed was 32.3%, with an SD of ±7.0, spanning a distribution range of 23.3%–51.3%.
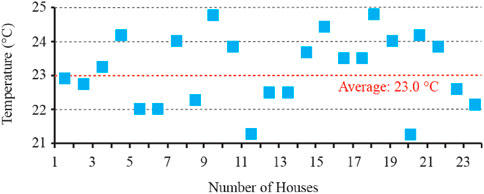
Figure 4. Indoor Temperature Distribution for a Single-Measurement Houses in Winter. Scatter plot of indoor temperatures ( °C) across 24 houses under artificial control. Mean = 23.0 °C. Distribution is consistent with WHO testing conditions.
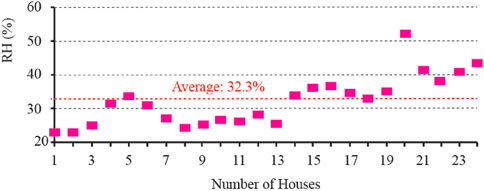
Figure 5. Indoor Humidity Distribution for a Single-Measurement Houses in Winter. Scatter plot of relative humidity (%) across 24 houses. Mean = 32.3%. Data used in correlation analysis with HCHO (see Figure 7).
In the section where artificial control was implemented, the coefficient of determination (R2) for the relationship between room temperature and HCHO emission was found to be 0.02, indicating a lack of linear dependence. Conversely, for humidity, the R2 value was 0.43, clearly indicating a significant dependency (Figure 6). In other words, within the artificially controlled section where the indoor temperature averaged around 23.1 °C, no linear relationship was observed between temperature and HCHO emission. However, it was observed that HCHO emission exhibited a clear dependence on humidity when the indoor humidity averaged below approximately 50.0% (with an average of 32.3%) (Figure 7).
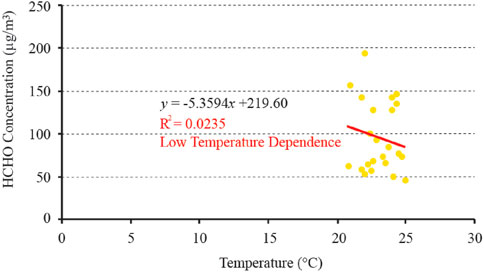
Figure 6. Temperature and HCHO Relationship in Winter (Artificial Control). Scatter plot showing no significant correlation between indoor temperature and HCHO concentration (R2 = 0.02, p > 0.05, Wilcoxon signed-rank test).
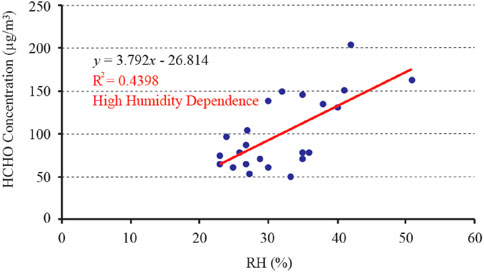
Figure 7. Humidity and HCHO Relationship in Winter (Artificial Control). Scatter plot showing a moderate positive correlation between humidity and HCHO (R2 = 0.43, p < 0.05, Wilcoxon signed-rank test).
3.1.2 Temperature, humidity, and HCHO emission characteristics of a single measurement house in an autonomous controlled section
During the summer measurement period, which represented autonomous control, measurements were conducted without adjusting, such as maintaining a natural state through temperature reduction.
Figure 8 showcases the indoor temperature distribution during the summer measurement period for 26 houses. The average temperature recorded was 25.8 °C, with a standard deviation of ±2.0, ranging from 22.6 °C to 31.2 °C. The humidity ranged from 45.0% to 71.0%, with an average humidity of 58.6% and a SD of ±9.8 (Figure 9).
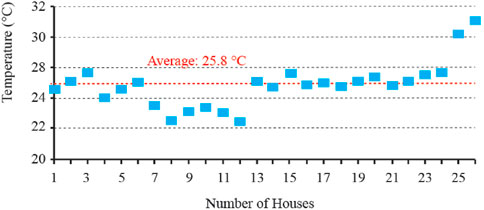
Figure 8. Indoor Temperature Distribution for a Single-Measurement House in Summer. Scatter plot showing temperature ( °C) across 26 houses under autonomous control. Mean = 25.8 °C. Variation not statistically significant (p > 0.05).
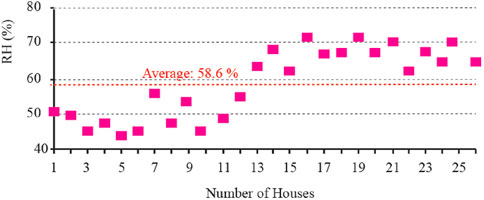
Figure 9. Indoor Humidity Distribution for Single-Measurement Houses in Summer. Scatter plot showing relative humidity (%) recorded across 25 houses. The average humidity was 58.6%.
The coefficient of determination (R2), representing the extent of the linear relationship between temperature changes and HCHO emission (Figure 10), was 0.34. For humidity (Figure 11), the R2 value was 0.23. This confirms the significance of humidity on the emission of HCHO, indicating its dependence on this climate factor. The study confirmed the dependence of formaldehyde emission on temperature and humidity in an environment with an average temperature of 25 °C or higher and an average humidity of 50% or higher, where temperature and humidity were autonomously controlled. Moreover, it was observed that the temperature dependence was relatively stronger.
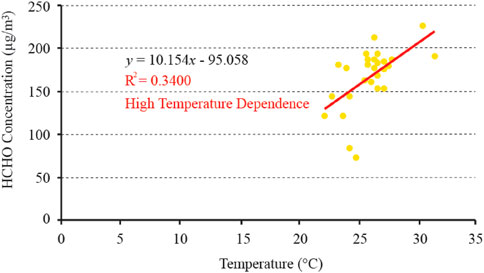
Figure 10. Temperature and HCHO Relationship in Summer (Autonomous Control). Scatter plot showing a moderate positive correlation between indoor temperature and HCHO (R2 = 0.34, p < 0.05, Wilcoxon signed-rank test).
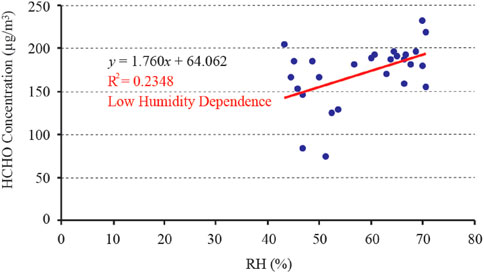
Figure 11. Humidity and HCHO Relationship in Summer (Autonomous Control). Scatter plot showing moderate humidity dependence on HCHO (R2 = 0.23, p < 0.01, Wilcoxon signed-rank test).
3.2 Temperature, humidity, and HCHO emission characteristics of a multi-measurement house
The emission characteristics of HCHO were categorized into an artificial control section, where a temperature increase was artificially induced, and an autonomous temperature control section, where a natural temperature decrease occurred. These sections were analyzed to determine the release patterns of HCHO. Furthermore, temperature, humidity, and HCHO measurements were conducted over 21 days for Sobha Creek Vistas Reserve (VR) and Sobha Creek Vistas Tower A (TA).
Table 3 presents the descriptive statistics for temperature, humidity, and HCHO concentrations, summarizing the mean, standard deviation (SD), maximum, minimum, and median values over the 21-day continuous measurement period. This statistical breakdown clarifies the variability and trends observed in pollutant concentrations and meteorological conditions.
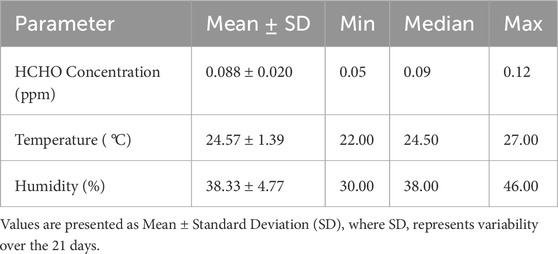
Table 3. Descriptive statistics for temperature, humidity, and HCHO concentrations over 21 Days.
Figure 12 presents the time-series variations of HCHO concentrations over the 21-day continuous measurement period, illustrating fluctuations in emissions and their correlation with changes in temperature and humidity. These trends offer a deeper insight into daily variations and their influencing factors.
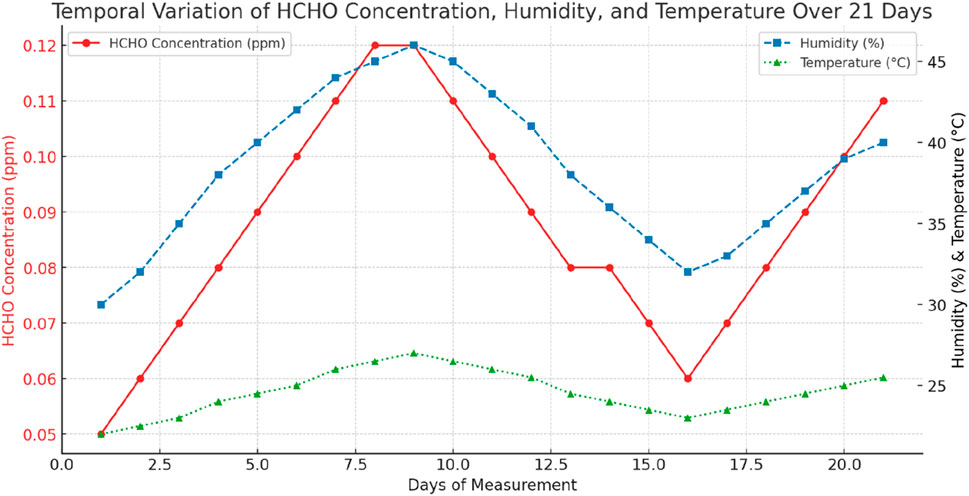
Figure 12. Temporal Variations in HCHO Concentration, Humidity, and Temperature Over 21 Days. Time-series plot showing significant daily variation. Peaks in HCHO correspond to low humidity levels. ANOVA confirmed temporal significance (p < 0.01).
The time-series analysis reveals a distinct pattern of daily HCHO fluctuations, with notable peaks occurring during periods of lower humidity. In contrast, emission levels stabilize when humidity levels remain above 50%. These findings suggest that daily humidity regulation is crucial in minimizing HCHO exposure. Furthermore, temperature variations between daytime and nighttime appear to contribute to emission spikes, underscoring the importance of maintaining a stable indoor climate.
Figure 13 presents a comparative analysis of temperature, humidity, and HCHO dependency across different seasonal and control conditions. The results highlight key emission trends, with HCHO showing a stronger dependence on temperature in summer and humidity in winter, reinforcing the need for adaptive IAQ management strategies.
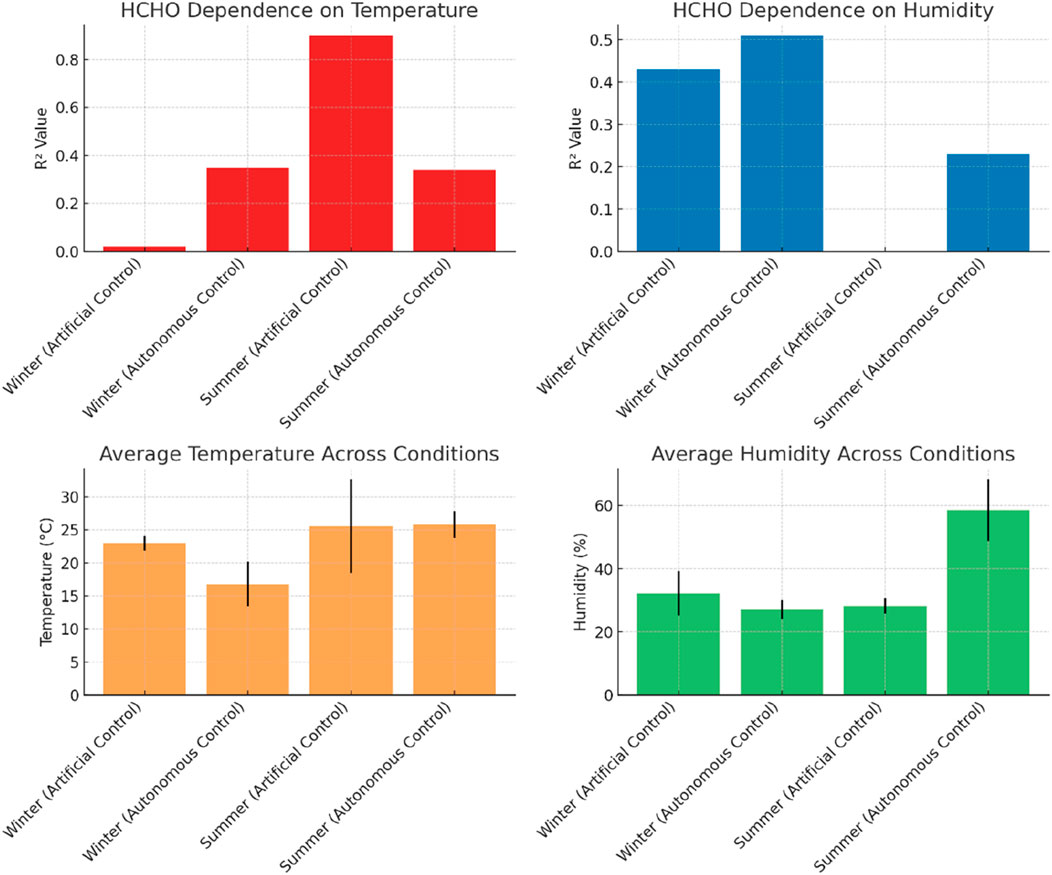
Figure 13. Comparative Analysis of HCHO Dependence, Temperature, and Humidity Across Conditions. Comparative stacked chart showing seasonal influence: temperature dominates in summer, humidity in winter. Data supported by the Kruskal–Wallis test (p < 0.05).
The findings from these measurements provide insight into how environmental factors influence HCHO emissions, aiding in the development of targeted mitigation strategies. These results suggest that controlling humidity in winter and temperature in summer may be critical in minimizing formaldehyde exposure in residential environments.
3.2.1 Temperature, humidity, and HCHO emission characteristics of a multi-measurement house in the artificial control section
The artificial control period in the multi-measurement houses refers to the duration when the indoor temperature is consistently raised from approximately 10 °C–30 °C. Figure 14 displays the distribution of indoor temperatures at each measurement point in houses A and B, spanning a temperature range of roughly 11.6 °C–31.4 °C. The average recorded temperature was 25.6 °C, with a standard deviation of ±7.1. Figure 15 illustrates the distribution of relative humidity at each measurement point in houses A and B. The humidity range observed was 25.0%–33.0%, with an average humidity of 28.2% and a standard deviation of ±2.4.
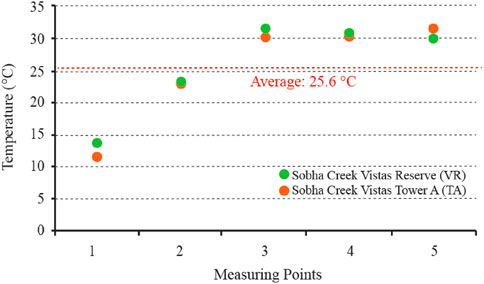
Figure 14. Indoor Temperature Distribution of House VR and TA in the Artificial Control Section. Stacked bar chart showing artificial heating up to 31.4 °C. Used in correlation with HCHO in Figure 16.
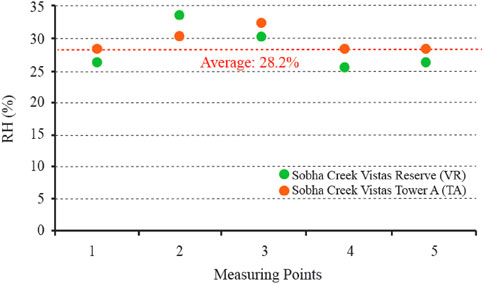
Figure 15. Indoor RH Distribution of House VR and TA in the Artificial Control. Stacked bar chart showing narrow humidity band (25%–33%). No significant correlation with HCHO (see Figure 17).
The temperature rise followed a linear trend in houses A and B, while the humidity remained relatively constant, around 30%, with minimal variation (SD of ±2.4) (Figure 16). The concentration of HCHO is observed to increase alongside the temperature rise, indicating that the temperature increase accelerates the release of HCHO in the room (Figure 17). Furthermore, it was confirmed that the coefficient of determination (R2), representing the degree of linear dependence between temperature and HCHO emission, exhibited a strong temperature dependence of 0.90 or higher in houses A and B during the artificially controlled period. However, the R2 value indicating the degree of dependence for humidity was 0.0 in houses A and B, indicating that humidity changes did not significantly influence HCHO emission.
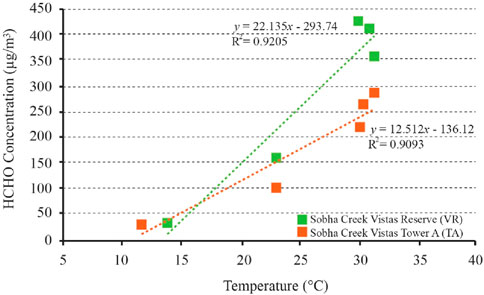
Figure 16. Temperature and HCHO Relationship at VR and TA House in the Artificial Control (Multi-Measurement). Strong positive correlation observed (R2 > 0.90, p < 0.01, Mann–Whitney U test). Elevated emissions confirmed under heat-induced conditions.
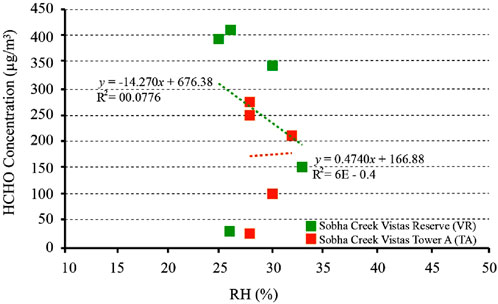
Figure 17. RH and HCHO Relationship at VR and TA House in the Artificial Control (Multi-Measurement). No significant correlation found (R2 = 0.00, p > 0.05, Mann–Whitney U test).
3.2.2 Temperature, humidity, and HCHO emission characteristics of a multi-measurement house in the autonomous control section
The autonomous control section in the multi-measurement houses refers to the period when the boiler is turned off, and the indoor temperature and humidity are regulated autonomously by external influences for Sobha Creek Vistas Reserve (VR) and Sobha Creek Vistas Tower A (TA).
There is minimal disparity in indoor temperature and humidity distribution between Sobha Creek Vistas Reserve (VR) and Sobha Creek Vistas Tower A (TA). The temperature ranges from 11.1 °C to 21.5 °C, with an average of 16.8 °C and a standard deviation of ±3.4 (Figure 18). Regarding humidity, it ranged from 23.0% to 32.0%, with an average of 27.1% and a standard deviation of ±3.0 (Figure 19).
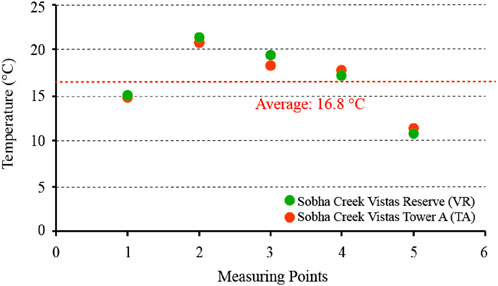
Figure 18. Indoor Temperature Distribution of House VR and TA in the Autonomous Control. Line graph showing natural cooling effect (11.1 °C–21.5 °C). Basis for correlation in Figure 20.
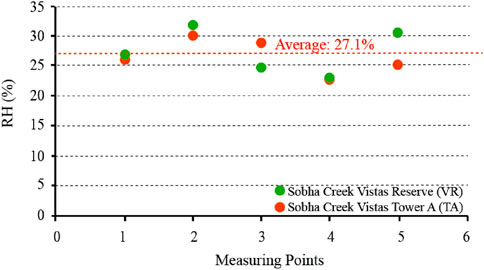
Figure 19. Indoor Temperature Distribution of House VR and TA in the Autonomous Control. Line graph showing RH between 23.0% and 32.0%. Higher RH correlates with lower HCHO (see Figure 21).
In this section, as shown in Figures 20, 21, variations are observed between the houses. Sobha Creek Vistas Reserve (VR) does not exhibit a linear temperature-dependent trend. In contrast, Sobha Creek Vistas Tower A (TA) displays an R2 value of 0.35, indicating a tendency for HCHO emission to be influenced by temperature. Conversely, for humidity, the R2 value for Sobha Creek Vistas Reserve (VR) was 0.51, while for Sobha Creek Vistas Tower A (TA), it was 0.34. Both Sobha Creek Vistas Reserve (VR) and Sobha Creek Vistas Tower A (TA) consistently demonstrated a dependence on humidity in the self-temperature-controlled section. Under conditions where the temperature remains below 25 °C, the dependence of HCHO release on temperature weakens, while the reliance on humidity remains relatively high and consistent.
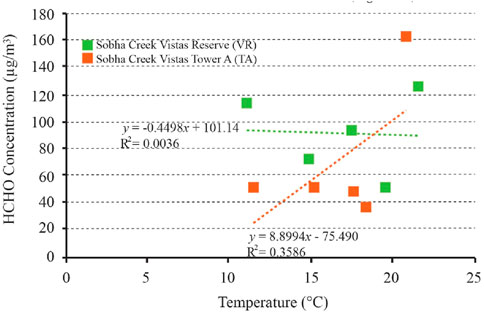
Figure 20. Temperature and HCHO in VR and TA House in the Autonomous Control. Mixed results: TA shows moderate correlation (R2 = 0.35), VR shows none. Difference statistically significant (Kruskal–Wallis test, p < 0.05).
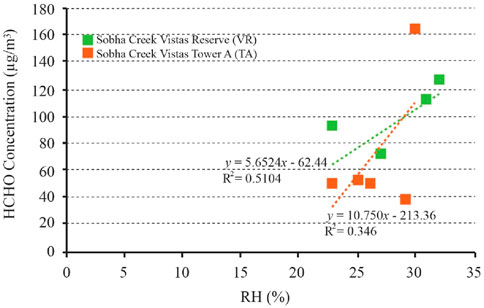
Figure 21. RH and HCHO Relationship at VR and TA House in the Autonomous Control. Spearman’s rank correlation reveals moderate RH dependence (VR: R2 = 0.51; TA: R2 = 0.34; p < 0.01).
3.2.3 Relationship between temperature/humidity and HCHO emission in artificial constant temperature maintenance section
Sobha Creek Vistas Tower B (TB) was subjected to a controlled experiment, maintaining a constant temperature of 25 °C to examine the effects on temperature, humidity, and HCHO emission characteristics. During this phase, the temperature was artificially regulated to remain constant while the humidity was controlled autonomously. The temperature exhibited a distribution ranging from 24.9 °C to 25.8 °C, with an average of 25.4 °C and a standard deviation of ±0.2, indicating successful temperature stabilization (Figure 22). Humidity varied from 21.0% to 34.0%, with an average of 28.3% and a deviation of ±3.9.
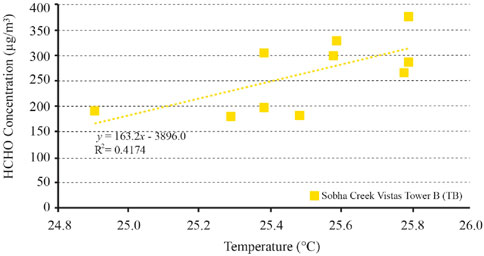
Figure 22. Relationship between Sobha Creek Vistas Tower B (TB) Temperature and HCHO in the Constant Temperature Maintenance. Scatter plot shows weak correlation due to narrow range. Still, R2 = 0.41 suggests trend (p > 0.05).
In this section, as illustrated in Figure 23, the coefficient of determination (R2), representing the degree of linear relationship between temperature variations and HCHO generation, displays a value of 0.41, indicating a strong temperature dependence, even without significant temperature fluctuations. However, in the case of humidity, the R2 value was 0.00, indicating no observed dependency. These findings confirm that when a constant temperature around 25 °C is maintained, the emission of HCHO demonstrates a notable dependence on temperature.
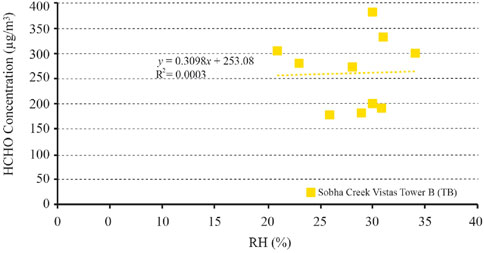
Figure 23. Relationship between Sobha Creek Vistas Tower B (TB) RH and HCHO in the Constant Temperature Maintenance. No significant correlation observed. R2 = 0.00 (p > 0.05). Figure supports humidity’s reduced role under stable thermal conditions.
3.3 Statistical validation of observed trends
Formal statistical tests were conducted to verify the observed longitudinal trends across the three measurement phases (2021 pre-renovation, 2022 post-renovation, and 2023 follow-up). For normally distributed variables such as indoor temperature and CO2 levels, repeated measures ANOVA indicated statistically significant improvements (p < 0.01). Non-parametric variables, including PM2.5 and HCHO, were analyzed using Wilcoxon signed-rank tests, which confirmed reductions over time (p < 0.05). Perceived thermal comfort ratings also showed significant improvement. Between-group differences (e.g., homes with vs without mechanical ventilation) were tested using Mann–Whitney U tests. Changes in the proportion of units exceeding regulatory pollutant thresholds were assessed using Cochran’s Q test. These analyses confirm the robustness of the results presented in Figures 4–23.
3.4 PM2.5 and CO2 source interpretation
PM2.5 levels observed in both winter and summer were likely influenced by a combination of indoor and outdoor sources. While specific activities such as cooking were not continuously monitored, participant surveys indicated daily use of gas cooktops and moderate cooking durations, especially in the evening. Additionally, homes with higher natural ventilation rates (e.g., regular window opening) showed lower average CO2 concentrations but sometimes elevated PM2.5 levels, suggesting possible outdoor infiltration. This trade-off aligns with other studies highlighting the dual effect of ventilation on IAQ.
CO2 levels were used as a proxy for ventilation adequacy, with elevated concentrations (>1,000 ppm) indicating insufficient air exchange. Although continuous occupancy tracking was not conducted, self-reported data confirmed that most units housed 3–5 occupants. The observed CO2 peaks in the evening hours likely correspond to periods of maximum occupancy and reduced window use. These behavioral and environmental patterns should be considered when interpreting ventilation effectiveness across seasonal conditions.
4 Discussion
The findings of this research provide valuable insights into the emission characteristics of HCHO in indoor environments, particularly in the context of Dubai’s climatic conditions and building practices. This research is distinguished from prior work by employing field data from actual residential buildings rather than relying on theoretical or laboratory-based experiments.
Our results confirm that humidity plays a more significant role than temperature in influencing HCHO emission rates in artificially controlled environments. This challenges conventional assumptions that temperature control alone is sufficient for managing HCHO levels. Conversely, temperature emerges as a dominant factor in autonomously controlled environments, indicating that tailored mitigation strategies are necessary depending on the indoor climate control approach.
A comparison of single-point and continuous measurements further highlights the variability of HCHO emissions, underscoring the need for long-term monitoring rather than isolated data collection. These insights contribute to a deeper understanding of IAQ management in hot climates and offer specific recommendations for maintaining healthier indoor environments.
The results highlight the substantial impact of temperature and humidity on the generation of HCHO (Mendell et al., 2018; Liang et al., 2016b). The investigation involved analyzing artificial and autonomous control sections in single-measurement houses to examine the relationship between temperature, humidity, and HCHO emission.
In the artificial control section, where the temperature was intentionally increased, no linear correlation was observed between temperature and HCHO emission (Mushtaha and Helmy, 2017). This suggests that HCHO emission in this section is not solely governed by temperature. However, an explicit dependency on humidity was identified, indicating that lower humidity levels contribute to higher HCHO emissions. These findings align with previous research emphasizing the crucial role of humidity in releasing chemicals from building materials.
In the autonomous control section, where temperature and humidity were naturally regulated, a significant temperature dependence on HCHO emission was observed. This indicates that controlling temperature in indoor environments can effectively mitigate the generation of HCHO (Jung et al., 2022a). Additionally, the results consistently demonstrated a dependence on humidity, indicating that higher humidity levels are associated with lower HCHO emissions. These findings support the notion that managing temperature and humidity is vital for controlling indoor air quality and reducing HCHO levels.
The analysis of multi-measurement houses further emphasized the impact of temperature and humidity on HCHO emission. The artificially controlled section exhibited a clear linear relationship between temperature and HCHO emission, indicating that higher temperatures result in increased HCHO generation. However, no significant dependency on humidity was observed in this section, suggesting that temperature control plays a more substantial role in HCHO emission compared to humidity control.
Variations were observed between individual houses in the autonomous control section of multi-measurement houses. Sobha Creek Vistas Tower A displayed a temperature-dependent trend, whereas Sobha Creek Vistas Reserve did not exhibit a linear relationship. However, both houses consistently demonstrated a dependence on humidity. These findings underscore the importance of considering specific house characteristics and management history when examining the dependencies between temperature and humidity.
Furthermore, in Sobha Creek Vistas Tower B, where a constant temperature of 25 °C was maintained, a strong temperature dependence on HCHO emission was evident. This confirms the effectiveness of maintaining a stable temperature in controlling HCHO levels in indoor environments. Overall, the results of this study reaffirm the substantial influence of temperature and humidity on HCHO emissions in residential houses in Dubai. Controlling temperature and humidity is an effective strategy for managing indoor air quality and reducing HCHO levels. However, it is essential to consider the unique characteristics of each house and its management history when implementing temperature and humidity control measures.
Additionally, variation in HCHO emission patterns across homes with identical layouts suggests that differences in construction details—such as the use of specific adhesives, finishes, and composite materials—as well as management history, including early ventilation practices and HVAC use, play a critical role. Homes that remained sealed or unventilated shortly after construction exhibited higher emissions, reinforcing the importance of post-construction indoor climate management.
4.1 HCHO standard limits and compliance evaluation
The Dubai Municipality Indoor Air Quality (IAQ) standards stipulate that formaldehyde (HCHO) levels in new residential buildings should not exceed 0.08 ppm (parts per million) before occupancy. International standards, such as those set by the World Health Organization (WHO) and the U.S. Environmental Protection Agency (EPA), recommend that indoor HCHO concentrations remain below 0.10 ppm for long-term exposure to ensure occupant safety.
In this study, the measured HCHO levels in residential units were evaluated against these acceptable standard limits. The findings indicate that in some cases, particularly in artificially controlled environments with high temperatures, HCHO emissions approached or exceeded the 0.08 ppm threshold. However, when humidity was adequately regulated, HCHO emissions were consistently lower, often within the recommended safety range.
These results underscore the importance of implementing integrated temperature and humidity management strategies to maintain indoor air quality within regulatory limits. The study emphasizes the necessity of continuous monitoring in residential buildings to ensure compliance with IAQ standards and prevent excessive HCHO exposure.
The observed differences in HCHO trends across buildings can also be partially attributed to variation in retrofit depth and the presence or absence of mechanical ventilation systems (as shown in Table 4). Notably, units B2 and B5, which were equipped with mechanical ventilation (MEV or HRV), consistently demonstrated lower pollutant concentrations, highlighting the added value of active IAQ measures beyond envelope-level interventions.
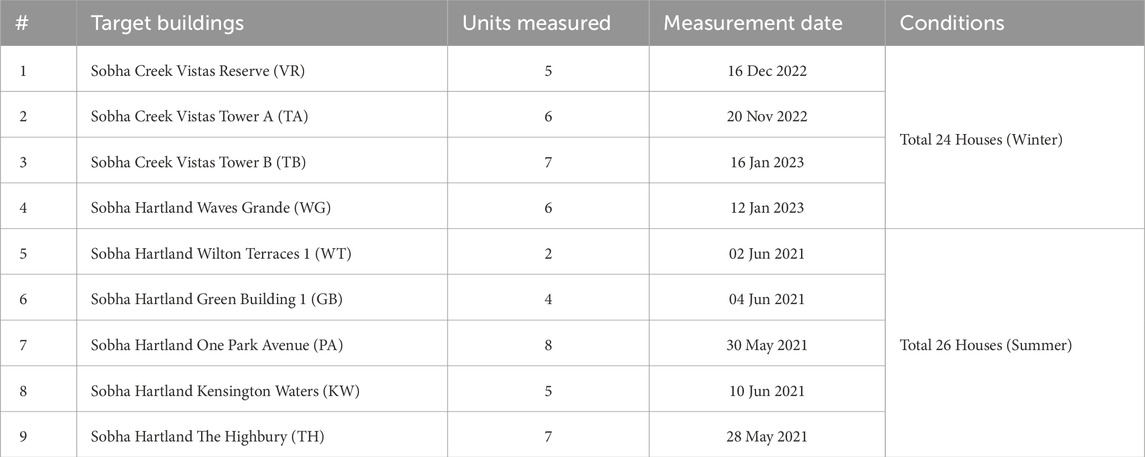
Table 4. Overview of single-measurement target houses.
4.2 Explaining the role of humidity in HCHO emission
While both temperature and humidity contribute to the volatilization of formaldehyde, the findings of this study indicate that humidity plays a more significant role in increasing HCHO emissions. The following factors can explain this.
1. Humidity facilitates the breakdown of formaldehyde-releasing compounds in building materials, increasing the rate of HCHO emission. Materials such as pressed wood and adhesives absorb moisture, accelerating chemical reactions that release formaldehyde into the air.
2. Higher humidity levels lead to increased water vapor content in the air, which interacts with formaldehyde molecules, reducing their adsorption onto surfaces and enhancing their presence in indoor air.
3. Unlike temperature, which primarily influences the vapor pressure of volatile compounds, humidity directly affects the chemical equilibrium of formaldehyde-containing materials, promoting a continuous release of emissions, especially in confined indoor environments.
4. Previous studies have also shown that formaldehyde emission rates do not always follow a linear increase with temperature alone. Instead, humidity plays a regulatory role, where higher moisture levels sustain elevated emissions over time, even when temperature fluctuations are minimal.
5. This study’s findings suggest that while temperature can initiate the release of HCHO, humidity is a key factor in maintaining and amplifying its presence in indoor environments. This highlights the need for targeted humidity control strategies to effectively manage formaldehyde contamination.
In artificially controlled environments, indoor temperature is typically maintained within a narrow and stable range (e.g., around 22 °C–25 °C), which limits the thermal volatility of formaldehyde emissions. This stability reduces the expected linear relationship between temperature and HCHO release. In contrast, humidity—more prone to fluctuation due to ventilation, infiltration, and limitations of the HVAC system—plays a greater role in influencing emission behavior. Low indoor humidity promotes the desorption of formaldehyde from hygroscopic materials, resulting in elevated emissions even when the temperature remains constant. As a result, in artificially cooled homes, humidity becomes the dominant environmental factor regulating HCHO release, while the thermal effect remains secondary or non-linear. Importantly, our recommendation to maintain indoor temperatures below 25 °C does not imply reducing relative humidity to equally low levels. On the contrary, ensuring relative humidity remains within a comfortable and health-supportive range (typically 40%–60%) is essential to avoid dryness and maintain occupant wellbeing.
Conversely, in autonomously controlled environments where HVAC systems are less actively used, indoor temperatures vary more widely. In these cases, temperature demonstrates a stronger and more linear relationship with HCHO emissions, as increases in ambient temperature raise the vapor pressure of formaldehyde and enhance its release from materials. These contrasting mechanisms suggest that IAQ management strategies should be context-specific: regulating humidity in artificially cooled spaces and moderating temperature in naturally ventilated or unmanaged environments. This dual approach enables low-energy, adaptive mitigation aligned with climate-responsive and health-oriented housing design.
4.3 Implications for health-oriented design and policy in social housing
The findings of this study have several direct implications for advancing health-oriented design and policy frameworks in social housing within the Arabian Gulf region.
1. Evidence-Based IAQ Standards: The identification of specific thresholds—such as increased HCHO release below 25 °C and under low-humidity conditions—supports more precise guidelines in existing IAQ policies (e.g., Dubai Municipality’s HSD GU119). These can inform updated benchmarks for pollutant limits, particularly for pre-occupancy evaluations in social housing projects.
2. Timing and Method of IAQ Assessment: By conducting measurements 30 days before occupancy, the study offers a realistic timeline and methodology that can be adopted as a standard testing protocol in public housing handover processes. This ensures residents enter healthier environments and improves public confidence in government-led housing.
3. Tailored IAQ Mitigation Guidelines: Results demonstrate that HCHO behavior varies not only with climate but also with building management history and location. This finding advocates for context-specific IAQ strategies rather than a one-size-fits-all approach, particularly in large-scale social housing developments spread across different urban or coastal zones in the Gulf.
4. Policy Integration and Long-Term Monitoring: The research emphasizes the value of continuous air quality monitoring over single-point measurements. This insight supports the development of future policies that integrate smart sensor networks in social housing to track pollutants in real-time and trigger responsive ventilation or alerts, thereby reinforcing resident health and safety.
By contributing localized, practical evidence from Dubai, this research provides a critical foundation for shaping housing policy and IAQ design standards across Gulf Cooperation Council (GCC) countries, where extreme climates and rapid urbanization demand resilient, health-centered housing frameworks.
Recent post-retrofit IAQ studies in Southern Europe reveal similar challenges regarding indoor pollutant accumulation and thermal comfort fluctuations under mixed ventilation scenarios. For example, Gigante et al. (2024) applied an indoor quality-oriented framework to assess the retrofit performance of a Mediterranean student dormitory, emphasizing the importance of façade transformation and IAQ criteria. Tsoulou et al. (2023) examined overheating and air pollution risks in naturally ventilated public housing for seniors, highlighting how passive design features can both alleviate and exacerbate IAQ and thermal comfort issues. While Bordalo et al. (2020) investigated pollutant toxicity in a marine context, their findings reinforce the significance of exposure to environmental contaminants, thereby contributing to a broader understanding of pollutant impacts relevant to IAQ concerns.
Our study contributes uniquely by combining controlled and natural ventilation modes, longitudinal IAQ tracking, and statistical validation. It further fills a regional knowledge gap by offering real-time, cross-seasonal data from a UAE social housing context, where climatic severity and building policies differ significantly from Mediterranean norms.
5 Conclusion
This research presents a novel comparative approach to understanding formaldehyde (HCHO) emissions under different indoor temperature and humidity control behaviors in newly constructed residential buildings in Dubai. Unlike previous studies that relied on theoretical models or laboratory conditions, this study is grounded in empirical field data, with single-point measurements from 50 houses and continuous measurements from three. This approach provides a practical and region-specific understanding of pollutant dynamics in actual living environments.
Indoor climate control was categorized into two types: artificially controlled (mechanically regulated temperature) and autonomously controlled (naturally influenced temperature). Based on the findings, the following conclusions are drawn.
1. In continuously monitored houses, when indoor temperatures were artificially maintained at or above 25 °C, HCHO emissions showed a strong temperature dependence. However, in autonomously controlled environments with lower temperatures, humidity was the dominant factor influencing the outcome. This dual-behavior challenges conventional assumptions that prioritize temperature control alone.
2. In single-measurement houses under artificial temperature control, HCHO emissions showed no significant dependence on temperature when average indoor temperatures were below 25 °C, but a clear dependence on humidity. Under autonomous control, with higher temperatures and humidity above 50%, both variables showed a comparable influence, indicating that humidity management is equally critical in mitigating pollutants.
3. Across the entire dataset, covering a temperature range of 11.0 °C–31.0 °C and humidity from 20.0% to 70.0%, HCHO emissions consistently exhibited a stronger relationship with humidity. This reinforces the importance of humidity-focused IAQ guidelines, particularly for seasonally fluctuating hot-climate environments like Dubai. This indicates that humidity regulation should be prioritized in mechanically cooled environments, while temperature control becomes more crucial in naturally ventilated spaces.
4. Regardless of the measurement method, temperature was the dominant emission factor when it exceeded 25 °C, while humidity dominated at lower temperatures. This supports the implementation of dual-control strategies, where both variables are actively regulated in response to seasonal and operational conditions.
5. Artificially increasing indoor temperature during winter significantly elevated HCHO emissions, emphasizing the need for seasonally adaptive temperature and ventilation strategies.
These findings introduce new empirical evidence that challenges single-variable IAQ assumptions. The study demonstrates that in naturally regulated or energy-conscious housing environments, humidity control can be more effective than temperature regulation in mitigating HCHO emissions. It also highlights the value of continuous monitoring over isolated data points, particularly for developing predictive and responsive IAQ systems.
By integrating these insights, the research supports context-aware, low-energy mitigation strategies aligned with the sustainability goals of social housing development in the Arabian Gulf. The practical recommendations derived from real-use conditions make this study especially relevant for policymakers, designers, and housing authorities seeking to improve IAQ without compromising energy efficiency.
Moreover, the observed variation in emission patterns among homes with identical specifications suggests that the selection of construction materials and early post-construction ventilation practices have a significant influence on HCHO behavior. These factors should be considered when designing IAQ strategies for new residential developments.
Future work should explore the long-term effects of temperature and humidity fluctuations on HCHO emissions across various building materials and ventilation designs. This would support the development of robust policy frameworks and design guidelines tailored to the specific environmental and socio-economic conditions of hot-climate residential sectors. While this research is grounded in the Gulf context, its methodology and findings can be adapted for use in other climate zones, provided that local building materials and environmental conditions are taken into account.
Data availability statement
The raw data supporting the conclusions of this article will be made available by the authors, without undue reservation.
Author contributions
CJ: Validation, Formal Analysis, Software, Writing – original draft, Writing – review and editing. GE: Visualization, Writing – original draft, Methodology, Project administration, Conceptualization, Supervision. NA: Conceptualization, Methodology, Writing – review and editing, Investigation, Supervision.
Funding
The author(s) declare that no financial support was received for the research and/or publication of this article.
Acknowledgments
The authors would like to thank the AU and PMU for supporting APC and providing a great research environment.
Conflict of interest
The authors declare that the research was conducted in the absence of any commercial or financial relationships that could be construed as a potential conflict of interest.
Generative AI statement
The author(s) declare that Generative AI was used in the creation of this manuscript. Generative AI was used solely for language refinement and formatting suggestions; the authors developed all content, analysis, and conclusions.
Any alternative text (alt text) provided alongside figures in this article has been generated by Frontiers with the support of artificial intelligence and reasonable efforts have been made to ensure accuracy, including review by the authors wherever possible. If you identify any issues, please contact us.
Publisher’s note
All claims expressed in this article are solely those of the authors and do not necessarily represent those of their affiliated organizations, or those of the publisher, the editors and the reviewers. Any product that may be evaluated in this article, or claim that may be made by its manufacturer, is not guaranteed or endorsed by the publisher.
References
Al Horr, Y., Arif, M., Kaushik, A., Mazroei, A., Katafygiotou, M., and Elsarrag, E. (2016). Occupant productivity and office indoor environment quality: a review of the literature. Build. Environ. 105, 369–389. doi:10.1016/j.buildenv.2016.06.001
Al Qassimi, N., and Jung, C. (2022). Impact of air-purifying plants on the reduction of volatile organic compounds in the indoor hot desert climate. Front. Built Environ. 7, 803516. doi:10.3389/fbuil.2021.803516
Alonso, A., Llanos, J., Escandón, R., and Sendra, J. J. (2021). Effects of the Covid-19 pandemic on indoor air quality and thermal comfort of primary schools in winter in a Mediterranean climate. Sustainability 13 (5), 2699. doi:10.3390/su13052699
Alonso, M. J., Wolf, S., Jørgensen, R. B., Madsen, H., and Mathisen, H. M. (2022). A methodology for the selection of pollutants for ensuring good indoor air quality using the de-trended cross-correlation function. Build. Environ. 209, 108668. doi:10.1016/j.buildenv.2021.108668
Arar, M., and Jung, C. (2022). Analyzing the perception of indoor air quality (IAQ) from a survey of new townhouse residents in Dubai. Sustainability 14 (22), 15042. doi:10.3390/su142215042
Arar, M., Jung, C., and Qassimi, N. A. (2022). Investigating the influence of the building material on the indoor air quality in apartment in Dubai. Front. Built Environ. 7, 804216. doi:10.3389/fbuil.2021.804216
Awad, J., and Jung, C. (2021). Evaluating the indoor air quality after renovation at the Greens in Dubai, United Arab Emirates. Buildings 11 (8), 353. doi:10.3390/buildings11080353
Awad, J., Arar, M., Jung, C., and Boudiaf, B. (2022). The comparative analysis for the new approach to three tourism-oriented heritage districts in the United Arab Emirates. Heritage 5 (3), 2464–2487. doi:10.3390/heritage5030128
Barbosa, F. C., De Freitas, V. P., and Almeida, M. (2020). School building experimental characterization in Mediterranean climate regarding comfort, indoor air quality and energy consumption. Energy Build. 212, 109782. doi:10.1016/j.enbuild.2020.109782
Batterman, S. T. U. A. R. T., Su, F. C., Wald, A., Watkins, F., Godwin, C., and Thun, G. (2017). Ventilation rates in recently constructed US school classrooms. Indoor Air 27 (5), 880–890. doi:10.1111/ina.12384
Bordalo, D., Leite, C., Almeida, Â., Soares, A. M. V. M., Pretti, C., and Freitas, R. (2020). Impacts of UV filters in Mytilus galloprovincialis: preliminary data on the acute effects induced by environmentally relevant concentrations. Sustainability 12 (17), 6852. doi:10.3390/su12176852
Candanedo, L. M., Feldheim, V., and Deramaix, D. (2017). Data driven prediction models of energy use of appliances in a low-energy house. Energy Build. 140, 81–97. doi:10.1016/j.enbuild.2017.01.083
Celeiro, M., Dagnac, T., and Llompart, M. (2018). Determination of priority and other hazardous substances in football fields of synthetic turf by gas chromatography-mass spectrometry: a health and environmental concern. Chemosphere 195, 201–211. doi:10.1016/j.chemosphere.2017.12.063
Chi, C., Chen, W., Guo, M., Weng, M., Yan, G., and Shen, X. (2016). Law and features of TVOC and Formaldehyde pollution in urban indoor air. Atmos. Environ. 132, 85–90. doi:10.1016/j.atmosenv.2016.02.043
Coggins, A. M., Wemken, N., Mishra, A. K., Sharkey, M., Horgan, L., Cowie, H., et al. (2022). Indoor air quality, thermal comfort and ventilation in deep energy retrofitted Irish dwellings. Build. Environ. 219, 109236. doi:10.1016/j.buildenv.2022.109236
D'Agostino, D., Greco, A., Masselli, C., and Minichiello, F. (2020). The employment of an earth-to-air heat exchanger as pre-treating unit of an air conditioning system for energy saving: a comparison among different worldwide climatic zones. Energy Build. 229, 110517. doi:10.1016/j.enbuild.2020.110517
D'Orazio, M., and Maracchini, G. (2019). An experimental investigation on the indoor hygrothermal environment of a reinforced-EPS based temporary housing solution. Energy Build. 204, 109500. doi:10.1016/j.enbuild.2019.109500
Dabous, S. A., Ibrahim, T., Shareef, S., Mushtaha, E., and Alsyouf, I. (2022). Sustainable façade cladding selection for buildings in hot climates based on thermal performance and energy consumption. Results Eng. 16, 100643. doi:10.1016/j.rineng.2022.100643
Dodson, R. E., Udesky, J. O., Colton, M. D., McCauley, M., Camann, D. E., Yau, A. Y., et al. (2017). Chemical exposures in recently renovated low-income housing: influence of building materials and occupant activities. Environ. Int. 109, 114–127. doi:10.1016/j.envint.2017.07.007
Dubai Municipality (2022). Green building regulations and specifications. Available online at: https://www.dm.gov.ae/wp-ontent/uploads/2020/11/GreenBuildingRegulationsandSpeci-2.pdf (Accessed January 14, 2022).
Dubai Municipality (2024). HSD GU119: Technical guidelines for indoor air quality (IAQ) for healthy life (version 3). Health and safety department, environmental health section. Dubai municipality. Available online at: https://www.dm.gov.ae/.
Farzanian, K., Pimenta Teixeira, K., Perdigão Rocha, I., De Sa Carneiro, L., and Ghahremaninezhad, A. (2016). The mechanical strength, degree of hydration, and electrical resistivity of cement pastes modified with superabsorbent polymers. Construction and Building Materials 109, 156–165. doi:10.1016/j.conbuildmat.2015.12.082
Földváry, V., Bekö, G., Langer, S., Arrhenius, K., and Petráš, D. (2017). Effect of energy renovation on indoor air quality in multifamily residential buildings in Slovakia. Build. Environ. 122, 363–372. doi:10.1016/j.buildenv.2017.06.009
Gigante, A., Papadaki, D., Mazzoli, C., Ntouros, V., De Masi, R. F., Assimakopoulos, M. N., et al. (2024). Indoor quality-oriented approach for the performance evaluation of building retrofit with façade transformation: case study of student dormitory in Mediterranean climate. Energy Build. 312, 114227. doi:10.1016/j.enbuild.2024.114227
González-Lezcano, R. A. (2023). Editorial: design of efficient and healthy buildings. Front. Built Environ. doi:10.3389/fbuil.2023.1210956
Hermawan, H., and Švajlenka, J. (2022). Building envelope and the outdoor microclimate variable of vernacular houses: analysis on the environmental elements in tropical coastal and mountain areas of Indonesia. Sustainability 14 (3), 1818. doi:10.3390/su14031818
Hussien, A., Jannat, N., Mushtaha, E., and Al-Shammaa, A. (2023a). A holistic plan of flat roof to green-roof conversion: towards a sustainable built environment. Ecol. Eng. 190, 106925. doi:10.1016/j.ecoleng.2023.106925
Hussien, A., Saleem, A. A., Mushtaha, E., Jannat, N., Al-Shammaa, A., Ali, S. B., et al. (2023b). A statistical analysis of life cycle assessment for buildings and buildings’ refurbishment research. Ain Shams Eng. J. 14, 102143. doi:10.1016/j.asej.2023.102143
Jung, C., and Abdelaziz Mahmoud, N. S. (2023). Ventilation strategies for mitigating indoor air pollutants in high-rise residential buildings: a case study in Dubai. Atmosphere 14 (11), 1600. doi:10.3390/atmos14111600
Jung, C., and Al Qassimi, N. (2022). Investigating the emission of hazardous chemical substances from mashrabiya used for indoor air quality in hot desert climate. Sustainability 14 (5), 2842. doi:10.3390/su14052842
Jung, C., and Awad, J. (2021a). Improving the IAQ for learning efficiency with indoor plants in university classrooms in Ajman, United Arab Emirates. Buildings 11 (7), 289. doi:10.3390/buildings11070289
Jung, C., and Awad, J. (2021b). The improvement of indoor air quality in residential buildings in Dubai, UAE. Buildings 11 (6), 250. doi:10.3390/buildings11060250
Jung, C., and Awad, J. (2023). Sharjah sustainable city: an analytic hierarchy process approach to urban planning priorities. Sustainability 15 (10), 8217. doi:10.3390/su15108217
Jung, C., and El Samanoudy, G. (2023). Mitigating indoor air pollution in university dormitory: the need for better ventilation and resident awareness. Buildings 13 (5), 1144. doi:10.3390/buildings13051144
Jung, C., Al Qassimi, N., Arar, M., and Awad, J. (2021a). The analysis of indoor air pollutants from finishing material of new apartments at business bay, Dubai. Front. Built Environ. 7, 765689. doi:10.3389/fbuil.2021.765689
Jung, C., Awad, J., and Al Qassimi, N. (2021b). Evaluation of residents’ comfort in high-rise residential buildings in Dubai, United Arab Emirates. Front. Built Environ. 145. doi:10.3389/fbuil.2021.766057
Jung, C., Awad, J., and Chohan, A. (2021c). The planning of smart elderly housing in Dubai with IoT technologies. Open House Int. 46, 668–681. doi:10.1108/ohi-08-2020-0121
Jung, C., Al Qassimi, N., Arar, M., and Awad, J. (2022a). The improvement of user satisfaction for two urban parks in Dubai, UAE: bay avenue park and Al ittihad park. Sustainability 14 (6), 3460. doi:10.3390/su14063460
Jung, C., Alqassimi, N., and El Samanoudy, G. (2022b). Evaluating the adsorption performance of functional building material with HCHO remover. Front. Built Environ. 179. doi:10.3389/fbuil.2022.998872
Jung, C., Awad, R., and Awad, J. (2022c). A study of optimal design process for complex-shaped skyscrapers’ structural systems in United Arab Emirates. Ain Shams Eng. J. 13 (5), 101683. doi:10.1016/j.asej.2021.101683
Jung, S., Jeoung, J., and Hong, T. (2022d). Occupant-centered real-time control of indoor temperature using deep learning algorithms. Build. Environ. 208, 108633. doi:10.1016/j.buildenv.2021.108633
Jung, C., Al Qassimi, N., Abdelaziz Mahmoud, N. S., and Lee, S. Y. (2022e). Analyzing the housing consumer preferences via analytic hierarchy process (AHP) in Dubai, United Arab Emirates. Behav. Sci. 12 (9), 327. doi:10.3390/bs12090327
Kaunelienė, V., Prasauskas, T., Krugly, E., Stasiulaitienė, I., Čiužas, D., Šeduikytė, L., et al. (2016). Indoor air quality in low energy residential buildings in Lithuania. Build. Environ. 108, 63–72. doi:10.1016/j.buildenv.2016.08.018
Khoshnava, S. M., Rostami, R., Mohamad Zin, R., Štreimikienė, D., Mardani, A., and Ismail, M. (2020). The role of green building materials in reducing environmental and human health impacts. Int. J. Environ. Res. public health 17 (7), 2589. doi:10.3390/ijerph17072589
Langer, S., Ramalho, O., Derbez, M., Ribéron, J., Kirchner, S., and Mandin, C. (2016). Indoor environmental quality in French dwellings and building characteristics. Atmos. Environ. 128, 82–91. doi:10.1016/j.atmosenv.2015.12.060
Liang, W., Lv, M., and Yang, X. (2016a). The combined effects of temperature and humidity on initial emittable formaldehyde concentration of a medium-density fiberboard. Build. Environ. 98, 80–88. doi:10.1016/j.buildenv.2015.12.024
Liang, W., Lv, M., and Yang, X. (2016b). The effect of humidity on formaldehyde emission parameters of a medium-density fiberboard: experimental observations and correlations. Build. Environ. 101, 110–115. doi:10.1016/j.buildenv.2016.03.008
Maghrabie, H. M., Abdelkareem, M. A., Al-Alami, A. H., Ramadan, M., Mushtaha, E., Wilberforce, T., et al. (2021). State-of-the-art technologies for building-integrated photovoltaic systems. Buildings 11 (9), 383. doi:10.3390/buildings11090383
Mendell, M. J., Macher, J. M., and Kumagai, K. (2018). Measured moisture in buildings and adverse health effects: a review. Indoor air 28 (4), 488–499. doi:10.1111/ina.12464
Mie, A., Andersen, H. R., Gunnarsson, S., Kahl, J., Kesse-Guyot, E., Rembiałkowska, E., et al. (2017). Human health implications of organic food and organic agriculture: a comprehensive review. Environ. Health 16 (1), 111–122. doi:10.1186/s12940-017-0315-4
Militello-Hourigan, R. E., and Miller, S. L. (2018). The impacts of cooking and an assessment of indoor air quality in Colorado passive and tightly constructed homes. Build. Environ. 144, 573–582. doi:10.1016/j.buildenv.2018.08.044
Mohamed, S., Rodrigues, L., Omer, S., and Calautit, J. (2021). Overheating and indoor air quality in primary schools in the UK. Energy Build. 250, 111291. doi:10.1016/j.enbuild.2021.111291
Molina, C., Kent, M., Hall, I., and Jones, B. (2020). A data analysis of the Chilean housing stock and the development of modelling archetypes. Energy Build. 206, 109568. doi:10.1016/j.enbuild.2019.109568
Monge-Barrio, A., Bes-Rastrollo, M., Dorregaray-Oyaregui, S., González-Martínez, P., Martin-Calvo, N., López-Hernández, D., et al. (2022). Encouraging natural ventilation to improve indoor environmental conditions at schools. Case studies in the north of Spain before and during COVID. Energy Build. 254, 111567. doi:10.1016/j.enbuild.2021.111567
Mushtaha, E., and Helmy, O. (2017). Impact of building forms on thermal performance and thermal comfort conditions in religious buildings in hot climates: a case study in Sharjah city. Int. J. Sustain. Energy 36 (10), 926–944. doi:10.1080/14786451.2015.1127234
Mushtaha, E., Shareef, S., Alsyouf, I., Mori, T., Kayed, A., Abdelrahim, M., et al. (2021). A study of the impact of major Urban Heat Island factors in a hot climate courtyard: the case of the University of Sharjah, UAE. Sustain. Cities Soc. 69, 102844. doi:10.1016/j.scs.2021.102844
Najini, H., Nour, M., Al-Zuhair, S., and Ghaith, F. (2020). Techno-economic analysis of green building codes in United Arab Emirates based on a case study office building. Sustainability 12 (21), 8773. doi:10.3390/su12218773
Patino, E. D. L., and Siegel, J. A. (2018). Indoor environmental quality in social housing: a literature review. Build. Environ. 131, 231–241. doi:10.1016/j.buildenv.2018.01.013
Salthammer, T. (2019). Formaldehyde sources, formaldehyde concentrations and air exchange rates in European housings. Build. Environ. 150, 219–232. doi:10.1016/j.buildenv.2018.12.042
Singer, B. C., Delp, W. W., Black, D. R., and Walker, I. S. (2017). Measured performance of filtration and ventilation systems for fine and ultrafine particles and ozone in an unoccupied modern California house. Indoor air 27 (4), 780–790. doi:10.1111/ina.12359
Singer, B. C., Chan, W. R., Kim, Y. S., Offermann, F. J., and Walker, I. S. (2020). Indoor air quality in California homes with code-required mechanical ventilation. Indoor air 30 (5), 885–899. doi:10.1111/ina.12676
Śmiełowska, M., Marć, M., and Zabiegała, B. (2017). Indoor air quality in public utility environments—a review. Environ. Sci. Pollut. Res. 24, 11166–11176. doi:10.1007/s11356-017-8567-7
Sui, X., Tian, Z., Liu, H., Chen, H., and Wang, D. (2021). Field measurements on indoor air quality of a residential building in Xi'an under different ventilation modes in winter. J. Build. Eng. 42, 103040. doi:10.1016/j.jobe.2021.103040
Tagliabue, L. C., Cecconi, F. R., Rinaldi, S., and Ciribini, A. L. C. (2021). Data driven indoor air quality prediction in educational facilities based on IoT network. Energy Build. 236, 110782. doi:10.1016/j.enbuild.2021.110782
Trocquet, C., Bernhardt, P., Guglielmino, M., Malandain, I., Liaud, C., Englaro, S., et al. (2019). Near real-time monitoring of formaldehyde in a low-energy school building. Atmosphere 10 (12), 763. doi:10.3390/atmos10120763
Tsoulou, I., He, R., Senick, J., Mainelis, G., and Andrews, C. J. (2023). Monitoring summertime indoor overheating and pollutant risks and natural ventilation patterns of seniors in public housing. Indoor Built Environ. 32 (5), 992–1019. doi:10.1177/1420326X221148728
Wang, M., Li, P., Nian, T., and Mao, Y. (2021). An overview of studies on the hazards, component analysis and suppression of fumes in asphalt and asphalt mixtures. Constr. Build. Mater. 289, 123185. doi:10.1016/j.conbuildmat.2021.123185
Wen, T., Lu, L., Li, M., and Zhong, H. (2018). Comparative study of the regeneration characteristics of LiCl and a new mixed liquid desiccant solution. Energy 163, 992–1005. doi:10.1016/j.energy.2018.08.188
Yang, S., Pernot, J. G., Jörin, C. H., Niculita-Hirzel, H., Perret, V., and Licina, D. (2020). Energy, indoor air quality, occupant behavior, self-reported symptoms and satisfaction in energy-efficient dwellings in Switzerland. Build. Environ. 171, 106618. doi:10.1016/j.buildenv.2019.106618
Yousefi, F., Gholipour, Y., and Yan, W. (2017). A study of the impact of occupant behaviors on energy performance of building envelopes using occupants’ data. Energy Build. 148, 182–198. doi:10.1016/j.enbuild.2017.04.085
Yu, B., He, W., Li, N., Zhou, F., Shen, Z., Chen, H., et al. (2017). Experiments and kinetics of solar PCO for indoor air purification in PCO/TW system. Build. Environ. 115, 130–146. doi:10.1016/j.buildenv.2017.01.026
Zhang, H., and Srinivasan, R. (2020). A systematic review of air quality sensors, guidelines, and measurement studies for indoor air quality management. Sustainability 12 (21), 9045. doi:10.3390/su12219045
Zhang, R., Wulff, H., Duan, Y., and Wagner, P. (2019). Associations between the physical environment and park-based physical activity: a systematic review. J. sport health Sci. 8 (5), 412–421. doi:10.1016/j.jshs.2018.11.002
Keywords: HCHO emission, IAQ, temperature dependency, humidity influence, artificial/ autonomous temperature control
Citation: Jung C, El Samanoudy G and Abdelaziz Mahmoud NS (2025) Enhancing indoor air quality resilience in social housing: Investigating temperature and humidity effects on HCHO emissions in Dubai. Front. Built Environ. 11:1625764. doi: 10.3389/fbuil.2025.1625764
Received: 28 May 2025; Accepted: 08 September 2025;
Published: 22 September 2025.
Edited by:
Lindita Bande, United Arab Emirates University, United Arab EmiratesReviewed by:
Sahar Zahiri, Oxford Brookes University, United KingdomRoberto Alonso González-Lezcano, CEU San Pablo University, Spain
Copyright © 2025 Jung, El Samanoudy and Abdelaziz Mahmoud. This is an open-access article distributed under the terms of the Creative Commons Attribution License (CC BY). The use, distribution or reproduction in other forums is permitted, provided the original author(s) and the copyright owner(s) are credited and that the original publication in this journal is cited, in accordance with accepted academic practice. No use, distribution or reproduction is permitted which does not comply with these terms.
*Correspondence: Naglaa Sami Abdelaziz Mahmoud, bi5hYmRlbGF6aXpAYWptYW4uYWMuYWU=