 Zequn Hou1
 Wanpeng Shi
- 1Guangxi Communications Design Group Co., Ltd, Nanning, China
- 2Guangxi Vocational and Technical College of Communications, Nanning, China
- 3School of Civil Engineering and Transportation, South China University of Technology, Guangzhou, Guangdong, China
To develop a more rational and practical model for estimating the effective stiffness (ES) of circular hollow reinforced concrete piers (CHRCPs), this study compiled a database of 50 quasi-static tests on CHRCPs exhibiting flexural failure, covering axial load ratios of 0.05–0.3, longitudinal reinforcement ratios of 1.0%–5.4%, shear-span ratios of 2.5–6.1, and hollowness ratios of 0.25–0.77. The applicability of existing reinforced concrete piers ES models to CHRCPs was systematically evaluated. Key influencing parameters the ES of CHRCPs were identified and quantified using a simplified three-component yield displacement model. Meanwhile, a new regression-based model was proposed and calibrated through parametric analysis. The model’s accuracy was validated by simulating the lateral force–displacement responses of one full-scale and one scaled CHRCPs. The results demonstrate that, most existing ES models significantly overestimate the ES of CHRCPs, with mean calculated-to-experimental stiffness ratios ranging from 1.41 to 3.68 and coefficients of variation (CVs) of 0.25–0.41. The ES of CHRCPs increases with the axial load ratio, longitudinal reinforcement ratio, and shear-span ratio but decreases with the hollowness ratio. The interaction between shear-span and hollowness ratios was effectively captured via an equivalent shear-span ratio. The proposed model achieves a mean calculated-to-measured stiffness ratio of 1.04 with a CV of 0.21, indicating significantly improved accuracy and reduced dispersion. The proposed model showed good applicability to 11 round-ended hollow piers, achieving a mean stiffness ratio of 0.976 and a mean relative error of 14%, outperforming existing models.
1 Introduction
The effective stiffness (ES) of bridge piers plays a critical role in determining the fundamental vibration periods and dynamic responses (lateral deflection and internal force) during seismic analysis. Variations in stiffness significantly affect the yield displacement of bridge piers, which in turn influences displacement ductility demands in nonlinear seismic evaluations. Therefore, accurately estimating the ES of reinforced concrete (RC) bridge piers is essential for reliable seismic performance assessment of bridge structures (Yukio et al., 1986). Circular hollow reinforced concrete piers (CHRCPs) are widely adopted in bridge engineering due to their high sectional efficiency and favorable seismic behavior (Zahn et al., 1990; Yeh et al., 2001; Lee et al., 2015; Li et al., 2020). However, despite their prevalence, dedicated studies focusing on the ES of CHRCPs remain extremely limited. Given the unique geometric and mechanical characteristics of CHRCPs, it is necessary to systematically investigate the ES of CHRCPs for the accurate seismic assessment of bridge structures subjected to ground motion.
To date, no consensus has been reached among researchers or international design codes regarding the definition and estimation methods for the ES of RC columns. The variation of ES with the design axial load ratio has already been recognized, as noted in FEMA 356 (2000), ASCE 41-06 (2007), ACI 318-19 (2019), Paulay and Priestley (1992), and Kumar and Singh (2010). Meanwhile, these parameters (i.e., axial load ratio, shear-span ratio (Haselton et al., 2008; Elwood and Eberhard, 2009; Berry et al., 2008; Zheng and Li, 2013; Wei et al., 2019), longitudinal reinforcement ratio (Berry et al., 2008; Zheng and Li, 2013), and fydb/L (Zheng and Li, 2013; Wei et al., 2019)) have been identified to govern the ES through theoretical analysis and quasi-static test results of RC columns. Based on the considerations of combinations of these governing parameters, some simplified models were proposed to estimate the ES of RC columns (Haselton et al., 2008; Elwood and Eberhard, 2009; Berry et al., 2008; Zheng and Li, 2013; Wei et al., 2019). In addition, the bending stiffness of column sections derived from moment–curvature analysis was suggested as the ES of bridge piers based on building codes, including China JTG/T2231-01-2020 (referred to hereafter as JTG) (JTG/T2 231-01-2020, 2008), Caltrans (2019), Eurocode 8 (2005), and AASHTO (2015). In recent years, machine learning techniques have also been applied to develop predictive models of concrete column ES (Wang et al., 2022; Sourav and Satyabrata, 2020). However, these data-driven models often lack physical interpretability and require large volumes of training data, limiting their practical engineering applicability.
Most of the aforementioned models have been developed for solid RC piers. Only a model proposed by Wei et al. (2019) was directed against the rectangular hollow piers. Insufficient attention has been paid to the ES of CHRCPs, which are widely used in the bridge engineering field. Meanwhile, applying models developed for hollow and solid RC piers to CHRCPs is problematic, primarily due to the distinct mechanical behavior and confinement effects explored in hollow sections (Liang and Sritharan, 2018; Liang and Sritharan, 2019). Specifically, hollow RC piers tend to exhibit lower effective stiffness and more pronounced shear effects than their solid counterparts of similar dimensions (Sun et al., 2013). While numerous studies have investigated the seismic performance of CHRCPs [2–5、25–35], research directly addressing their ES remains scarce.
This work proposes a more rational, practical, and accurate simplified model to estimate the ES of CHRCPs. The objectives and structure of the article are as follows: Section 2 of this manuscript presents the key innovations. Section 3 defines effective flexural stiffness and ES, clarifying their distinctions and interrelations. Ten existing models for assessing the ES of pier are evaluated in Section 4 based on the data of 50 CHRCPs. Section 5 investigates the main influencing factors for the ES of CHRCPs based on a simplified three-component yield displacement model and experimental data. In Section 6, a new ES model for CHRCPs is developed, calibrated by multiple linear regression, and compared with the existing ES models. Section 7 of this manuscript presents the verification of the ES model proposed in this manuscript by simulating the lateral force–displacement curves of the full-scale and scaled piers and estimating the ES of round-ended hollow piers widely used in railway bridges in China. Finally, Section 8 summarizes the main findings and conclusions of the study.
2 Novelty of the study
Although numerous ES models have been developed for solid and rectangular hollow reinforced concrete piers, there remains a distinct lack of models specifically tailored to the structural and mechanical characteristics of CHRCPs. This research fills that gap by systematically developing and validating an ES prediction model dedicated to CHRCPs, thereby offering a more reliable analytical tool for evaluating the seismic performance of this commonly used pier type. An innovation in this work is the explicit introduction of the hollowness ratio as a governing parameter in the proposed model. While this parameter has been largely overlooked in prior studies, the results demonstrate its significant influence on stiffness degradation. By incorporating the hollowness ratio into the regression framework, the model successfully captures the unique mechanical behavior of hollow sections and reveals a clear inverse correlation between the hollowness ratio and the pier’s effective stiffness. This finding provides a refined understanding of how hollow geometry influences structural response under seismic loading.
In addition to identifying the isolated effects of geometric parameters, this study further investigates the coupling mechanism between the shear-span ratio and hollowness ratio, two parameters that jointly influence shear deformation behavior. By establishing a simplified three-component yield displacement model, the research reveals and quantifies their interactive effects. To effectively characterize this relationship, the concept of an equivalent shear-span ratio coefficient is proposed, allowing for a more accurate representation of shear-related stiffness contributions in hollow piers. The applicability of the proposed model is extended beyond standard circular hollow sections to include round-ended hollow piers, which are prevalent in railway bridge engineering. Validation against experimental and numerical data confirms that the model maintains high predictive accuracy for these configurations, significantly outperforming existing models in terms of reliability and generalizability. This extension demonstrates the model’s robustness across a range of geometries commonly encountered in practice.
Through rigorous mechanical derivation, parametric analysis, and experimental verification, this study establishes a new analytical framework for assessing the effective stiffness of CHRCPs. The proposed model not only overcomes critical shortcomings of previous approaches but also enhances the precision of seismic analysis and design for bridge structures incorporating circular or round-ended hollow piers.
3 Definition of ES of bridge piers
3.1 Effective flexural stiffness
Under gravity loading, the cracking of RC bridge piers is typically minor and can generally be neglected, assuming gross-section stiffness is both reasonable and sufficient. However, most RC piers either reach or approach yielding, leading to significant cracking and stiffness degradation under strong seismic excitations. Therefore, it is crucial to consider the realistic stiffness of bridge piers in seismic stability analyses. To reflect the cracked state of RC piers during seismic events, major design codes (i.e., China JTG (JTG/T2 231-01-2020, 2008), Caltrans (2019), Eurocode 8 (2005), and AASHTO (2015)) recommend the use of effective section stiffness in place of gross stiffness. Generally, it can be derived from moment–curvature (M-ϕ) analysis as the effective section stiffness of RC pier and would be determined from secant slope of the idealized elastic–plastic M-ϕ curve between the origin and the idealized yield point as Equation 1 (JTG/T2 231-01-2020, 2008; Caltrans, 2019):
where My and ϕy are the idealized yield moment and yield curvature of the idealized yield point in Figure 1, respectively. This point shall be obtained by balancing the areas between the actual and the idealized M-ϕ curves beyond the first reinforcing bar yield point, as shown in Figure 1.
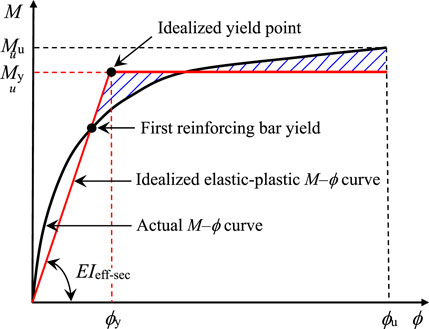
Figure 1. Definition of effective section stiffness (JTG/T2 231-01-2020, 2008).
The rotational degrees of freedom of a pier bottom are assumed to be fixed, and the moment and curvature vary linearly over the height of the pier. Namely, the effective section stiffness is constant over the height of the pier. Hence, the effective section stiffness EIeff-sec can be regarded as the effective flexural stiffness EIeff-flex.
3.2 ES of bridge piers
There is wide consensus that the estimation of yield displacement and ES for seismic analysis of bridge piers should consider the bending deformation, shear deformation, and bar slip deformation. Therefore, the effective flexural stiffness derived from moment–curvature analysis will overestimate the ES of the bridge pier due to ignoring the influence of shear effect and slip effect. In this study, the ES of bridge piers is defined following the method proposed by Park (1989), based on the measured lateral force–displacement (F-Δ) envelope of the member level. This approach considers the stiffness reduction caused by the shear and slip effect and is considered more representative in capturing the actual yield state of reinforced concrete piers under seismic loading.
As shown in Figure 2, when the force–displacement envelope curve of CHRCPs is known, the detailed procedure for determining its equivalent yield point using Park’s method is depicted below. On the ascending branch of the curve, first identify point A corresponding to the lateral force F = 0.75Fmax, where Fmax represents the specimen’s maximum lateral force capacity. Point B is then determined as the intersection between line OA (connecting origin O and point A) and the horizontal line passing through point D (the peak point of the backbone curve). The equivalent yield point C (Δy, Fy) is finally identified as the intersection between the backbone curve and the vertical line passing through point B. The effective stiffness of CHRCPs can subsequently be calculated using the Δy and Fy values from line OC.
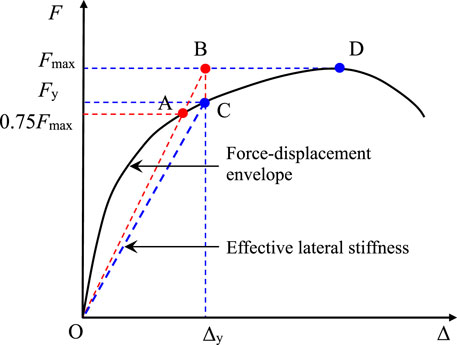
Figure 2. Definition of effective stiffness in the proposed method by Park (1989).
In the elastic state, the yield displacement Δy and effective stiffness (ES) EIeff of cantilever pier can be defined as (Zheng and Li, 2013).
where L is the equivalent cantilever length of the bridge pier. Here, the EIeff of bridge pier under cyclic lateral loading is taken as the mean value of the positive (push) and negative (pull) directions.
3.3 Relationship between effective section stiffness and ES
It should be noted that the yield displacement obtained from the F-Δ envelope is the sum of the bending deformation, shear deformation, and slip deformation. Then, the assumption that the shear deformation and slip deformation are transformed into equivalent flexural deformation is implicit when calculating the yield displacement of the cantilever pier with Equation 2. Therefore, the ES determined by Equation 3 will be smaller than the effective section stiffness (i.e., effective flexural stiffness) that only considers the bending deformation. Obviously, the factors that affect flexural stiffness also affect ES, and the influencing trend is consistent.
4 Evaluation of existing ES models
4.1 Existing models of ES
In the existing literature (FEMA 356, 2000; ASCE 41-06, 2007; ACI 318-19, 2019; Paulay and Priestley, 1992; Kumar and Singh, 2010; Haselton et al., 2008; Elwood and Eberhard, 2009; Berry et al., 2008; Zheng and Li, 2013; Wei et al., 2019), the ES of concrete columns is generally expressed as a fraction (EIeff/EcIg) of the gross-section stiffness EcIg. Here, Ec is the elastic modulus of the concrete, Ig is the moment of inertia of the gross section. Based on this, various design specifications and researchers have proposed different models for estimating the ES of RC piers, with 10 representative models summarized in Table 1. In Table 1, models M1–M4 are primarily developed for building structures, while M7–M10 are more relevant to bridge applications. Models M5 and M6 apply to both buildings and bridges. In terms of parameter usage frequency across these models, the most commonly considered variables include axial load ratio, shear-span ratio, longitudinal reinforcement ratio, the normalized reinforcement index fydb/L

Table 1. Existing models of effective stiffness.
Notably, M1–M8 were developed for solid-section piers, while model M9 addresses rectangular hollow sections, but the influence of the section hollow ratio is not considered in the M9 model. Therefore, it is necessary to evaluate the applicability and accuracy of existing ES models when applied to CHRCPs.
4.2 Evaluation of existing models
Many studies (Zahn et al., 1990; Yeh et al., 2001; Lee et al., 2015; Li et al., 2020; Whittaker et al., 1987; Unjoh and ASAZU, 1999; Chung et al., 1999; Hoshikuma and Priestley, 2000; Ranzo and Priestley, 2001; Zhu et al., 2009; Kim and Kang, 2012; Kim et al., 2014; Kim et al., 2016; Liang et al., 2021a; Liang et al., 2021b) have provided the quasi-static test data needed to evaluate the accuracy of various ES models to CHRCPs. To limit in the analyses to bridge pier, the selection of test data meets the following requirements: (1) cantilever pier; (2) flexural failure mode; (3) 2.5 ≤ L/D; (4) 0.006 ≤ ρl ≤ 0.06; (5) 0 ≤ P/Ag fc'≤ 0.35; (6) 20 Mpa ≤ fc' ≤50 Mpa, where P is the axial force, Ag is the net cross-sectional area of pier, D is the outer diameter of pier, and the meanings of other symbols are the same as before. Based on these criteria, a total of 52 test specimens were selected from the literature. Among them, 50 piers were utilized to evaluate the performance of existing ES models and for calibrating the regression model proposed in this study. The remaining two specimens, named PS1-C (Yeh et al., 2001) and HC-O-100 (Kim and Kang, 2012), were reserved for independent verification of the proposed model.
It should be noted that although all selected CHRCPs experienced flexural failure, the maximum shear-span-to-depth ratio in the tests was limited to 6.1 due to experimental constraints. The ES values of bridge piers with significantly larger shear-span-to-depth ratios (such as tall-pier bridges) may exhibit some differences. All specimens were tested under idealized fixed-base conditions at the pier bottom. If the soil–foundation interaction is pronounced in actual bridges, the ES of piers may exhibit substantial variations. Furthermore, the test specimens did not account for factors such as the effects of concrete deterioration, steel corrosion, or construction quality on ES. Therefore, when applying the ES model proposed in this study to the aforementioned conditions, further appropriate modifications to the ES are necessary. However, such adjustments fall beyond the scope of this study.
The envelope of the measured lateral load–displacement relationship was corrected for P-delta effects to obtain the effective lateral force–displacement envelope for each pier. Then, the measured effective stiffness ratio (EIeff/EcIg) was calculated using the method proposed by Park (1989). The maximum, minimum, mean, median, and coefficient of variation properties of the main design parameters and measured effective stiffness ratio of 52 CHRCPs are reported in Table 2. Table 2 shows that the measured ES ranges from 10% to 50% of the gross-section stiffness EcIg, and the average value of measured effective stiffness ratio is 0.21.

Table 2. Key parameters and statistics of circular hollow piers.
Table 3 presents the statistical results for the ratio of calculated-to-measured effective stiffness of 50 CHRCP specimens. Most of the existing ES models tend to overestimate the measured ES of CHRCPs; the calculated stiffness is 1.41–2.94 times that of the measured stiffness, and only the stiffness calculated by Wei is less, at 0.9 times that of the measured stiffness. Of these existing procedures, Haselton and Zheng provide the minimum overestimation of the measured ES, but still approximately 40% higher; bridge seismic codes (JTG/T2 231-01-2020, 2008; Caltrans, 2019; Eurocode 8, 2005) significantly overestimate the ES, approximately 1.8 times that of the measured stiffness; the Paulay model is 2.94 times that of the measured stiffness, which is the most severely overestimated.

Table 3. Statistics for the ratios of calculated-to-measured effective stiffness values for existing ES models.
In addition, the scatter of the results of the existing models is large. According to the test data of 50 CHRCPs, the coefficient of variation for all of these models ranges from 0.25 to 0.41. The coefficient of variation provided by bridge seismic codes is 0.25, and the other models are 0.32–0.41. Considering the maximum, minimum, mean, and coefficient of variation, Zheng and Wei provide relatively good models compared to the existing ES models. Because the mechanical behavior of a rectangular hollow pier is similar to a CHRCP, the average value of ES calculated by the Wei model derived from rectangular hollow piers is the closest to the measured result, but the coefficient of variation is as high as 0.36. To sum up, the existing ES models appropriate for design applications generally tend to overestimate the measured ES of CHRCP and are unacceptably inaccurate. To obtain a more accurate and stable ES model, the main factors affecting the ES of CHRCP must be further studied in detail.
5 Main factors influencing the ES of CHRCPs
Several researchers (Kumar and Singh, 2010; Elwood and Eberhard, 2009; Zheng and Li, 2013) have proposed estimating the yield displacement Δy of an equivalent cantilever column of length L as the sum of the flexural deformation, shear deformation, and slip deformation (Equations 4–7).
where kv is the shape coefficient, Geff is the effective shear modulus, ub is the average bond stress between the reinforcement and the footing concrete, and the meanings of other symbols are the same as before.
Therefore, the main factors influencing the effective stiffness (ES) of CHRCPs can be identified based on the theoretical framework of the simplified three-component model for yield displacement. For flexural deformation, because the factors that affect the effective flexural stiffness also affect the ES, the influencing factors of flexural effect on the ES of CHRCPs can be identified by studying the influencing factors of effective flexural stiffness. For shear and slip deformations, the calculation of yield displacement using Equation 2 assumes that both shear and slip deformations are transformed into equivalent flexural deformation. Therefore, the influencing factors of shear effect and slip effect on the ES of CHRCPs can be identified by studying the relative relationship between shear deformation, slip deformation, and flexural deformation.
5.1 Factors influencing flexural deformation
To investigate the factors that influence flexural deformation (or effective flexural stiffness), taking the full-scale CHRCPs in China as the prototype (Yeh et al., 2001), a parameter analysis was carried out to consider the axial load ratio and longitudinal reinforcement ratio for a typical bridge pier. The following basic data were assumed: (1) pier outer diameter:1.5 m; (2) pier inner diameter:0.9 m; (3) cover to longitudinal reinforcement:4 cm; (4) transverse reinforcement diameter and spacing: 13 mm, 100 mm; (5) concrete compressive strength: fc' = 32 MPa; (6) yield strength of longitudinal reinforcement: fy = 420 MPa; (7) axial load ratio: P/Ag fc' = 0 to 0.35 (8 levels); (8) longitudinal reinforcement ratio: ρl = 0.5%–4.0% (5 levels).
Based on the computed moment–curvature relationship, the effective flexural stiffness of the pier EIeff-flex can be determined using the idealized yield moment My and idealized yield curvature ϕy, as shown in Figure 1. Therefore, the factors influencing effective flexural stiffness can be identified through the parameter analysis of My and ϕy. The moment–curvature curve was determined based on plane-section analysis using the concrete constitutive model by Mander et al. (1988) and a linear constitutive model for steel. The section division of CHRCP is shown in Figure 3. For the parametric study, eight levels of axial load ratio were considered for each longitudinal reinforcement ratio, resulting in a total of 40 analysis cases. To facilitate comparison and interpretation, the dimensionless equivalent yield moment MDy and dimensionless equivalent yield curvature ϕDy are respectively defined as follows (Equations 8, 9):
where εy is the yield strain of longitudinal reinforcement, and the meanings of other symbols are the same as before.
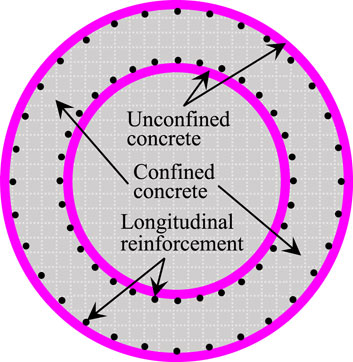
Figure 3. Section division of CHRCP.
As shown in Figure 4a, the equivalent yield moment is significantly influenced by both the axial load ratio and the longitudinal reinforcement ratio, exhibiting a clear increasing trend with the rise of either parameter. In contrast, it is observed that the dimensionless equivalent yield curvature is comparatively insensitive to variations in the axial load ratio and longitudinal reinforcement ratio. Figure 4b shows the average value of dimensionless equivalent yield curvature (ϕDy = 2.18), along with reference lines representing ±15% of this mean. It is seen that most data, except those for low reinforcement ratios coupled with very high axial load ratios, fall within the ±15% limits. This suggests that the equivalent yield curvature remains essentially stable across a wide range of design parameters and is not affected by the flexural capacity of the section.
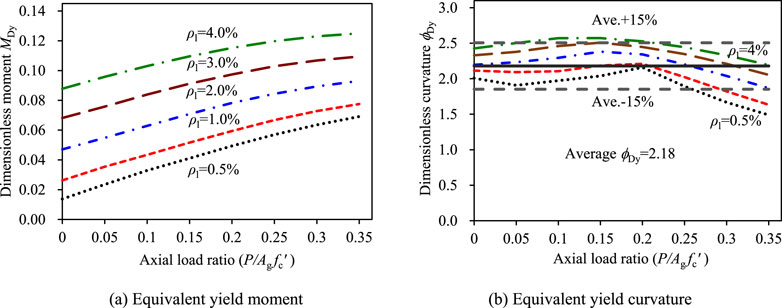
Figure 4. (a) Equivalent yield moment and (b) Equivalent yield curvature. Dimensionless equivalent yield moment and curvature of CHRCPs.
It should be noted that although the data were generated from specific CHRCP sizes and material strengths, the dimensionless results are expected to be broadly applicable to other CHRCP configurations and material strengths within the typical range used in standard design practice (Priestley et al., 2007).
Combined with the data in Figure 4 and Equation 1, the axial load ratio and longitudinal reinforcement ratio can be identified as the governing parameters for the effective flexural stiffness of CHRCPs. To directly quantify their influence, the ratio of effective flexural stiffness to gross-section stiffness βg is defined by Equation 10.
where Ec is the concrete modulus of elasticity (Ec can be taken as 5000

Figure 5. Effective flexural stiffness ratio for CHRCPs.
Note that Figure 5 shows that as the longitudinal reinforcement ratio increases, its influence on the effective flexural stiffness tends to weaken with higher axial compression ratios, indicating a certain interactive effect between the longitudinal reinforcement ratio and the axial compression ratio on the effective flexural stiffness. This interaction largely depends on how the longitudinal reinforcement ratio and axial compression ratio affect the idealized yield curvature, which can be intuitively observed from the consistent trends between Figures 4b, 5.
5.2 Factors influencing shear deformation
Compared with solid piers, the shear capacity of hollow piers is significantly reduced due to the presence of a hollow section, making the contribution of shear deformation to the equivalent yield displacement more pronounced (Sun et al., 2013). As the degree of hollowness increases, the shear capacity decreases accordingly. Thus, the effect of hollowness on the ES of the CHRCP should be considered. To describe the hollowness of hollow section, a dimensionless parameter αg (hollow ratio) is introduced, which is defined as the ratio of the area of hollow part to the cross-sectional area of the hollow pier as if it were solid. For the CHRCP, αg is given by Equation 11.
where d is the inner diameter, and D is the outer diameter.
For the cantilever CHRCP, after introducing the dimensionless parameters αg and βg, Equation 5, used to calculate the flexural deformation of the yield displacement, can be rewritten as Equation 12.
Equation 6 used to calculate the shear deformation of the yield displacement can be rewritten as Equation 13.
For a circular section, the shape coefficient (kv) can be taken as 0.85 (Elwood and Eberhard). The concrete effective shear modulus (Geff) depends on the modulus of elasticity of concrete and Poisson’s ratio of concrete (υ); that is, Geff = Ec/[2 (1+υ)]. For normal-weight concrete, the value of Poisson’s ratio can be taken as 0.2. Based on these assumptions, the ratio of shear deformation to flexural deformation can be simplified as
The parameter (1/

Figure 6. Variation of equivalent shear-span ratio coefficients with hollow ratio.
From Equation 14 and Figure 6, it can be seen that the contribution of shear deformation to equivalent yield displacement decreases with the increase in shear-span ratio (L/D), and increases with the increase in hollow ratio (αg). Therefore, the ES of the CHRCP increases with the increase in the shear-span ratio and decreases with the increase in the hollow ratio. The coupling effect of shear-span ratio and hollow ratio can be reflected through the equivalent shear-span ratio 1/
5.3 Factors influencing slip deformation
For the purpose of this study, a uniform bond stress of ub = 1.0
It can be seen from Equation 15 that the contribution of slip deformation to equivalent yield displacement increases with the increase of parameter fydb/L
5.4 Experimental verification of main influencing factors of ES
According to the aforementioned parametric study based on the three-component yield displacement model, the main factors influencing the ES of CHRCP are the axial load ratio (P/Ag fc'), the longitudinal reinforcement ratio (ρl), the equivalent shear-span ratio 1/

Figure 7. Effect of key parameters on measured ES of CHRCPs.
The research on solid piers by Zheng and Li (2013) shows that the correlation coefficient between the parameter fydb/L
The possible reasons are as follows: first, the calculation model of slip deformation is derived from a solid pier with a single layer longitudinal reinforcement, which is not necessarily suitable for a hollow pier with inner and outer longitudinal reinforcement; second, the cross-section is discontinuous due to the hollowness; thus, the assumption that the bottom section of pier rotates around its neutral axis is not completely consistent with the actual situation when the longitudinal reinforcement slipping. Thus, the impact of hollowness on slip deformation remains unclear, requiring further theoretical and experimental investigation (Wang et al., 2019).
6 Calibration and evaluation of the ES model for CHRCPs
6.1 Calibration of the ES model
Based on the theoretical analysis and experimental validation of the main factors influencing the ES conducted in this study, as well as a comprehensive review of the governing parameters considered in existing models, a new four-parameter calibration model for the ES of CHRCPs is proposed.
where λ1∼λ4 are the parameters to be calibrated. Because the axial load ratio, longitudinal reinforcement ratio, hollow ratio, and shear-span ratio of hollow pier are relatively easy to determine, Equation 16 is suitable as the calculation model of ES of CHRCP.
Based on the measured ES ratio EIeff/EcIg, axial load ratio P/Agfc’, longitudinal reinforcement ratio ρl, and equivalent shear-span ratio 1/
Because the regression coefficients in Equation 17 were determined using ordinary least squares (OLS) linear regression, the independent variables were not normalized or standardized prior to regression. Figure 8 shows the comparison between the ES ratio of CHRCP calculated by Equation 17 and the measured values. It can be seen from Figure 8 that the calculated results are in good agreement with the experimental results, and the linear correlation coefficient is 0.94. Therefore, within the range of design parameters picked up in this work, Equation 17 gives an accurate estimate of ES of CHRCPs.

Figure 8. Comparison of calculated (Equation 17) and measured ES values.
It should be noted that the linear model was adopted for the ES model in this study due to its advantages of concise form and convenience for engineering applications. Although Equation 17 incorporates the coupling effect of shear-span ratio and void ratio through the equivalent shear-span ratio, the linear model does not account for potential interactions or nonlinearities between parameters such as axial compression ratio and longitudinal reinforcement ratio. This may somewhat compromise the accuracy of the ES estimation. To address this limitation, future research should collect more experimental data and employ methods such as machine learning algorithms or nonlinear regression. This would enable a more profound insight into the potential interaction effects and nonlinear influences among parameters, facilitating the development of a more precise predictive model for ES.
6.2 Evaluation of ES models
To compare the proposed model with the Zheng model (Zheng and Li, 2013) and the Wei model (Wei et al., 2019), which give relatively accurate results in the existing ES models, Table 4 presents statistical parameters comparing the calculated-to-experimental ES values of 50 CHRCPs using Zheng’s formula, Wei’s formula, and the proposed formula. The evaluated metrics include maximum (Max), minimum (Min), median (Med), mean (Mean), coefficient of variation (CV), root mean square error (RMSE), mean absolute percentage error (MAPE), and coefficient of determination (R2). Figure 9 shows the ratio of calculated-to-measured ES for each pier. It can be observed from Table 4 and Figure 9 that: (1) The ES of CHRCPs calculated by the proposed formula Equation 17 demonstrates the closest agreement with the experimental results. The corresponding mean value and coefficient of variation are 1.04 and 0.21, respectively. Moreover, the proposed formula achieves the smallest RMSE (0.04) and MAPE (16.7%), along with the highest R2 (0.88), indicating superior error statistics and significantly enhanced prediction accuracy compared to the other two. For CHRCP, the calculated mean of the Wei model is close to the experimental value, which is 0.90, but the coefficient of variation is as high as 0.36; the results of the Zheng model are relatively poor in terms of mean and coefficient of variation, which are 1.40 and 0.32, respectively. (3) The fluctuation trends of the ratio of calculated to the measured ES given by the Zheng model, the Wei model, and Equation 17 are basically the same, and the fluctuation amplitudes (the difference between the maximum and minimum value) are 1.44, 1.14, and 1.09, respectively. Furthermore, most of the calculation results of Equation 17 fall between the results of the Zheng model and the Wei model. (4) It is noteworthy that, although discrepancies exist in prediction accuracy among the Zheng, Wei, and proposed models, all three models exhibit consistent increasing and decreasing trends across the 50 circular hollow pier specimens (as shown in Figure 9). This coherence demonstrates that these models collectively capture the sensitivity of ES to dominant parameters (axial compression ratio, longitudinal reinforcement ratio, shear-span ratio, etc.), reflecting the fundamental mechanical principles governing circular hollow piers. Moreover, this consistency implicitly validates the reliability of both the experimental dataset and data processing methodology.

Table 4. Statistics for ratio of calculated to the measured ES.

Figure 9. Comparison of the ratios of calculated-to-measured ES values.
Therefore, compared with the existing models, the model proposed in this work is more reasonable and stable for estimation of the ES of CHRCPs. In addition, the ES model proposed in this work is easy to apply and only requires determination of the axial load ratio, the longitudinal reinforcement ratio, the hollow ratio, and the shear-span ratio. It does not require determination of the longitudinal reinforcement diameter and yield strength, etc., and does not require complex moment–curvature analysis.
7 Verification of ES model for CHRCPs
7.1 Simulation of force–displacement response for CHRCPs
To further illustrate the validity of Equation 17, except for the 50 CHRCPs used for model calibration, another two piers (full-scaled pier PS1-C (Yeh et al., 2001) and scaled pier HCO-100 (Kim and Kang, 2012)) are used to verify the validity of Equation 17 on the simulation of lateral force–displacement response. The main design parameters of piers PS1-C and HCO-100 are shown in Table 2.
The overall force–displacement hysteretic curves for both piers were simulated based on a static reversed-cyclic analysis using OpenSees. In this manuscript, the piers are modeled as a Beam with Hinges element (OpenSees, 2024) proposed by Scott and Fenves (2006). The model assumes that the inelastic deformation is concentrated in the length Lp of the plastic hinge at the bottom of the pier, while the upper part of the plastic hinge remains elastic. When a plastic hinge forms at the pier base (i.e., when the base-section curvature exceeds the idealized yield curvature), the equivalent plastic hinge length Lp remains constant, as illustrated in Figure 10. To match the experimental loading conditions, the bottom node of the Beam with Hinges element was fully fixed, while the top node remained unconstrained to allow application of axial force and lateral displacement (or force). It should be noted that the Beam with Hinges element is particularly suitable for quasi-static pushover analysis of piers exhibiting typical flexural failure modes. The two most critical parameters of this model are the plastic hinge length Lp and the ES EIeff, as shown in Figure 10. In the numerical simulation of fiber element based on the principle of curvature integration, it is more reasonable to use the plastic hinge length that matches the plastic curvature derived from moment–curvature analysis (Li et al., 2016). Therefore, in the static reversed-cyclic analysis, the plastic hinge length Lp is determined by Equation 18 suggested by Li et al. (2016), and the ES is calculated by Equation 17. The calculated values of the ES ratios (EIeff/EcIg) of piers PS1-C and HCO-100 are 0.236 and 0.161, respectively, while the corresponding measured values are 0.216 and 0.177, and the relative errors are not larger than 10%.

Figure 10. Fiber model of Beam with Hinges element.
For each pier, a fiber section composed of unconfined concrete, confined concrete, and steel material was initially established. In this study, the Concrete02 material model in the software of OpenSees was adopted for unconfined concrete and confined concrete, and the Reinforcing Steel uniaxial material model was used to simulate the longitudinal reinforcement. This model considers the mechanical effects of strain softening, low-cycle fatigue, and tensile fracture of the bars (Kunnath et al., 2009). The division of fiber section and the constitutive relationship of uniaxial material are shown in Figure 10.
Figure 11 shows the comparison between the simulated results and the experimental results of the force–displacement hysteresis curves of the full-scale pier PS1-C and scaled pier HCO-100. For full-scale and scaled bridge piers, the calculated results are in good agreement with the experimental results, and the initial stiffness, unloading stiffness, and reloading stiffness under low-cycle loads can be simulated accurately. These results indicate that the ES model proposed in this manuscript is reasonable and reliable to estimate the ES of CHRCPs.

Figure 11. Comparisons for hysteretic curves of CHRCPs.
Bridge seismic design codes, such as Caltrans, Eurocode 8, and China’s JTG, typically recommend using the effective flexural stiffness as the ES of the bridge pier. For the two representative CHRCP specimens, PS1-C and HC-O-100, the effective flexural stiffness ratio (EIeff-flex/EcIg) are 0.383 and 0.278, respectively. These values indicate that the ES values prescribed by the seismic codes are approximately 1.62 and 1.73 times greater than the ES estimated by the model proposed in this work. This overestimation implies that using effective flexural stiffness as a proxy for overall ES can lead to a substantial underestimation of displacement demands under the same level of horizontal seismic loading. In practice, this means the predicted displacements will be smaller than those observed experimentally, which may compromise the reliability of deformation assessments and increase the risk of unseated spans. While a detailed investigation into span unseating risk is beyond the scope of this study, it highlights the critical importance of using a more accurate estimation of pier stiffness in seismic design. Moreover, the need for accurate ES estimation becomes even more critical in nonlinear time-history analyses, where the displacement response of bridge structures is highly sensitive to the peaks and troughs of the ground motion response spectrum.
7.2 Estimation of ES for round-ended hollow piers
Round-ended hollow piers are widely employed in railway bridges in China. To investigate the seismic performance of such piers, Shao et al. (2019) conducted low-cycle reversed loading tests on five 1/6-scale specimens with varying volumetric stirrup ratios and axial load levels, with specimen geometry and reinforcement layout illustrated in Figure 12. Jiang et al. (2024) performed similar tests on 1/10-scale specimens, considering variations in pier height, axial load ratio, longitudinal reinforcement ratio, and volumetric stirrup ratio. This section evaluates the applicability of the proposed ES model Equation 17 for round-ended hollow piers based on estimated ES values from 11 specimens in Shao et al. (2019) and Jiang et al. (2024). The key design parameters are summarized in Table 5, and the measured ES values were computed using the method proposed by Park (1989), as previously described.

Figure 12. Size and rebar arrangement of specimen (unit: cm) (Shao et al., 2019).

Table 5. Statistics of key parameters for round-end piers.
Table 6 presents a comparison between the measured ES ratios (EIeff/EcIg) and predictions from the Zheng model, the Wei model, and Equation 17. The results demonstrate that Equation 17 provides significantly better predictions, showing a mean ratio of calculated-to-measured ES of 0.976 with relative errors (RE) ranging from 4% to 21% (mean RE = 14%). In contrast, the Zheng and Wei models substantially overestimate the ES, yielding mean ratios of 1.510 (mean RE = 54%) and 1.225 (mean RE = 29%), respectively. This confirms the proposed model’s superior accuracy for round-ended hollow piers compared to existing approaches.

Table 6. Comparison of ES ratios for round-end piers.
However, Equation 17’s predictions exhibit some variability, with a maximum RE of 21%, indicating notable sensitivity to certain parameters. Given the limited sample size, further experimental or numerical validation is recommended to better understand this sensitivity. Based on test conditions in Shao et al. (2019) and Jiang et al. (2024), the following parameter ranges are suggested for application of Equation 17 to round-ended hollow piers: a shear-span ratio of 2.5–6.5, a section hollowness ratio of 0.55–0.65, an axial load ratio of 0.05–0.15, and a straight segment length of section not exceeding the outer radius of the rounded ends.
8 Conclusion
This study evaluated ten existing ES models using a database of 50 CHRCP tests and identified key influencing factors through theoretical and experimental analyses. A new four-parameter model was proposed, incorporating axial load ratio, reinforcement ratio, shear-span ratio, and hollowness ratio. The model outperforms existing approaches in both accuracy and stability, with a mean stiffness ratio of 1.04 and a coefficient of variation of 0.21. It also shows good applicability to round-ended hollow piers. The results highlight the necessity of accounting for hollowness and shear effects in CHRCP design to avoid overestimating stiffness in seismic analysis. Within the investigated parameter ranges, the following key findings were obtained:
(1) Except for the Wei model, all existing ES models significantly overestimated the actual ES of CHRCPs on average, with predicted values ranging from 1.41 to 3.68 times the experimental values. The predictions of existing models exhibited considerable scatter, with coefficients of variation (COVs) ranging between 0.25 and 0.41. Among them, only the seismic code model had a COV of 0.25, while the others exceeded 0.32.
(2) Compared to existing models, the proposed model innovatively incorporates the influence of hollowness ratio and equivalent shear-span ratio on the ES of CHRCPs. Theoretical and experimental analyses revealed that the ES increases with axial load ratio, longitudinal reinforcement ratio, and shear-span ratio but decreases with hollowness ratio. The coupling effect of shear-span ratio and hollowness ratio can be accounted for by the equivalent shear-span ratio, with the ES increasing as the equivalent shear-span ratio increases.
(3) Among the existing models, the Zheng and Wei models provided relatively better predictions for the ES of CHRCPs, with mean ratios of calculated-to-measured stiffness of 1.42 and 0.90 and COVs of 0.32 and 0.36, respectively. The proposed model yielded predictions mostly between these two models, with a mean ratio of 1.04 and a COV of 0.21, demonstrating improved accuracy and reduced variability compared to existing models.
(4) The proposed model provides reliable estimates of the ES of CHRCPs. When combined with the Beam with Hinges element in OpenSees and an appropriate equivalent plastic hinge length, it accurately simulates the force–displacement hysteretic curves of full-scale and scaled CHRCPs under quasi-static loading.
(5) Although the proposed model outperforms existing models in predicting the ES of CHRCPs, it does not account for the interaction between longitudinal reinforcement ratio and axial load ratio, which slightly affects prediction accuracy. Additionally, due to experimental limitations, the database covers the following parameter ranges: an axial load ratio of 0.05–0.30, a longitudinal reinforcement ratio of 1.0%–5.4%, a hollowness ratio of 0.25–0.77, and a shear-span ratio of 2.5–6.1. For design parameters beyond these ranges—particularly for tall piers with shear-span ratios significantly exceeding 6—the ES may differ. Furthermore, the model does not consider the effects of soil–foundation interaction, concrete degradation, steel corrosion, or construction quality. Caution is advised when applying the proposed model to such scenarios, and appropriate modifications may be necessary.
(6) The proposed model is also applicable to rounded-ended hollow piers. Based on quasi-static test results from 11 such piers, the mean ratio of calculated-to-measured stiffness was 0.976, with a mean relative error of 14%, outperforming existing models. However, the key parameters of rounded-ended hollow piers must satisfy the following requirements: a shear-span ratio of 2.5–6.5, a section hollowness ratio of 0.55–0.65, an axial load ratio of 0.05–0.15, and a straight segment length of section not exceeding the outer radius of the rounded ends.
Data availability statement
The raw data supporting the conclusions of this article will be made available by the authors, without undue reservation.
Author contributions
ZH: Writing – original draft, Writing – review and editing. GL: Writing – original draft, Writing – review and editing. WS: Investigation, Supervision, Writing – review and editing.
Funding
The author(s) declare that financial support was received for the research and/or publication of this article. The research for this manuscript was supported partially by the Project of Improving Basic Scientific Research Ability of Young and Middle-Aged Teachers in Guangxi Colleges and Universities (No. 2022KY1121).
Conflict of interest
Author ZH was employed by Guangxi Communications Design Group Co., Ltd.
The remaining authors declare that the research was conducted in the absence of any commercial or financial relationships that could be construed as a potential conflict of interest.
Generative AI statement
The author(s) declare that no Generative AI was used in the creation of this manuscript.
Publisher’s note
All claims expressed in this article are solely those of the authors and do not necessarily represent those of their affiliated organizations, or those of the publisher, the editors and the reviewers. Any product that may be evaluated in this article, or claim that may be made by its manufacturer, is not guaranteed or endorsed by the publisher.
References
AASHTO (2015). Guide specifications for LRFD seismic bridge design. Washington D.C.: American Association of State Highway and Transportation Officials.
ACI 318-19 (2019). Building code requirements for structural concrete (ACI 318-19) and commentary. Farmington Hills: American Concrete Institute.
Berry, M. P., Lehman, D. E., and Lowes, L. N. (2008). Lumped-plasticity models for performance simulation of bridge columns. ACI Struct. J. 105, 270–279. doi:10.14359/56427
Caltrans (2019). Seismic design criteria (version 2.0). Sacramento: California Department of Transportation.
Chung, Y. S., Han, G. H., Lee, K. K., and Lee, D. H. (1999). Quasi-static test for seismic performance of circular hollow RC bridge pier. J. Earthq. Eng. Soc. Korea 3, 41–53. doi:10.22636/JKCI.1999.11.5.107
Elwood, K. J., and Eberhard, M. O. (2009). Effective stiffness of reinforced concrete columns. ACI Struct. J. 106, 476–484. doi:10.14359/56613
Eurocode 8 (2005). Design provisions for earthquake resistance of structures - part 2: bridges. Brussels: CEN.
FEMA 356 (2000). Prestandard and commentary for the seismic rehabilitation of buildings. Washington D.C.: Federal Emergency Management Agency.
Haselton, C. B., Liel, A. B., Lange, S. T., and Deierlein, G. G. (2008). “Beam-column element model calibrated for predicting flexural response leading to global collapse of RC FRame buildings,” in Report no. PEER-2007/03, Pacific earthquake engineering research center. Berkeley.
Hoshikuma, J. I., and Priestley, M. J. N. (2000). Flexural behavior of circular hollow columns with a single layer of reinforcement under seismic loading, report no. SSRP-2000/13. San Diego: University of California.
Jiang, L. Z., Shao, G. Q., Wang, H., and Jiang, J. (2024). Experimental study on seismic performance of hollow piers with rounded rectangular cross section in high-speed railways. Eng. Mech. 31, 72–97. doi:10.6052/j.issn.1000-4750.2013.01.0111
JTG/T2231-01-2020 (2008). Specifications for seismic design of highway bridges. Beijing: China Communications Press.
Kim, T. H., and Kang, H. T. (2012). Seismic performance assessment of hollow circular reinforced concrete bridge columns with confinement steel. J. Earthq. Eng. Soc. Korea 16, 13–25. doi:10.5000/eesk.2012.16.1.013
Kim, T. H., Kim, H. Y., Lee, J. H., and Shin, H. M. (2016). New hollow RC bridge piers with triangular reinforcement details. J. Earthq. Eng. Soc. Korea 20, 21–31. doi:10.5000/eesk.2016.20.1.021
Kim, T. H., Lee, J. H., and Shin, H. M. (2014). Performance assessment of hollow RC bridge columns with triangular reinforcement details. Mag. Concr. Res. 66, 809–824. doi:10.1680/macr.13.00257
Kumar, R., and Singh, Y. (2010). Stiffness of reinforced concrete frame members for seismic analysis. ACI Struct. J. 107, 607–615. doi:10.14359/51663914
Kunnath, S. K., Heo, Y. A., and Mohle, J. F. (2009). Nonlinear uniaxial material model for reinforcing steel bars. J. Struct. Eng. 135, 335–343. doi:10.1061/(asce)0733-9445(2009)135:4(335)
Lee, J. H., Choi, J. H., Hwang, D. K., and Kwahk, I. J. (2015). Seismic performance of circular hollow RC bridge columns. KSCE J. Civ. Eng. 19, 1456–1467. doi:10.1007/s12205-014-1173-z
Li, G. Q., Tang, G. W., and Zheng, G. (2016). Equivalent plastic Hinge length of circular reinforced concrete bridge piers, China civ. Eng. J. 49, 87–97. doi:10.15951/j.tmgcxb.2016.02.010
Li, Z. X., Du, C. Y., Liang, X., and Zhao, B. (2020). Flexural behavior of circular hollow RC piers with reduced amounts of inner hoops. Int. J. Concr. Struct. Mater. 14, 9–15. doi:10.1186/s40069-019-0383-7
Liang, X., Du, C. Y., Zhao, B., and Li, Z. X. (2021b). Seismic performance of circular hollow concrete columns. Struct. Concr. 22, 3140–3155. doi:10.1002/suco.202000482
Liang, X., Du, C. Y., Zhao, B., Li, Z. X., Sritharan, S., and Zhang, H. D. (2021a). Performance of circular hollow concrete columns with a single layer of transverse reinforcement. Struct 32, 15–27. doi:10.1016/j.istruc.2021.02.051
Liang, X., and Sritharan, S. (2018). Effects of confinement in circular hollow concrete columns. J. Struct. Eng. 144, 04018159. doi:10.1061/(asce)st.1943-541x.0002151
Liang, X., and Sritharan, S. (2019). Effects of confinement in square hollow concrete column sections. Eng. Struct. 191, 526–535. doi:10.1016/j.engstruct.2019.04.034
Mander, J. B., Priestley, M. J. N., and Park, R. (1988). Theoretical stress-strain model for confined concrete. J. Struct. Eng. 114, 1804–1826. doi:10.1061/(asce)0733-9445(1988)114:8(1804)
Park, R. (1989). Evaluation of ductility of structures and structural assemblages from laboratory testing. Bullet N. Z. Soc. Earthq. Eng. 22, 155–166. doi:10.5459/bnzsee.22.3.155-166
Paulay, T., and Priestley, M. J. N. (1992). Seismic design of reinforced concrete and masonry buildings. New York: John Wiley and Sons, Inc.
Priestley, M. J., Calvi, G. M., and Kowalsky, M. J. (2007). Displacement based seismic design of structures. Pavia: IUSS Press.
Ranzo, G., and Priestley, M. J. N. (2001). “Seismic performance of circular hollow columns subjected to high shear,” in Report no. SSRP-2001/01. San Diego: University of California.
Scott, M. H., and Fenves, G. L. (2006). Plastic Hinge integration methods for force-based beam–column elements. J. Struct. Eng. 132, 244–252. doi:10.1061/(asce)0733-9445(2006)132:2(244)
Sezen, H., and Setzler, E. J. (2008). Reinforcement slip in reinforced concrete columns. ACI Struct. J. 105, 280–289. doi:10.14359/19787
Shao, C. J., Qi, Q. M., Wang, M., Xiao, Z. H., Wei, W., Hu, C. X., et al. (2019). Experimental study on the seismic performance of round-ended hollow piers. Eng. Struct. 195, 309–323. doi:10.1016/j.engstruct.2019.05.094
Sourav, D., and Satyabrata, C. (2020). Evaluation of effective stiffness of RC column sections by support vector regression approach. Neural Comput. and Applic. 32, 6997–7007. doi:10.1007/s00521-019-04190-0
Sun, Z. G., Wang, D. S., Li, H. N., and Traffic, J. (2013). Application of RC hollow bridge pier and review of seismic behavior research. Transp. Eng. 03, 22–32. doi:10.19818/j.cnki.1671-1637.2013.03.004
Unjoh, S., and Asazu, N. (1999). Strength and ductility characteristics of reinforced concrete column with circular hollow section, civ. Eng. J. 41, 60–65. doi:10.1061/JSDEAG.0005416
Wang, Z., Liu, T. X., Long, Z. L., Wang, J. Q., and Zhang, J. (2022). A machine-learning-based model for predicting the effective stiffness of precast concrete columns. Eng. Struct. 260, 114224. doi:10.1016/j.engstruct.2022.114224
Wang, Z., Wang, J. Q., Xiu, H. L., and Li, W. C. (2019). Equivalent plastic Hinge model of rectangular hollow piers. China J. Highw. Transp. 32, 76–86. doi:10.19721/j.cnki.1001-7372.2019.01.009
Wei, W., Shao, C. J., Xiao, Z. H., Qi, Q. M., Hu, C. X., Xiao, L. C., et al. (2019). Experimental study on effective stiffness of reinforced concrete hollow piers, China civ. Eng. J. 52, 105–114. doi:10.15951/j.tmgcxb.2019.10.008
Whittaker, D., Park, R., and Carr, A. J. (1987). “Experimental tests on hollow circular concrete columns for use in offshore concrete platforms,” in Proceedings of the 3rd Pacific conference on earthquake engineering (New Zealand).
Yeh, Y. K., Mo, Y. L., and Yang, C. Y. (2001). Seismic performance of hollow circular bridge piers. ACI Struct. J. 98, 862–871. doi:10.1016/S0950-0618(02)00119-8
Yukio, M., Tadayosi, I., and Toshihiko, S. (1986). “Experimental study on deformation of circular cylindrical piers,” in The 7th proceedings of Japan earthquake engineering symposium, Japan.
Zahn, F. A., Park, R., and Priestley, M. J. N. (1990). Flexural strength and ductility of circular hollow reinforced concrete columns without confinement on inside face. ACI Struct. J. 87, 156–166. doi:10.14359/9295
Zheng, G., and Li, G. Q. (2013). Effective stiffness of reinforced concrete bridge piers, China civ. Eng. J. 46, 44–52. doi:10.15951/j.tmgcxb.2013.06.004
Keywords: reinforced concrete, circular hollow pier, effective stiffness, hollow ratio, regression analysis
Citation: Hou Z, Li G and Shi W (2025) A prediction model for the calculation of effective stiffness of circular hollow reinforced concrete piers. Front. Built Environ. 11:1629114. doi: 10.3389/fbuil.2025.1629114
Received: 15 May 2025; Accepted: 10 July 2025;
Published: 28 August 2025.
Edited by:
Min Zhou, North University of China, ChinaReviewed by:
Nuo Duan, Energie Baden-Württemberg, GermanyNadhim Hamah Sor, University of Garmian, Iraq
Copyright © 2025 Hou, Li and Shi. This is an open-access article distributed under the terms of the Creative Commons Attribution License (CC BY). The use, distribution or reproduction in other forums is permitted, provided the original author(s) and the copyright owner(s) are credited and that the original publication in this journal is cited, in accordance with accepted academic practice. No use, distribution or reproduction is permitted which does not comply with these terms.
*Correspondence: Wanpeng Shi, Y3Rzd3BAbWFpbC5zY3V0LmVkdS5jbg==