 Qing Xia1
 Haiwei Zhang
 Xiaogang Guo
- 1Henan Zhongping Jiaoke Res and Design Institute Co Ltd., Pingdingshan, China
- 2School of Civil and Environmental Engineering, Zhengzhou University of Aeronautics, Zhengzhou, Henan, China
- 3Henan Provincial Engineering Technology Research Center of Modified Asphalt Pavement Materials, Zhengzhou, Henan, China
- 4Larson Transportation Institute, Pennsylvania State University, University Park, PA, United States
Full-depth reclamation with Portland cement (FDR-PC) is a promising technology in modern pavement engineering due to its capability of achieving deep-level treatment of pavement base layer distresses. This study aimed to optimize the material performance of FDR-PC materials while considering their environmental impact, developing a multi-objective optimization model to comprehensively evaluate and optimize these aspects. Laboratory tests were first conducted to investigate the effects of reclaimed asphalt pavement (RAP) content and cement content on 7-day unconfined compressive strength (UCS), indirect tensile strength (ITS), and relative compressive strength (RCS) after freeze-thaw cycles. A comprehensive performance evaluation function was established based on these key indicators. Subsequently, carbon emission and energy consumption models for FDR-PC were developed using life cycle assessment (LCA), which together formed an environmental impact function. The non-dominated sorting genetic algorithm II (NSGA-II) was employed to perform multi-objective optimization of the FDR-PC mix design and obtain the Pareto front. The technique for order of preference by similarity to ideal solution (TOPSIS) was then used to identify optimal parameter combinations under various objective weighting scenarios. Results revealed a significant negative correlation between material performance and environmental impact. The parameter combinations corresponding to the non-dominated solutions were mainly concentrated in cement content ranging from 4.8% to 6.0% and RAP content from 20% to 34%. Parameter combinations corresponding to high material performance were found in regions with RAP content below 20%, which also corresponded to high environmental impact. According to the TOPSIS analysis, the optimal mix under a performance-priority strategy consists of 6.0% cement and 5% RAP; the environmentally preferred mix recommends 4.6% cement and 32% RAP; and a balanced compromise suggests 5.2% cement and 27% RAP.
1 Introduction
The highway network serves as a critical lifeline for modern socio-economic systems. As of 2023, China’s total highway mileage has reached 5.4 million kilometers, accounting for 73.7% of national freight transport and 92.3% of inter-regional passenger traffic. Due to prolonged exposure to heavy truck loads, asphalt pavements on ordinary highways are susceptible to structural deterioration, with typical failure modes simultaneously affecting both the asphalt surface layer and the underlying base layer. These composite damage characteristics necessitate in-depth rehabilitation of the base layer during major and medium rehabilitation.
Facing global resource scarcity and environmental pressures, the sustainable development of road infrastructure has become increasingly critical. Conventional road construction and maintenance practices consume substantial quantities of virgin aggregates. Furthermore, traditional rehabilitation processes generate vast amounts of pavement waste materials, posing significant environmental disposal challenges. Therefore, innovation in road maintenance technologies that offer both economic and environmental benefits is imperative. Among these, asphalt pavement recycling technologies are attracting significant attention due to their multiple advantages. By recycling reclaimed pavement materials, these technologies not only effectively reduce waste disposal pressures but also reduce the consumption of virgin materials like aggregates and asphalt, thereby lowering carbon emissions and energy consumption.
According to the Technical Specifications for Highway Asphalt Pavement Recycling in China (Ministry of Transport of the People’s Republic of China, 2019), commonly employed asphalt pavement recycling technologies primarily include cold in-place recycling, cold central plant recycling, hot in-place recycling, and hot central plant recycling. FDR-PC is an advancement derived from cold in-place recycling technology. It retains the advantages of on-site construction and ambient-temperature operations while overcoming the limitations of conventional recycling methods that typically only restore the surface or partially repair the base. Notably, FDR-PC enables in-depth regeneration of the base layer and comprehensive structural rehabilitation. This technology involves milling the existing asphalt pavement surface and base layers using cold recycling equipment, incorporating binders such as emulsified asphalt, foamed asphalt, or inorganic binders, and subsequently re-compacting the reclaimed mixture to form a new structural pavement layer (Fedrigo et al., 2020). The milling depth of FDR-PC typically ranges from 100 mm to 300 mm, with a maximum depth of 450 mm (Fedrigo et al., 2020).
Current research on FDR-PC technology primarily focuses on material properties. The 7-day UCS serves as a key design parameter, forming a multi-dimensional evaluation framework for FDR-PC material performance that includes ITS, flexural strength, and direct tensile strength (Fedrigo et al., 2020). Fatigue performance is also regarded as a critical indicator (Fedrigo et al., 2020; Jiang et al., 2020; Li et al., 2024a).
Investigations into the constituent materials of FDR-PC indicate that cement and RAP significantly influence material properties. Cement enhances strength, stiffness, and durability through hydration reactions; however, excessive cement content may induce shrinkage cracking (Li et al., 2024a; Li et al., 2024b; López et al., 2018; Jones et al., 2015). The incorporation of RAP, while enhancing the utilization rate of waste materials and offering environmental benefits, tends to increase material porosity and diminish mechanical properties, leading to increased deformation under load (Grilli et al., 2013; Yuan et al., 2011). Furthermore, research demonstrates that higher RAP content substantially decreases the material’s fatigue life (Li et al., 2024a). Consequently, in engineering practice, cement content is typically maintained at 2%–6% of the mass of the total aggregate, while RAP content is limited to below 50% (Fedrigo et al., 2020; Fedrigo et al., 2017).
Studies on the preparation procedures of FDR-PC mixtures indicate that vibration compaction results in higher density and UCS compared to static compaction (Li et al., 2024b; Jiang and Fan, 2013). Research on curing parameters indicates that UCS increases significantly with rising temperatures up to 30°C, after which the rate of gain diminishes. Additionally, strength development markedly slows after 7 days of curing and generally reaches a stable state after 28 days (Li et al., 2024b).
Existing studies have demonstrated that the FDR-PC technology exhibits significant advantages in terms of carbon emissions. Comparative analyses of multiple road rehabilitation projects across diverse regions—including interstate highway and primary route repairs in Virginia (United States) (Amarh et al., 2022), old road reconstruction projects in Canada (Souza et al., 2024), and European road network rehabilitation projects (Schmitt et al., 2025)—consistently reveal these benefits. Compared to conventional Mill and Fill, the FDR technology achieves substantial reductions in carbon emissions and energy consumption, accounting for only 51% and 64% of those associated with the latter, respectively (Souza et al., 2024). Additionally, FDR-PC exhibits superior environmental performance relative to conventional recycling methods, including in-place recycling (Amarh et al., 2022). A comparative study further demonstrates that the FDR-PC process incorporating stabilizers yields greater environmental benefits than non-stabilizer approaches (Schmitt et al., 2025). Although stabilizers may introduce some environmental impacts, their role in enhancing material properties reduces the need for additional materials, resulting in improved overall environmental performance.
In engineering applications, the synergistic optimization of material properties and environmental sustainability is crucial. In FDR-PC technology, the addition of cement typically improves mechanical performance but increases environmental impact, while the use of RAP reduces environmental burden but may compromise performance. This inherent trade-off makes it difficult to simultaneously optimize both aspects, necessitating the implementation of multi-objective optimization approaches to identify balanced solutions.
Globally, nations invest billions annually in road maintenance while confronting constraints including limited funding allocations, greenhouse gas emissions from rehabilitation activities, and socio-economic impacts of road closures (Chowdhury et al., 2010; Shang et al., 2010; Salem et al., 2013). These challenges underscore the importance of advancing FDR-PC technology research, particularly through the development of comprehensive multi-objective optimization models to determine optimal equilibria among economic efficiency, engineering performance, and environmental sustainability.
In multi-objective optimization problems, it is often not possible to identify a single best solution that simultaneously satisfies all objectives. Instead, a range of equally viable solutions is obtained, each representing a different trade-off between conflicting goals (Ma et al., 2023). A systematic analysis of 202 research papers indicates that current road maintenance decision systems are transitioning from single indicators to multi-objective collaborative optimization (Chen and Zheng, 2021). This trend aligns particularly well with the contemporary demands of sustainable infrastructure development, emphasizing the comprehensive consideration of multiple dimensions, including material performance, economic costs, and environmental impacts. In road engineering, genetic algorithms (GA) and multi-objective optimization methods have been extensively employed.
Recent years have witnessed significant advancements in multi-objective optimization research for road maintenance decision-making. Scholars have developed comprehensive decision models incorporating performance, economic, and environmental factors from diverse perspectives. Huang et al. (2021) established a pavement maintenance decision system considering life-cycle costs through the integration of LCA and LCCA methodologies (Huang et al., 2021). The study revealed user costs as the dominant expenditure component and identified design life as a critical factor influencing maintenance strategies. Guan et al. (2022) proposed an enhanced NSGA-II algorithm coupled with a pavement-traffic interaction model, successfully generating a three-dimensional Pareto frontier encompassing agency costs, user costs, and greenhouse gas emissions (Guan et al., 2022). This research demonstrated the efficacy of multi-objective optimization in balancing environmental and economic objectives.
Subsequent studies have further investigated the trade-offs between performance enhancement and environmental-economic costs. Yu et al. (2015) developed an optimization model incorporating multiple indicators, including pavement performance, cost, and environmental factors (Yu et al., 2015). The findings revealed that while performance could be substantially improved, such enhancement incurred higher costs and greater environmental impacts. Similarly, Reger et al. (2014) conducted an empirical analysis of California’s highway network, demonstrating that conventional maintenance strategies often fail to achieve the Pareto frontier (Reger et al., 2014). In contrast, multi-objective optimization was shown to simultaneously reduce both societal costs and carbon emissions, highlighting the value of integrated decision-making approaches.
This study investigates a highway engineering project in Inner Mongolia, China, with RAP and cement contents as the primary design variables. Based on systematic laboratory testing and LCA, two objective functions were defined for FDR-PC materials: mechanical performance and environmental impact. Multi-objective optimization was performed using the NSGA-II algorithm, yielding a set of Pareto-optimal solutions. The TOPSIS method was subsequently applied to evaluate the Pareto-optimal solutions, facilitating the identification of three distinct optimization strategies—performance-priority, environment-priority, and a balanced solution, each with its corresponding optimal material mix proportions.
2 Method and materials
2.1 Raw material
The primary constituents of FDR-PC are RAP, reclaimed inorganic binder stabilize aggregate (RAI) and cement. The RAP material was specifically recovered from the asphalt surface layer of the existing pavement on National Highway 110, a secondary road located in China’s Inner Mongolia Autonomous Region. The original pavement structure consisted of a 4-cm-thick AC-16 asphalt mixture surface layer overlying a 20-cm-thick cement-stabilized crushed stone base layer. During material preparation, a milling machine was used to perform layer-by-layer removal of the existing pavement. Following laboratory processing involving natural air-drying and sieving, two distinct materials were obtained: RAP and RAI, as illustrated in Figure 1. The stabilizing agent was 42.5-grade ordinary Portland cement, with all technical specifications complying with the requirements of the Technical Specifications for Highway Asphalt Pavement Recycling (JTG/T 5521-2019) (Ministry of Transport of the People’s Republic of China, 2019). Detailed technical parameters are provided in Table 1.
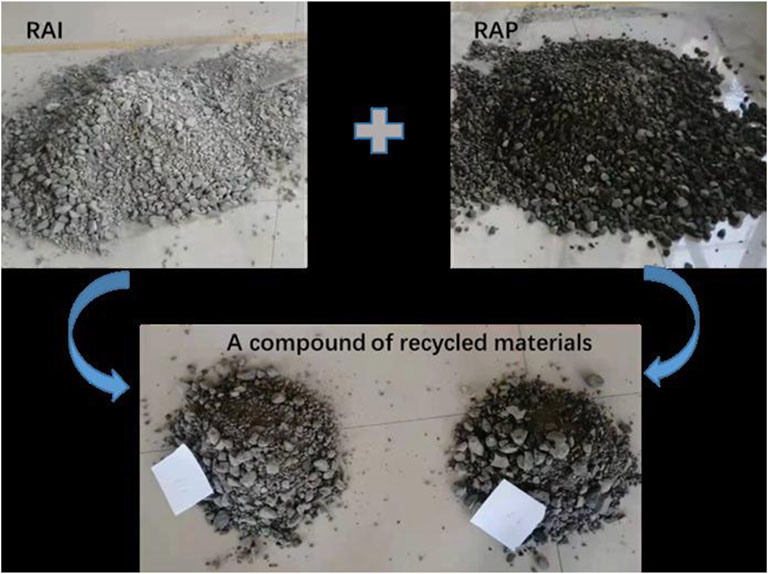
Figure 1. Recycled materials composed of a proportional blend of RAI and RAP.
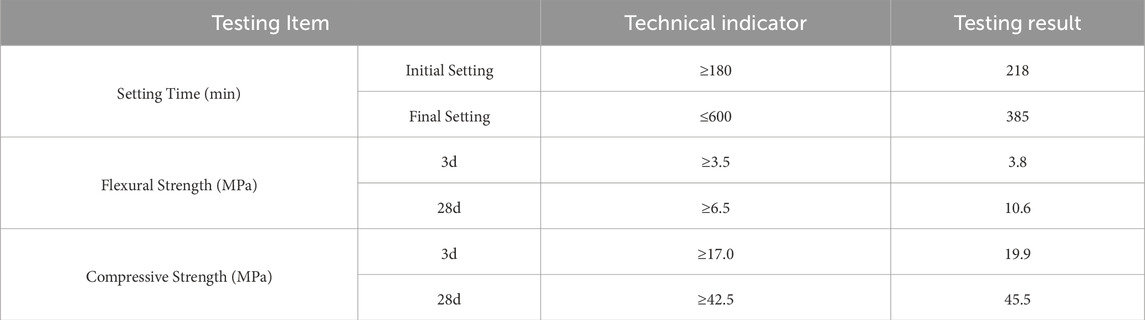
Table 1. Technical specifications of 42.5-grade Portland cement.
Based on the thickness ratio between the aged asphalt surface layer and base layer, practical construction conditions, and economic considerations relevant to China’s national road network, this study employed three representative base-to-surface ratios (mass ratios of RAI to RAP) of 10:0, 8:2, and 6:4. These predefined ratios were used to guide the blending of RAI and RAP for the preparation of recycled materials. The gradation curves of the resulting recycled materials are presented in Figure 2, with all parameters meeting the requirements specified in China’s Technical Specifications for Highway Asphalt Pavement Recycling (JTG/T 5521-2019) (Ministry of Transport of the People’s Republic of China, 2019).
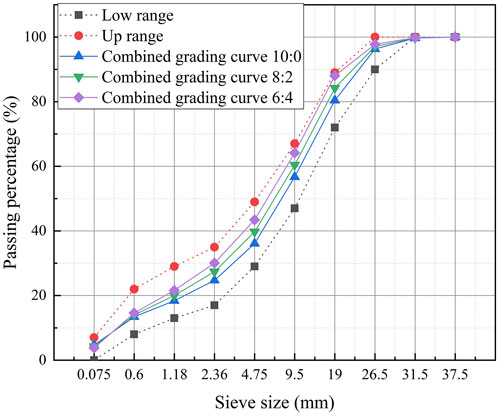
Figure 2. Gradation curves of FDR-PC cold recycled mixtures with base-to-surface ratios of 10:0, 8:2, and 6:4.
2.2 Performance test
In this study, three representative mechanical performance parameters—UCS, ITS, and RCS after freeze–thaw cycles—were selected as key indicators for evaluating the performance of FDR-PC cold recycled mixtures. Among these, the UCS test is widely recognized for its simplicity and cost-effectiveness, and it has been extensively adopted by numerous countries as a primary parameter in mixture design. ITS serves as a crucial basis for determining the allowable tensile stress at the bottom of semi-rigid base layers in China’s Specifications for Design of Highway Asphalt Pavements (Ministry of Transport of the People’s Republic of China, 2019). It is also a commonly used mechanical index for mixtures stabilized with inorganic binders. This method is easy to perform, has good repeatability, and is one of the most commonly used approaches for assessing tensile properties of materials. Given that Inner Mongolia belongs to a seasonal frozen soil region, the durability issues of pavement bases caused by freeze-thaw damage are one of the primary forms of distress. Therefore, this study considers the freeze-thaw resistance of FDR-PC as one of its important performance evaluation indicators.
All test specimens were prepared using a static compaction method. The specimens were cylindrical, with a diameter of 150 mm and a height of 150 mm. Curing was carried out under standard conditions at a temperature of 20°C ± 2°C and a relative humidity of 95% until the designated curing age. Some specimens underwent water immersion treatment prior to the end of the curing period. The specific procedures for each performance test are described as follows.
The UCS test was conducted in accordance with JTG E51-2009 (T0806-1994) (Ministry of Transport of the People’s Republic of China, 2009). Specimens were cured for 6 days, followed by immersion in water for 1 day. Compression loading was then applied at a constant rate and the maximum load at failure was recorded. The UCS was calculated using Equation 1.
where
The ITS test was performed after 90 days of specimen curing, following the procedures outlined in T0806-1994 (Ministry of Transport of the People’s Republic of China, 2009). A standardized loading apparatus was used to apply the load, and the maximum load at specimen failure was recorded. The ITS was calculated using Equation 2.
In the equation,
For the freeze–thaw resistance test, a total of 18 specimens were prepared for each type of mixture and divided into two groups: the non-freeze-thaw group and the freeze–thaw group, each containing nine specimens. After 28 days of curing and water immersion on the final day, specimens underwent five freeze–thaw cycles in accordance with T0858-2009 (Ministry of Transport of the People’s Republic of China, 2009). Upon completion of the cycles, the average mass loss rate was determined. UCS tests were then conducted on both the freeze–thaw and non-freeze-thaw groups, and the strength retention ratio was calculated using Equation 3.
Here,
2.3 LCA methodology
This study employs LCA methodology to evaluate carbon emissions and energy consumption throughout the lifecycle of FDR-PC technology in highway rehabilitation. The LCA methodology follows the ISO 14040 (2006) standard (Finkbeiner et al., 2006; ISO. ISO 14040, 2006), and a process-based LCA framework is adopted. The rehabilitation process is divided into several discrete phases, with energy use and pollutant emissions quantified at each stage. By integrating activity data with corresponding carbon emission factors, a carbon emission estimation model is established, enabling the cumulative evaluation of energy consumption and carbon emissions throughout the entire life cycle.
This study is based on a real-world highway project in China, with the LCA functional unit defined as the construction of a 1-km-long, 24 cm-thick FDR-PC recycled base layer. Only the base layer construction is considered within the system boundary. The project section is located in Ulanqab City, Inner Mongolia Autonomous Region, spanning from K346 + 100 to K351 + 200. The pavement width is 10.50 m, and the subgrade width is 11.50 m.
The FDR-PC technology in highway rehabilitation can be categorized into three lifecycle phases: the raw material production phase, the transportation phase, and the construction phase.
The raw material production phase primarily involves energy consumption and carbon emissions during material processing, excluding raw material extraction and transportation. The transportation phase encompasses the delivery of processed materials from factories to construction sites, with carbon emissions predominantly resulting from transport vehicle fuel consumption. The construction phase includes processes such as existing pavement milling, material mixing, as well as paving and compaction operations, accounting only for fuel consumption and carbon emissions from construction machinery during operational activities.
3 Multi-objective optimization
3.1 Pareto front
Multi-objective optimization involves the simultaneous minimization of multiple objective functions subject to specified constraints, as illustrated in Equation 4. Here,
In practical applications, multi-objective optimization problems often involve inherent conflicts among objectives, making it impossible to simultaneously minimize all objective functions. Therefore, the primary goal of multi-objective optimization is to identify solutions that achieve an optimal trade-off among competing objectives.
A solution
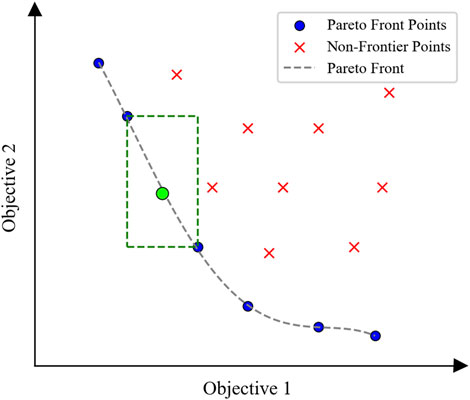
Figure 3. Illustration of a Pareto front. Both objective 1 and objective 2 are optimized toward minimization. The length and width of the green dashed rectangle represent the crowding distances of the green point on the Pareto front with respect to the two objectives, respectively.
3.2 NSGA-II algorithm
NSGA-II is a multi-objective genetic optimization algorithm rooted in the principle of Pareto optimality. This algorithm effectively approximates the Pareto frontier solution set while preserving population diversity through rapid non-dominated sorting and crowding distance computation. In contrast to conventional optimization methods, NSGA-II exhibits enhanced capability in managing complex trade-offs among multiple objectives. Its elitist preservation strategy promotes convergence and guarantees solution optimality, rendering it particularly effective for engineering optimization problems involving multiple constraints (Deb et al., 2002). The primary procedural steps of the NSGA-II algorithm are as follows:
1. Randomly generate an initial parent population
2. For the
3. Combine the parent population
4. Perform fast non-dominated sorting on
5. Increment
3.3 TOPSIS algorithm
Since all solutions on the Pareto front are mutually non-dominated and cannot be directly compared in terms of superiority, they present significant decision-making challenges. In such cases, the TOPSIS algorithm can be employed to evaluate the solutions on the Pareto front. By measuring distances to both the ideal best and ideal worst solutions, TOPSIS establishes a comparable ranking system for these non-dominated solutions. This approach effectively prioritizes points on the Pareto front while preserving the diversity inherent in multi-objective optimization (Behzadian et al., 2012). The basic procedure of the algorithm is as follows (Tzeng and Huang, 2011):
1. Calculate the vector-normalized objective function values
2. Weight the normalized objective function values according to the predefined weights of each objective function, thereby constructing the weighted normalized matrix
3. Select the optimal value from each column of the weighted matrix as the positive ideal solution
4. Calculate the Euclidean distances (
5. Determine the closeness coefficient
4 Results and discussion
4.1 Performance objective function
The experimental data of FDR-PC cold recycled mixtures with varying cement contents and RAP contents are presented as follows: Table 2 shows the 7-day UCS test results, Table 3 provides the ITS test results, and Table 4 summarizes the RCS test results.
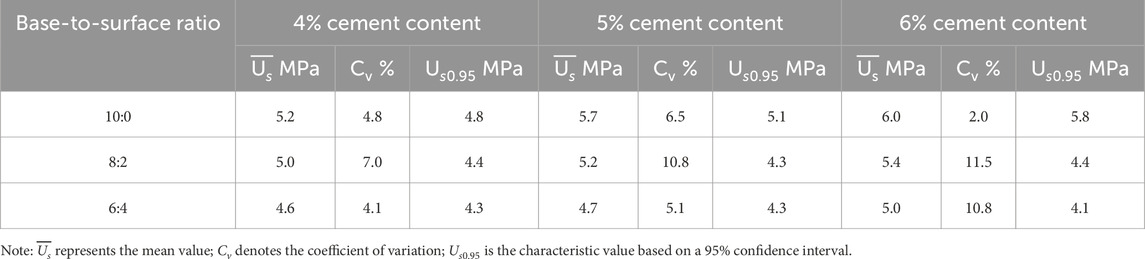
Table 2. UCS test results of FDR-PC cold-recycled mixtures with base-to-surface ratios of 10:0, 8:2, and 6:4, and cement contents of 4%, 5%, and 6%.
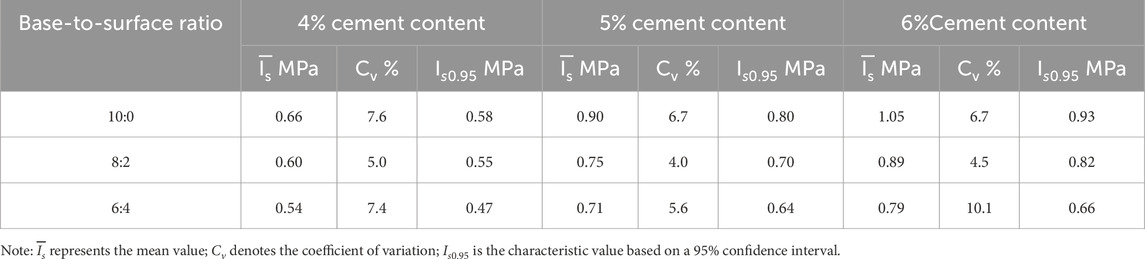
Table 3. ITS test results of FDR-PC cold-recycled mixtures with base-to-surface ratios of 10:0, 8:2, and 6:4, and cement contents of 4%, 5%, and 6%.
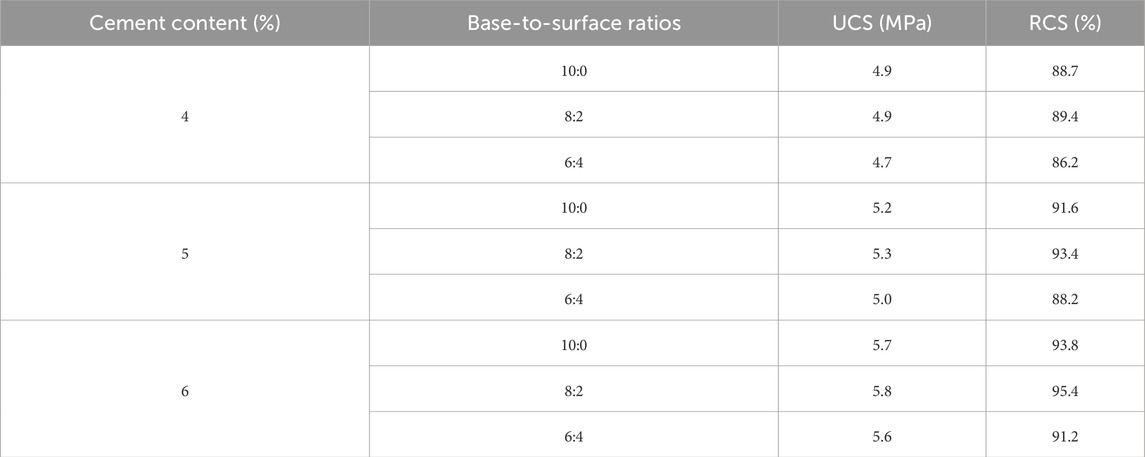
Table 4. Results of five freeze-thaw cycles for FDR-PC cold-recycled mixtures with base-to-surface ratios of 10:0, 8:2, and 6:4, and cement contents of 4%, 5%, and 6%.
Using cement content and RAP content as independent variables, and the mean UCS and ITS values together with the measured RCS value as dependent variables, predictive models were developed via bivariate quadratic polynomial regression. Model parameters were estimated via the least square method, with the polynomial degree fixed at two to prevent overfitting. As shown in Table 5, all fitted equations yielded coefficients of determination greater than 0.98, indicating strong model performance.
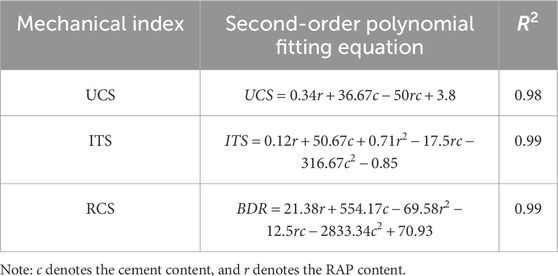
Table 5. Fitted equations for UCS, ITS, and RCS of FDR-PC cold recycled mixtures with base-to-surface ratios of 10:0, 8:2, and 6:4, and cement contents of 4%, 5%, and 6%.
To evaluate material performance, UCS, ITS, and RCS are used as primary indicators, and a weighted aggregation method is applied to construct the material performance objective function. Since these indicators have different physical dimensions, normalization is performed to eliminate dimensional inconsistency. Normalized values are denoted with an asterisk (*), and the normalization is performed according to Equation 6:
where
Using the weighted aggregation method, the performance objective function for FDR-PC cold recycled mixtures is formulated as shown in Equation 7.
Here,
4.2 Environment impact objective function
When calculating carbon emissions and economic costs, the mass of the FDR-PC cold recycled mixture must be determined. The laboratory calculation formula for the FDR-PC cold recycled mixture is presented in Equation 8:
where
The evaluation of mass requires two key parameters: maximum dry density and optimum moisture content. Table 6 presents the experimental data for these parameters in FDR-PC mixtures with varying cement contents and base-to-surface ratios. Using cement and RAP contents as independent variables, and maximum dry density and optimum moisture content as dependent variables, bivariate quadratic polynomial regression was performed on the experimental data. As shown in Table 7, all fitted models achieved coefficients of determination greater than 0.95, indicating excellent goodness of fit.
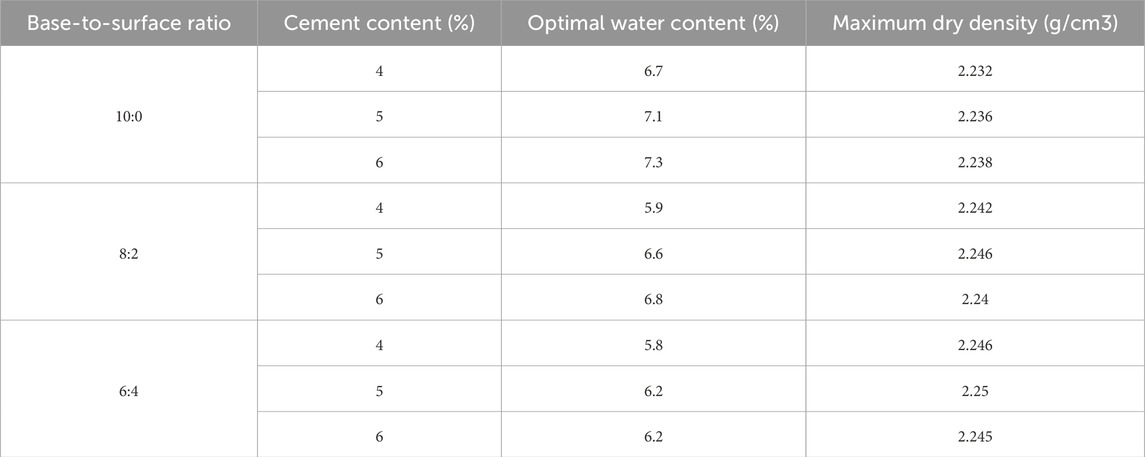
Table 6. Test results of maximum dry density and optimum moisture content for FDR-PC cold recycled mixtures with base-to-surface ratios of 10:0, 8:2, and 6:4, and cement contents of 4%, 5%, and 6%.
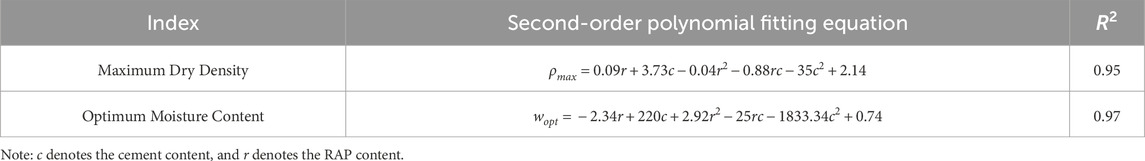
Table 7. Fitted equations for maximum dry density and optimum moisture content of FDR-PC cold recycled mixtures with base-to-surface ratios of 10:0, 8:2, and 6:4, and cement contents of 4%, 5%, and 6%.
Based on Equation 8, the mass of each material within the functional unit in the LCA can be calculated. Specifically, the total mass of the mixture is determined by Equation 9, the cement mass by Equation 10, and the water mass by Equation 11.
Here,
Based on the LCA methodology and carbon emission factor approach, the total carbon emissions of FDR-PC technology during highway rehabilitation can be calculated using Equation 12:
Here, the three terms represent the raw material production, transportation, and construction phases, respectively.
Similarly, the total energy consumption of FDR-PC is calculated using Equation 13:
Analogous to Equation 12,
During the raw material production phase, the primary materials consist of cement and water. In the transportation phase, cement and water are transported to the construction site by lorry. During the construction phase, a cold recycling machine mills the existing pavement, mixes the reclaimed material with cement, and forms a new surface, which is subsequently leveled by a motor grader and compacted by a road roller.
In the calculation of carbon emissions and energy consumption, conventional approaches typically consider only explicit emissions and energy use, primarily attributed to cement utilization, while overlooking the potential environmental benefits associated with the utilization of RAP and RAI. RAI and RAP contain substantial amounts of aggregate, which can significantly reduce the demand for virgin aggregate. Furthermore, RAP incorporates a certain proportion of aged asphalt binder, enabling the partial substitution of virgin asphalt materials.
Therefore, this study considers the equivalent aggregate and asphalt savings achieved through the incorporation of RAI and RAP as their inherent carbon emission and energy consumption advantages. These advantages are subsequently integrated into the environmental impact objective function for evaluation, as detailed in the following Equations 14, 15:
where
The carbon emission and energy consumption factors are listed in Table 8. The factors for cement, aggregate and asphalt were obtained from Pan (Pan, 2011), while the fuel consumption and operational efficiency data for lorry, cold recycling machine, motor graders, and road rollers were sourced from Highway Engineering Machinery Shift Cost Quota (Ministry of Transport of the Peo ple’s Republic of China, 2018) and China Energy Statistical Yearbook (National Bureau of Statistics of China, 2022).
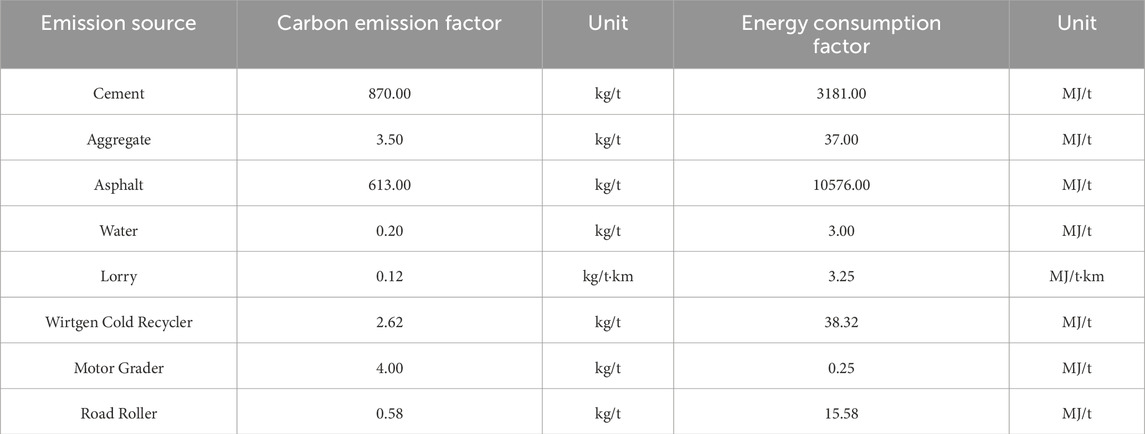
Table 8. Carbon emission factors and energy consumption factors of raw materials and machinery in the lifecycle of FDR-PC technology for road rehabilitation.
Based on the weighted Equation 6, the environmental impact objective function is formulated by integrating the carbon emission models (Equations 12, 14) and the energy consumption models (Equations 13, 15), each with their associated weighting coefficients, as presented in Equation 16:
where
4.3 Multi-objective optimization result
This study utilizes the NSGA-II algorithm for multi-objective optimization, with the optimization model detailed in Equation 17.
Here,
Equation 18 defines the constraints for the multi-objective optimization. The cement content is limited to a range of 4%–6%, corresponding to
The multi-objective optimization results are illustrated in Figure 4. Figures 4a,b depict the distribution of the Pareto front in the objective function space and parameter space, respectively. Additionally, under the condition of equal weighting between the performance and environmental objectives, where each objective was assigned a weight of 0.5, the TOPSIS scores of the Pareto optimal points were calculated and visualized using a colormap, as presented in Figure 4.
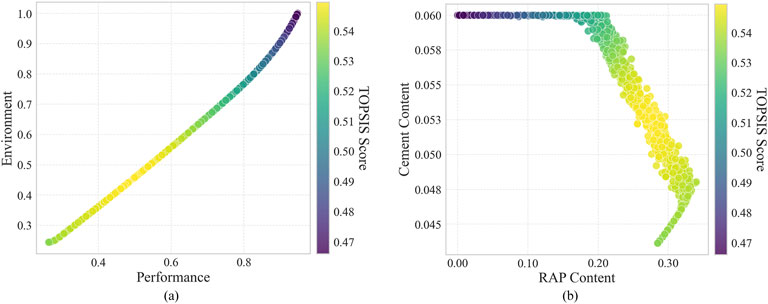
Figure 4. Pareto front of FDR-PC optimization results. The colormap shows TOPSIS scores with equal weights. (a) Objective space: performance vs. environmental impact; (b) Parameter space.
Figure 4a reveals a significant negative correlation between the performance and environmental objective functions. In the environmental impact assessment, the carbon emission factor of cement is remarkably higher than other factors, exceeding them by nearly two orders of magnitude. Given that cement enhances various aspects of the material’s performance, improvements in material properties typically stem from an increased cement content. This relationship directly leads to a substantial increase in carbon emissions and energy consumption, thus manifesting as a trade-off between the performance and environmental objective functions.
Figure 4b demonstrates the characteristic parameter combinations corresponding to the non-dominated solutions of the Pareto front. The RAP content ranges from 0% to 34%, and the cement content ranges from 4.4% to 6%. Based on the parameter distribution characteristics, three distinct regions can be roughly identified. The first region corresponds to cement content approaching its upper constraint limit, while RAP content varies from 0% to 20%, approximately the minimum to the midpoint of its constraint range. As indicated by the corresponding colormap in Figure 4a, this region is associated with high material performance and high environmental impact. In the second region, the cement content gradually decreases from 6% to 4.8%, and the RAP content gradually increases from 20% to 34%, representing a balance between moderate material performance and moderate environmental impact for both objective functions. The third region shows a decrease in cement content from 4.8% to 4.4% and a decrease in RAP content from 34% to 28%, corresponding to low material performance and low environmental impact.
In addition to the equal-weighted case, we also evaluated TOPSIS scores under performance-priority and environment-priority weighting schemes. For performance-priority, weights were set as 0.8 (performance) and 0.2 (environment); for environment-priority, the weights were reversed. Figure 5 presents the spatial distribution of the TOPSIS evaluation results under different weights using colormaps, and Table 10 summarizes the parameter combinations with the highest TOPSIS scores for the three weighting schemes. Figure 5a shows that under performance priority, high-scoring parameter combinations are concentrated in region 1, with the highest-scoring combination being 6% cement content and 5% RAP content. Figure 5b indicates that under environment priority, high-scoring parameter combinations are concentrated in region 3, with the highest-scoring combination being 4.6% cement content and 32% RAP content. As shown in Figure 4b, under balanced performance and environmental weights, high-scoring parameter combinations are concentrated in region 2, with the highest-scoring combination being 5.2% cement content and 27% RAP content.

Figure 5. TOPSIS scores of the Pareto front under varying objective weightings: (a) performance-prioritized scenario; (b) environmental impact-prioritized scenario.
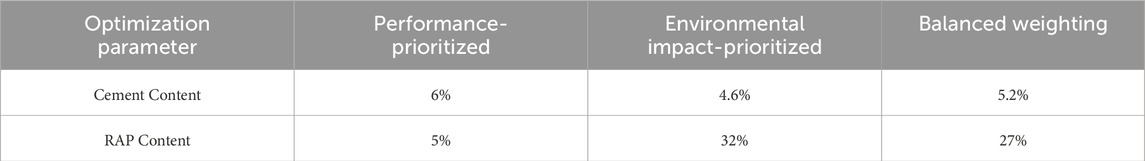
Table 10. Optimal parameter combinations of the Pareto front under varying objective weightings.
5 Conclusion
This study experimentally investigated three strength performance indicators of FDR-PC cold recycled mixtures—UCS, ITS, and RCS—under varying RAP and cement contents. Using cement content and RAP content as independent variables, predictive models for each performance indicator were established through polynomial fitting, and a comprehensive performance objective function was constructed via weighted aggregation. Based on the LCA methodology, the application process of FDR-PC technology was divided into three phases: raw material production, transportation, and construction. By incorporating emission and consumption factors, calculation models for carbon emissions and energy consumption at each phase were developed, subsequently formulating an environmental impact objective function through weighted aggregation.
The NSGA-II algorithm was implemented to perform multi-objective optimization considering material performance and environmental impact, generating Pareto-optimal solutions under constraints. The parameter combinations of the non-dominated solutions were distributed in three regions with distinct trends: high-performance, high-environmental-impact combinations were concentrated in areas with cement content close to the maximum of 6.0% and RAP content below 20%; low-performance, low-environmental-impact combinations were clustered in a narrow region with 4.4%–4.8% cement content and 28%–34% RAP content; and more balanced performance-environment combinations were found with cement content from 4.8% to 6.0% and RAP content from 20% to 34%. According to TOPSIS scoring, when material performance is prioritized, the optimal parameters are 6.0% cement content and 5% RAP content, when environmental impact is prioritized, the optimal parameters are 4.6% cement content and 32% RAP content, and for a balance between performance and environment, the optimal parameters are 5.2% cement content and 27% RAP content.
The limitations of this study primarily stem from the scope of the selected indicators and analysis boundaries. The optimal mix parameters identified are specific to the objective functions and the particular performance and environmental indicators adopted in this research. Moreover, the life cycle assessment was limited to the core stages of road rehabilitation, excluding the use, maintenance, and end-of-life phases. To gain a more comprehensive understanding, future studies should consider incorporating economic cost factors and expanding the analysis to encompass the full life cycle of the pavement materials.
Data availability statement
The original contributions presented in the study are included in the article/supplementary material, further inquiries can be directed to the corresponding author.
Author contributions
QX: Conceptualization, Data curation, Formal Analysis, Software, Writing – original draft, Writing – review and editing. HZ: Conceptualization, Formal Analysis, Funding acquisition, Investigation, Methodology, Resources, Software, Writing – original draft. WM: Software, Validation, Visualization, Writing – review and editing. XG: Resources, Supervision, Validation, Writing – review and editing. QZ: Validation, Visualization, Writing – original draft.
Funding
The author(s) declare that financial support was received for the research and/or publication of this article. This research was funded by Henan Provincial Department of Housing and Urban-Rural Development Science and Technology Planning Project (K-2359) and the Science and Technology Department of Henan Province (NO.242102241013), and Supported by the Pingdingshan Major Science and Technology Project (2021ZD07).
Conflict of interest
Authors QX and WM were employed by Henan Zhongping Jiaoke Res and Design Inst Co Ltd.
The remaining authors declare that the research was conducted in the absence of any commercial or financial relationships that could be construed as a potential conflict of interest.
Generative AI statement
The author(s) declare that no Generative AI was used in the creation of this manuscript.
Publisher’s note
All claims expressed in this article are solely those of the authors and do not necessarily represent those of their affiliated organizations, or those of the publisher, the editors and the reviewers. Any product that may be evaluated in this article, or claim that may be made by its manufacturer, is not guaranteed or endorsed by the publisher.
References
Amarh, E. A., Santos, J., Flintsch, G. W., and Diefenderfer, B. K. (2022). Evaluating the potential environmental benefits of cold recycling-based methods for flexible pavement rehabilitation in Virginia. Transp. Res. Rec. 2676 (6), 75–86. doi:10.1177/03611981211072786
Behzadian, M., Otaghsara, S. K., Yazdani, M., and Ignatius, J. (2012). A state-of the-art survey of TOPSIS applications. Expert Syst. Appl. 39 (17), 13051–13069. doi:10.1016/j.eswa.2012.05.056
Chen, W., and Zheng, M. (2021). Multi-objective optimization for pavement maintenance and rehabilitation decision-making: a critical review and future directions. Automation Constr. 130, 103840. doi:10.1016/j.autcon.2021.103840
Chowdhury, R., Apul, D., and Fry, T. (2010). A life cycle based environmental impacts assessment of construction materials used in road construction. Resour. Conservation Recycl. 54 (4), 250–255. doi:10.1016/j.resconrec.2009.08.007
Deb, K., Pratap, A., Agarwal, S., and Meyarivan, T. A. M. T. (2002). A fast and elitist multiobjective genetic algorithm: NSGA-II. IEEE Trans. Evol. Comput. 6 (2), 182–197. doi:10.1109/4235.996017
Fedrigo, W., Núñez, W. P., Kleinert, T. R., Matuella, M. F., and Ceratti, J. A. P. (2017). Strength, shrinkage, erodibility and capillary flow characteristics of cement-treated recycled pavement materials. Int. J. Pavement Res. Technol. 10 (5), 393–402. doi:10.1016/j.ijprt.2017.06.001
Fedrigo, W., Nunez, W. P., and Visser, A. T. (2020). A review of full-depth reclamation of pavements with Portland cement: Brazil and abroad. Constr. Build. Mater. 262, 120540. doi:10.1016/j.conbuildmat.2020.120540
Finkbeiner, M., Inaba, A., Tan, R., Christiansen, K., and Klüppel, H. J. (2006). The new international standards for life cycle assessment: ISO 14040 and ISO 14044. Int. J. life cycle Assess. 11, 80–85. doi:10.1065/lca2006.02.002
Grilli, A., Bocci, E., and Graziani, A. (2013). Influence of reclaimed asphalt content on the mechanical behaviour of cement-treated mixtures. Road Mater. Pavement Des. 14 (3), 666–678. doi:10.1080/14680629.2013.794367
Guan, J., Yang, X., You, L., Ding, L., and Cheng, X. (2022). Multi-objective optimization for sustainable road network maintenance under traffic equilibrium: incorporating costs and environmental impacts. J. Clean. Prod. 334, 130103. doi:10.1016/j.jclepro.2021.130103
Huang, M., Dong, Q., Ni, F., and Wang, L. (2021). LCA and LCCA based multi-objective optimization of pavement maintenance. J. Clean. Prod. 283, 124583. doi:10.1016/j.jclepro.2020.124583
ISO. ISO 14040 (2006). Environmental management-Life cycle assessment-Principles and framework. Geneva: International Organization for Standardization.
Jiang, Y., Yuan, K., Deng, C., and Tian, T. (2020). Fatigue performance of cement-stabilized crushed gravel produced using vertical vibration compaction method. J. Mater. Civ. Eng. 32 (11), 04020318. doi:10.1061/(ASCE)MT.1943-5533.000340
Jiang, Y. J., and Fan, L. F. (2013). An investigation of mechanical behavior of cement-stabilized crushed rock material using different compaction methods. Constr. Build. Mater. 48, 508–515. doi:10.1016/j.conbuildmat.2013.07.017
Jones, D., Wu, R., and Louw, S. (2015). Comparison of full-depth reclamation with Portland cement and full-depth reclamation with no stabilizer in accelerated loading test. Transp. Res. Rec. 2524 (1), 133–142. doi:10.3141/2524-13
Li, Y., Luo, C., Ji, K., Zhang, H., and Sun, B. (2024b). Laboratory evaluation of strength performance of full-depth reclamation with Portland cement material. Coatings 14 (5), 573. doi:10.3390/coatings14050573
Li, Y., Zhao, L., Gao, J., Ru, Y., and Zhang, H. (2024a). Evaluation of the fatigue performance of full-depth reclamation with portland cement material based on the weibull distribution model. Coatings 14 (4), 437. doi:10.3390/coatings14040437
López, M. A. C., Fedrigo, W., Kleinert, T. R., Matuella, M. F., Núñez, W. P., and Ceratti, J. A. P. (2018). Flexural fatigue evaluation of cement-treated mixtures of reclaimed asphalt pavement and crushed aggregates. Constr. Build. Mater. 158, 320–325. doi:10.1016/j.conbuildmat.2017.10.003
Ministry of Transport of the People's Republic of China (2019). Technical specifications for highway asphalt pavement recycling. JTG/T 5521-2019.
Ma, H., Zhang, Y., Sun, S., Liu, T., and Shan, Y. (2023). A comprehensive survey on NSGA-II for multi-objective optimization and applications. Artif. Intell. Rev. 56 (12), 15217–15270. doi:10.1007/s10462-023-10526-z
Ministry of Transport of the People’s Republic of China. (2018). Highway engineering machinery Shift cost Quota. JTG/T 3833-2018.
Ministry of Transport of the People's Republic of China. (2009). Test methods of materials stabilized with inorganic binders for highway engineering. JTG E51-2009.
National Bureau of Statistics of China (2022). China energy statistical Yearbook. Beijing, China: China Statistics Press.
Pan, M. (2011). The methodology research and application on energy consumption and carbon emissions of highway based on the life cycle assessment (Doctoral dissertation). Guangzhou, China: South China University of Technology.
Reger, D., Madanat, S., and Horvath, A. (2014). Economically and environmentally informed policy for road resurfacing: tradeoffs between costs and greenhouse gas emissions. Environ. Res. Lett. 9 (10), 104020. doi:10.1088/1748-9326/9/10/104020
Salem, O. M., Deshpande, A. S., Genaidy, A., and Geara, T. G. (2013). User costs in pavement construction and rehabilitation alternative evaluation. Struct. Infrastructure Eng. 9 (3), 285–294. doi:10.1080/15732479.2010.550304
Schmitt, L., Levasseur, A., Vaillancourt, M., and Lachance-Tremblay, É. (2025). Life cycle assessment of various pavement rehabilitation techniques: a case study. Transp. Res. Part D Transp. Environ. 139, 104476. doi:10.1016/j.trd.2024.104476
Shang, C., Zhang, Z., and Li, X. (2010). Research on energy consumption and emission of life cycle of expressway. J. Highw. Transp. Res. Dev. 27 (8). doi:10.3969/j.issn.1002-0268.2010.08.028
Souza, J., Ezaoui, A., and Masdan, M. (2024). “Environmental assessment of two road rehabilitation processes: full-depth reclamation vs. mill and fill,” in International conference on maintenance and rehabilitation of pavements, 349–359.
Tzeng, G. H., and Huang, J. J. (2011). Multiple attribute decision making: methods and applications. Boca Raton, FL: CRC Press.
Yu, B., Gu, X., Ni, F., and Guo, R. (2015). Multi-objective optimization for asphalt pavement maintenance plans at project level: integrating performance, cost and environment. Transp. Res. Part D Transp. Environ. 41, 64–74. doi:10.1016/j.trd.2015.09.016
Keywords: pavement rehabilitation, full-depth reclamation with Portland cement, multiobjective optimization, pavement performance, carbon emission calculation
Citation: Xia Q, Zhang H, Miao W, Guo X and Zhang Q (2025) Multi-objective optimization of full depth reclamation with Portland cement using NSGA-II for sustainable pavement rehabilitation. Front. Built Environ. 11:1631169. doi: 10.3389/fbuil.2025.1631169
Received: 19 May 2025; Accepted: 23 June 2025;
Published: 02 July 2025.
Edited by:
Bowei Sun, Civil Aviation University of China, ChinaCopyright © 2025 Xia, Zhang, Miao, Guo and Zhang. This is an open-access article distributed under the terms of the Creative Commons Attribution License (CC BY). The use, distribution or reproduction in other forums is permitted, provided the original author(s) and the copyright owner(s) are credited and that the original publication in this journal is cited, in accordance with accepted academic practice. No use, distribution or reproduction is permitted which does not comply with these terms.
*Correspondence: Haiwei Zhang, emhhbmdod0B6dWEuZWR1LmNu