 Mohammad Arar*
 Kareen Kazaz
- Department of Architecture, College of Architecture Art and Design, Healthy & Sustainable Built Environment Research Center, Ajman University, Ajman, United Arab Emirates
Walkability ratings in the GCC are generally low. Beyond climate conditions, modern lifestyle shifts such as increased reliance on automobiles, home deliveries, remote work, and digital connectivity have contributed to the decline of walking as a primary mode of transport. While previous research has identified urban design factors that influence walkability, there is limited empirical evidence on how these factors operate within Dubai’s unique urban context. This paper investigates the impact of urban design on perceived walkability using objective site analysis. Based on a review of the existing literature, Ewing and Handy’s model was selected for its strong explanatory power; accounting for 95% of walkability variation across five key urban design factors: Imageability, Enclosure, Human Scale, Transparency, and Complexity. The model also identifies Human Scale as the most significant factor influencing walkability, which informed the study’s hypothesis that Human Scale would emerge as the primary predictor in the selected sites. Notably, Complexity consistently emerged as a strong predictor, underscoring the importance of spatial diversity and visual richness in enhancing pedestrian experiences. An objective built environment analysis was also conducted using Ewing and Handy’s field guide to assess the five walkability factors across the selected sites. This analysis highlighted which sub-factors, such as landscape features, positively contributed to walkability. However, it also revealed the assessments, particularly in how each site ranked across the design factors. The findings affirm the relevance of Ewing and Handy’s model in assessing overall walkability; however, they also suggest that additional variables may be needed to fully capture the dynamics of walkability in Dubai’s urban context. While the model identifies Human Scale as the most significant factor, an insight that shaped this study’s original hypothesis, the results reveal that this may not hold true uniformly across all locations. Instead, Complexity consistently emerged as a stronger predictor, emphasizing the role of spatial diversity and visual richness in shaping the pedestrian experience. These insights offer valuable guidance for urban planners and policymakers aiming to enhance walkability, particularly in the design and development of low-rise areas intended to attract pedestrians.
1 Introduction
Over the last 100 years, cities have undergone a significant transformation in their spatial development and growth in size. The United States started developing small, mixed-use neighborhoods in the beginning of the 20th century, where its residents could live and work in the same location. But this pattern started to slowly change with the invention of the automobiles, zoning regulations, federal government mortgage policies and modern architecture. Development patterns had entirely changed to conventional neighborhood development by the end of World War II, requiring extensive use of automobiles and strict division of land uses (New Urban News, 2004). In the past few decades there has been a growing public awareness of the impact that automobiles have been having on cities. Large ecological footprints and car dependence have been linked to the loss of numerous urban qualities, such as walkability, accessible public transportation and job access. Nowadays, there is a link between the dependence of automobiles and levels of obesity, stress, and mental health development in children (Peter Newman, 2005).
The term walkability is defined as the degree to which a place is suitable to walk in. It is influenced by various factors such as the pavements or crossings, the quality of paths, roads, lighting and accessibility of the surrounding buildings and the perceptions of safety (Refaat and Kafafy, 2014). Walkability is a way to gauge how conveniently a community’s amenities and services are reachable by foot (Flockhart et al., 2022). Another definition of walkability is the extent to which a neighborhood supports walking; by measuring how inviting or uninviting this area is to pedestrians (Amoruso, 2016). Functionally, it is very important to consider walkability in your urban design framework as it has an impact on various aspects of society.
Walking, as a mode of transportation, is not very common in the GCC. Notwithstanding the climate, the introduction of the automobile and other relevant factors in our modern lives such as home deliveries, working from home, and digital connectivity, has led to underutilization of the oldest mode of transportation (Kamel, 2013). According to EnviroAtlas, in the U.S, three out of four people drive to work. In 2014, people spent 6.2 billion hours in traffic congestion at a cost of 3.1 billion gallons of fuel that equal to $160 billion (Agency, 2019).
A walkable city requires planning and execution of elements that influence its walkability. For instance, Rome was founded as far back as 753 B.C.E. The infrastructure of the street design was made up of meandering roads that are still considered to be some of the most walkable roads ever designed (Van, 2016). The successful walkability of Rome goes back to its original planning of the city. Urban designers can learn from Rome by understanding that creating walkable areas requires exploring all the parameters, including but not limited to geophysical and historical factors, that could be relevant to walkability in that area (Van, 2016).
There are many factors that impact the walkability of a space and many models, frameworks, tools and methodologies that are deployed to assess the overall walkability. Developed by Reid and Handy, one of the key factors impacting the overall walkability of a space is Human Scale and refers to the scale of physical elements such as trees, street furniture, building details and pavement textures (Ewing et al., 2006). According to Reid and Handy, Human Scale is the most important factor in determining overall walkability (Ewing and Handy, 2009).
In the GCC, the walkability ratings are typically quite low (Pedestrians First, 2022). The high summer temperatures in the GCC, in addition to the changes in urban design to prioritize the usage of automobiles on the street, has contributed to the reduced overall walkability (Pedestrians First, 2022). This has consequentially led to an increase in the obesity index across the GCC countries. According to the World Health Organization’s study on obesity, four GCC countries are included in the top 30. Kuwait, Qatar, KSA, and UAE at numbers 15, 16, 17, and 26 respectively (Obse and rvatory, 2016).
The majority of privately developed walkable outdoor areas in Dubai are low-rise developments with a maximum height of four stories. These areas are for mixed use and include commercial and retail stores but have different design philosophies. “City Walk,” for example, is a low-rise, mixed-use area, that offers a variety of functions such as a university, a cinema, restaurants and retail stores. In this paper, we will employ a walkability field manual developed by Ewing and Handy to objectively measure the relevant urban design factors for selected areas to be used for comparative analysis. This study aims to assess which urban design factors are important predictors of overall perceived walkability of Al-Seef, City Walk, and Box Park and to establish this framework.
2 Literature review
There are four main approaches to analyzing and assessing walkability, each offering distinct methodologies and focus areas: Web-based tools, such as ‘Walkshed,’ ‘Walkonomics,’ or ‘Walk Score,’ provide a quantitative evaluation of walkability based on macro-scale factors (Blečić et al., 2015). Multi-criteria evaluation models integrate multiple spatial and non-spatial factors to provide a more comprehensive analysis of walkability (Jabbari et al., 2018). Audit tools are structured assessment frameworks used to evaluate the micro-scale features of urban environments that influence pedestrian experience (Cliftona et al., 2007). Questionnaires and surveys capture pedestrians’ subjective experiences, preferences, and perceptions regarding walkability. Unlike Web-based tools, Multi-criteria evaluation models and Audit tools that rely primarily on spatial data and physical measurements, surveys allow researchers to understand how individuals interact with and interpret their surroundings (Rosenberg et al., 2019). The physical assessment was based on the evaluation of the conditions in the three selected sites of the study. The physical data were collected in each site concerning the urban factors related to walkability, specifically guided by Ewing and Handy’s framework. This framework identifies five key urban design qualities that influence walkability: imageability, enclosure, human scale, transparency, and complexity. These factors collectively shape how pedestrians perceive and interact with urban spaces, affecting both the attractiveness and functionality of walkable environments (Ewing and Handy, 2006). This assessment is aiming to understand the unique urban context of each area and systematically evaluate them using the criteria outlined in Ewing and Handy’s template. By applying this structured approach, the study was able to objectively measure the presence and quality of walkability-supportive elements in each site, providing a clear basis for comparison and further analysis.
The factors used in the assessment methodologies differ depending on the walkability framework employed. Reid and Handy analyzed a list of urban design qualities based on the available literature. They extracted eight factors that are associated with walkability including: Imageability, visual Enclosure, legibility, Human Scale, linkage, Complexity, Transparency, and coherence. After statistically comparing inter-rater reliability between experts and laypersons, completing a correlation analysis, and a multi-variable regression analysis, five of these urban design factors were found to be statistically significant predictors of walkability. The model including the five factors could explain >95% of the variation in walkability: Imageability, Enclosure, Human Scale, Transparency, and Complexity (Ewing et al., 2006).
Zuniga Teran et al. conducted a multi-objective study centered on enhancing walkability. Their first objective was to develop a walkability framework (WF) derived from a comprehensive literature review, which they then used to propose modifications to the LEED-ND (Leadership in Energy and Environmental Design for Neighborhood Development) guidelines to address existing weaknesses and gaps related to walkability. The WF comprises nine categories which are connectivity, land use, density, traffic, safety, surveillance, parking, experience, greenspace, and community. They confirmed that the WF could be effectively used to assess the relationship between walkability and other relevant variables (Teran and Alejandra, 2015). Their findings indicated that traditional neighborhood designs are the most walkable, and they observed a strong correlation between increased greenspace use and higher walkability levels (Teran and Alejandra, 2015). They also analyzed the correlation between walking for transportation and walking for recreation to finding significant correlations with both (Teran and Alejandra, 2015). The authors proposed an enhanced version of the LEED-ND guidelines, now strengthened with the WF they developed to better support walkability (Teran and Alejandra, 2015).
Sdoukopoulos et al. discuss how a walkability audit tool can be utilized to evaluate, monitor, and enhance walking conditions in urban areas. The paper uses the city center of Serres, Greece, as a case study, providing insights into effective methods for improving walkability in this area (Sdoukopoulosa et al., 2017). The methodology begins with the development of a walkability audit tool derived from the literature, incorporating factors and parameters that impact pedestrians’ walking experience. Data collected through the audit tool are consolidated, followed by statistical analysis (Sdoukopoulosa et al., 2017). The study concludes that, while the city center of Serres has generally good walking conditions, targeted improvements are necessary to enhance the environmental experience for pedestrians and ensure accessibility for all pedestrian types (Sdoukopoulosa et al., 2017). Additionally, Sdoukopoulos et al.'s paper provides valuable insights into how a framework can be “localized” to an area. However, the specific parameters used may not be entirely applicable due to contextual differences. For example, factors such as illegal car parking are not relevant for assessing walkability in Dubai and, therefore, should not be included as factors to consider. Additionally, the parameters are more appropriate for evaluating a traditional city neighborhood rather than a low-rise, mixed-use development typical of Dubai.
Chiara Garau et al. developed a methodological framework that will aid in the urban planning process by making it possible to identify the key conditions that restrict walking behaviors and by pointing out potentially highly effective physical environment interventions that will improve inclusivity and usability (Garau et al., 2020). The literature review conducted led to creation of a Walkability Assessment Tool (WAT) that was utilized to study the pedestrian routes across the historic districts of Iglesias, Sardinia, Italy. The WAT developed relied on the assessment of four categories: (a) Functional Affordances (b) Accessibility (c) Emotional Affordances (d) Social Affordances (Garau et al., 2020). The walkability analysis of Iglesias’ historic district revealed diverse walkability levels, with an average index indicating fair usability across spaces (Garau et al., 2020). The focus on a specific case study in Iglesias, Sardinia, may limit the generalizability of findings to other urban contexts. This should be noted in most “localized” walkability assessment tools.
Mohamed Kamel examines the overlooked role of walkability in Gulf Cooperation Council (GCC) cities, attributing this neglect to residents’ heavy reliance on automobiles. He identifies key urban challenges that hinder pedestrian movement and proposes smart urban solutions to promote walking in these regions (Kamel, 2013). For empirical analysis, he selects King Abdullah National Park in Dammam, Saudi Arabia, as a pilot case study. To assess walkability, Kamel adapts Llewelyn Davies’ “Five Cs” framework: Connectivity, Convenience, Comfortableness, Conspicuousness, and Coexistence to align with the specific planning needs of the GCC (Kamel, 2013). Kamel’s findings highlight key barriers to walkability in GCC cities, including extreme weather, poor maintenance, inadequate facilities, and low environmental awareness. Young people show the most support for smart urban solutions, emphasizing their role in innovation and long-term urban sustainability (Kamel, 2013). Smart urban solutions can enhance outdoor spaces and sustainability, and future strategies should integrate community engagement and capacity-building programs to support their implementation (Kamel, 2013).
Nassima Mouada et al. highlighted the importance of the relationship between urban morphology and walking behavior of three different neighborhoods that are the old, modern and the extension part of Sidi Okba in Algeria (Nassima et al., 2019). The methodology of the study was based on a physical analysis, a walking audit tool and a questionnaire survey. The study concludes that urban morphology significantly influences microclimate and outdoor thermal comfort across the three neighborhoods. Results show considerable variation in microclimate, driven by factors such as building density, height-to-width (H/W) ratio, and vegetation levels (Nassima et al., 2019). Furthermore, the authors recommended to increase shaded spaces in Sidi Okba by enhancing both building density and vegetation (Nassima et al., 2019). To promote walking as a primary mode of travel over short distances in hot, dry climates, the authors recommend design guidelines that support outdoor thermal comfort, diversity, density, connectivity, Enclosure, human speed, and Human Scale to enhance pedestrian flow in public spaces (Nassima et al., 2019). Mouada’s research specifically focuses on pedestrian behaviour in hot, dry climates, making it particularly relevant to Dubai’s urban conditions. Since my study does not account for thermal comfort or solar radiation, aspects of Mouada’s work related to microclimate and outdoor thermal conditions are less applicable.
Bereitschaft examines walkability in six Pittsburgh streetscapes using a qualitative framework based on urban design factors identified by Reid and Handy, including Imageability, Enclosure, Human Scale, Transparency, Complexity, Tidiness, Safety, and Sensations. Conducting a walking survey of each neighborhood’s main commercial corridor, the study finds significant micro-scale disparities in the built environment, maintenance, and pedestrian activity between disadvantaged and affluent areas (Bereitschaft, 2017). It also highlights the limitations of macro-scale metrics like Walk Score in capturing these differences. Aligning with Neckerman et al., the study shows that disadvantaged neighborhoods often lack the aesthetic appeal, safety, and pedestrian amenities found in wealthier areas (Neckerman et al., 2009). To enhance walkability and equity, Bereitschaft advocates for design guidelines addressing streetscape gaps, promoting infill development, and fostering safer, more engaging public spaces. However, while revitalization efforts can improve walkability, they also pose risks of gentrification and displacement. To mitigate these effects, the study recommends measures such as inclusive housing policies and community-engaged planning (Bereitschaft, 2017).
Ivan Blečić, et al. grouped features of urban environment that affect walkability into four “family” categories based on the literature review. These effectively sum up the majority of environmental factors that are considered in walkability evaluation methods (Blečić et al., 2020). The established families of factors are not mutually exclusive because they include various but related characteristics that are important to the evaluation of pedestrian accessibility (Blečić et al., 2020). Blečić et al. introduce a framework (or “taxonomy”) for comparing walkability evaluation approaches. The framework is meant to help organize existing research on walkability while highlighting key requirements for a decision-support tool that could aid urban planning and design (Blečić et al., 2020). These requirements consist of multidimensionality, usability, adaptability, and practical application are crucial for making walkability a meaningful part of urban design, especially when considering sustainability and the relationship between people and their surroundings (Blečić et al., 2020). Ivan Blečić et al. acknowledge some limitations. First, since different methods define and measure walkability in different ways, it is hard to directly compare them. As a result, this paper evaluates each model based on how well it meets the identified decision-support criteria rather than its specific results. Another challenge is that some methods rely on data that is not always accessible, which can make it difficult to fully understand or verify the tools. The authors encourage researchers to make their data and methods more open to address this issue.
Zabanoot et al. assess walkability in Dubai’s developments, focusing on physical connections within and between them. The study examines three key factors: Design (a well-connected road network), Destination Accessibility (ease of reaching various destinations), and Diversity (a mix of land uses, including residential, commercial, and office spaces) (Zabanoot and Bleibleh, 2019). Using firsthand observations, images, and site visits, the research finds that while City Walk and Downtown Dubai are walkable internally, there is a lack of infrastructure supporting walkability between them, despite their proximity of less than 1.5 km (Zabanoot and Bleibleh, 2019). However, the study does not apply a formal walkability assessment tool or present quantifiable data.
Singh explores how the built environment influences walking behavior by analyzing site conditions and their impact on pedestrians. The study employs an observational site analysis, and a questionnaire conducted in Mehrauli, New Delhi, incorporating urban design factors derived from existing literature (Singh, 2016). Rather than relying on a single walkability framework, Singh integrates multiple sources to assess walkability through images and pedestrian feedback. The findings highlight that the built environment along streets significantly shapes pedestrians’ perception of walkability, with factors like enclosure, block length, and edge conditions playing key roles (Singh, 2016). While the study provides valuable insights into how different streetscapes affect walkability, it lacks a meta-analysis of the framework’s effectiveness, making it difficult to determine the relative influence of each factor on overall walkability.
Recent literature has explored the dynamic relationships between accessibility and interaction, as well as spatial configuration and behavioral patterns, reflecting a shift from functionalism to behavioral studies to spatial interaction perspectives (Wang et al., 2025).
Fonseca et al.’s study highlights the evolution of urban planning from car-centric designs to a growing interest in pedestrian-friendly, sustainable transport systems. It underscores the historical preference for automobile infrastructure, challenges of urban sprawl, and limited political and financial support for pedestrian initiatives, which have led to the de-prioritization of walking in urban planning (Fonseca et al., 2022). The study emphasizes that understanding pedestrian needs and the impact of the built environment on walking behaviour is essential for creating more walkable cities (Fonseca et al., 2022). Through the analysis of perceptions from 1,438 residents in Bologna and Porto, this study identifies key walkability factors such as: Urban Ambiance, Pedestrian Infrastructure, Connectivity and Community Facilities and Access to Other Transport Modes. The author’s findings reveal that multiple streetscapes and built environment attributes are closely linked to walkability, suggesting that planners should avoid a “siloed” approach (Fonseca et al., 2022). Instead, a more integrated approach to walkability would be more effective in creating cohesive policies and evaluation methods that enhance urban livability (Fonseca et al., 2022). The study’s context focuses on European cities (Bologna and Porto), which may have different urban layouts, and cultural factors compared to Dubai. This difference could limit the direct applicability of some findings. Additionally, the study’s integration of public transport modes may be less relevant if my study is more focused on walkability within specific, pedestrian-only zones.
3 Methodology
This study aims to evaluate the factors that significantly influence walkability in Dubai by incorporating insights from existing literature, which underscore the importance of a multidimensional, localized approach that integrates well-defined objective factors with subjective elements such as perceived safety, comfort, aesthetic appeal, perceived accessibility and personal enjoyment or emotional response to the environment. Traditional macro-scale walkability measures such as walk score or GIS-based models focusing on proximity to amenities, intersection density, and land use diversity which are often fail to capture the micro-scale variations and contextual influences that shape pedestrian experiences in specific urban environments. Recognizing this limitation, we adapted Ewing and Handy’s walkability framework into a physical assessment of walkability across three distinct locations in Dubai: City Walk, Box Park, and Al Seef. The assessment structured around Ewing and Handy’s five core factors are Imageability, Enclosure, Human Scale, Transparency, and Complexity which together account for 95% of the variation in overall walkability.
3.1 Urban design factors in Ewing and Handy’s framework
Imageability in urban design refers to how easily a space or building can be recognized and remembered (Ewing, 2013). Highly imageable spaces stand out due to their unique features, helping create a strong sense of identity and place. This makes areas more inviting and encourages people to explore on foot. However, if a space is overly distinctive or complex, it can become overwhelming, potentially reducing walkability (Ewing and Clemente, 2000).
Enclosure refers to how clearly a space is defined by physical elements like walls, buildings, or natural features (Ewing, 2013). High enclosure creates a well-defined space that can enhance comfort and security, encouraging walkability. However, if a space is too enclosed, it may feel cramped and uninviting, potentially discouraging pedestrian movement (Ewing and Clemente, 2000).
Human Scale ensures that buildings and spaces are designed in proportion to the human body, making them more comfortable and inviting for pedestrians (Ewing, 2013). When streets, sidewalks, and structures are appropriately scaled, people feel safer and more encouraged to walk, enhancing community vitality. However, if the scale is too large or too small such as towering buildings or narrow sidewalks it can feel overwhelming or unwelcoming, reducing walkability (Ewing and Clemente, 2000).
Transparency refers to how much visibility and openness a building or space provides, creating a visual connection between interiors and exteriors or public and private areas (Ewing, 2013). High transparency fosters engagement, making spaces feel more inviting and encouraging walkability. However, excessive transparency can lead to discomfort if it exposes private areas or makes people feel unsafe (Ewing and Clemente, 2000).
Complexity refers to the level of visual interest in a space, created through patterns, textures, shapes, and colors (Ewing, 2013). A well-balanced level of complexity makes spaces feel vibrant and engaging, encouraging people to walk and explore. However, excessive complexity can be overwhelming or disorienting, potentially reducing walkability (Ewing and Clemente, 2000).
The score of each urban design factors is calculated using the equation below:
3.2 Site selection and physical analysis
To evaluate the walkability of Al Seef, City Walk, and Box Park, we utilized Ewing and Handy’s walkability field manual, a comprehensive framework that assesses five key urban design qualities: Imageability, Enclosure, Human Scale, Transparency, and Complexity. These three selected sites represent different layouts of low-rise community in Dubai. These sites have variety of urban context which has a direct impact on the walkability and to sustain the connectivity within the selected areas. The paper assesses these different urban contexts and provide an interpretation to the results of these assessments. The selected are shown in Table 1.
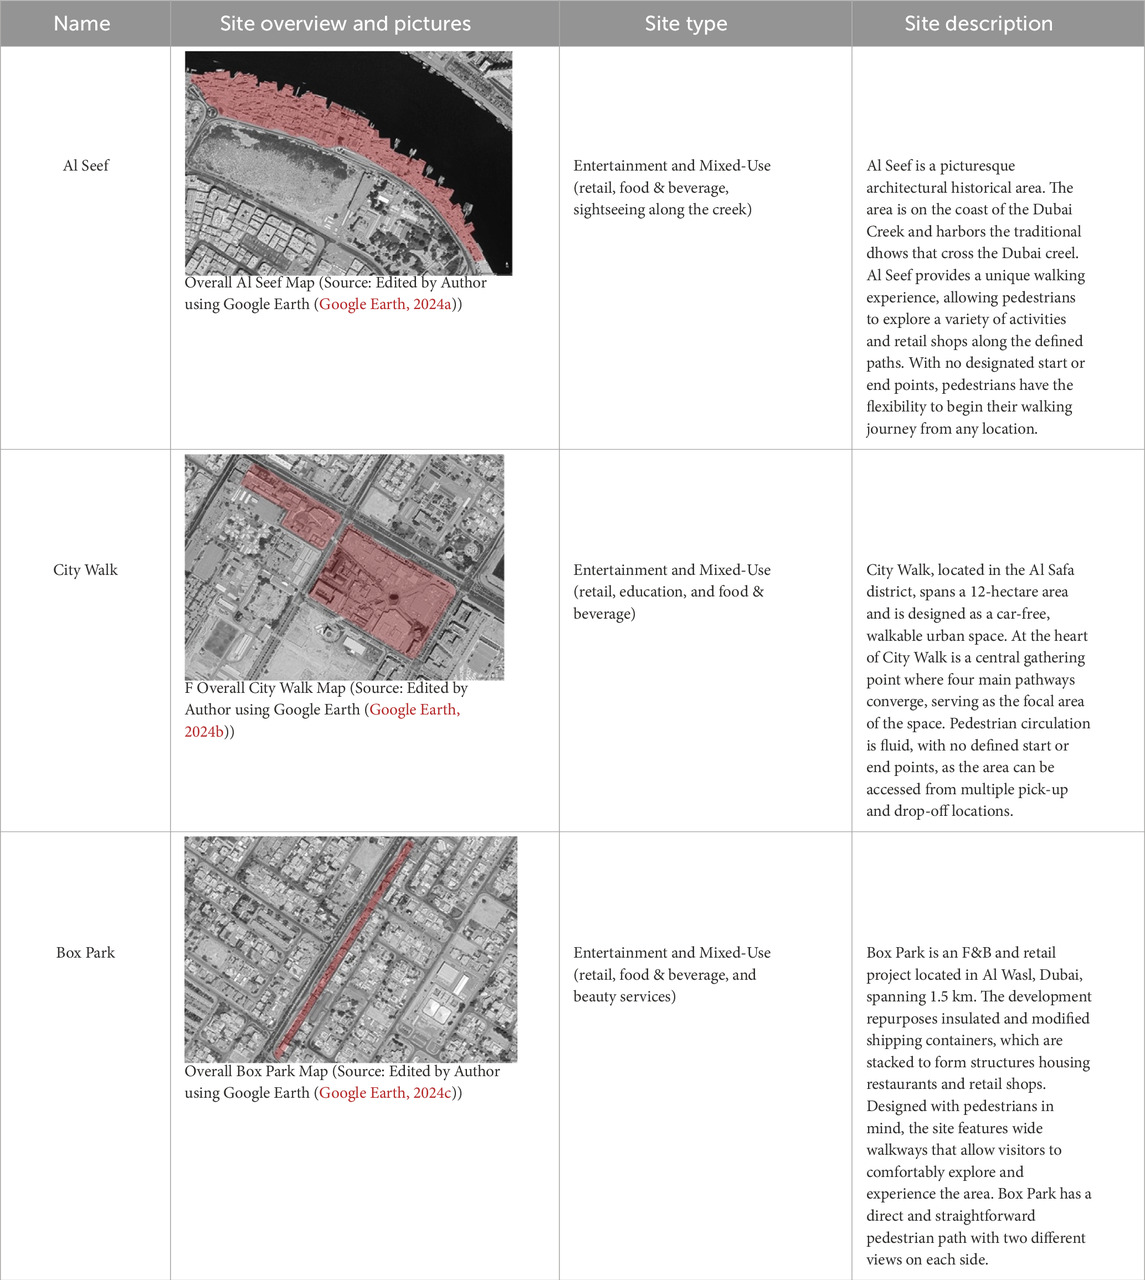
Table 1. Site analysis.
This framework focuses on specific physical and design features that shape pedestrian experiences, allowing for a structured analysis of each site. The field manual breaks down each of the five walkability factors into sub-factors that offer a detailed basis for evaluation. For instance, Imageability includes sub-factors such as the presence of landmarks, public art, landscaping, and building façade variety that contribute to a visually engaging environment. By systematically applying the field manual, the assessment captures how each site performs for these individual factors. This structured approach not only ensures consistency across the three sites but also highlights the specific urban design elements that contribute to or detract from the pedestrian experience at each location. The field assessment thus provides a detailed, comparative analysis of walkability across Al Seef, City Walk, and Box Park, offering valuable insights into their unique strengths and areas for improvement.
To conduct the assessment, a site visit was made to each location in the month of February due to its favorable weather conditions, which enhance walkability during this time of year. However, the focus of the assessment is limited to urban design factors, excluding climatic influences on walkability. Where the study area was defined as a 300-foot section of the busiest or most important street or area of each site. This approach ensured that the evaluation focused on the spaces most frequented by pedestrians and representative of each location’s urban design qualities. Two investigators completed the field guide independently at each site to minimize bias and reduce error in the assessment process.
The purpose of this assessment was not to determine overall walkability for each site but rather to conduct a comparative analysis of how each site scores across the five individual walkability factors. This approach offers valuable insights into the strengths and weaknesses of each location in terms of pedestrian-friendly urban design, highlighting variations that can inform targeted improvements. The following subchapter presents an overview of the results from the physical analysis conducted for each site.
4 Results
A comparative analysis of the three selected sites in Dubai; Al Seef, City Walk, and Box Park were carried out to evaluate their physical analysis scores based on the five urban design factors outlined in Ewing and Handy’s framework.
4.1 Imageability
In terms of Imageability, Al Seef scores the highest due to its rich variety of plazas, landscape features, traditional and fhistoric building frontage, non-rectangular building shapes, and the significant number of visitors as seen in Figures 1A,B. Both Al Seef and City Walk have a comparable score regarding the presence of courtyards and plazas, which are notably absent in Box Park. This is due to Box Park’s design as a long, straight, walkable road, which does not accommodate plazas or courtyards effectively. City Walk, however, scores higher than Al Seef and Box Park in terms of number of identifiers, largely due to the numerous restaurant and shop signs on each building as seen in Figure 1C. While Al Seef ranks highest overall in Imageability, Box Park scores higher for outdoor dining areas as shown in Table 2, which are present at almost every restaurant within the study area as seen in Figure 1D. Please refer to Supplementary Appendix A for the full assessment results. Notably, Box Park scores zero for courtyards, landscape features, and historic buildings. It also has the lowest score in terms of visitor numbers, with fewer people frequenting it compared to Al Seef and City Walk.
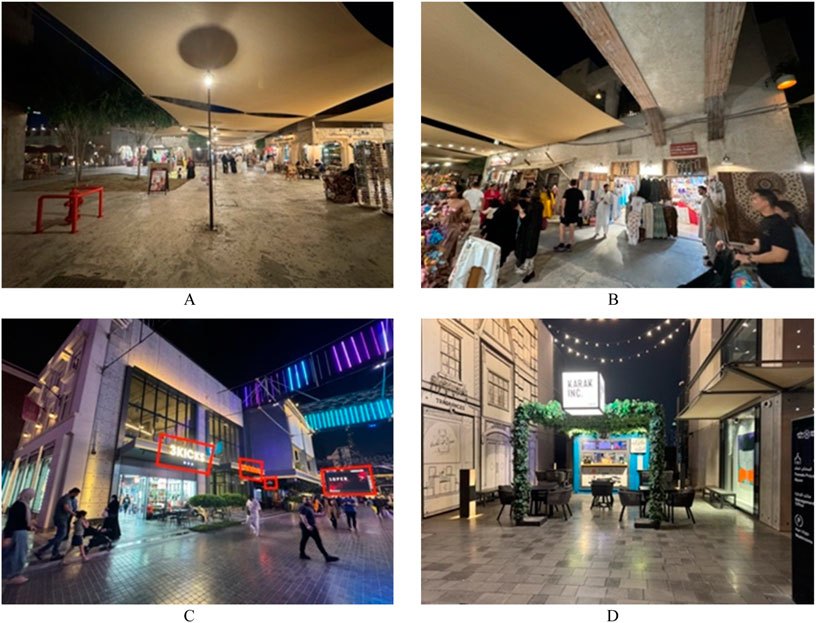
Figure 1. Imageability analysis (Source: Author). (A) Courtyard in Study Area, Al Seef, Dubai. (B) Significant Number of visitors, Al Seef. (C) Buildings with Identifiers, City Walk, Dubai. (D) Restaurant with Outdoor Dining, Box Park, Dubai.
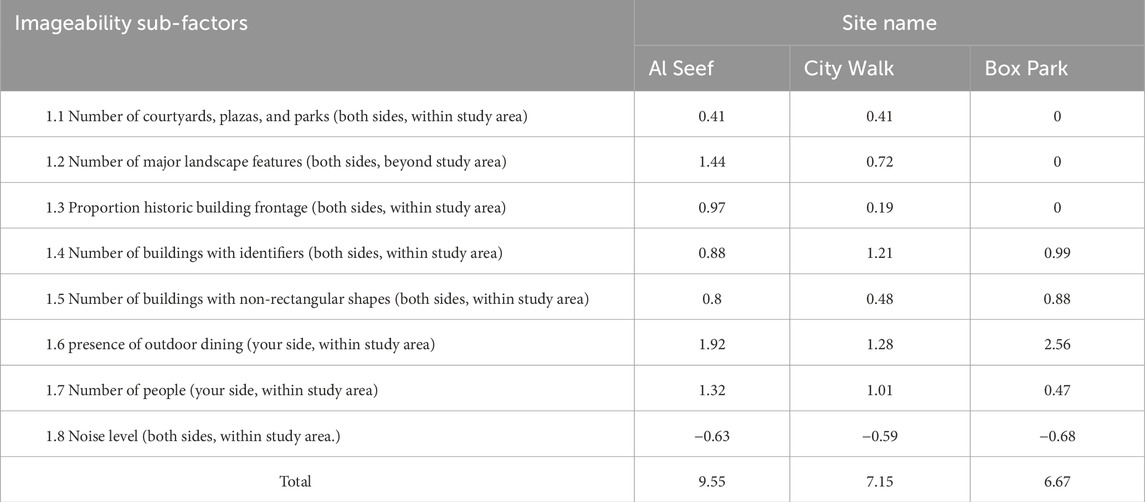
Table 2. A summary of imageability’s sub-factors scores and the overall score of imageability for each site (Source: Author).
4.2 Enclosure
When it comes to Enclosure, City Walk scores the highest as shown in Table 3, due to its limited long sight lines and minimal sky visibility. Please refer to Supplementary Appendix A for the full assessment results. The absence of distant neighborhood views (across and ahead) and the substantial building coverage of the sky (across) contribute to this effect, making City Walk well-defined by vertical elements as seen in Figures 2A,B. Box Park, in contrast, has the lowest Enclosure score as its open layout allows for greater sky visibility both ahead and across, resulting in a less defined, more open environment as seen in Figure 2C. The street wall proportions (opposite side) for both City Walk and Box Park are similar, as both feature continuous façades along the streetscape, enhancing its Enclosure. However, Al Seef scores slightly lower in this regard, as it has fewer continuous facades, creating a less enclosed feel compared to City Walk as seen in Figure 2D.
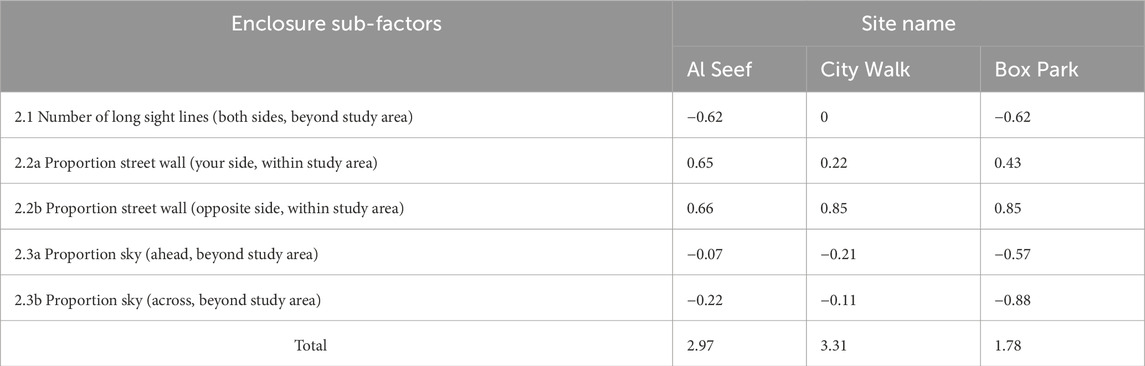
Table 3. A summary of enclosure’s sub-factors scores and the overall score of enclosure for each site (Source: Author).
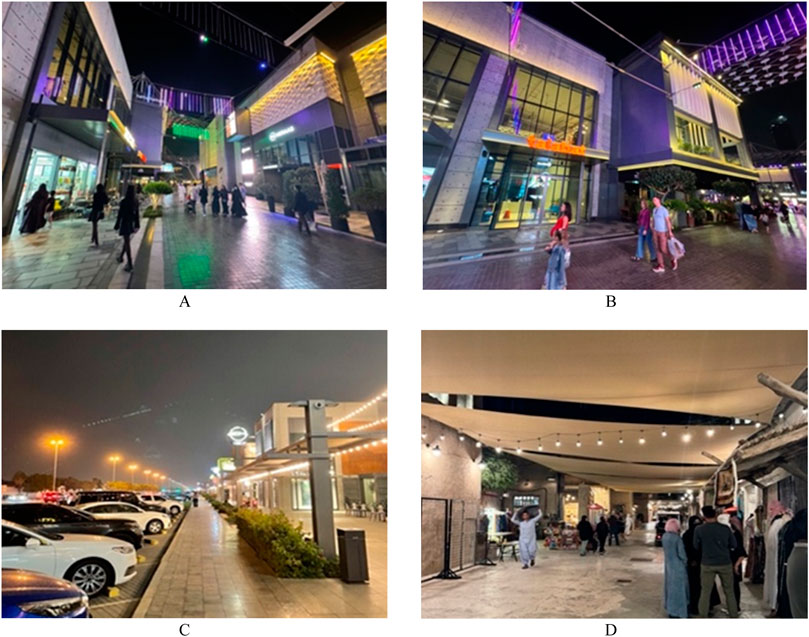
Figure 2. Enclosure analysis (Source: Author). (A) Minimal Sky Visibility, City Walk, Dubai. (B) Limited Long Sight Line, City Walk, Dubai. (C) Less Defined Environment with major sky visibility, City Walk, Dubai. (D) Setback in buildings created fewer continuous facades, Al Seef, Dubai.
4.3 Human scale
Box Park has the highest score in terms of Human Scale, with the lowest average building height among the three sites. It also has the highest number of small planters, that serve as a physical component to Human Scale and makes the space more proportionate to the human body as seen in Table 4 and Figure 3A. Please refer to Supplementary Appendix A for the full assessment results. Moreover, the proportion of windows at street level in box park is high as there are various windows all around the study area making the building seem less of a rigid façade as seen in Figure 3B. On the other hand, Al Seef scores the lowest in Human Scale, as it has less windows at street level and a limited number of small planters. Moreover, while Al Seef and Box Park allow for long sight lines with visible surrounding neighborhoods, City Walk has no visible sight lines all throughout the study area which according to the field manual is a positive factor for Human Scale as shown in Figure 3C. In terms of street furniture, City Walk and Box Park have similar counts, whereas Al Seef has much more street furniture present all around the study area that is considered an important element for the physical component of Human Scale as seen in Figure 3D.
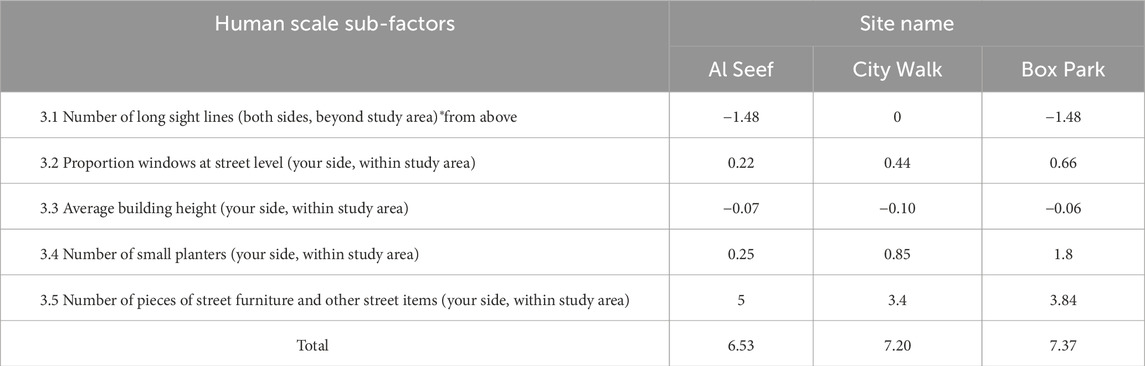
Table 4. summary of human scale’s sub-factors scores and the overall score of human scale for each site (Source: Author).
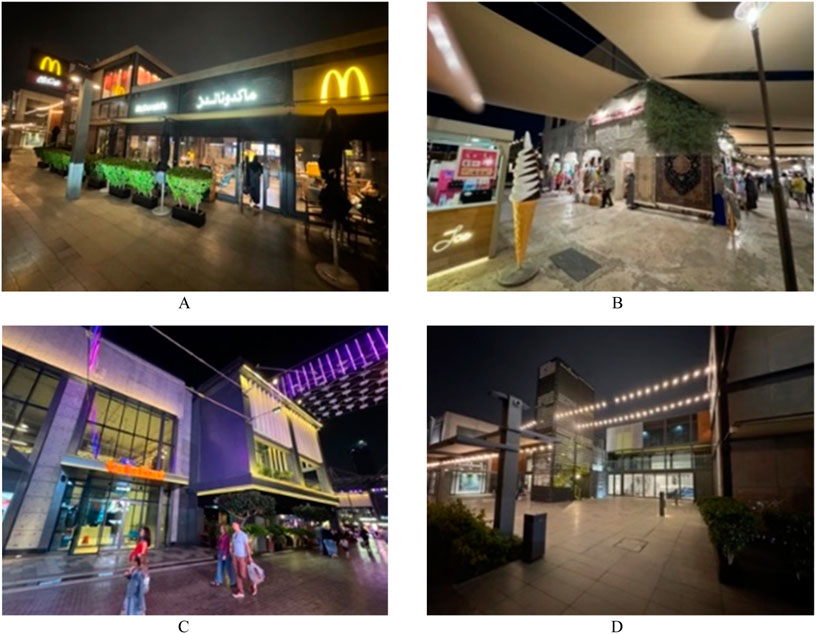
Figure 3. Human scale analysis (Source: Author). (A) Small Planters by the side of a Restaurant, Box Park, Dubai. (B) Street Furniture Such as Ice Cream Cone and Carpets Displayed Outside Retails Shops and Cafes, Al Seef, Dubai. (C) No visible sight lines, City Walk, Dubai. (D) Large Windows at Street Level in Study Area, Box Park, Dubai.
4.4 Transparency
Box Park has the highest score in Transparency, as indicated in Table 5, the proportion of windows at street level is higher compared to Al Seef and City Walk. All the buildings in Box Park have full glass facades on the first floor, making them more visible and open to the public as seen in Figure 4A. Please refer to Supplementary Appendix A for the full assessment results. Furthermore, the proportion of street wall is highest in Al Seef, as the walkways in this area are lined with continuous building facades or walls as shown in Figure 4B. Additionally, City Walk and Box Park scored similarly in terms of the proportion of active uses, as nearly every building houses a retail or restaurant space accessible to visitors as seen in Figure 4C. City Walk scored the lowest overall in Enclosure due to its fewer street-level windows and a lower proportion of street wall. This is attributed to the layout and design of the buildings, as well as the presence of outdoor dining areas situated in front of the buildings as seen in Figure 4D.
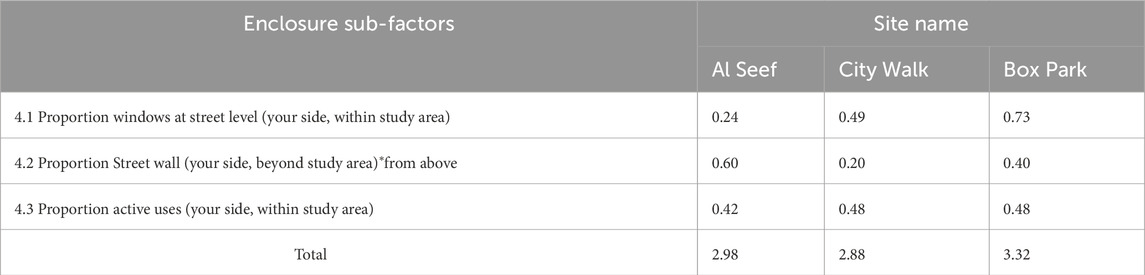
Table 5. Summary of transparency’s sub-factors scores and the overall score of transparency for each site (Source: Author).
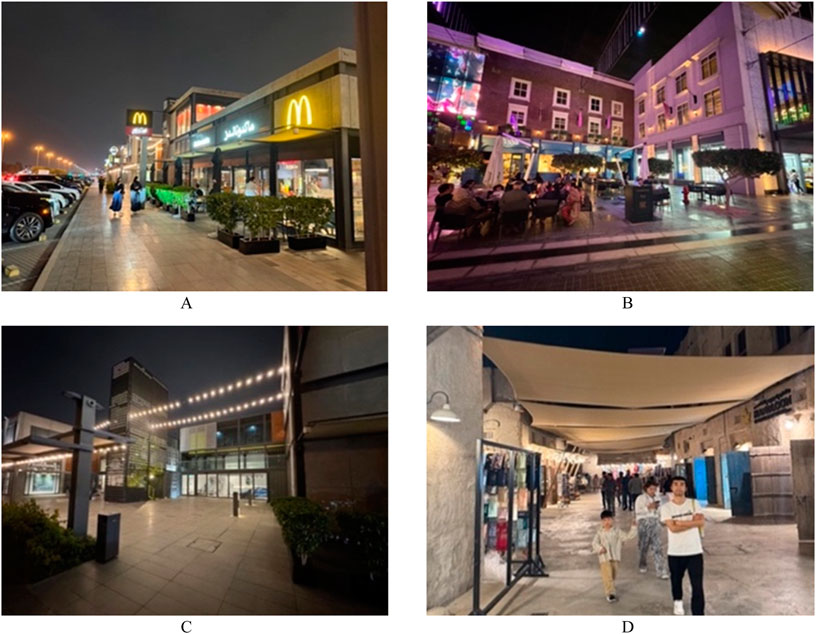
Figure 4. Transparency analysis (Source: Author). (A) Full Glass Facades at Street Level in Study Area, Box Park, Dubai. (B) Setback on the Street Wall due to outdoor dining, City Walk, Dubai. (C) Building with Restaurant, Box Park, Dubai. (D) Continuous Street Wall that fronts along the sidewalk, Al Seef, Dubai.
4.5 Complexity
City Walk scores the highest in overall Complexity as shown in Table 6, due to its high values in most sub-factors. Please refer to Supplementary Appendix A for the full assessment results. It has the greatest variety of basic building and accent colors, as well as the most public art displayed throughout the study area compared to Al Seef and Box Park as seen in Figure 5A. City Walk also has the largest number of walking pedestrians, indicating the highest visitor count among the three sites as seen in Figure 5B. On the other hand, Box Park has the highest number of buildings with a clear boundary and outline that is visible with the design and finishing of each building as seen in Figure 5C. City Walk and Box Park share the same score for the presence of outdoor dining spaces, both of which exceed the number found in Al Seef. Al Seef has the lowest overall Complexity score due to a lower number of buildings, less variety in building and accent colors, and fewer outdoor dining areas as seen in Figure 5D.
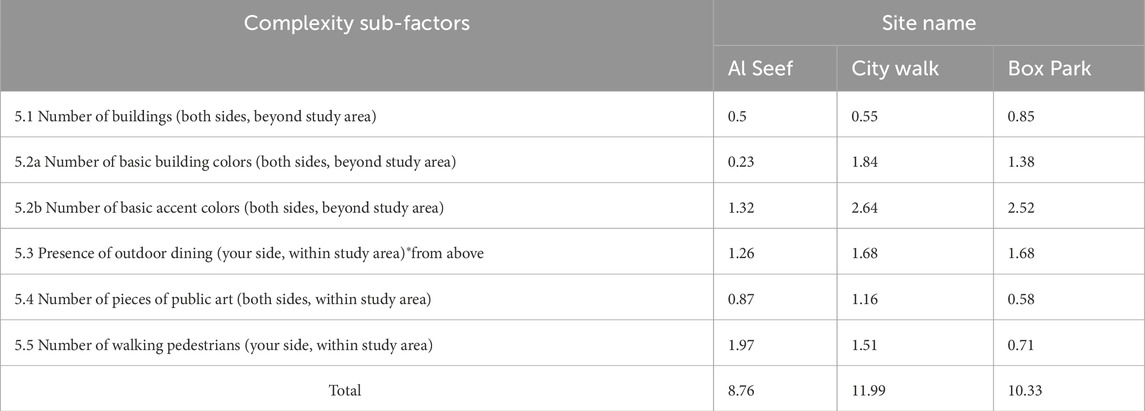
Table 6. Summary of complexity’s sub-factors scores and the overall score of complexity for each site (Source: Author).
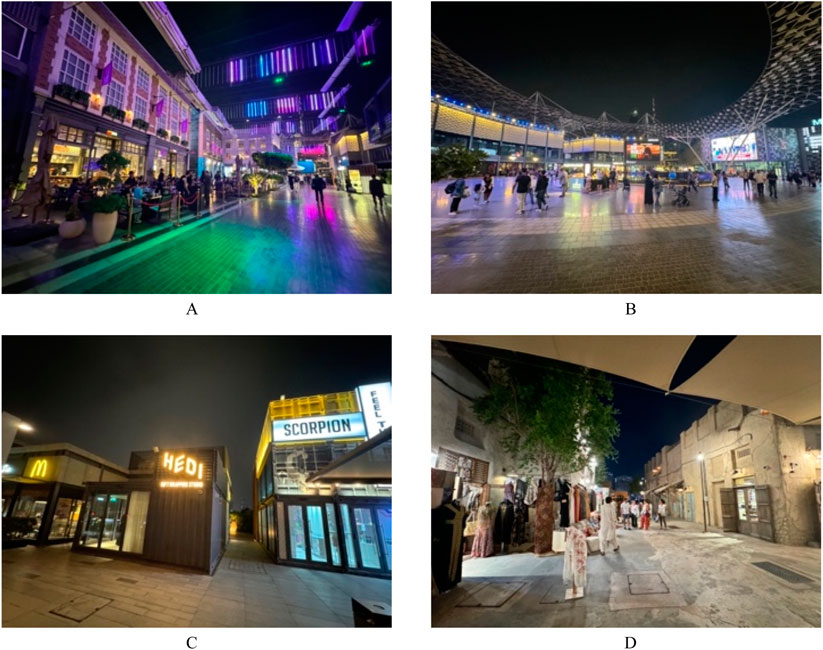
Figure 5. Complexity analysis (Source: Author). (A) Variety of Modern and Classic Building Cladding and Surrounding Accent Colors, City Walk, Dubai. (B) Pedestrian crowd in Study Area, City Walk, Dubai. (C) Buildings with a Clear Boundary and Outline, Box Park, Dubai. (D) Constant Color Palette of the Buildings and Surrounding Accent Colors, Al Seef, Dubai.
5 Discussion
While Ewing and Handy’s framework was developed in a North American context, its foundational principles are sufficiently universal, adaptable, and methodologically rigorous to justify its application to Dubai. By tailoring specific indicators to reflect the climatic, cultural, and spatial conditions of the city, the model becomes a powerful tool to support Dubai’s transition toward a more walkable, livable urban form. Dubai aims to be a global city, and its planning goals often involve benchmarking against international best practices. Using a globally recognized model like Ewing and Handy’s will help to position Dubai within a global urbanism status and facilitates comparative research with cities that have similar frameworks in order to obtain a potential improvement.
Dubai’s urban landscape is dynamic, characterized by rapid development and an increasing emphasis on sustainability and livability (e.g., Dubai 2040 Urban Master Plan). The city lacks such a well-established walkability evaluation model. Ewing and Handy’s framework provide a tested, structured approach that enables comparison, benchmarking, and identification of spatial gaps, which is particularly useful in Dubai city where walkability is still emerging as a planning priority.
Traditional approaches to assessing walkability have primarily focused on the physical environment, examining factors such as sidewalk quality, street connectivity, and proximity to amenities (Boukrouh and Bouchair, 2024). However, recent studies emphasize the importance of incorporating users’ perceptions and experiences to gain a more comprehensive understanding of walkability (Boukrouh and Bouchair, 2024). These recent emphases support the paper’s adaptation of Ewing and Handy’s walkability framework into a physical assessment applied to the three selected distinct study locations in Dubai.
City Walk exhibits the greatest variation in Complexity, scoring the highest among the three sites with a value of 11.99, while Al Seef and Box Park follow with scores of approximately 8.76 and 10.33, respectively (Figure 6; Table 7). This indicates that City Walk provides a more visually and experientially diverse pedestrian environment. In contrast, Transparency is the lowest-rated factor across all locations. Each site registers its lowest score in Transparency, with values ranging from 2.98 to 3.32, suggesting a limited visual connection between indoor and outdoor spaces, which may negatively impact perceived walkability.
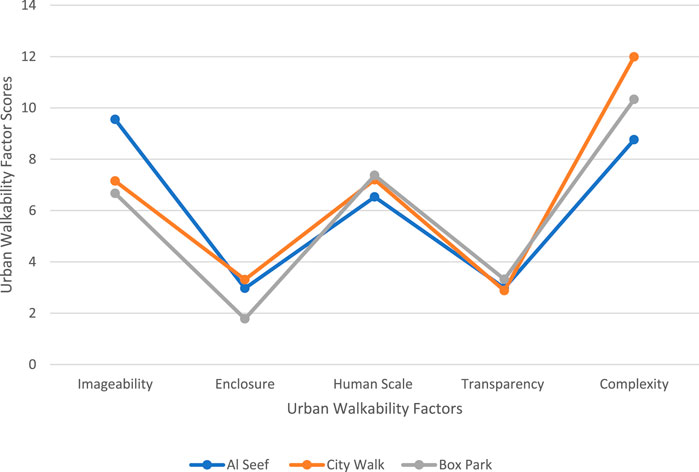
Figure 6. The graphs of the five urban factors in walkability in the three selected sites in Dubai city (Source: Author).
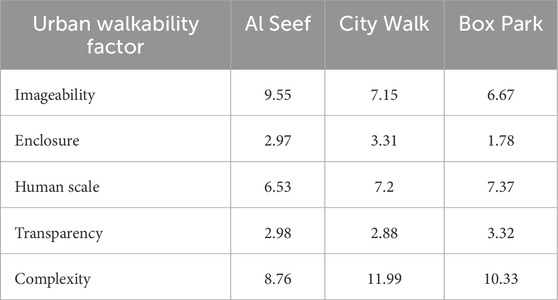
Table 7. Summary of the five urban factors in walkability and the overall score in each selected site (Source: Author).
The Human Scale factor shows relatively consistent scores across all three sites, ranging from 6.53 to 7.37, indicating that building proportions and street elements are generally pedestrian-friendly. Enclosure emerges as the weakest factor overall. All locations score low in this category, with Box Park recording the lowest value at 1.78. These low scores imply a lack of spatial definition or continuity, which may diminish pedestrian comfort.
As shown in Figure 6 and Table 7, Al Seef stands out in terms of Imageability, achieving the highest score of approximately 9.5. This suggests a strong visual identity, potentially attributed to unique architectural elements or cultural features. City Walk, while not leading in every individual factor, demonstrates the most balanced performance that is scoring above average in four out of five categories, with a notable peak in Complexity. This overall consistency indicates that City Walk may provide the most comprehensive and well-rounded walkable experience among the three sites and a complex walkable environment, offering a modern and engaging pedestrian experience.
A summary of the analysis, highlighting the top-performing site for each of the five urban design factors, are presented in Table 8. According to the table interpretation, Imageability is most prominent in Al Seef, reflecting its traditional character and waterfront setting. Enclosure and Complexity are most evident in City Walk, indicating well-defined pedestrian spaces and a vibrant, dynamic urban environment. Meanwhile, Box Park demonstrates the strongest performance in Human Scale and Transparency, highlighting its pedestrian-friendly design and the highest level of façade openness and street-level interaction. These findings are illustrated in the graph in Figure 6.
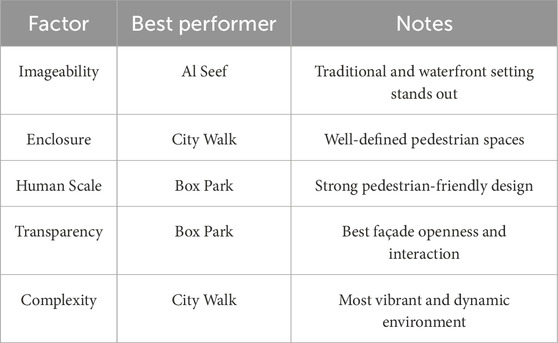
Table 8. Overall comparative insights of urban factors performance in the three selected sites.
6 Conclusion
The Built Environment Analysis, conducted using Ewing and Handy’s field guide for the three selected sites in the study, provided objective evidence on which walkability sub-factors positively contributed to the five key urban design factors and, consequently, to overall walkability. For instance, Al Seef scored the highest in Imageability due to its diverse plazas, landscape features, historic and traditional building context, a non-rectangular building shapes, and high visitor numbers. City Walk achieved the highest score in Enclosure, attributed to its limited long sight lines and minimal sky visibility. Box Park ranked highest in Human Scale, benefiting from its lower building heights, numerous small planters that enhance spatial proportion, and a high proportion of street-level windows, which reduce façade rigidity. Additionally, Box Park also led in Transparency, as it had a greater proportion of street-level windows compared to Al Seef and City Walk, with all buildings featuring full-glass facades on the first floor, increasing visibility and openness. In contrast, City Walk had the highest overall Complexity score, excelling in most sub-factors. It exhibited the greatest variety of basic and accent building colors and displayed the most public art throughout the study area compared to Al Seef and Box Park. These findings provide valuable insights for future urban design and improvement strategies for low-rise areas in Dubai.
These findings have important implications for the future of urban development and planning policy in Dubai and other rapidly urbanizing cities with similar spatial typologies. The consistent significance of Complexity across all three study sites indicates that visual and sensory richness should be a guiding principle in the design of pedestrian environments. This suggests that planning regulations and urban design guidelines could be revised to encourage architectural variation, public art integration, and a richer palette of materials and facade treatments. Design codes might also include requirements or incentives for activating street-level spaces through diverse storefronts, transparent facades, and interactive streetscape elements such as seating, landscaping, or public installations. The high predictive strength of Enclosure, particularly in City Walk and Box Park, further reinforces the value of designing clearly defined spatial environments. These results imply that height-to-width ratios, street wall continuity, and the integration of vertical elements such as trees or arcades should be considered critical components of walkability-enhancing policy. For example, zoning codes might adopt minimum enclosure ratios in pedestrian-priority zones, or urban design frameworks could require continuous street edges in commercial corridors.
Data availability statement
The raw data supporting the conclusions of this article will be made available by the authors, without undue reservation.
Ethics statement
The studies involving humans were approved by Ajman University Research Ethic Committee. The studies were conducted in accordance with the local legislation and institutional requirements. The participants provided their written informed consent to participate in this study. Written informed consent was not obtained from the individual(s) for the publication of any potentially identifiable images or data included in this article because The photos were taken in public areas and not focused on the individuals.
Author contributions
MA: Conceptualization, Formal Analysis, Methodology, Supervision, Writing – original draft, Writing – review and editing. KK: Conceptualization, Data curation, Formal Analysis, Investigation, Methodology, Visualization, Writing – original draft, Writing – review and editing.
Funding
The author(s) declare that no financial support was received for the research and/or publication of this article.
Acknowledgments
The authors would like to express their gratitude to Ajman University for APC support and the Healthy and Sustainable Built Environment Research Center at Ajman University for providing an excellent research environment.
Conflict of interest
The authors declare that the research was conducted in the absence of any commercial or financial relationships that could be construed as a potential conflict of interest.
Generative AI statement
The author(s) declare that no Generative AI was used in the creation of this manuscript.
Publisher’s note
All claims expressed in this article are solely those of the authors and do not necessarily represent those of their affiliated organizations, or those of the publisher, the editors and the reviewers. Any product that may be evaluated in this article, or claim that may be made by its manufacturer, is not guaranteed or endorsed by the publisher.
Supplementary material
The Supplementary Material for this article can be found online at: https://www.frontiersin.org/articles/10.3389/fbuil.2025.1631826/full#supplementary-material
References
Agency, U. E. P. (2019). Percent of workers who bike or walk to work. Available online at: www.epa.gov/enviroatlas (Accessed 16 June 2024).
Amoruso, G. (2016). Handbook of research on visual computing and emerging geometrical design tools, Italy.
Bereitschaft, B. (2017). Equity in microscale urban design and walkability: a photographic survey of six Pittsburgh streetscapes. Sustainability 9 (7), 1233. doi:10.3390/su9071233
Blečić, I., Cecchini, A., Congiu, T., Giovanna, F., and Trunfio, G. (2015). Evaluating walkability: a capability-wise planning and design support system. Int. J. Geogr. Inf. Sci. 29 (8), 1350–1374. doi:10.1080/13658816.2015.1026824
Blečić, I. C. T., Fancello, G., and Trunfio, G. A. (2020). Planning and design support tools for walkability: a guide for urban analysts. Sustainability 12 (11), 4405. doi:10.3390/su12114405
Boukrouh, N., and Bouchair, A. (2024). Urban Walkability assessment, a double examination by physical environment and user's perceptions: the case of Jijel City in Algeria. Front. Archit. Res. 9 (92), 92. doi:10.1007/s41024-024-00434-2
Clemente, O., Ewing, R., Handy, S., and Brownson, R. (2005). Measuring urban design qualities — an illustrated field manual. Princeton, NJ: Robert Wood Johnson Foundation.
Cliftona, K. J., Smith, A. D., and Rodriguez, D. (2007). The development and testing of an audit for the pedestrian environment. Landsc. Urban Plan. 80 (1-2), 95–110. doi:10.1016/j.landurbplan.2006.06.008
Ewing, R. (2013). “Eight qualities of pedestrian-and transit-oriented design,” in Urban land: the magazine of the urban land institute.
Ewing, R., and Clemente, O. (2000). Measuring urban design: metrics for livable places. Washington: Island Press.
Ewing, R., and Handy, S. (2006). Measuring urban design qualities an illustrated field manual. Active Living Research. Princeton, NJ: Robert Wood Johnson Foundation.
Ewing, R., and Handy, S. (2009). Measuring the unmeasurable: urban design qualities related to walkability. J. Urban Des. 14 (1), 65–84. doi:10.1080/13574800802451155
Ewing, R., Handy, S., Brownson, R. C., Clemente, O., and Winston, E. (2006). Identifying and measuring urban design qualities related to walkability. Phys. Activity Health 3 (1), 223–240. doi:10.1123/jpah.3.s1.s223
Flockhart, T., Reiter, A., and Hassett, M. (2022). The reproduction and maintenance of inequalities in interpersonal relationships, USA.
Fonseca, F., Papageorgiou, G., Tondelli, S., Ribeiro, P., Conticelli, E., Jabbari, M., et al. (2022). Perceived walkability and respective urban determinants: insights from Bologna and Porto. Sustainability 14, 9089. doi:10.3390/su14159089
Garau, C., Annunziata, A., and Yamu, C. (2020). A walkability assessment tool coupling multicriteria analysis and space syntax: the case study of Iglesias, Italy. Eur. Plan. Stud. 32 (2), 211–233. doi:10.1080/09654313.2020.1761947
Google Earth (2024a). Google Earth, Al Seef area. Available online at: http://earth.google.com/web/ (Accessed 27 February 2024).
Google Earth (2024b). Google Earth, City Walk area. Available online at: http://earth.google.com/web/ (Accessed 27 February 2024).
Google Earth (2024c). Google Earth, Box Park area. Available online at: http://earth.google.com/web/ (Accessed 27 February 2024).
Jabbari, M., Fonseca, F., and Ramos, R. (2018). Combining multi-criteria and space syntax analysis to assess a pedestrian network: the case of oporto. J. Urban Des. 23 (1), 23–41. doi:10.1080/13574809.2017.1343087
Kamel, M. A. E. (2013). Encouraging walkability in GCC cities: smart urban solutions. Emerald Insight 2 (3), 288–310. doi:10.1108/SASBE-03-2013-0015
Nassima, M., Zemmouri, N., and Meziani, R. (2019). Urban morphology, outdoor thermal comfort and walkability in hot, dry cities: case study in Sidi Okba, Algeria. Int. Rev. Spatial Plan. Sustain. Dev. A Plan. Strategies Des. 7 (1), 117–133. doi:10.14246/irspsda.7.1_117
Neckerman, K. M., Lovasi, G., Davies, S., Purciel-Hill, M., Quinn, J., Feder, E., et al. (2009). Disparities in urban neighborhood conditions: evidence from GIS measures and field observation in New York city. Public Health Policy 30 (1), 264–285. doi:10.1057/jphp.2008.47
New Urban News (2004). The New urbanism: an alternative to modern, automobile oriented planning and development. New Urban News. Available online at: http://www.newurbannews.com/AboutNewUrbanism.htm (Accessed 24 September 2024).
Observatory, G. O. (2016). World Obesity. Available online at: https://data.worldobesity.org/rankings/ (Accessed 10 October 2022).
Pedestrians First (2022). Pedestrians first. Available online at: https://pedestriansfirst.itdp.org/city-tool/step-6 (Accessed 10 October 2022).
Peter Newman, J. K. (2005). Urban design to reduce automobile dependence. UC Riverside II (1), 35–52. Available online at: https://escholarship.org/uc/item/2b76f089#author
Refaat, M., and Kafafy, N. (2014). Approaches and lessons for enhancing walkability in cities: a landscape conceptual solution for Talaat Harb Street, Cairo. Int. J. Educ. Res. 2 (6), 301–322. Available online at: https://www.ijern.com/journal/June-2014/24.pdf
Rosenberg, D., Ding, D., Sallis, J. F., Kerr, J., Norman, G. J., Durant, N., et al. (2019). Neighborhood environment walkability scale for youth (NEWS-Y): reliability and relationship with physical activity. Prev. Med. 49 (2-3), 213–218. doi:10.1016/j.ypmed.2009.07.011
Sdoukopoulosa, A., Verania, E., Nikolaidoua, A., Tsakalidisa, A., Gavanasa, N., Pitsiava-Latinopouloua, M., et al. (2017). Development and implementation of walkability audits in Greek medium-sized cities: the case of the Serres’ city centre. Transp. Res. Procedia 24, 337–344. doi:10.1016/j.trpro.2017.05.102
Singh, R. (2016). Factors affecting walkability of neighborhoods. Procedia - Soc. Behav. Sci. 216, 643–654. doi:10.1016/j.sbspro.2015.12.048
Teran, Z., and Alejandra, A. (2015). From neighborhoods to wellbeing and conservation: enhancing the use of greenspace through walkability. Arizona: The University of Arizona.
Van, A. (2016). Enviroment and soceity spring 2017. Available online at: https://geog3443001.wordpress.com/2016/10/15/a-brief-history-of-walkability/ (Accessed 10 October 2022).
Wang, X., Li, Y. M. W., Yuan, L., Ren, Q., Xie, Q., and Liu, R. (2025). Natural movement: measuring optimal pathway configuration of museum layout and pedestrian accessibility through visibility graph analysis and intelligent agent simulation. doi:10.1016/j.foar.2025.03.001
Keywords: walkability, urban design factors, imageability, enclosure, human scale, transparency, complexity, pedestrians
Citation: Arar M and Kazaz K (2025) Assessing urban design factors for walkable areas: evidence from Dubai. Front. Built Environ. 11:1631826. doi: 10.3389/fbuil.2025.1631826
Received: 20 May 2025; Accepted: 08 July 2025;
Published: 28 July 2025.
Edited by:
Mohamed H. Elnabawi Mahgoub, United Arab Emirates University, United Arab EmiratesReviewed by:
Shahira AbdelRazek, Delta University for Science and Technology, EgyptNaima Boukrouh, 8 May 1945 University of Guelma, Algeria
Ammar Bouchair, Universite Mohammed Seddik Benyahia Jijel Laboratoire Cadre Bati et Environnement, Algeria
Dyah Titisari Widyastuti, Gadjah Mada University, Indonesia
Copyright © 2025 Arar and Kazaz. This is an open-access article distributed under the terms of the Creative Commons Attribution License (CC BY). The use, distribution or reproduction in other forums is permitted, provided the original author(s) and the copyright owner(s) are credited and that the original publication in this journal is cited, in accordance with accepted academic practice. No use, distribution or reproduction is permitted which does not comply with these terms.
*Correspondence: Mohammad Arar, bS5hcmFyQGFqbWFuLmFjLmFl