 Maurizio Calandri1*
 Louis Tafelmaier1
 Torben Rathje1Michael Müller1Tobias Henzler1Konstantinos Stergiaropoulos1Michael Kramp2
 Andreas Glatz3
- 1Institute for Building Energetics, Thermotechnology and Energy Storage (IGTE), University of Stuttgart, Stuttgart, Baden-Württemberg, Germany
- 2aedifion GmbH, Cologne, North Rhine-Westphalia, Germany
- 3Ed. Züblin AG, Stuttgart, Baden-Württemberg, Germany
Insufficient data availability, limited calculation tools and subjective decisions by experts lead to ambiguous results when determining the Smart Readiness Indicator of a building. Moreover, it is not an integral part of the planning process. Therefore, this study presents a consistent and process-oriented planning and calculation approach. The methodology consists of the combination and exchange of information between building information modeling, labeling system, and data exchange format. It provides a consistent, seamless flow of information throughout integrated planning. This enables an automatic calculation of the planned Smart Readiness Indicator based on a floor-related functionality assessment, as proved using a mock-up. In addition, it provides a clear categorization of the necessary information for the planned components, which can be used for the verification process. Overall, this leads to a significant reduction in the time and effort required for smart building assessments while also increasing their consistency of evaluation.
1 Introduction
1.1 Smart Readiness Indicator–general
In 2018, the European Energy Performance of Buildings Directive (EPBD) (European Parliament, 2018) introduced a Smart Readiness Indicator (SRI) to assess the ability of buildings to adapt to the needs of their occupants, optimize in-use performance and to respond to signals from the grid. According to EPBD 2018 (European Parliament, 2018), the policies of the digital Single European Market and the Energy Union will be harmonized to pursue common energy efficiency objectives. The SRI represents the objectives of intelligent building control, provides a reference for building automation and promotes comparability. In addition, it creates incentives for building owners to use smart building technologies and to advance Building Automation and Control Systems (BACS).
Three SRI calculation methods (A, B, C) are presented, varying in complexity, time required, and scope. Method A, designated as the Simplified Method, is employed for residential buildings and enables a simple self-assessment by occupants within approximately 1 h. Method A covers 27 Smart Ready Services. Method B, called the Expert SRI Assessment, is more comprehensive and involves a detailed assessment, primarily for non-residential buildings. It covers 54 services and is expected to take between half a day and a full day to complete. Method C, In-Use Smart Building Performance, is the most detailed approach, but requires a longer assessment period. This approach has so far been proposed as a concept, in contrast to the previously implementable Methods A and B (Directorate General for Energy, European Commission and Vito, 2020).
The SRI score encompasses three key functionalities: optimize energy efficiency and in-use performance, adapt its operation to the needs of the occupant, and adapt to signals from the grid, also known as grid flexibility (see Figure 1).
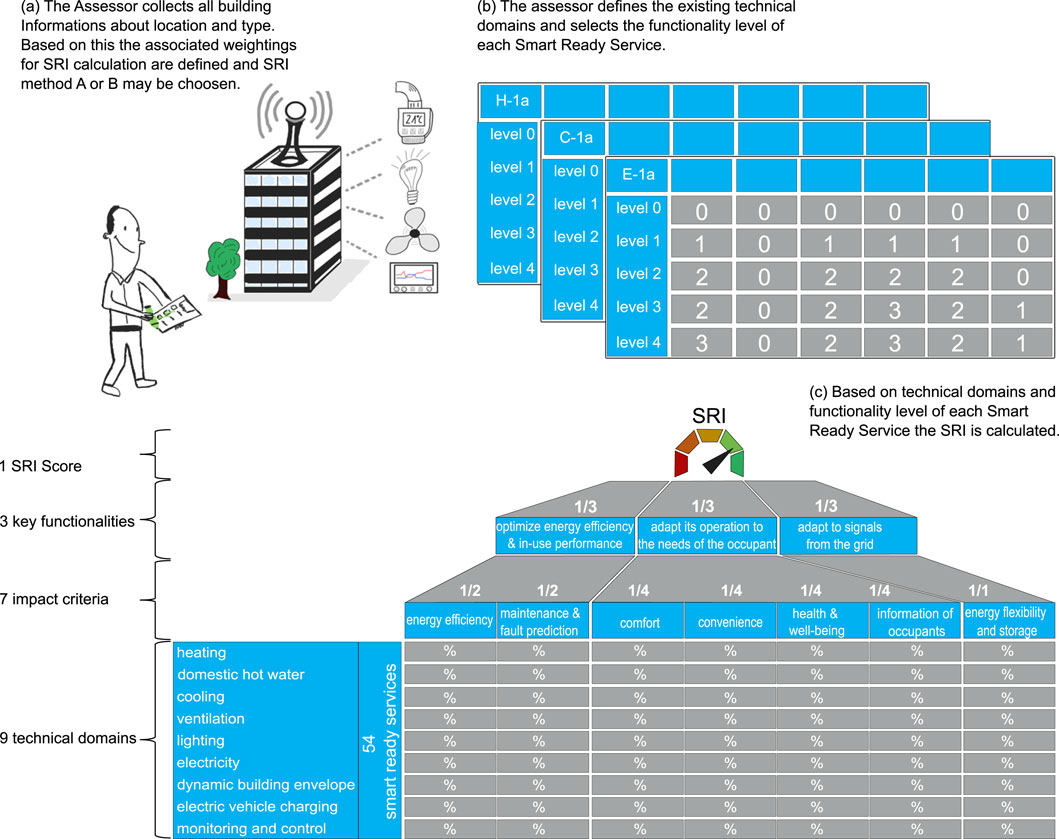
Figure 1. Method A and B, application of the SRI service catalog: (a) Determining the building type, location, and climate zone; (b) Definition of technical domains and functionality levels; (c) Calculation of the Smart Readiness Indicator (SRI).
These functionalities are further divided into seven impact criteria, which are also referred to as “Impact Scores of Smart Ready Services” (Directorate General for Energy, European Commission and Vito, 2020). The approach involves categorizing the impact of Smart Ready Services into different impact areas and weighting their influence appropriately. These seven impact criteria are then subdivided into energy efficiency, maintenance and fault prediction, comfort, convenience, health and wellbeing, information of occupants, and energy flexibility and storage. This detailed subcategorization covers nine technical domains within the SRI matrix: heating, domestic hot water, cooling, ventilation, lighting, electricity, dynamic building envelope, electric vehicle charging, and monitoring and control, as shown in Figure 1.
The present SRI assessment and the service catalogue provided by the EU do not contain an automated evaluation procedure for buildings. It is assumed that all necessary information and knowledge to assign the services is available and that the assessment is carried out by a qualified expert, see Figure 1. In a first step, the actual state of the building is analyzed by inspection and review of documents. This includes determining the building type, location, and climate zone, see Figure 1A. Depending on the existing components the technical domains are defined and the functionality level of each Smart Ready Service is selected, see Figure 1B. Based on this assignment, the SRI is calculated, see Figure 1C.
1.2 Smart Readiness Indicator–state of research
In literature, there are only a few studies that analyze the SRI in detail, in terms of the calculation methodology, the application to different case study buildings as well as the use of digital models. Janhunen et al. (2019) demonstrate that the basic SRI concept is not suitable for countries in cold climates. The investigation of the technological comparability of the service catalog for buildings in cold climates indicates that district heating, for example, has the highest negative impact on comparability, although it is an important element of the energy transition (Janhunen et al., 2019; Lund et al., 2014). In Vigna et al. (2020), two different groups of experts analyzed and evaluated a building. Due to the varying evaluation results, there is a significant scope of interpretation with regard to the definition for individual functionality levels. A lack of available data or insufficient definition of the functionality levels can lead to subjective decisions and ambiguous results. Therefore, guidelines for data collection and detailed requirements are needed. In Directorate General for Energy, European Commission and Vito (2020), it is mentioned that areas such as corridors, halls, etc. in a building might be equipped with less advanced technology than individual offices. Given a high proportion of circulation areas, this can have a significant influence on the SRI for the entire building. Boje et al. (2022) examined the potential of building data, in particular based on the Industry Foundation Class, to support assessors with relevant information about the building and its equipment. It was found that there are clear associations between the SRI and IFC domains, but also limitations such as insufficient depth of information regarding building services engineering (BSE) (Boje et al., 2022; Müller et al., 2021).
Other studies criticize the lack of a quantitative approach (Werner, 2017). In contrast to the Energy Performance Certificate (EPC) rating, which describes the performance of a building, the determination of the Smart Readiness Indicator focuses more on the identification of the existing devices (Directorate General for Energy, European Commission and Vito, 2020; Directorate-General for Energy, European Commission et al., 2020). This qualitative approach limits the possibility of taking smartness into account by means of performance-related and measurable indicators (e.g., Key Performance Indicators). For an assessment regarding the performance and control quality of buildings, the methodology of the Smart Readiness Indicator needs to be further developed using real-time data and benchmarks in operation to evaluate the functionalities. The implementation of Method C is considered in future research (Knotzer et al., 2020; European Parliament, 2018). Furthermore, an analysis of the services shows that lower functionality levels relate to hardware system options, while higher levels more likely indicate software-related capabilities. In addition, there are services that only relate to software installations, which requires additional metadata schemas for the assignment of functionalities (Markoska et al., 2019). Märzinger and Österreicher (2019) present a methodology based on a numerical, model-based approach that allows for a simplified quantitative assessment of SRI in terms of the load shifting potential of buildings and the subsequent active interaction of a building with the grid. Al Dakheel et al. (2020) define basic features and technologies as well as key performance indicators for smart buildings that can be considered for a quantitative approach. In addition to the application of the SRI method, Becchio et al. (2021) carried out a building performance simulation on a real estate in Turin to combine and compare the influence of individual measures on energy demand with the overall SRI assessment.
There are several digital tools (European Commission, 2023) available for determining the Smart Readiness Indicator or providing SRI-related services to improve building smartness. The U-CERT SRI Digital Tool transfers the official SRI assessment excel sheet to a cloud-based web environment, which simplifies the data input and visualization (Vladimir Litiu and Dirk de Wit, 2024). The IsZEB SRI Calculator (Zoi Boutopoulou, 2023) enables assessors to conduct SRI assessments. Users can easily enter the necessary input relating to the location, type and its technical systems. In addition, the tool suggests modernization measures for buildings using smart technologies. However, the use of building data models to assess the SRI of buildings is a complex process with several implementation options. In the EPC RECAST project, various software components were developed, such as a semantic ontology model, an IFC model extractor to populate the semantic model with instanced data, and a semantic triple store to identify relationships with the SRI domains that support SRI assessment with BIM models in IFC format (Greslou and Caccavelli, 2024).
1.3 Building information modeling–general
Building Information Modeling (BIM) has evolved from static, geometry-based design models to interactive environments that support dynamic decision-making through the automation of information exchange and optimization processes. Thus, according to (Isikdag, 2015), the current focus is on integration, interoperability and collaboration. This development has given rise to the concept of Active BIM: systems in which input parameters are embedded in the model and used as variables in optimization processes, integrating the results back into the BIM environment. Kang et al. (2013) and Obradović et al. (2019) define Active BIM as a digital workflow in which simulation, analysis and parametric optimization are integrated through semiautomated, bidirectional data flows between the model and external tools.
1.4 Building information modeling–state of research
A significant amount of research has been conducted into the use of Active BIM applications that apply optimization algorithms across different domains. In the field of construction logistics, scheduling and site planning, several approaches have been developed. For example, Irizarry and Karan (2012) demonstrated how the integration of BIM and GIS could optimize the location of tower cranes. Wang et al. (2014) used the firefly algorithm to optimize the number and placement of cranes, demonstrating that biologically inspired heuristics can outperform traditional deterministic approaches in complex construction environments. Marzouk and Abubakr (2016) advanced the field further by combining the Analytical Hierarchy Process (AHP) and Genetic Algorithms (GA) to optimize crane selection and placement. Moussavi Nadoushani et al. (2017) used Mixed-Integer Programming (MIP) to minimize material transport costs and crane rental fees.
Temporary facility layout planning has also been addressed with optimization techniques embedded in BIM workflows. Kumar and Cheng (2015) applied a Genetic Algorithm for temporary facility arrangements, and Kim et al. (2018) proposed a decision-support framework for scaffolding planning based on risk analysis and productivity metrics. Project scheduling and sequencing problems have also benefited from Active BIM techniques. Moon et al. (2015) minimized spatial interference using GA-based schedule optimization and Faghihi et al. (2014), Faghihi et al. (2016) explored algorithms to optimize schedules for cost, time and movement simultaneously. Zhuang et al. (2021) investigated structural design and cost minimization in reinforced concrete buildings.
In recent years, optimization-based Active BIM methods have increasingly been applied to building performance and energy-related aspects, such as Building Energy Modeling (BEM). For instance, a hybrid BIM-BEM framework was developed that embeds a multi-objective Jellyfish Search Optimization algorithm directly into Revit to reduce both energy consumption and installation costs (Luong et al., 2024). Similarly, multi-objective optimization frameworks employing genetic algorithms such as NSGA-II have been applied to balance energy demand and daylighting performance in early-stage design (Zhao et al., 2022). In addition, Ding et al. (2024) developed a BIM-based multi-objective optimization method for green building design in China. Coupling BIM with a genetic algorithm, they achieved a 10.46% reduction in lifecycle energy consumption while improving daylighting and comfort, underscoring the potential of Active BIM for performance-oriented design. Wu and Dai (2025) presents a BIM-based multi-objective optimization framework for green buildings, simultaneously addressing energy consumption, carbon emissions, hygrothermal behavior, and indoor comfort. The framework establishes a closed-loop optimization-verification process, validating results through BIM-based simulations and predicted mean vote (PMV) index calculations, thereby balancing energy efficiency and occupant comfort.
Building Automation Systems (BAS) are central to smart buildings, yet in BIM environments their representation is limited. IFC models components such as sensors and controllers, but lacks semantic depth for control strategies, sensor logic, and dynamic operation, restricting interoperability across the lifecycle (Vieira et al., 2020). Approaches such as the integration of BAS and IoT data into facility management BIM models (Quinn et al., 2020) illustrate the potential of enriching BIM with operational data. From an Active BIM perspective, BAS integration is essential for linking building services to optimization and compliance workflows, but fully automated BAS-to-BIM interoperability for regulatory assessment–such as SRI evaluation–remains unexplored.
1.5 Building information modeling–research gap
While these works have significantly advanced the integration of optimization into BIM, most of them focus primarily on geometric planning, construction logistics or energy optimization. Far fewer studies have investigated Active BIM applications in building automation, technical building services or performance monitoring. Di Biccari et al. (2022) emphasize that there is a present gap in the field of interoperability between BIM and BPS environments, especially in HVAC-related domains. They note that building automation scenarios often require additional model extensions, such as enriched IFC schemas or gbXML mappings, to accurately represent mechanical systems, occupancy schedules, control logic and energy behavior.
Studies such as Tang et al. (2019) and the extended discussion in Di Biccari et al. (2022) underline the importance of semantic labeling, standardized export formats (e.g., JSON, gbXML), and workflow automation (e.g., via Dynamo, Python) to enable BIM data exchange with BMS and IoT platforms. These works highlight that while some simulation tools may import BIM-based input, full bidirectional interoperability is often hindered by a lack of model view definitions (MVDs) that include automation-related properties such as zone-level control behavior, operating schedules or sensor mappings. At this point, a flexible data exchange format is needed that can be extended to accommodate evolving requirements.
Despite these recognized needs, there is little evidence of fully automated BIM workflows that integrate performance assessment metrics–such as the Smart Readiness Indicator (SRI) – into Active BIM-based optimization. No identified studies have explicitly addressed the integration of SRI into BIM workflows with floor-level resolution and automated, metadata-driven evaluation. The Energy Design Point of View by Di Biccari et al. (2022) is currently not systematically integrated into the planning process. Incorporating building performance as planning variable would allow energy-related data structures to be defined at an early stage.
In our previous study we introduced a BIM-based methodology for the systematic integration and model-based derivation of the SRI (Calandri et al., 2023). Our approach demonstrates how data points from components and systems can be embedded in a BIM environment using semantic labeling and enriched data structures. This work provides a basis for representing technical components and their data points within the building, and therefore enables requirements for Smart Ready Service and its functionality levels to be addressed.
1.6 SRI calculation using BIM–our approach
While previous Active BIM studies have demonstrated the potential to improve building performance through iterative, algorithm-driven optimization, they remain focused on performance-oriented trade-offs in the planning phase. In contrast, the present study introduces a compliance-oriented Active BIM methodology that integrates the Smart Readiness Indicator directly into the planning process. Instead of generating multiple parametric variants, our approach employs semantic metadata enrichment and a structured JSON-based data exchange to enable automated, floor-level SRI calculation. This represents a fundamental shift from performance optimization towards regulatory compliance automation, aligning Active BIM workflows with European policy requirements.
Building on these principles, we propose a BIM-integrated workflow for the automated, semantically structured evaluation of the SRI across different building zones. Whereas earlier work primarily addressed the integration of technical data points into BIM, our approach advances beyond data embedding by establishing a fully automated JSON-based data exchange framework combined with an evaluation-driven methodology. In doing so, it extends the scope from mere data integration to an end-to-end workflow for streamlined SRI calculation, verification, and integration into digital planning.
This requires a dedicated data exchange format for determining the floor-related Smart Readiness Indicator from a digital model, enabling a transparent, categorized, room-by-room representation of information. Such a format implements the EU qualitative approaches (Methods A and B) and also supports the quantitative approach (Method C) in the future by incorporating performance-related and measurable indicators. Moreover, it facilitates verification by assessors through standardized metadata labeling, automated data exchange, and reintegration of results into the BIM model.
In doing so, it extends Active BIM beyond traditional geometric optimization and scheduling problems into the domain of compliance-oriented smart building assessment, thereby contributing to the digital transformation of technical building services. In conclusion, this approach addresses the existing gap between BIM and BPS through planning process restructuring, contributing to process optimization “during the phase with the greatest influence on building performance” Di Biccari et al. (2022).
2 Methodology
Currently, the SRI is not part of the planning process for new and existing buildings. As shown in Figure 2, the indicator is determined by an assessor and therefore only represents a result and not an additional planning variable. We argue that the SRI should be established as an integral part of the planning process. This integration into a revised planning process is presented next.
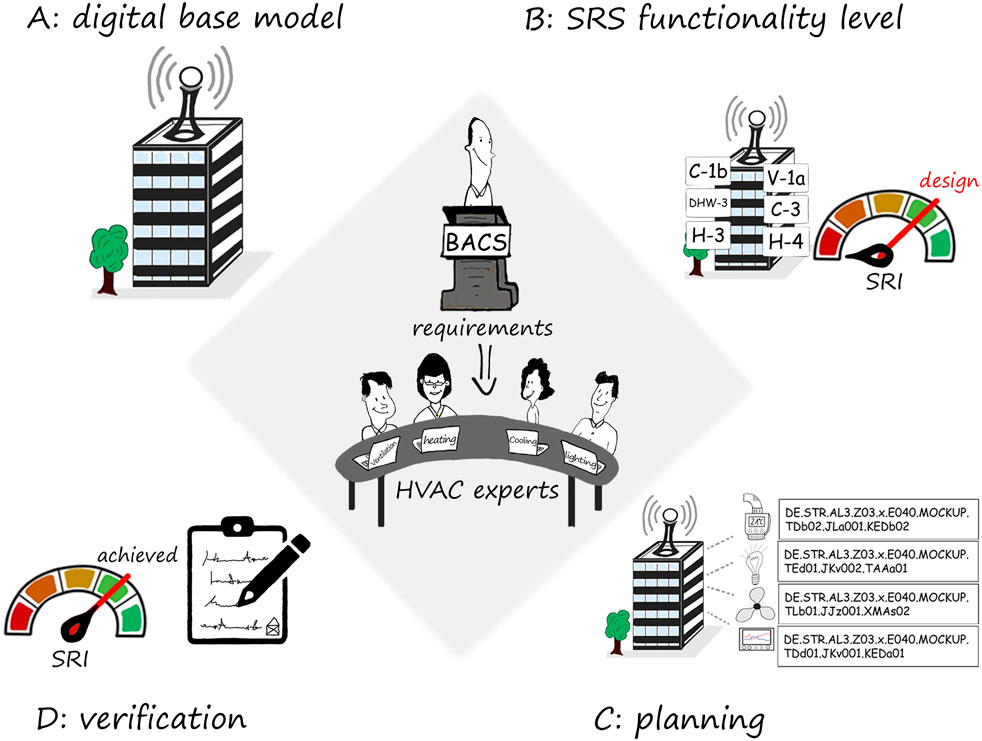
Figure 2. Integration of SRI into a planning process (A–C) and verification (D).
In the initial phase, a digital base model is generated (Figure 2A). In each life cycle phase of the building, all relevant building information from the respective cooperating partners is compiled in this base model by means of a consistent digital data gathering. This integral planning approach and the use of a digital base model offer a central, synchronized database that all partners involved in the construction process can access and cooperate with.
In the first planning phase (Figure 2B), the specialist planner for building automation and control systems (BACS) defines the functionality levels of the respective Smart Ready Services (SRS) for all domains, involving the client and the heating, ventilation and air conditioning (HVAC) experts. This ensures a consistently coherent cross-domain communication concept. The Smart Ready Services, including their functional descriptions, are assigned to the building, room or system. For the first time, this results in a floor-related design SRI which provides a reference for the further planning process.
In this way, the specialist planners and the planning team have defined specifications for each domain, including the functional descriptions, to ensure systematic planning and implementation of BACS. For each domain, technical components (Figure 2C) are selected to fulfill the Smart Ready Services and their respective functionality levels.
The integration of the SRS functionality level (B) on the basis of a design SRI, as well as the specification of the technical components and their data points (C) to fulfill the corresponding level, ensures a consistent, seamless flow of information within an integrated planning process. The mentioned planning process supports the provision of categorized information for transparent verification of the achieved SRI (Figure 2D).
The integration of the Smart Readiness Indicator as a design SRI at the beginning of a planning process enables the prior definition of requirements for BSE and BACS as reference for specialist planners. This planning process (A–C) and the verification (D) (see Figure 2) can be projected onto the following workflow levels: Subsection 2.1 Data Augmentation, Subsection 2.2 Data Transfer and Subsection 2.3 Data Assessment (see Figure 3).
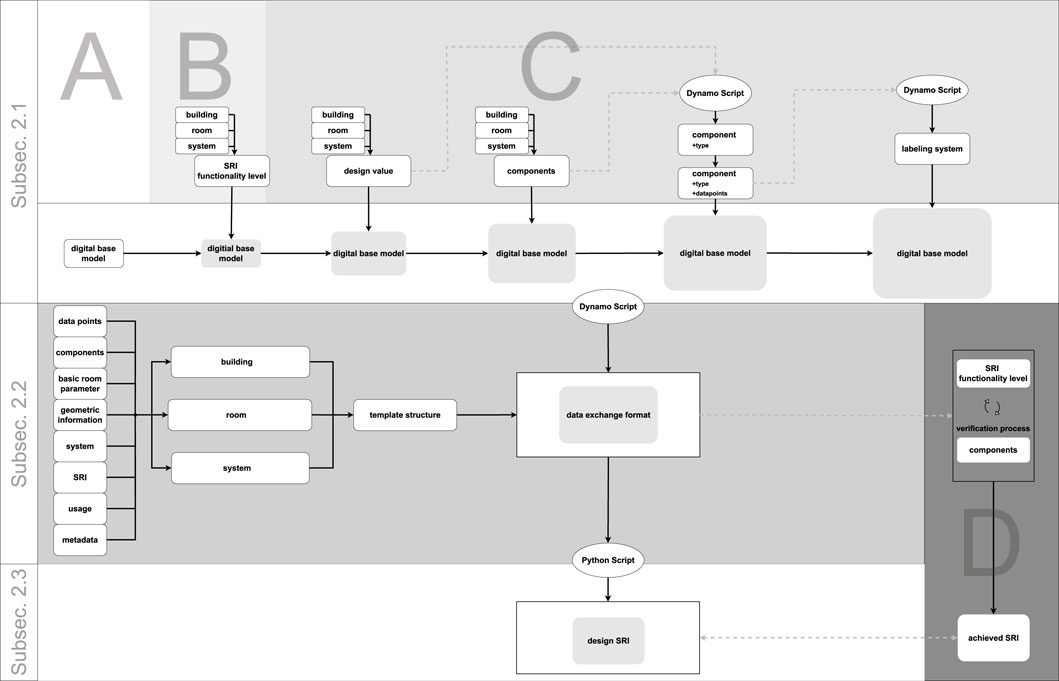
Figure 3. Projection of the planning process (A–C) and verification (D) to the workflow levels: Subsection 2.1 Data Augmentation, Subsection 2.2 Data Transfer and Subsection 2.3 Data Assessment.
In Subsection 2.1, the digital base model (A) is augmented with data up to a depth of information of BACS (B-C), describing the component type and its data points. The data from the augmented digital base model is passed to Subsection 2.2. Using a template structure (building, room, system), this data exchange format represents the information in a digital and categorized format. Based on this, a floor-related calculation of the SRI can be carried out in Subsection 2.3, taking into account the relations between the system and the rooms. Finally, the achieved SRI can be verified using the categorized information from the data exchange format.
2.1 Data augmentation
The digital base model is the starting point, in which simple geometric information (representation of rooms in terms of width, height and depth) is stored in a BIM-capable 3D CAD application (here Revit). Data are added in the course of the data augmentation in different phases of the planning process, while Excel templates serve as a library for the selected data. They are categorized in SRS functionality level, design value, component, component types, data points and labeling system. The merged flows of information in the digital base model ensure a level of detail in digital data exchange not achieved before.
Integrating the SRI into digital building models, the EU-defined service catalogue needs to be detailed and restructured. In this context, the previous structure is split into the three categories building, room and system automation. The assignment of the corresponding SRS is shown in Supplementary Tables A1–A3. In this way, templates can be provided for individual rooms, systems and the building (see Figure 4).
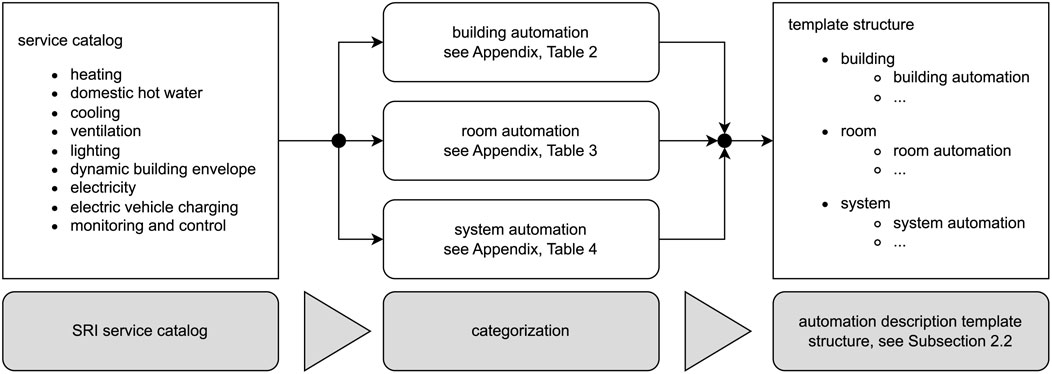
Figure 4. Structure of the automation template in three categories.
In the first step, the SRI is defined as design value (design SRI) for the planning process. This enables the specialist planners to access the SRI functionality level descriptions and to define components in the planning software (here: Revit). This accelerates standardized digital data exchange and enables new approaches regarding the planning sequence in a building.
Analogous to the previous step, further planning information is classified in the template structure defined in Figure 4 and set as design value. The further parameters include, for example, control and operating parameters, which are assigned to specific rooms and systems. Hereby, these can be directly related to the components and component types.
In steps 3 and 4, the components for realizing the Smart Ready Services and their SRS functionality level are selected. Depending on the set design values and the available components, the script (here: Dynamo Plugin in Revit) specifies the component type and transfers it to the model. This component type can specify its characteristics, which can vary with the complexity of the SRS functionality level. It also defines the data points assigned to the component, such as measured and control variables.
Finally, a script (here: Dynamo Plugin) synchronizes the external labeling databases bidirectionally with the imported model information. The data exchange format developed and used here represents unambiguous information regarding the topographical address and technical address for components of a building automation and control system. For this purpose, a sequence of alphabetic and numeric characters enables unambiguous assignment of each component (see Figure 5). This detailed labeling system enables the presentation of necessary information (see AS1 – 10) for the determination of the achieved SRI.
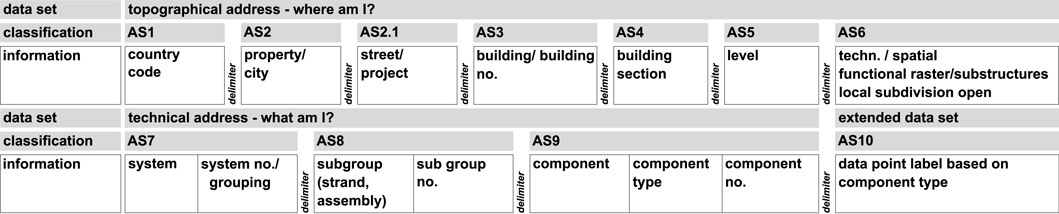
Figure 5. Classification levels of the labeling system in use.
Combined with a data exchange format (see Subsection 2.2), it provides a component/system-room link and is therefore suitable for a floor-related evaluation of functionalities, as implemented in Subsection 2.3. With this approach rooms and systems of different functionality levels can be taken into account. This improves the quality of the assessment in the verification process, particularly with regard to the comparability of the SRI. As a result, the expected SRI can be calculated at an early stage in the planning process.
2.2 Data transfer
The information from the data augmentation process (see Subsection 2.1) shall be used within the framework of the methodology for the automated calculation and verification of SRI. Therefore, it is crucial to develop a data exchange format to bridge the gap between the previously enriched information and an SRI assessment. The objective is to represent the services and components for room and system automation as well as building automation.
Another primary objective is to facilitate transparent communication without the occurrence of information gaps during the planning, construction, and operation phases. In terms of information depth, the digital building model should be comprehensively represented through semantic links. The data exchange format is also developed to map Smart Ready Services, associated planning information, components, and their system relationships. The ensuing requirements for the digital data exchange format are outlined in Table 1.
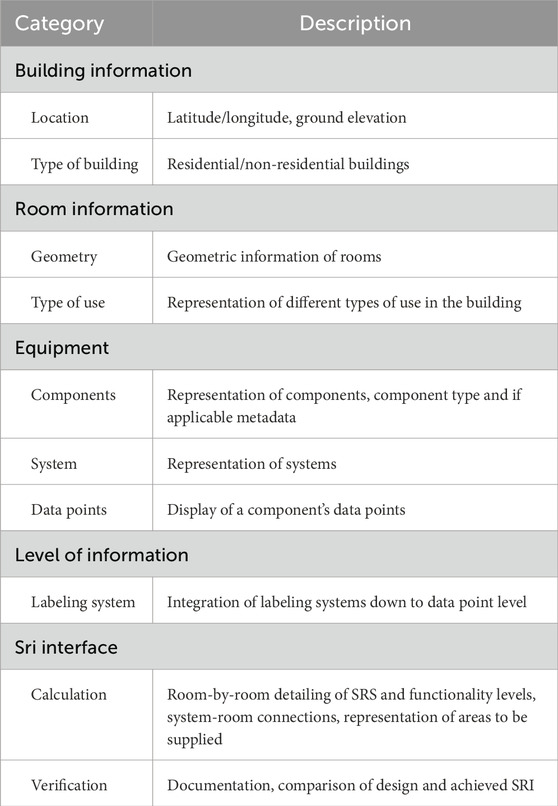
Table 1. Requirements for the data exchange format.
The basic data structure and hierarchical relationships of the data exchange format are shown in Figure 6 below. To ensure a structured flow of information using the data exchange format, standardized information categories are defined in advance based on the requirements in Table 1. In general, the categorization building, room, and system is applied (see Subsection 2.1; Figure 4). As demonstrated in Figure 6, the data exchange format has been implemented in JavaScript Object Notation (JSON) format, in accordance with the specified requirements.
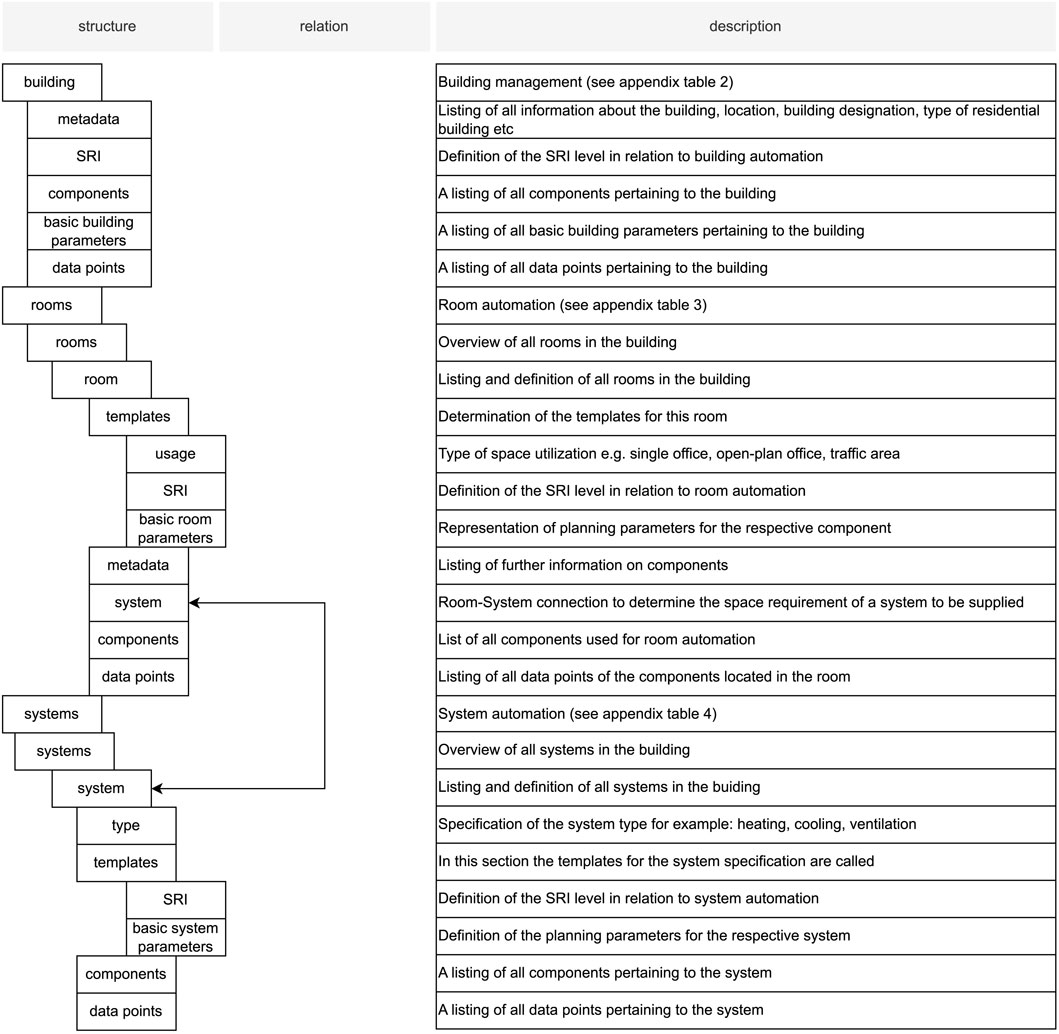
Figure 6. Structure tree of the data exchange format.
The Category building contains general information applicable to the entire building. It includes, for example, functional descriptions of the building management system and lists the associated components and their data points. In addition, general building model parameters can be read in/out, such as location, year of construction, floor space distribution or building type (residential or non-residential).
Rooms is differentiated in a similar way. This category includes room-specific information such as geometric information, types of use, or descriptions of room automation functions. In addition to the building category, templates may be used.
The systems from the various technical domains are listed categorically using a predefined structure. The type of system, the belonging components and their data points are described. Templates are also used here.
Templates are employed to represent recurring features in a universal and compact form. In the context of room automation, this allows the direct and efficient assignment of predefined templates (usage, SRI, basic room parameters) to rooms. The structure can be utilized in a similar manner for systems (SRI, basic system parameters). As illustrated in the supplementary material the level of detail for each individual parameter is adjustable to fulfill the specific needs of individual users. This feature offers a considerable advantage in terms of flexibility.
For the representation of component-related information, labeling systems can be used and integrated into the data exchange format. Labeling systems facilitate the localization and representation of individual components and associated systems. Based on the installed components in the room and the component’s data points, the system supplying the room can be identified. Due to the link between room and system, the functionality level of a Smart Ready Service of a system can be projected onto the floor area of a supplied room, thereby determining its floor-related SRI rating.
Completing the data exchange format, all components and component types as well as their data points are listed for buildings, rooms, and systems so that the SRS projected onto rooms or systems and their levels can be traced (see verification process). Furthermore, planning parameters such as room temperature, humidity, and operating times are stored in templates, which can be used to implement automation functions.
The data exchange format developed in this section fulfills the specified requirements. Flexibly adjustable template structures enable a categorized presentation of information as well as the integration of Smart Ready Services. To transfer the digital base model information into the data exchange format we have developed a script (here: Dynamo Plugin) that processes the data using information assignment. The data exchange format provides a framework for automated SRI calculation and ensures a seamless flow of information throughout the life cycle of a building. A Python tool described in Subsection 2.3 accesses the data exchange format and runs an automated floor-related SRI calculation. Moreover, the categorized presentation of information allows a detailed verification of the achieved SRI.
2.3 Data Assessment
Following on from the previous subsections, the SRI is calculated automatically in the final step. For this purpose, a Python tool was developed based on the EU calculation methodology. In addition, the script was extended by the modules service categorization, area allocations and filter function, which increase the evaluation quality and flexibility of the SRI calculation.
Regarding the service categorization module, the structure of the three categories room, system and building as shown in Figure 4 is used. By using a labeling system, the classification allows system-room and system-component relations to be taken into account, which are read out by the Python tool. Thus, areas can be clearly assigned to the respective supplying system. This relationship ensures that different equipment features of systems in a reference area are considered in equal parts. The allocation is made evenly, as otherwise further information on the weighting (allocation of quantities to individual services) is required.
The second module area allocations deals primarily with a limitation of the given calculation tool (The European Commission, 2024). Currently, a maximum of two SRS functionality levels for the entire building can be applied. This approach is replaced by a room-by-room division of space, so that an SRS functionality level can be selected for each room and therefore also each system. The extended area allocation of individual services provides a room-specific SRI, which is then summarized in an overall SRI for the building.
In the module filter function, areas can be excluded from the SRI calculation depending on the type of usage in the data exchange format (see Figure 6). This allows an SRI score to be calculated which is not underestimated by areas with a lower level of equipment (e.g., circulation areas, plant room). Similarly, it is possible to exclude individual rooms from the SRI assessment and thus show the effects on the building’s SRI.
In summary, the automatic readout of the SRS and their functionality levels represented in a digital model offer significant advantages. The error rate is reduced and quality assurance is improved as manual input is no longer required. At the same time, efficiency is increased and the workload for the assessor is reduced. In addition, subjective decisions are counteracted since there is no scope for interpretation due to missing or insufficient model data.
The additional modules detail the calculation methodology of the SRI and address the points of criticism known from Section 1. Integrating the SRI as planning parameter at the start of a project enables the current SRI to be output at any time for target-performance comparisons. This facilitates target-oriented planning.
3 Results
The results are presented below using a test model respectively mockup. The mockup is a simplified verification of the methodology and abstracts a more complex entity, such as a complete building. The structure of the methodology described above (see Subsection 2.1; Subsection 2.2; Subsection 2.3, see Figure 3) is displayed in Figure 7. Beginning with the data augmentation process (Subsection 2.1), a digital base model represents the starting point. The geometric model already contains metadata on the area and volume of the three illustrated rooms (Figure 7; Subsection 2.1A). After defining and projecting the planning variables in the form of templates (Figure 7; Subsection 2.1B) for the room, system and building, the necessary components of the technical building equipment and the associated data points are stored in this model stepwise (Figure 7; Subsection 2.1C). In this example, the plant room, office 1 and office 2 are analyzed.
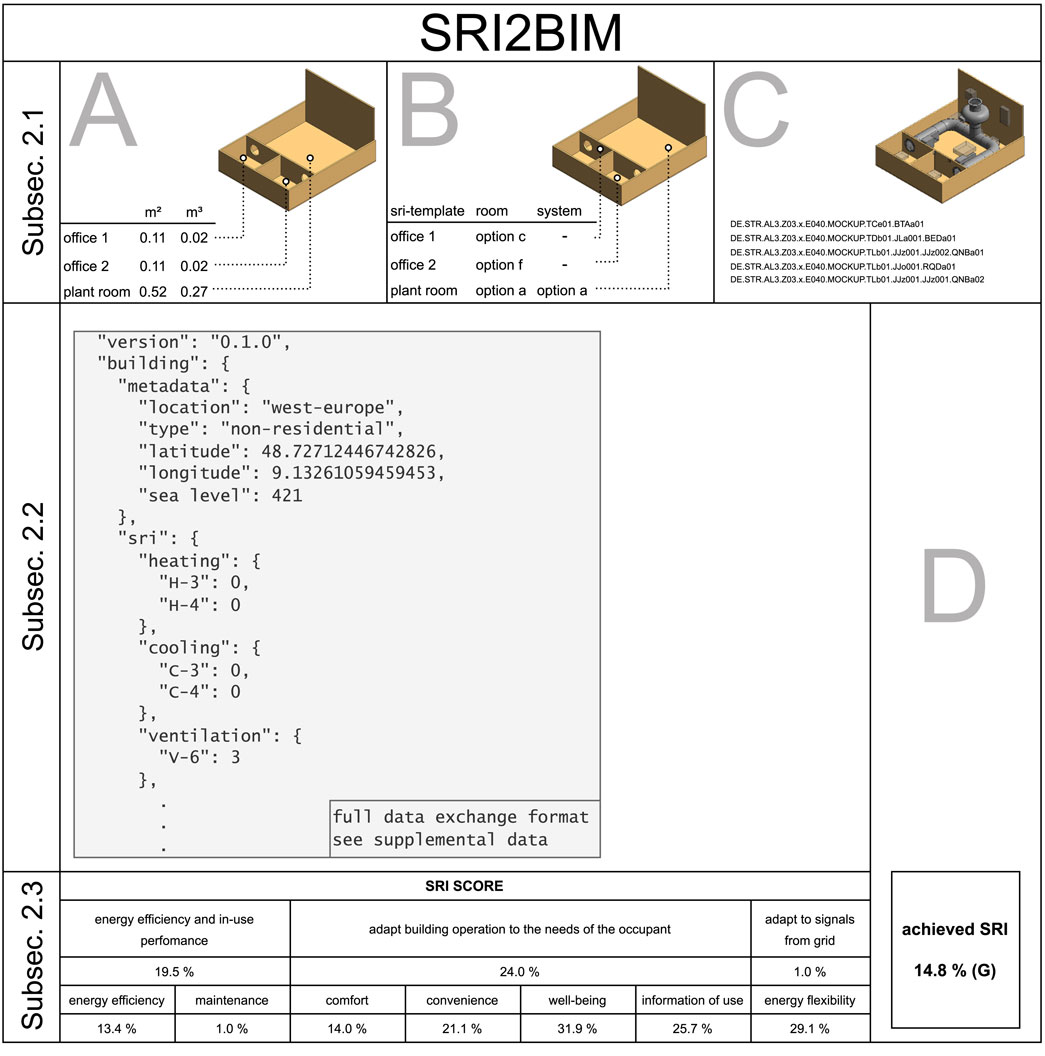
Figure 7. Result of the mockup: Visualization of the methodology through the projection of the planning process (A–C) and the verification step (D) onto the workflow levels — Subsection 2.1 Data Augmentation, Subsection 2.2 Data Transfer, and Subsection 2.3 Data Assessment.
Applying the Dynamo script, the stored data is converted into a data exchange format (Subsection 2.2), which is shown for office 1. In the mockup, the ventilation trade was planned and implemented exemplarily, see data exchange format in Figure 7. All other trades and associated room services (such as heat emission control) are assigned the lowest functionality level. This includes controlling the supply air flow at room level or monitoring the indoor air quality at the highest functionality level. A monitoring system has also been integrated, which provides feedback on the current system status and its performance. Furthermore, the electrical power consumption of the system is recorded. The data exchange format (see supplementary material) also contains at room, system and building level all the associated components and data points required for the verification process. Accessing this, the area-related calculation of the Smart Readiness Indicators is carried out in Subsection 2.3 using the Python tool developed. In addition to the SRI, the degrees of fulfillment in the respective impact areas are also specified. The SRI for this mockup is 14.8%.
4 Discussion
The comparatively low SRI will be discussed below. This leads to further points for discussion on the calculation method with regard to area allocation and areas to be excluded. The SRI of 14.8% corresponds to class G, which represents the lowest class of the Smart Readiness Indicator. There are several reasons for this. First, the mockup used here only includes and represents the SRS of the ventilation domain. If multiple domains were considered in a more detailed mockup, the SRI would be significantly higher. Secondly, the ratio of different room types has a major influence on the result. The plant room accounts for 70% of the total floor area in the mockup. Compared to a real building, this is not a typical ratio. The low functionality of the plant room combined with the large area therefore result in a low SRI. This reduces the influence of the technically better equipped individual offices. Despite the fact that the SRI calculated in this instance is not representative for the actual building stock, the mockup does possess all of the fundamental characteristics of an integral digital planning process. Therefore, the feasibility of the methodology can be confirmed.
As (Directorate-General for Energy, European Commission et al., 2020) (see Section 1) have observed, a considerable proportion of traffic areas, which are often less technologically equipped, can exert a substantial influence on the SRI for the entire building. This influence was also observed in our mockup and raises the question of whether these areas should be included. It is also noticeable when looking at different building types and could therefore favor buildings with low traffic areas or make it more difficult to compare the SRI (Fokaides et al., 2020). Proposes various solutions for this, two of which give less weight to traffic areas or even exclude them. This would prioritize user comfort in the primary zones. Based on these findings, a filter function was developed. It is implemented by integrating usage types into the data exchange format. As a result, specific areas (e.g., circulation areas) can be evaluated according to the two approaches above.
For the mockup, excluding the plant room would result in a maximum SRI of 16.3% compared to 14.8%. Hence, it is obvious that the implementation of such a function provides a large scope for the user. In order to clarify this, the EU needs to decide on the types of use and their weightings to be taken into account. The methodology and the tool we presented here offer the opportunity to react flexibly to future adjustments to the calculation methodology.
5 Conclusion
For new and existing buildings, the amended European Buildings Directive introduces an assessment indicator called Smart Readiness Indicator (SRI). However, the currently proposed calculation methodology can only be applied to existing buildings and does not provide an automated calculation. Moreover, there is a large scope for interpretation with regard to the application of the SRI due to a lack of data or insufficient definitions of the functionality levels of individual Smart Ready Services. Given the challenges outlined above, we recommend integrating the Smart Readiness Indicator into a BIM process at an early stage. This early integration ensures the initial planning of building automation functions that can be formulated as requirements for the building within the digital model.
Further planning and implementation of the technical building services in the usage unit can be carried out target-oriented based on these planning specifications. The enriched information extends to the data point level and is transferred into a data exchange format in a categorized manner. The data exchange format developed here provides a basis for data transfer and communication between all partners involved in construction and across all life cycle phases. An area-related SRI is calculated using the stored algorithm. Thus, rooms with varying technical equipment and types of use can be taken into account. The data exchange format may also be used by the assessor for the verification process. The method presented here was successfully applied using a mockup. In future, the method and the data exchange format developed can also be used for the data-based assessment (method C). Through the categorized representation of the demand variables at room, system or building level as well as the associated technical components and their data points, this assessment can be approached, e.g., through the integration of Key Performance Indicators (KPIs).
Data availability statement
The original contributions presented in the study are included in the article/Supplementary Material, further inquiries can be directed to the corresponding author.
Author contributions
MC: Validation, Data curation, Visualization, Project administration, Conceptualization, Formal Analysis, Writing – review and editing, Investigation, Methodology, Software, Writing – original draft. LT: Writing – original draft, Formal Analysis, Visualization, Methodology, Writing – review and editing, Software, Data curation, Investigation, Validation. TR: Visualization, Formal Analysis, Writing – review and editing, Investigation, Writing – original draft, Methodology. MM: Investigation, Writing – review and editing, Writing – original draft, Methodology, Visualization, Formal Analysis. TH: Supervision, Writing – review and editing. KS: Writing – review and editing, Supervision. MK: Investigation, Writing – review and editing, Validation, Data curation, Software. AG: Investigation, Validation, Writing – review and editing, Software, Data curation.
Funding
The author(s) declare that financial support was received for the research and/or publication of this article. We would like to thank the Federal Ministry of Economics and Climate Action, Germany (BMWK) for funding as part of the “BIMpact” project with the grant number: 03EN1043B.
Conflict of interest
Author MK was employed by aedifion GmbH.
Author AG was employed by Ed. Züblin AG.
The remaining authors declare that the research was conducted in the absence of any commercial or financial relationships that could be construed as a potential conflict of interest.
Generative AI statement
The author(s) declare that no Generative AI was used in the creation of this manuscript.
Any alternative text (alt text) provided alongside figures in this article has been generated by Frontiers with the support of artificial intelligence and reasonable efforts have been made to ensure accuracy, including review by the authors wherever possible. If you identify any issues, please contact us.
Publisher’s note
All claims expressed in this article are solely those of the authors and do not necessarily represent those of their affiliated organizations, or those of the publisher, the editors and the reviewers. Any product that may be evaluated in this article, or claim that may be made by its manufacturer, is not guaranteed or endorsed by the publisher.
Supplementary material
The Supplementary Material for this article can be found online at: https://www.frontiersin.org/articles/10.3389/fbuil.2025.1634162/full#supplementary-material
References
Al Dakheel, J., Del Pero, C., Aste, N., and Leonforte, F. (2020). Smart buildings features and key performance indicators: a review. Sustain. Cities Soc. 61, 102328. doi:10.1016/j.scs.2020.102328
Becchio, C., Corgnati, S. P., Crespi, G., Pinto, M. C., and Viazzo, S. (2021). Exploitation of dynamic simulation to investigate the effectiveness of the smart readiness indicator: application to the energy center building of turin. Sci. Technol. Built Environ. 27, 1127–1143. doi:10.1080/23744731.2021.1947657
Boje, C., Kubicki, S., Guerriero, A., and Thomas, S. (2022). “Aligning ifc and sri domains for bim supported sri assessement,” in 2022 IEEE 28th International Conference on Engineering, Technology and Innovation (ICE/ITMC) and 31st International Association For Management of Technology (IAMOT) Joint Conference, 1–8. doi:10.1109/ICE/ITMC-IAMOT55089.2022.10033263
Calandri, M., Henzler, T., Stergiaropoulos, K., Genswein, M., Tafelmaier, L., Müller, M., et al. (2023). Integration und modellbasierte ableitung des smart readiness indicators bei anwendung der bim-methodik. HLH 74, 26–31. doi:10.37544/1436-5103-2023-11-12-26
Di Biccari, C., Calcerano, F., D’Uffizi, F., Esposito, A., Campari, M., and Gigliarelli, E. (2022). Building information modeling and building performance simulation interoperability: state-Of-The-art and trends in current literature. Adv. Eng. Inf. 54, 101753. doi:10.1016/j.aei.2022.101753
Ding, L., Ma, C., and Ma, X. (2024). “Optimisation of energy consumption using building information modelling technology,” in Proceedings of the institution of civil engineers - smart infrastructure and construction 177, 148–157. doi:10.1680/jsmic.22.00033
Directorate General for Energy, European Commission and Vito (2020). Final report on the technical support to the development of a smart readiness indicator for buildings: final report. Publications Office of the European Union. doi:10.2833/41100
Directorate-General for Energy, European Commission Verbeke, S., Aerts, D., Reynders, G., Ma, Y., and Waide, P. (2020). Final report on the technical support to the development of a smart readiness indicator for buildings – summary. Publications Office of the European Union. doi:10.2833/600706
European Commission (2023). Implementation tools: smart readiness indicator guidelines for eu countries and assessors, and examples of digital calculation tools.
European Parliament (2018). Directive (EU) 2018/844 of the european parliament and of the council of 30 may 2018 amending directive 2010/31/EU on the energy performance of buildings and directive 2012/27/EU on energy efficiency. Tech. Rep. L 156. Available online at: http://data.europa.eu/eli/dir/2018/844/oj.
Faghihi, V., Reinschmidt, K. F., and Kang, J. H. (2014). Construction scheduling using genetic algorithm based on building information model. Expert Syst. Appl. 41, 7565–7578. doi:10.1016/j.eswa.2014.05.047
Faghihi, V., Reinschmidt, K. F., and Kang, J. H. (2016). Objective-driven and pareto front analysis: optimizing time, cost, and job-site movements. Automation Constr. 69, 79–88. doi:10.1016/j.autcon.2016.06.003
Fokaides, P. A., Panteli, C., and Panayidou, A. (2020). How are the smart readiness indicators expected to affect the energy performance of buildings: first evidence and perspectives. Sustainability 12, 9496. doi:10.3390/su12229496
Irizarry, J., and Karan, E. P. (2012). Optimizing location of tower cranes on construction sites through GIS and BIM integration. ITcon 17 (pg), 351–366.
Isikdag, U. (2015). “Building information models: an introduction,” in Enhanced building information models, 1–12. doi:10.1007/978-3-319-21825-0_1
Janhunen, E., Pulkka, L., Säynäjoki, A., and Junnila, S. (2019). Applicability of the smart readiness indicator for cold climate countries. Buildings 9, 102. doi:10.3390/buildings9040102
Kang, L.-S., Moon, H.-S., Kim, H.-S., and Kwak, J.-M. (2013). Usability improvement of bim for construction projects using active bim functions. Korean J. Constr. Eng. Manag. 14, 74–83. doi:10.6106/KJCEM.2013.14.5.074
Kim, K., Cho, Y., and Kim, K. (2018). Bim-driven automated decision support system for safety planning of temporary structures. J. Constr. Eng. Manag. 144, 04018072. doi:10.1061/(ASCE)CO.1943-7862.0001519
Knotzer, A., Fechner, J., Zelger, T., and Berger, A. (2020). Smart readiness indikator bewertungsschema und chancen für intelligente gebäude: sri austria.
Kumar, S. S., and Cheng, J. C. (2015). A bim-based automated site layout planning framework for congested construction sites. Automation Constr. 59, 24–37. doi:10.1016/j.autcon.2015.07.008
Lund, H., Werner, S., Wiltshire, R., Svendsen, S., Thorsen, J. E., Hvelplund, F., et al. (2014). 4th generation district heating (4gdh): integrating smart thermal grids into future sustainable energy systems. Energy 68, 1–11. doi:10.1016/j.energy.2014.02.089
Luong, D. L., Truong, N.-S., Ngo, N.-T., and Nguyen, N.-Q. (2024). Developing the hybrid bim-bem and jellyfish search optimization system for optimizing energy consumption and building installation costs. Sci. Rep. 14, 17186. doi:10.1038/s41598-024-68021-6
Markoska, E., Jakica, N., Lazarova-Molnar, S., and Kragh, M. K. (2019). “Assessment of building intelligence requirements for real time performance testing in smart buildings,” in 2019 4th International Conference on Smart and Sustainable Technologies (SpliTech), 1–6. doi:10.23919/SpliTech.2019.8783002
Märzinger, T., and Österreicher, D. (2019). Supporting the smart readiness indicator—a methodology to integrate a quantitative assessment of the load shifting potential of smart buildings. Energies 12, 1955. doi:10.3390/en12101955
Marzouk, M., and Abubakr, A. (2016). Decision support for tower crane selection with building information models and genetic algorithms. Automation Constr. 61, 1–15. doi:10.1016/j.autcon.2015.09.008
Moon, H., Kim, H., Kamat, V. R., and Kang, L. (2015). Bim-based construction scheduling method using optimization theory for reducing activity overlaps. J. Comput. Civ. Eng. 29, 04014048. doi:10.1061/(ASCE)CP.1943-5487.0000342
Moussavi Nadoushani, Z. S., Hammad, A. W. A., and Akbarnezhad, A. (2017). Location optimization of tower crane and allocation of material supply points in a construction site considering operating and rental costs. J. Constr. Eng. Manag. 143, 04016089. doi:10.1061/(ASCE)CO.1943-7862.0001215
Müller, D., Jansen, D., Treeck, C., Fichter, E., Richter, V., Lüdemann, B., et al. (2021). Bim2sim - methodenentwicklung zur erstellung von simulationsmodellen aus daten des building information modeling. doi:10.2314/KXP:1819319997
Obradović, D., Galić, M., and Klanšek, U. (2019). “Active bim: review of accomplishments, challenges and potentials,” in 14th International Conference Organization, Technology and Management in Construction and 7th International Project Management Association Research Conference : Zagreb, September 04 - 07, 2019. Editors I. Završki, A. Cerić, J. Korytarova, M. Vukomanović, M. Huemann, and D. Ronggui (Zagreb, Croatia: Croatian Association for Construction Management and University of Zagreb Faculty of Civil Engineering), 443–454.
Quinn, C., Shabestari, A. Z., Misic, T., Gilani, S., Litoiu, M., and McArthur, J. J. (2020). Building automation system - bim integration using a linked data structure. Automation Constr. 118, 103257. doi:10.1016/j.autcon.2020.103257
Tang, S., Shelden, D. R., Eastman, C. M., Pishdad-Bozorgi, P., and Gao, X. (2019). A review of building information modeling (bim) and the internet of things (iot) devices integration: present status and future trends. Automation Constr. 101, 127–139. doi:10.1016/j.autcon.2019.01.020
Vieira, R., Carreira, P., Domingues, P., and Costa, A. A. (2020). Supporting building automation systems in bim/ifc: reviewing the existing information gap. Eng. Constr. Archit. Manag. 27, 1357–1375. doi:10.1108/ECAM-07-2018-0294
Vigna, I., Pernetti, R., Pernigotto, G., and Gasparella, A. (2020). Analysis of the building smart readiness indicator calculation: a comparative case-study with two panels of experts. Energies 13, 2796. doi:10.3390/en13112796
Wang, J., Liu, J., Shou, W., Wang, X., and Hou, L. (2014). “Integrating building information modelling and firefly algorithm to optimize tower crane layout,” in Proceedings of the international symposium on automation and robotics in construction (IAARC) (international association for automation and robotics in construction (IAARC)). doi:10.22260/isarc2014/0043
Werner, S. (2017). International review of district heating and cooling. Energy 137, 617–631. doi:10.1016/j.energy.2017.04.045
Wu, Y., and Dai, B. (2025). Bim-enabled optimization of thermodynamic performance in green buildings. Int. J. Heat Technol. 43, 570–582. doi:10.18280/ijht.430219
Zhao, L., Zhang, W., and Wang, W. (2022). Bim-based multi-objective optimization of low-carbon and energy-saving buildings. Sustainability 14, 13064. doi:10.3390/su142013064
Zhuang, D., Zhang, X., Lu, Y., Wang, C., Jin, X., Zhou, X., et al. (2021). A performance data integrated bim framework for building life-cycle energy efficiency and environmental optimization design. Automation Constr. 127, 103712. doi:10.1016/j.autcon.2021.103712
Keywords: building information modeling (BIM), smart readiness indicator (SRI), integrated planning, digital twin, building automation and control systems (BACS)
Citation: Calandri M, Tafelmaier L, Rathje T, Müller M, Henzler T, Stergiaropoulos K, Kramp M and Glatz A (2025) Smart building assessments: optimizing SRI calculation using a BIM-based data exchange framework. Front. Built Environ. 11:1634162. doi: 10.3389/fbuil.2025.1634162
Received: 23 May 2025; Accepted: 25 September 2025;
Published: 14 October 2025.
Edited by:
Sinan Melih Nigdeli, Istanbul University-Cerrahpasa, TürkiyeReviewed by:
Uroš Klanšek, University of Maribor, SloveniaAbdullah Badawy Mohammed, Fayoum University, Egypt
Copyright © 2025 Calandri, Tafelmaier, Rathje, Müller, Henzler, Stergiaropoulos, Kramp and Glatz. This is an open-access article distributed under the terms of the Creative Commons Attribution License (CC BY). The use, distribution or reproduction in other forums is permitted, provided the original author(s) and the copyright owner(s) are credited and that the original publication in this journal is cited, in accordance with accepted academic practice. No use, distribution or reproduction is permitted which does not comply with these terms.
*Correspondence: Maurizio Calandri , bWF1cml6aW8uY2FsYW5kcmlAaWd0ZS51bmktc3R1dHRnYXJ0LmRl