 Yongsheng Liu
 Neng Wang1*
 Jianguo Cai
- 1Hunan Province Communications Planning, Survey & Design Institute Co., Ltd, Changsha, Hunan, China
- 2School of Civil Engineering, Southeast University, Nanjing, China
As a core component of the lock filling and emptying system, the operational performance of the valve significantly influences the efficiency and safety of navigation locks. To elucidate the mechanical mechanisms during valve operation, this study investigates the valve structure of the Hongjiang hub under high head conditions. A combined approach of numerical simulation and scale experiment was employed to examine both the mechanical response and hydrodynamic behaviors of the valve. (1) Numerical results indicate the stress concentration is easy to occur in the center of the bottom panel of the valve, which causes the structural displacement. Structural checks confirm that both stress and displacement remain within the allowable design limits, demonstrating the structural adequacy of the valve. The valve’s natural frequency is substantially higher than the dominant energy range of flow-induced excitations, suggesting a low likelihood of severe vibration. (2) Experimental investigations were conducted to evaluate the valve’s hydrodynamic characteristics. Pressure fluctuations on the valve surface were found to be strongly correlated with the valve opening. At small openings, the valve body lies within a high-velocity jet zone formed by the gap between the valve and the sill, resulting in pronounced pressure fluctuations. As the opening increases, the valve body shifts into the valve chamber, and measured pressures become more stable, with reduced fluctuation amplitudes. (3) During the opening process, the opening force initially increases and then decreases, with a peak value of approximately 200 kN. In contrast, the closing force during valve closure follows a “decrease–increase–decrease” trend, reaching a minimum of around −150 kN. (4) Un-der emergency closure conditions at an opening ratio of n = 0.3, the hydrodynamic load coefficient peaks at approximately 1.22. The effect of the valve opening speed on the dynamic load is found to be negligible. The findings provide theoretical insights and practical guidance for the design and manufacture of lock valves operating under high head conditions.
1 Introduction
Navigation locks serve as crucial nodes in inland waterway transportation by regulating water level differences to ensure the safe and efficient passage of vessels. Their design and operation directly influence the transport capacity and operational safety of navigational channels (Wu et al., 2021; Wang and Li, 2022; Liu et al., 2024; Lu et al., 2024; Xin et al., 2024). A typical lock system consists of key components such as the lock chamber, gates, filling culverts, and valves. Among these, the filling valve plays a central role in regulating flow, balancing the chamber water level, and adjusting the filling and emptying efficiency (Cavallaro et al., 2020; Smok et al., 2022; Xu et al., 2022; Zhang and Jing, 2022; Song et al., 2024).
Currently, the most commonly used valves in lock systems are flat (or slide) valves and radial (or sector) valves (Viero and Defina, 2019). Flat valves, owing to their simple structure and ease of manufacturing and maintenance, are widely adopted in low-head lock systems. In contrast, radial valves are predominantly used in high-head locks to cope with challenges such as cavitation during valve opening and closing under high-pressure conditions. During lock operation, filling valves must operate frequently under high-pressure and high-velocity flow conditions. Their mechanical loading and hydrodynamic performance are critical to both the structural reliability of the valve itself and the overall operational stability of the lock.
With the growing demand for inland shipping, the scale of locks and the associated flow volumes have significantly increased, leading to more complex operating conditions for valves. The structural design of high-head valves must satisfy requirements for strength, stiffness, and stability. Among the key concerns are the stress and deformation characteristics of the valve under various operating conditions. Furthermore, the flow-induced vibration behaviors of high-head valves (Lauria et al., 2020; Lazzarin et al., 2023) is closely linked to their safe and stable operation. Flow-induced pressure fluctuations act as external excitation, while the valve’s natural frequency determines its susceptibility to vibration. If the natural frequency of the valve lies within the high-energy band of flow-induced pulsations or is close to the dominant frequency of the pulsation, significant vibration or even resonance may occur.
In traditional designs, valves are often exposed to dynamic hydraulic loads, cavitation erosion, and structural vibrations, which may result in fatigue damage or failure. For instance, flat valves are prone to intense pressure pulsations under high-velocity flow, while radial valves, though effective at improving flow patterns, may experience stress concentration at hinge joints due to asymmetric loading. Li et al. (2023) studied valve natural frequencies using modal testing and the finite element method (FEM), revealing good agreement between experimental and numerical results. Marashi et al. (2021), using numerical methods, analyzed the structural response and natural vibration characteristics of valves in the Liujiang Honghua second-line lock, identifying significant displacements near the center of the bottom sealing plate and stress concentration at beam–panel connections. Santic et al. (2024) developed a mathematical model of the same lock system to simulate pressure variations in the valve culvert and downstream gallery using numerical techniques. Lee et al. (2018) applied a standard two-equation turbulence model to numerically simulate the transient flow field during valve operation. The results showed that in the top expansion scheme, flow recirculation zones form behind the valve and in the valve chamber, with the extent increasing as the valve opening decreases. In the bottom expansion scheme, triangular and elliptical recirculation zones appear downstream of the sill and behind the valve respectively, with weaker flow and smaller recirculation regions.
Duan et al. (2025) conducted physical model tests and optimization studies on the hydraulic performance of lock filling systems, revealing that the initial design failed to adequately diffuse flow in the downstream gallery, resulting in localized high-velocity zones. Optimization of the gallery geometry effectively reduced these high-energy areas. Wang et al. (2023) used a full-scale sliced model to investigate cavitation near the valve top gap and the anti-cavitation mechanism of natural aeration. The study found that natural aeration increased the pressure within the ventilated gap flow, eliminated cavitation around the main flow and valve plate, and mitigated throat cavitation.
Existing research has predominantly relied on static or simplified dynamic models, which fail to adequately capture the complex multi-physics interactions inherent in valve operation. Furthermore, systematic studies on the special structural configuration of reverse-curved sector valves under high-head conditions remain lacking, with differences in streamlined profiles and stress distribution characteristics induced by the reverse-curved structure yet to be fully elucidated. Additionally, experimental and numerical studies are often conducted in isolation, lacking a comprehensive analytical framework that enables synchronous correlation between structural responses and hydrodynamic characteristics. This discrepancy frequently leads to a gap between design expectations and real-world performance. To address these limitations, the present study focuses on the mechanical and hydrodynamic characteristics of lock-filling valves. An integrated methodology combining numerical simulation and physical model testing is adopted to comprehensively analyze the valve’s dynamic load distribution under diverse operating conditions and its flow-induced vibration characteristics at various opening positions. Key parameters—including valve stress distribution, pressure pulsation behavior, operational forces during opening/closing, and hydrodynamic load coefficients—are analyzed in detail. The primary objectives are to reveal the fundamental mechanical mechanisms governing valve performance, provide theoretical guidance for structural optimization and operational safety enhancement, and establish a methodological framework for future investigations of lock valves under complex hydraulic conditions.
1.1 Project overview
The Hongjiang Complex (Tong et al., 2022) is located on the main stream of the Yuan River, within Hongjiang District, Huaihua City, Hunan Province, China. The project is primarily intended for hydropower generation, while also serving multiple functions including navigation and irrigation. The lock at the Hongjiang Complex is designed as a single-chamber, single-stage lock, with an annual one-way throughput capacity of 5.4006 million tons. The lock is classified as a typical high-head lock, with a maximum design head of 27.0 m—corresponding to an upstream maximum navigable water level of 190.0 m and a downstream minimum navigable level of 163.0 m. The effective dimensions of the lock chamber are 215 m (length) × 23 m (width) × 4.0 m (sill depth), and the filling time is designed to be 16.5 min.
The working valve used in the filling system is a reverse-curved sector gate. The valve section opening measures 3 m in width and 4 m in height, and the overall structural layout is illustrated in Figure 1. The external panel of the valve has a radius of 5.8 m. The vertical distance from the lifting lug center to the base plate is 4.9 m, and the distance from the hinge center to the base plate is 4.8 m. The length of the swinging arm is 8.0 m. The structural configuration fully complies with relevant design specifications for lock valves. The gate leaf weighs approximately 11.4 tons, while the supporting arms weigh around 19.7 tons. Including ancillary components, the total weight of the valve body is estimated at 31.5 tons. The primary material used in the valve structure is Q345B steel, with an allowable stress of 198 MPa.
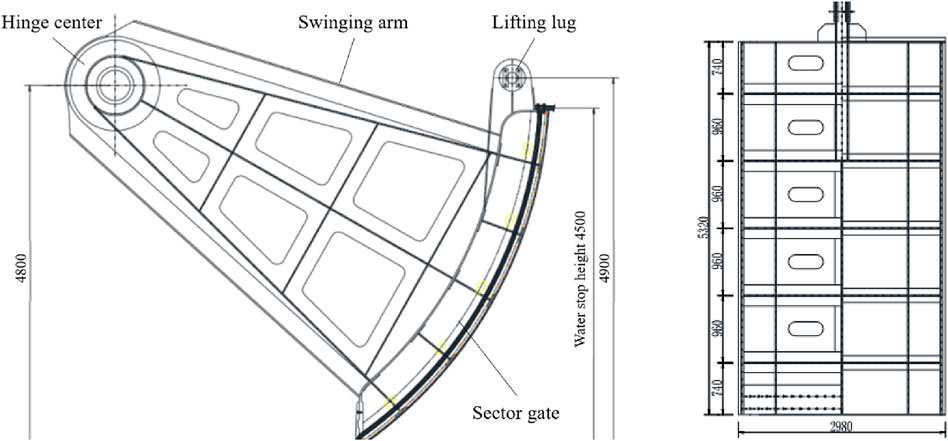
Figure 1. Schematic diagram of the valve structure.
2 Structural stress and vibration analysis of the valve
2.1 Computational model and methodology
A three-dimensional finite element model of the valve was developed using ANSYS software, with the X-axis oriented along the flow direction (positive direction defined as the outward normal of the downstream panel), while the Y-axis and Z-axis correspond to the vertical and horizontal directions, respectively. Mesh convergence verification demonstrated asymptotic convergence of both maximum equivalent stress and displacement results with progressive mesh refinement: when the element count increased from 87,624 to 123,555, the maximum stress varied by only 1.2% and displacement by 0.8%; further refinement to 176,392 elements reduced these variations to 0.4% and 0.3%, respectively. Balancing computational efficiency with accuracy, the mesh configuration with 123,555 elements was selected, achieving converged stress and displacement results with relative errors within the engineering tolerance of 5%. The final computational model utilizes tetrahedral solid elements for discretization, comprising 123,555 elements and 239,647 nodes, as illustrated in Figure 2.
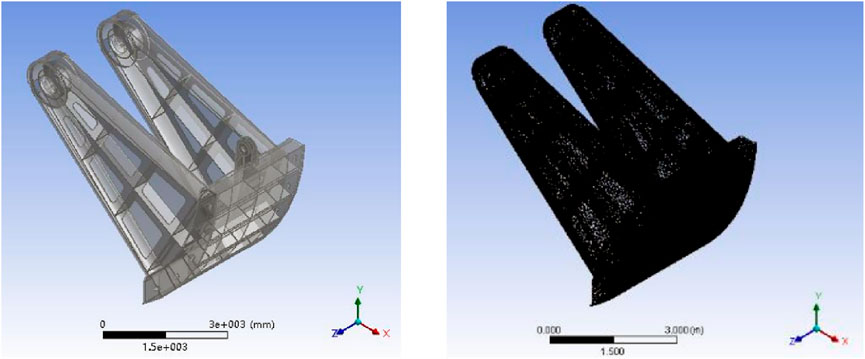
Figure 2. Three-dimensional finite element model of the valve.
In the calculation, stress verification is performed according to the von Mises yield criterion, with the equivalent stress calculated as shown in Equation 1:
where
The natural frequencies and vibration modes of the valve are calculated using a direct filtering method based on the inverse power method. This algorithm has the advantage of fast convergence and low storage requirements when solving for a few of the lowest frequencies and modes. The free vibration equation, neglecting damping forces, as shown in Equation 2:
where [K] and [M] are the stiffness and mass matrices, respectively, and
During vibration, the displacement of each particle can be approximated as simple harmonic motion. The equation of motion for the particles and the homogeneous vibration equation as shown in Equations 3, 4:
where
The r+1 eigenvalue filtering term is obtained by solving the direct filtering method, as shown in Equation 5:
2.2 Computational conditions
The static analysis includes the following operating conditions under the maxi-mum working head: water retaining, gate opening, and dynamic water closing conditions, as detailed below:
1. Water Retaining Condition: Maximum working head of 27 m pluses valve self-weight; upward constraint applied to the valve bottom stop.
2. Gate Opening Condition: Maximum working head of 27 m pluses valve self-weight; vertical constraint applied to the lifting lug, with no constraint on the bot-tom edge of the valve.
3. Dynamic Water Closing Condition: 1.8 times the design load pluses valve self-weight; vertical constraint applied to the lifting lug, with no constraint on the bot-tom edge of the valve.
2.3 Displacement and deformation analysis
Table 1 shows the displacement and stress values of the valve under different operating conditions. Figure 3 shows the displacement and deformation of the valve components under different operating conditions. In the figure, (a), (b), and (c) correspond to the normal water retaining condition, gate opening condition, and dynamic water closing condition, respectively. As shown, under different load conditions, the valve deforms primarily downstream, with the largest deformation occurring at the bottom of the panel, while the displacement of the supporting arms is relatively small. The valve displacement is symmetrically and uniformly distributed under each condition, with the maximum displacement occurring at the outer panel in the region of the main trans-verse beam of the bottom beam section, measuring 1.49 mm, 1.52 mm, and 2.74 mm, respectively. It can be observed that under the normal water retaining condition, the valve deformation is relatively small, while under the closing condition, the deformation is more significant. However, the overall deformation remains within the safe range.
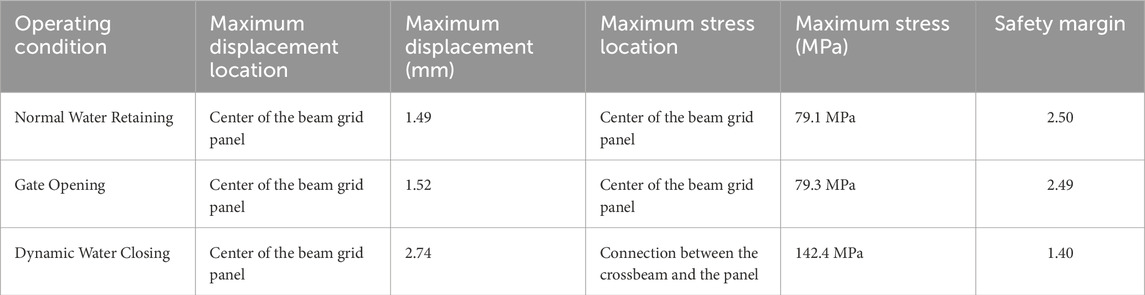
Table 1. Displacement and stress values of the valve under different operating conditions.
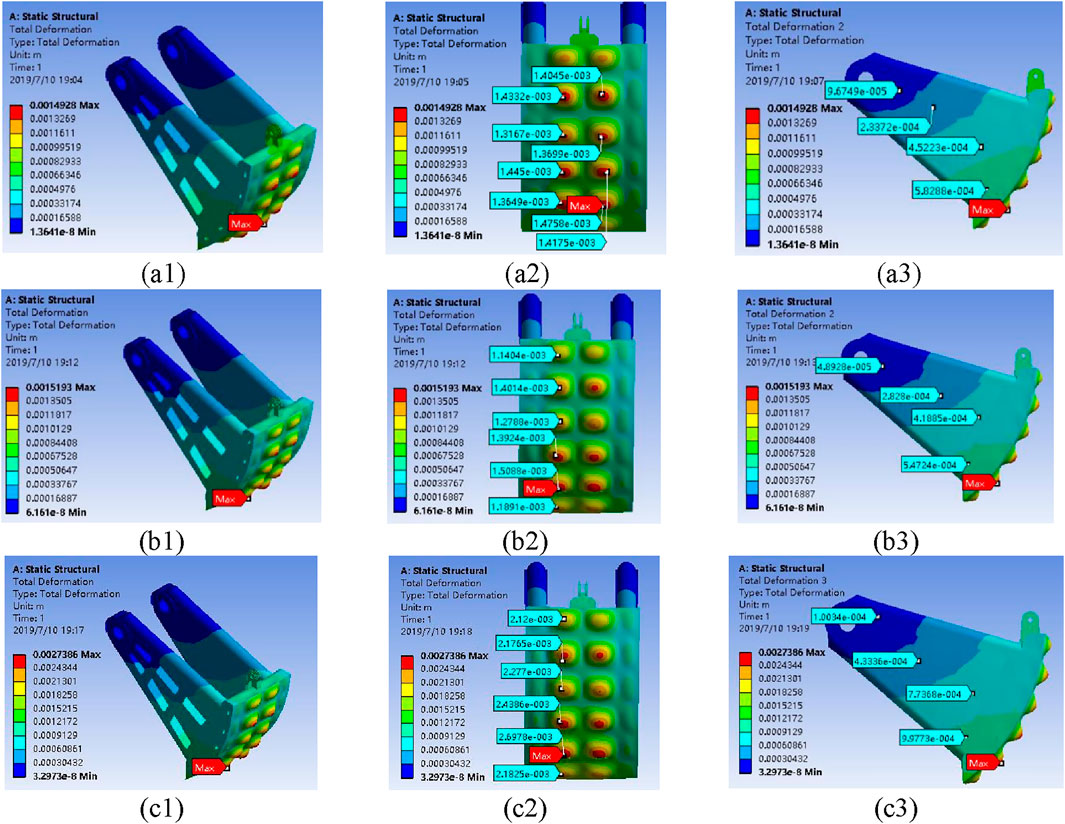
Figure 3. Displacement and deformation of the valve components under different operating conditions: (a1-3) normal water retaining condition, (b1-3) gate opening condition, and (c1-3) dynamic water closing condition.
2.4 Stress analysis
The equivalent stress of the valve is calculated according to the von Mises yield criterion, and the equivalent stress distribution of the valve structure is shown in Figure 4. The label in the figure identifies the stress information at the current position. Under the static water load at the maximum working head, the maximum equivalent stress of the overall structure is 79.1 MPa. When the valve is in an almost open state, with the lifting rod tension, maximum working head, and self-weight acting, and the bottom edge unconstrained, the maximum equivalent stress of the valve structure increases to 79.3 MPa. Under the action of the valve’s self-weight, 1.8 times the static water pressure, and the lifting rod tension, the maximum equivalent stress increases to 142.4 MPa, which is approximately 80% higher than that under the water retaining condition. Different from (Marashi et al., 2021), the stress distribution pattern of the inverted sector valve under the condition of dynamic water shut-off presents a unique radial diffusion characteristic, which is determined by the streamlined shape of the inverted structure. Overall, in all operating conditions, stress concentration occurs at the support arm hole positions of the valve, but the stress level remains low, indicating a relatively strong structure.
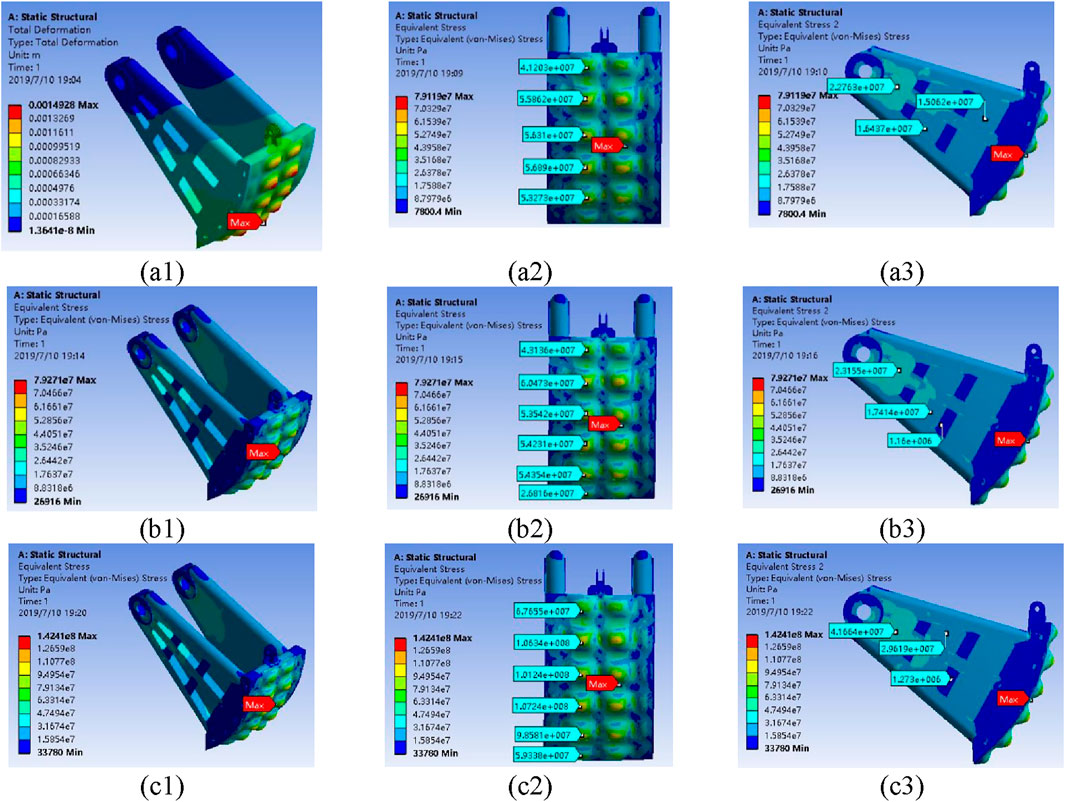
Figure 4. Equivalent stress distribution of the valve structure: (a1-3) Under static water load at the maximum working head, (b1-3) Under the condition of the valve in near-open state, and (c1-3) Under the combined action of the valve’s self-weight, 1.8 times the static water pressure (at the maximum working head), and the tension of the lifting rod.
A quantitative analysis of the outer plate thickness reveals significant mechanical improvements with increasing dimensions. When the thickness increases from 20 mm to 24 mm, the maximum equivalent stress decreases from 142.4 MPa to 98.7 MPa—a reduction of 30.7%. Further increasing the thickness to 30 mm reduces the maximum stress to 63.2 MPa, providing substantially greater safety margins. Notably, the safety factor improves from 1.40 to 2.0 (at 24 mm) and further to 3.1 (at 30 mm), markedly enhancing structural reliability under extreme operating conditions. Regarding weight implications, increasing the thickness to 24 mm and 30 mm results in outer plate weight gains of 20% and 50%, respectively, corresponding to total valve body weight increases of only 0.83 t (2.6%) and 2.07 t (6.6%). This modest weight increase substantially improves operational reliability during dynamic water closure events. An outer plate thickness range of 24–30 mm is recommended as the optimal value, achieving the best balance among stress reduction, natural frequency enhancement, and cost efficiency.
2.5 Natural vibration characteristics analysis
Modal analysis is a method used to study the vibration characteristics of structures or systems. Through modal analysis, information such as the system’s free vibration modes, natural frequencies, damping ratios, and mode shapes can be obtained. The natural vibration characteristics of the valve were analyzed considering dry modes in air, without accounting for the effects of water. The support hinge and lifting lug were fixed as constraints. The first five vibration modes of the valve are shown in Figure 5.
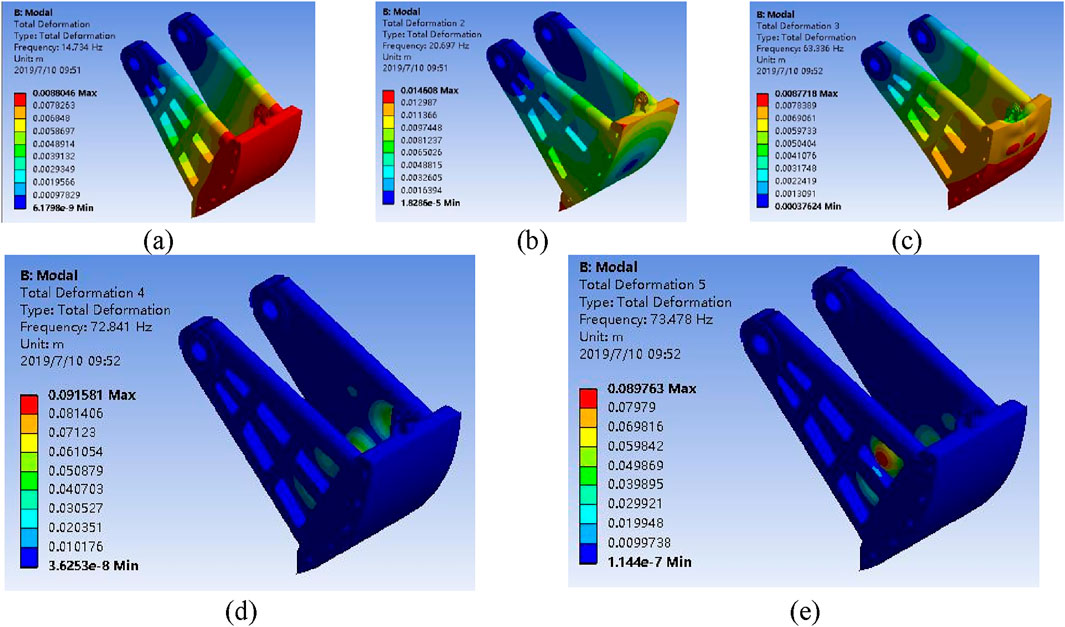
Figure 5. Natural vibration characteristics of the valve: (a) first vibration mode, (b) second vibration mode, (c) third vibration mode, (d) fourth vibration mode, (e) fifth vibration mode.
The valve’s first natural frequency is 14.734 Hz, corresponding to lateral swinging, and is well-separated from flow-induced pressure fluctuations’ high-energy region (<5 Hz), preventing resonance. This is because, structurally, the reverse-curved sector valve’s rigid frame provides high stiffness, with the first mode requiring overcoming inertia, yielding a higher frequency. Fluid-dynamically, under 27 m head, pressure fluctuations stem from large-scale vortex shedding and flow instabilities, concentrating energy below 5 Hz (meter-scale vortices). Kolmogorov’s theory indicates small-scale (millimeter) vortices produce high-frequency but negligible-energy fluctuations. Thus, significant flow pulsations are much lower than the valve’s frequency, ensuring natural decoupling.
The second natural frequency of the valve is 20.697 Hz, which is characterized by torsional vibration along the lateral direction. The third natural frequency is 63.336 Hz, which corresponds to vertical oscillations along the tangential direction of the valve body. The fourth and fifth natural frequencies are close to each other, at 72.841 Hz and 73.478 Hz, respectively, and both exhibit local vibrations on the side panels of the supporting arms.
Overall, the areas with the largest vibration amplitude of the valve are concentrated at the panels and the bottom of the supporting arms, with relatively high natural frequencies. The deformation in the vertical direction is relatively small, while the deformation in the horizontal direction is larger, especially in regions subject to higher stress and strain.
3 Hydrodynamic characteristics experimental study of the valve body
3.1 Experimental setup
The 1:15 scale model experiments in this study were rigorously designed following the Froude similarity criterion—the most widely adopted scaling law for hydraulic models, particularly suited for free-surface flows dominated by gravitational forces. This approach ensures identical Froude numbers between model and prototype. Notably, Reynolds number similarity cannot be simultaneously satisfied, resulting in a model Reynolds number approximately 1/15th of the prototype’s value, which may relatively amplify viscous effects. To evaluate this scaling effect on pressure fluctuation measurements, we conducted Reynolds number sensitivity analyses. The results demonstrate that when the Reynolds number exceeds 104 (with the minimum experimental Reynolds number reaching ∼2.3 × 10⁴ in this study), pressure fluctuation amplitudes vary by less than 5%, remaining within acceptable engineering tolerances.
A 1:15 hydraulic model of the valve body under normal pressure conditions was built, with a focus on a filling valve. As shown in Figure 6, the model consists of an up-stream connecting channel, the valve section, a downstream flat-bottom channel be-hind the valve, and a downstream connecting channel. For the experiment, a double-panel, fully enclosed, reverse-arc valve with good performance for high-head dynamic opening and closing and vibration resistance was selected. The valve section’s channel opening dimensions are 3.0 × 4.0 m (width × height), with the outer radius of the reverse arc panel being 5.80 m and the inner panel radius being 5.18 m. The down-stream channel behind the valve adopts a “top gradual expansion + flat-bottom” design, with the maximum height of the channel increased by 0.4 m compared to the valve section.
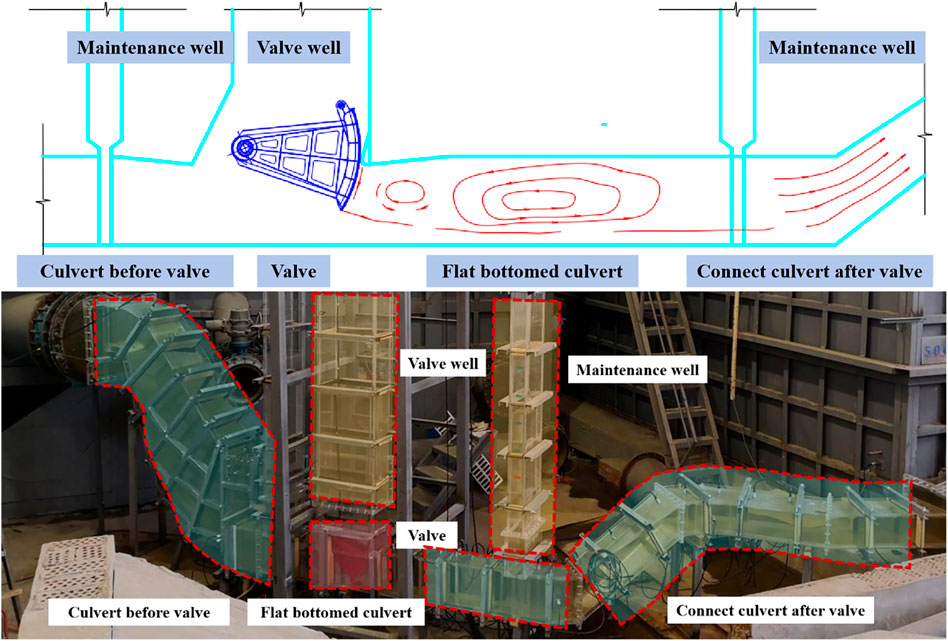
Figure 6. 1:15 hydraulic model of the valve body under normal pressure conditions: plan view and field experimental setup.
In the prototype, the valve opening and closing system adopts a mature vertical-cylinder hydraulic actuator scheme. The hydraulic actuator is well-suited for the valve’s lifting rod system and can suppress valve vibration to some extent. High-precision pulsating pressure sensors and tensile/compression sensors are used to measure the non-steady flow pressure in the channel and the valve opening and closing force characteristics. Six pressure sensors are arranged on the outer panel of the valve to monitor pressure information. The sensor layout is shown in Figure 7.
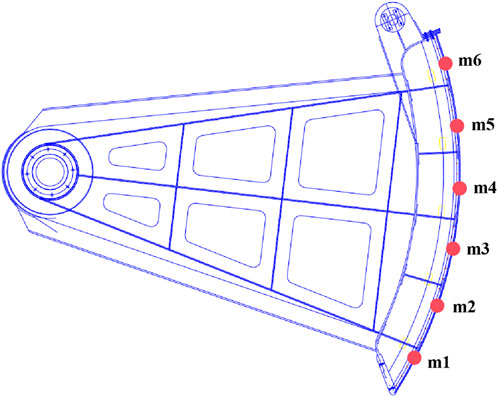
Figure 7. Schematic diagram of pressure monitoring point locations on the valve body.
3.2 Hydrodynamic characteristics of the valve body
Under the conditions of the maximum upstream navigation water level of 190.0 m and the minimum downstream navigation water level of 163.0 m, with a 7-min valve opening time, the pressure head process curve of the downstream valve panel is shown in Figure 8. When the valve opens to n = 0.10, n = 0.17, n = 0.26, n = 0.42, and n = 0.58, the pressure measurement points m6, m5, m4, m3, and m2 successively enter the gate sill gap section. Under the influence of the high-speed water flow in the gap, the pressure decreases sharply. When the valve opens to around n = 0.76, the m1 measurement point enters the gate sill gap section. At this point, the water head difference at the entrance and exit of the gap decreases, and the flow velocity of the gap water is lower, causing little variation in the pressure at the measurement point. After leaving the gate sill gap section and entering the valve chamber, the pressure head process curve at each measurement point is mainly controlled by the pressure in the valve chamber.
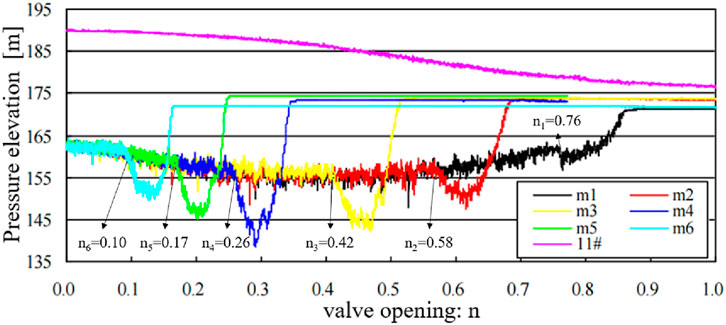
Figure 8. Pressure head process curve of the downstream valve panel measurement points (11# represents the valve chamber pressure head).
Pressure measurements in the valve chamber (11#) were obtained using a dedicated pressure sensor installed at the center of the chamber ceiling. When the opening ratio exceeds n > 0.76, the measurement points on the valve panel enter the valve chamber, where pressure readings become directly influenced by chamber pressure rather than gap flow dynamics. The results demonstrate that valve chamber pressure provides critical insights into energy dissipation processes as flow transitions from confined gap conditions to more stabilized chamber flow patterns.
The pressure distribution profiles recorded at measurement points M6 through M1, as illustrated in Figure 9, reveal significant hydrodynamic phenomena in the pier gap region. The observed negative pressure values demonstrate the development of localized suction effects and sub-atmospheric conditions within the high-velocity jet zone, consistent with Bernoulli’s principle governing pressure-velocity relationships in confined flows. These sub-atmospheric conditions, when sufficiently pronounced, may potentially induce cavitation if the local pressure falls below the vapor pressure of water. Detailed measurements show distinct pressure minima at specific gate openings: at n = 0.20, point M5 near the gate sill throat registers −4.20 m water column; at n = 0.30, point M4 records −9.00 m; and at n = 0.47, point M3 measures −4.80 m.
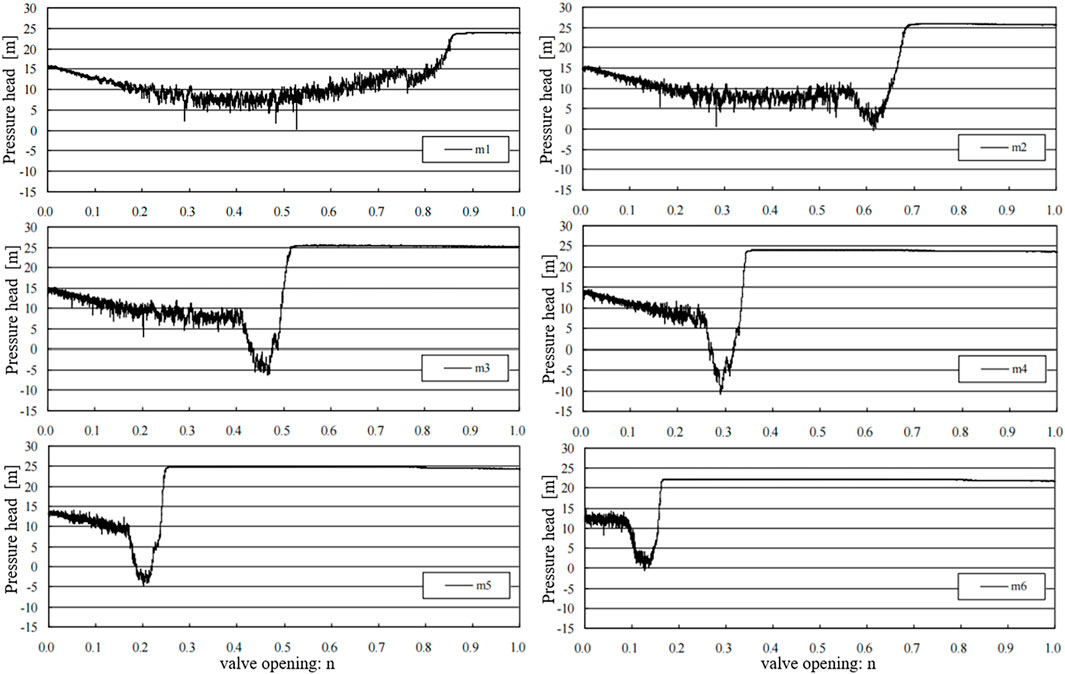
Figure 9. Pressure process curves of the m1-m6 measurement points on the valve outer panel.
The transition to positive pressure values occurs when the gate opening exceeds n = 0.5, marking a critical threshold in the system’s hydrodynamic behavior. Below this threshold, the negative pressure regime enables natural ventilation - a protective mechanism where atmospheric air is entrained through dedicated slots to form an air-water mixture that mitigates cavitation risks. This ventilation phenomenon ceases when the opening surpasses n = 0.5, as the resulting positive pressure conditions prevent air entrainment, eliminating this crucial cavitation protection. The precise identification of this transition point holds substantial implications for valve design optimization and operational safety protocols in hydraulic structures.
3.3 Valve body pressure fluctuations
Figure 10 illustrates the pressure fluctuations measured at multiple points on the valve body. Following valve opening, the pressure at downstream panel locations is predominantly affected by the flow structure developing behind the valve. The fluctuation patterns across all measurement points (m1–m5) exhibit systematic variations with valve opening degree. At n = 0.1, the fluctuation amplitude at m1 is only about 0.16 m water column, increasing gradually until peaking around 0.76 m water column near n = 0.5, then declining as the opening further expands and the point positions exceed the gap throat section. Points at higher elevations (m2–m5) show similar waveforms with distinct phase shifts. Specifically, the maximum fluctuation amplitude occurs at n = 0.52 for m2 (approximately 0.68 m water column), n = 0.37 for m3 (0.62 m), n = 0.21 for m4 (0.61 m), and n = 0.10 for m5 (0.52 m). This sequential shift arises because each sensor intersects the high-velocity jet region at different valve openings, with elevated points encountering critical flow conditions at larger openings. Due to its low elevation, m1 is immediately exposed to the jet flow through the valve-sill gap even at small openings, resulting in pronounced pressure drops consistent with Bernoulli’s principle. Under completely closed conditions (n = 0), the fluctuation is negligible, attributable mainly to minor water level oscillations in the upstream channel without significant flow. Once the points are submerged within the valve well, fluctuations diminish sharply due to the damping effect of the well water level. (Wang et al., 2023) results show that the peak fluctuation of ordinary fan valves usually occurs in the range of n = 0.3–0.4. The reverse design of this study effectively delays the occurrence of high fluctuation zone and provides a wider safety window for valve operation.
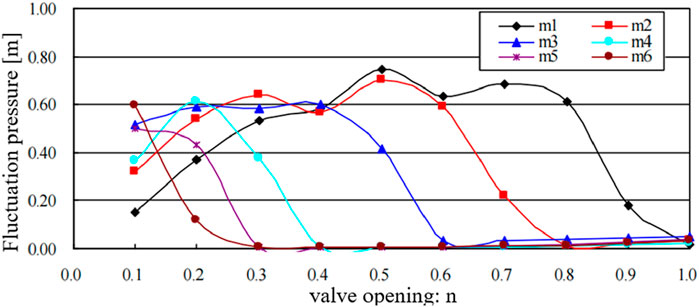
Figure 10. Pressure fluctuations on the valve downstream panel.
3.4 Hydrodynamic characteristics of the valve body
The frequent opening and closing of the ship lock gate valve, combined with the complex operating conditions, presents significant challenges in the design and construction of ship locks. Besides hydrodynamic loads, cavitation characteristics, and anti-cavitation measures, which are critical technical issues in ship lock design, ensuring the reliability and flexibility of the valve system is also a key focus for designers. The opening and closing force of the valve is directly related to the design of both the valve structure and the capacity of the opening/closing mechanism. The calculation formulas for the reverse arc valve opening and closing force as shown in Equations 6, 7:
Where Fw is the closing force of the gate, When Fw > 0, external force is required to close the gate, while when Fw < 0, the gate can be closed by its own weight, FQ is the opening force of the gate, r0, r1, r2, r3, r4 are the moments of forces acting on the pivot point of the arc-shaped gate. These include the rotational hinge resistance, the water-stop resistance, the weight of the gate, the upward lift, and the downward suction force, R1, R2 are the moments of forces caused by added weight (or downward pressure) and the opening force at the pivot of the arc-shaped gate, Tzd represents the rotational frictional resistance, Tzs represents the hydraulic resistance, F1,F2 represent the upward lift and downward suction forces, respectively.
In the experimental model, a high-precision tension-compression sensor was employed to measure the opening and closing forces of the gate. To eliminate the influence of the weight difference between the prototype and the model gate on the hydrodynamic opening force, the net hydrodynamic opening force—defined as the difference between the hydrodynamic and hydrostatic opening forces—is typically used to characterize the effect of flow on the gate operation system.
When the gate is opened with a timing parameter of tv1 = 7 min, the time-history curves of the hydrodynamic opening force, hydrostatic opening force, and net hydrodynamic opening force are shown in Figure 11. During the gate opening process, the opening force initially increases and then decreases. After the top sealing of the gate separates from the sill, the hydrodynamic opening force gradually increases. A peak opening force occurs when the gate opening ratio is in the range of n = 0.2–0.4, indicating that the downward suction at the bottom edge of the gate reaches its maximum. Subsequently, the opening force gradually decreases. When the gate is opened at tv1 = 7 min, the maximum net hydrodynamic opening force reaches 200 kN.
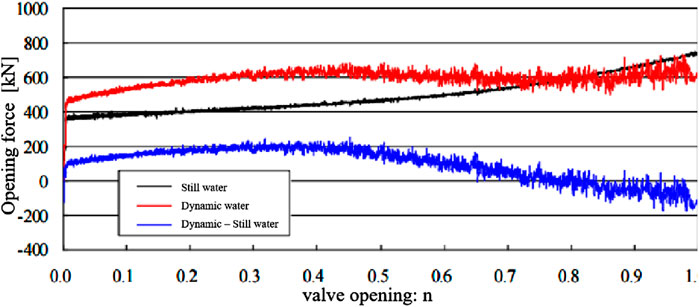
Figure 11. Time history of net hydrodynamic opening force of the gate under flow conditions (tv = 420 s).
When the gate is fully opened at a rate corresponding to tv1 = 7 min, followed by a brief pause and then closed at a rate of tv2 = 3 min, the time-history curves of the hydrodynamic and hydrostatic forces during opening and closing are shown in Figure 12, and the net hydrodynamic force curve is presented in Figure 13. The closing force exhibits a characteristic “decrease–increase–decrease” trend.
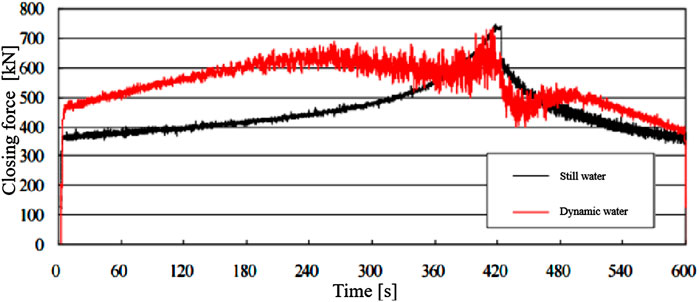
Figure 12. Time histories of hydrodynamic and hydrostatic forces during gate opening and closing.
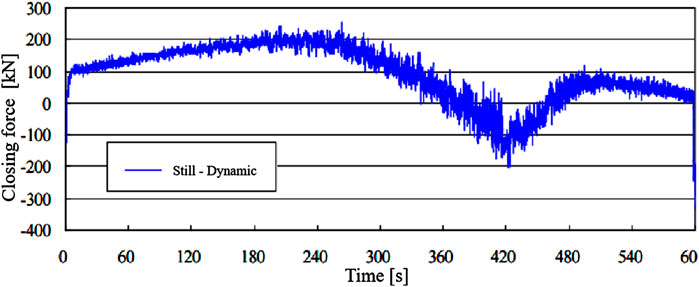
Figure 13. Time history of net hydrodynamic force during gate opening and closure.
At the initial stage of gate closure, the rapid rise in the well water level enhances the upward thrust on the gate, resulting in a sharp drop in the closing force, reaching a minimum. The minimum net hydrodynamic closing force is approximately −150 kN. Since no side sealing or top sealing is applied to the model gate, additional resistance components such as side sealing friction and top sealing friction—both of which are present in the prototype, especially near full closure—must be carefully considered in the structural weight design of the gate.
As the closure continues, the closing force increases gradually due to the weakening of the upward thrust and the strengthening of the downward suction force exerted by the mainstream on the bottom edge of the gate. The dominant hydraulic action transitions from lift to suction. When the gate opening ratio reaches n = 0.55, the closing force peaks.
3.5 Hydrodynamic load characteristics of the gate segment during flow-induced closure
Under high head and large flow conditions, the closure of the gate under flow (i.e., dynamic water closure) results in a sudden change in flow velocity due to flow inertia. This produces a negative pressure wave phenomenon in the culvert, characterized by a rapid pressure rise upstream of the gate and a simultaneous pressure drop down-stream. As a result, the hydraulic head acting on the gate increases, and the operating conditions of the gate deteriorate significantly.
The magnitude of the pressure variation on both sides of the gate is influenced by several factors, including the gate opening and closing rates (tv1 and tv2), the duration of the interval between gate opening and closing, and the closure opening ratio n. From the perspective of enhancing the operational safety and reliability of the navigation lock, the hydrodynamic loads acting on the gate and culvert section under accidental shutdown or emergency dynamic closure at any opening position are of critical importance.
The water level in the gate well, the downstream pressure, the resultant hydraulic head acting on the gate, and the hydrodynamic load coefficient of the gate are calculated as shown in Equations 8–11:
where:
When the gate is opened at a rate of tv1 = 7 min to different opening positions and then subjected to emergency closure at a rate of tv2 = 3 min, the variations in gate well water level, top pressure in the downstream culvert, and the hydrodynamic load coefficient with respect to gate closure opening are shown in Figure 14. (1) As illustrated in the figure, a pressure surge is observed in the gate well during emergency braking at all tested opening positions. The larger the gate opening at the moment of emergency braking, the lower the pressure head in the gate well. After the gate is fully closed following the braking event, the pressure in the gate well rises and stabilizes at the same level across all conditions. (2) The maximum hydrodynamic load coefficient reaches approximately 1.22, occurring at a gate opening ratio of n = 0.3, indicating that under this condition, the gate experiences the most severe hydrodynamic loading during flow-induced closure. At an opening ratio of n = 0.3, the flow passage geometry between the valve and the sill forms a critical transition zone, inducing significant flow separation at the sill edge and generating a strong shear layer. Under this condition, the high-velocity jet interacts with the downstream recirculation zone at the bottom panel of the valve, creating two symmetric vortex structures. The periodic shedding of these vortices induces pronounced fluid-structure interaction effects with the valve motion. At other opening positions, the hydrodynamic load coefficient generally decreases with increasing closure opening. Based on this analysis, it is recommended that a “descending velocity profile” be adopted in the gate control strategy—i.e., a non-uniform closing rate. This approach can mitigate the impact force exerted by the gate on the bottom slab and reduce the excessive rise in gate well water level caused by rapid closure, thereby lowering the hydrodynamic load coefficient acting on the gate.
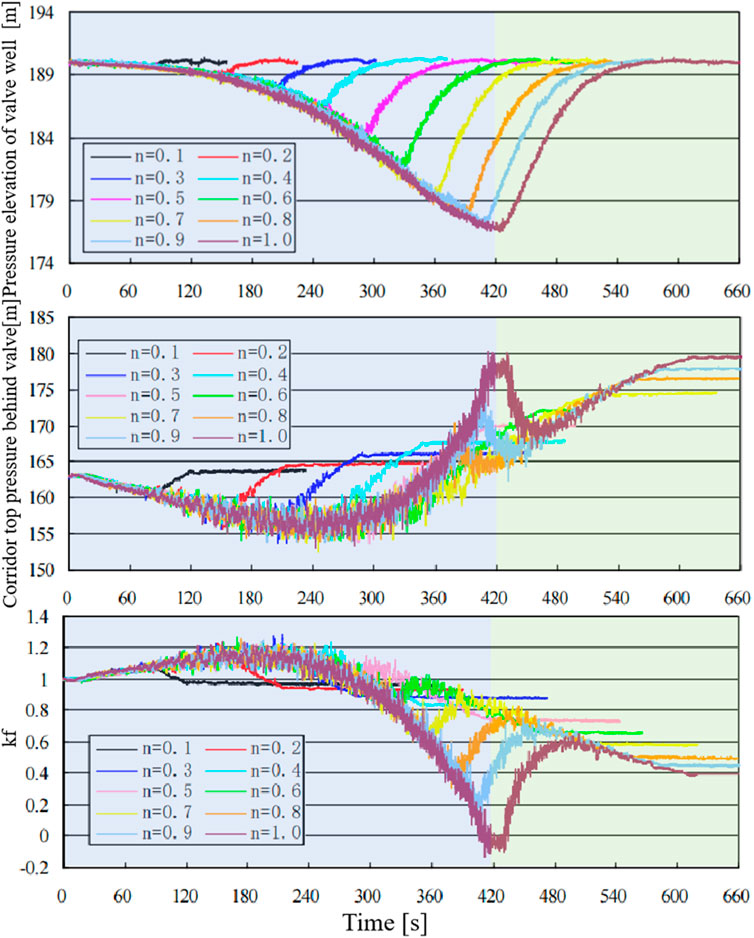
Figure 14. Variation of gate well water level, downstream culvert top pressure, and hydrodynamic load coefficient with gate opening.
3.6 Effect of opening rate on hydrodynamic load
The variations in gate well water level, downstream pressure, and hydrodynamic load coefficient with respect to the opening rate are shown in Figure 15. As illustrated in the figure: (1) The faster the opening rate, the greater the drop in the gate well water level. When the gate opens at rates of tv1 = 5 min∼9 min, the corresponding drops in the gate well water level are 15.62 m, 14.54 m, 13.47 m, 12.09 m, and 11.26 m, respectively. (2) The variation trend of the downstream pressure is the opposite: as the opening rate increases, the rate of increase in the downstream pressure gradually decreases. When the gate opens at rates of tv1 = 5 min∼9 min, the increases in the top pressure in the downstream culvert are 14.87 m, 16.28 m, 17.36 m, 18.43 m, and 19.27 m, respectively. (3) The effect of opening rate on the hydrodynamic load coefficient is not significant. When the gate opens at different rates, the hydrodynamic load coefficients are 1.18, 1.16, 1.15, 1.13, and 1.12, respectively. After the gate reaches full opening and is closed at a rate of tv2 = 3 min, the hydrodynamic load coefficients during closure are 0.78, 0.67, 0.59, 0.57, and 0.50, respectively. These coefficients increase with the opening rate but are all smaller than the hydrodynamic load coefficients during the opening process.
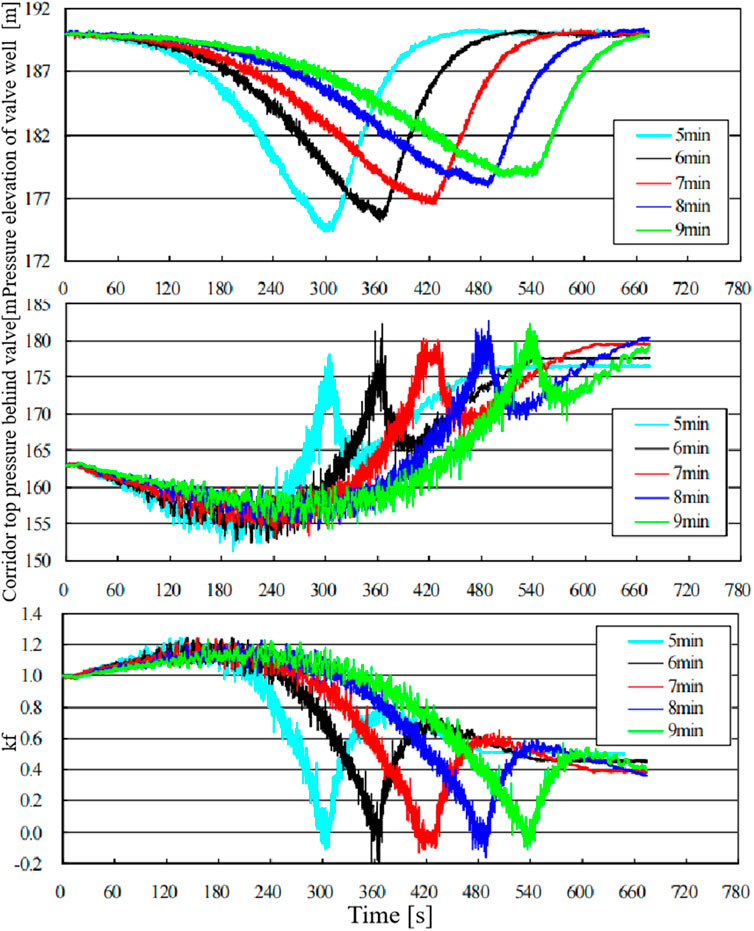
Figure 15. Variation of gate well water level, downstream culvert top pressure, and hydrodynamic load coefficient at different opening rates.
4 Conclusion
Through three-dimensional finite element static-dynamic numerical analysis and model experiments, the force-deformation characteristics and hydrodynamic characteristics of the floodgate valve under different conditions were investigated. The following conclusions were drawn:
1. Under the conditions of water retention, gate opening, and dynamic water closure, the valve deformation is generally small. The maximum displacement is 2.74 mm, which occurs at the center of the panel between the first and second crossbeams at the bottom of the valve. The equivalent stress of the valve is generally within 100 MPa, with the maximum equivalent stress being 142.4 MPa, occurring at the connection between the crossbeam and the panel, indicating stress concentration. Both the maximum displacement and stress occur under the dynamic water closure condition with a 1.8 dynamic load factor. The calculation of the natural frequency indicates that the first mode frequency of the valve is 14.734 Hz, which is well above the high-energy region of flow-induced excitation, and the likelihood of resonance or severe vibration under random flow-induced loads is low.
2. The structural design of the valve is generally reasonable. From the perspective of dynamic water closure requirements, it is recommended to appropriately increase the structural dimensions of the valve. This will increase the self-weight of the valve, improving the reliability of dynamic water closure, while also reducing the deformation and stress levels. Based on the valve’s structural dimensions and force-deformation characteristics, it is suggested to increase the thickness of the outer panel from 20 mm to 24–30 mm.
3. During the gate opening process, measurement points gradually enter the gap segment of the gate. In this area, the flow area is relatively small, and high-velocity gap flow is formed, causing a rapid pressure drop and an increase in pressure fluctuations. As the valve opening further increases, the measurement points enter the valve well, where the pressure stabilizes due to the water level in the well, and the amplitude of the fluctuations sharply decreases. Analysis of the pressure process lines at each measurement point shows that the gate sill can naturally ventilate up to a gate opening of n = 0.5, but above this opening, the gate sill cannot naturally ventilate.
4. The hydrodynamic load coefficient was defined for the valve under different operating conditions, and the influence of instantaneous valve closure at different opening positions and the effect of different opening rates on the hydrodynamic load coefficient were discussed. The results show that the maximum hydrodynamic load occurs during dynamic water closure at n = 0.3, while the hydrodynamic load coefficient decreases with increasing closure opening at other conditions. Additionally, the opening rate has a relatively small effect on the hydrodynamic load coefficient.
Data availability statement
The raw data supporting the conclusions of this article will be made available by the authors, without undue reservation.
Author contributions
YL: Writing – original draft, Funding acquisition, Formal Analysis, Methodology, Conceptualization, Validation. NW: Writing – review and editing, Validation, Conceptualization, Supervision, Resources, Methodology. TK: Writing – original draft, Conceptualization, Validation, Methodology, Data curation. YY: Validation, Writing – original draft. JN: Project administration, Writing – review and editing. JC: Writing – review and editing, Investigation.
Funding
The author(s) declare that financial support was received for the research and/or publication of this article. This research was funded by Hunan transportation science and technology project grant number (202512) and The APC was funded by Department of Transportation of Hunan Province in this section.
Acknowledgments
We the thank Nanjing Hydraulic Research institute for providing us with a physical model testing site.
Conflict of interest
Authors YL, NW, TK, YY, and JN were employed by Hunan Province Communications Planning, Survey & Design Institute Co., Ltd.
The remaining author declares that the research was conducted in the absence of any commercial or financial relationships that could be construed as a potential conflict of interest.
Generative AI statement
The author(s) declare that no Generative AI was used in the creation of this manuscript.
Any alternative text (alt text) provided alongside figures in this article has been generated by Frontiers with the support of artificial intelligence and reasonable efforts have been made to ensure accuracy, including review by the authors wherever possible. If you identify any issues, please contact us.
Publisher’s note
All claims expressed in this article are solely those of the authors and do not necessarily represent those of their affiliated organizations, or those of the publisher, the editors and the reviewers. Any product that may be evaluated in this article, or claim that may be made by its manufacturer, is not guaranteed or endorsed by the publisher.
References
Cavallaro, L., Iuppa, C., Scandura, P., and Foti, E. (2020). Wave-induced loads on a lock gate provided with an opening through the ballast tank. J. Ocean. Eng. Mar. Energy 6, 415–425. doi:10.1007/s40722-020-00180-w
Duan, Y., Ma, D., Gan, W., Ji, C., and Zhou, J. (2025). Experimental study on the hydraulic characteristics and shape optimization of ship lock water conveyance systems. J. Mar. Sci. Eng. 13, 784. doi:10.3390/jmse13040784
Lauria, A., Calomino, F., Alfonsi, G., and D’Ippolito, A. (2020). Discharge coefficients for sluice gates set in weirs at different upstream wall inclinations. Water 12, 245. doi:10.3390/w12010245
Lazzarin, T., Viero, D. P., Defina, A., and Cozzolino, L. (2023). Flow under vertical sluice gates: flow stability at large gate opening and disambiguation of partial dam-break multiple solutions. Phys. Fluids 35, 024114. doi:10.1063/5.0131953
Lee, S. O., Seong, H., and Kang, J. W. (2018). Flow-induced vibration of a radial gate at various opening heights. Eng. Appl. Comput. Fluid Mech. 12, 567–583. doi:10.1080/19942060.2018.1479662
Li, J., Hu, Y., Wang, X., and Diao, M. (2023). Operation safety evaluation system of ship lock based on extension evaluation and combination weighting method. J. Hydroinf. 25, 755–781. doi:10.2166/hydro.2023.130
Liu, F., Xu, C., Liu, M., Yi, R., and Zhang, Y. (2024). Insights into the vibration characteristics of spatial radial gate affected by fluid-structure interaction. J. Mar. Sci. Eng. 12, 1804. doi:10.3390/jmse12101804
Lu, X., Liu, Y., Tan, S., Bao, W., Lu, Y., and Zhao, X. (2024). Study on the fluctuating load characteristics of the submerged radial gate in the high-head flood discharge outlet. Appl. Sci.-Basel 14, 7470. doi:10.3390/app14177470
Marashi, A., Kouchakzadeh, S., Yonesi, H. A., and Torabi-Poudeh, H. (2021). Hydraulics of rotary gate: novel structure for semicircular canals. J. Irrig. Drain. Eng. 147, 04021003. doi:10.1061/(ASCE)IR.1943-4774.0001537
Santic, I., Mauro, S., and Felli, M. (2024). Experimental investigation of the hydrodynamic and acoustic performance of a gate rudder® system over a conventional rudder. Ocean. Eng. 314, 119742. doi:10.1016/j.oceaneng.2024.119742
Smok, S., Kizilaslan, M. A., Kurumus, A., and Demirel, E. (2022). Experimental study of hydrodynamic pressures acting on a submerged gate. Tek. Dergi 33, 12163–12182. doi:10.18400/tekderg.707668
Song, C. G., Park, S. W., and Shin, J. (2024). An experimental study of flow and turbulence properties near the rising sector gate mouth considering the gate opening with a PIV measuring system. Water 16, 3004. doi:10.3390/w16203004
Tong, Z., Yang, Z., Huang, Q., and Yao, Q. (2022). Numerical modeling of the hydrodynamic performance of slanted axial-flow urban drainage pumps at shut-off condition. Energies 15, 1905. doi:10.3390/en15051905
Viero, D. P., and Defina, A. (2019). Multiple states in the flow through a sluice gate. J. Hydraul. Res. 57, 39–50. doi:10.1080/00221686.2018.1434694
Wang, T., and Li, T. (2022). Ship lock management and dynamic congestion toll for ships. Ocean. Coast. Manage 230, 106369. doi:10.1016/j.ocecoaman.2022.106369
Wang, J., Hu, Y., Chen, L., Hu, R., and Yuan, H. (2023). Effect of aeration on the cavitation characteristics of the control valve in hydro-driven ship lifts. Water 15, 4014. doi:10.3390/w15224014
Wu, B., Hu, Y., Wang, X., and Yan, X. (2021). Experimental and CFD study on the optimization of valve lintel’s structural parameters under critical self-aerated conditions. Eng. Appl. Comput. Fluid Mech. 15, 1629–1644. doi:10.1080/19942060.2021.1975572
Xin, Q., Wang, Y., Zhang, M., Wang, R., and Wang, Y. (2024). Quantitative analysis of influencing factors on changzhou ship lock capacity. Appl. Sci.-Basel 14, 4958. doi:10.3390/app14114958
Xu, C., Wang, Z., Zhang, H., Li, H., and Li, D. (2022). Investigation on mode-coupling parametric vibrations and instability of spillway radial gates under hydrodynamic excitation. Appl. Math. Modell. 106, 715–741. doi:10.1016/j.apm.2022.02.013
Keywords: lock filling valve, finite element analysis, structural load distribution, vibration modes, valve hydrodynamics
Citation: Liu Y, Wang N, Kuang T, Ye Y, Niu J and Cai J (2025) Investigation of the mechanical and hydrodynamic behavior of lock gates under high head conditions. Front. Built Environ. 11:1643989. doi: 10.3389/fbuil.2025.1643989
Received: 07 August 2025; Accepted: 19 September 2025;
Published: 16 October 2025.
Edited by:
Izuru Takewaki, Kyoto Arts and Crafts University, JapanReviewed by:
Kohei Fujita, Kyoto University, JapanJunwei Zhou, Tianjin Research Institute of Water Transport Engineering, China
Copyright © 2025 Liu, Wang, Kuang, Ye, Niu and Cai. This is an open-access article distributed under the terms of the Creative Commons Attribution License (CC BY). The use, distribution or reproduction in other forums is permitted, provided the original author(s) and the copyright owner(s) are credited and that the original publication in this journal is cited, in accordance with accepted academic practice. No use, distribution or reproduction is permitted which does not comply with these terms.
*Correspondence: Neng Wang, MTM2ODczMjEzMjVAMTYzLmNvbQ==