 Paul A. Korswagen
 Jeremy D. Bricker
 Sebastiaan N. Jonkman2
- 1Department of Materials, Mechanics, Management and Design, Faculty of Civil Engineering and Geosciences, Delft University of Technology, Delft, Netherlands
- 2Department of Hydraulic Engineering, Faculty of Civil Engineering and Geosciences, Delft University of Technology, Delft, Netherlands
- 3Department of Civil and Environmental Engineering, University of Michigan, Ann Arbor, MI, United States
- 4HKV Lijn in Water, Lelystad, Netherlands
The structural response of masonry walls during flood events is a critical concern for the flood resilience of (Dutch) buildings, as they typically constitute part of the load-bearing structure. This study investigates the out-of-plane behaviour of a full-scale single-wythe fired-clay-brick masonry wall under out-of-plane hydrostatic pressure and debris impact loads. Experimental tests were conducted on a 2.7 × 2.7 m masonry wall subjected to a vertical pre-compression and simultaneously varying water levels and debris impacts at the Flood Proof Holland facility in Delft, the Netherlands. Results demonstrated that the wall remained within the linear-elastic regime up to a water depth of approximately 90 cm when the interior side was dry. Beyond this threshold, crack initiation and stress redistribution occurred, leading to significant deformation. On the basis of calibrated models, failure was predicted at approximately 150 cm water depth for a fully restrained wall. Debris impact tests showed that soft debris, represented by a floating log, caused negligible additional damage, whereas repeated impacts with a steel cube (hard debris) resulted in progressive cracking and local failure, particularly at higher water levels. Numerical models, including analytical, linear-elastic finite element method (FEM), and non-linear FE approaches, were calibrated using the experimental data. While one-way bending models predicted conservative failure thresholds, two-way, non-linear models accurately captured the wall’s deformation and cracking behaviour, demonstrating the importance of lateral boundary constraints in determining wall capacity and stability. The findings emphasise that traditional masonry walls in Dutch buildings can safely withstand water depths up to 90 cm without significant damage. However, higher water levels or hard debris impacts pose substantial risks, highlighting the need for improved flood resilience strategies. Future work should focus on cavity wall systems, leakage effects, and the behaviour of walls with openings.
1 Introduction
Floods have a significant societal impact, particularly due to extensive damage to structures. This has been clearly demonstrated in major flood events, such as Hurricane Katrina in New Orleans (Pistrika and Jonkman, 2009) and the Ahr Valley flood in Germany (Wüthrich et al., 2024).
Flood resilience is a critical concern for the Netherlands, where much of the country’s infrastructure and residential buildings lie in low-lying regions vulnerable to flooding. Despite extensive flood protection systems, recent events (Wüthrich et al., 2024; Brussee et al., 2020; Amiri et al., 2025) have demonstrated that structural failures can occur under extreme loading conditions, posing risks to both infrastructure and occupant safety. Traditional unreinforced masonry (URM) walls, commonly used in Dutch buildings (Arup, 2018), are particularly susceptible to flood-induced damage due to their brittle behaviour under out-of-plane bending stresses and their limited ability to resist dynamic debris impacts (Jansen et al., 2020). About seven million buildings in the Netherlands have load-bearing structures with unreinforced masonry walls (Arup, 2018).
While previous studies have focused on the global performance of masonry structures under seismic or static loads (Korswagen et al., 2022), research specifically addressing flood loading scenarios, including hydrostatic pressures and debris impacts, remains scarce (Iasio et al., 2024). Current predictive models often simplify wall behaviour, neglecting critical phenomena such as crack development, stress redistribution, and the influence of boundary conditions (Iasio et al., 2023). As such, there is a pressing need for experimental data and validated models to assess the true flood resilience of masonry walls.
Recent studies have advanced the understanding of URM structures’ vulnerability to flood events. Xiao and Li (Xiao et al., 2021) conducted numerical simulations to assess flood impacts on masonry buildings, revealing that increasing mortar strength can decelerate damage progression but does not significantly enhance deformation resistance. Conversely, integrating reinforced concrete (RC) columns and beams not only delays structural damage but also reduces stresses within brick and mortar elements, thereby improving overall structural integrity during flood exposure. A comprehensive review by Zhang et al. (2024) examined the multi-hazard vulnerability of masonry buildings, emphasising that natural disasters such as floods, earthquakes, and landslides are primary contributors to structural damage. The study highlighted the importance of employing diverse assessment methods—including on-site investigations, laboratory experiments, and numerical simulations—to accurately evaluate damage mechanisms and inform effective strengthening strategies.
Additionally, research has focused on developing collapse fragility models for URM buildings subjected to flood and flow-type landslide actions (Moaiyedfar et al., 2025). These models aim to predict the probability of structural failure under varying hazard intensities, thereby aiding in the formulation of risk mitigation strategies and the enhancement of building codes to improve flood resilience. Platt et al. (2020) investigated the performance of masonry walls under combined out-of-plane loading and saturated conditions, finding that water saturation significantly reduces the structural capacity of masonry walls during flood events. Platt (Kelman and Spence, 2004) summarised factors influencing masonry wall performance during floods, including hydrostatic and hydrodynamic effects, erosion, buoyancy, and debris impact, highlighting the complexity of flood-induced damage mechanisms. Kelman and Spence (Cuomo et al., 2004) emphasised the significance of lateral hydrostatic and hydrodynamic forces, as well as direct water contact effects, as primary contributors to flood damage in masonry structures.
A study by Cuomo et al. (Drdácký, 2010) suggested that impulsive loading during floods might be critical for assessing the vulnerability of existing structures and designing new flood-proof buildings, indicating that traditional prediction methods may underestimate these effects. Drdácký (Kreibich et al., 2005) examined the impact of flooding on heritage structures, noting that historic masonry buildings often suffer from material degradation and structural weakening due to prolonged water exposure. Kreibich et al. (Schwarz and Maiwald, 2008) conducted interviews with households affected by the 2002 Elbe river flood, finding that buildings with precautionary measures experienced less damage, underscoring the importance of proactive flood resilience strategies for masonry structures. Schwarz and Maiwald (Damiola et al., 2018) developed a method to determine structural damage of buildings for any given flood scenario, providing a framework for assessing and mitigating flood risks in masonry structures. Recent events in Germany (Wüthrich et al., 2024) have shown that debris-related loads are particularly relevant (Chen et al., 2012).
Damage curves for masonry buildings have been developed. The Clausen criterion (Clausen and Clark, 1990) established a maximum value for the product of flood depth and velocity to limit structural damage. Jansen et al. (2020) also produced damage curves based on pressure coefficients and simple structural models. Roos, (2003) studied the relationship between water depth and building damage. Similarly, Huizinga et al. (2017) worked on flood depth-damage functions, and Asselman, (2005) investigated the consequences of building damage in terms of casualties. Rikkert et al. (2025) integrates these findings to determine fatality functions due to flood hazards.
Moreover, damage curves can also be generated from insurance claims data combined with models of flood characteristics (Diaz Loaiza et al., 2022). These empirical curves provide a valuable validation source for physically or numerically derived models, but the latter still require more in-depth testing to improve their input parameters. Two main knowledge gaps remain: the lack of empirical information on the capacity of masonry buildings during floods, and limited understanding of how well structural models align with actual building performance.
Previous studies have advanced knowledge on masonry performance, yet several limitations persist in the context of flood-specific loading. Most research has focused on seismic or static lateral actions rather than hydrostatic pressures or debris impacts; for example, Platt et al. (2020) and Drdácký (Kreibich et al., 2005) considered saturation and heritage structures, but not rising water levels. Full-scale flood tests are rare; available work often relies on laboratory airbag simulations (Jafari et al., 2017) or post-event surveys (Wüthrich et al., 2024), which cannot fully capture progressive wall behaviour. Analytical approaches typically assume one-way bending and neglect cracking, stress redistribution, and boundary effects (Jansen et al., 2020; Clausen and Clark, 1990; Kowalewski and Gajewski, 2015; Lawrence and Marshall, 2000), while debris impacts have received little systematic attention, especially regarding the different effects of soft versus hard debris (Iasio et al., 2024; Kelman and Spence, 2004; Cuomo et al., 2004; Chen et al., 2012). Numerical simulations of masonry under floods exist (Xiao et al., 2021; Moaiyedfar et al., 2025), but they are seldom calibrated against experimental benchmarks, limiting their use in fragility or risk models (Zhang et al., 2024).
This paper directly addresses these gaps by combining full-scale hydrostatic and debris impact tests with calibrated analytical and non-linear finite element models. The novelty lies in empirically quantifying the out-of-plane capacity of masonry walls under realistic flood loading, distinguishing between debris types, and demonstrating the critical role of two-way bending and boundary restraint. In the Dutch context, where millions of dwellings rely on unreinforced masonry as load-bearing walls, existing depth-damage functions and design guidance are often extrapolated from seismic analogies or simplified static models. This can lead to either overly conservative retrofitting or underestimation of collapse risk. By delivering calibrated experimental evidence and validated non-linear models, this study establishes defensible thresholds for safe water depths, clarifies the influence of restraint and pre-compression, and identifies conditions where debris impacts accelerate failure. These insights support more reliable fragility curves, prioritisation of strengthening measures, and practical guidance for flood emergency management.
The primary objectives of this paper are thus, to:
• investigate the out-of-plane deformation and failure mechanisms of a full-scale URM wall under increasing hydrostatic pressures.
• evaluate the impact of dynamic debris loads on the structural integrity of the wall, distinguishing between soft and hard debris effects.
• compare experimental observations with analytical and numerical models.
To achieve these objectives, a ×2.7 2.7 m single-wythe masonry wall was constructed and tested under controlled conditions at the Flood Proof Holland facility. The wall was subjected to incremental hydrostatic pressures up to 125 cm water depth, combined with vertical pre-compression to simulate realistic building loads. In addition, debris impact tests were performed using a floating tree log to represent soft debris and a steel cube pendulum to simulate hard debris impacts.
The experimental setup, shown in Figures 1, 2, included a custom-designed steel rig to provide vertical and lateral boundary restraints. Hydrostatic pressure was applied by gradually filling a water basin in front of the wall, while displacement sensors and pressure gauges monitored the deformation response throughout the tests.
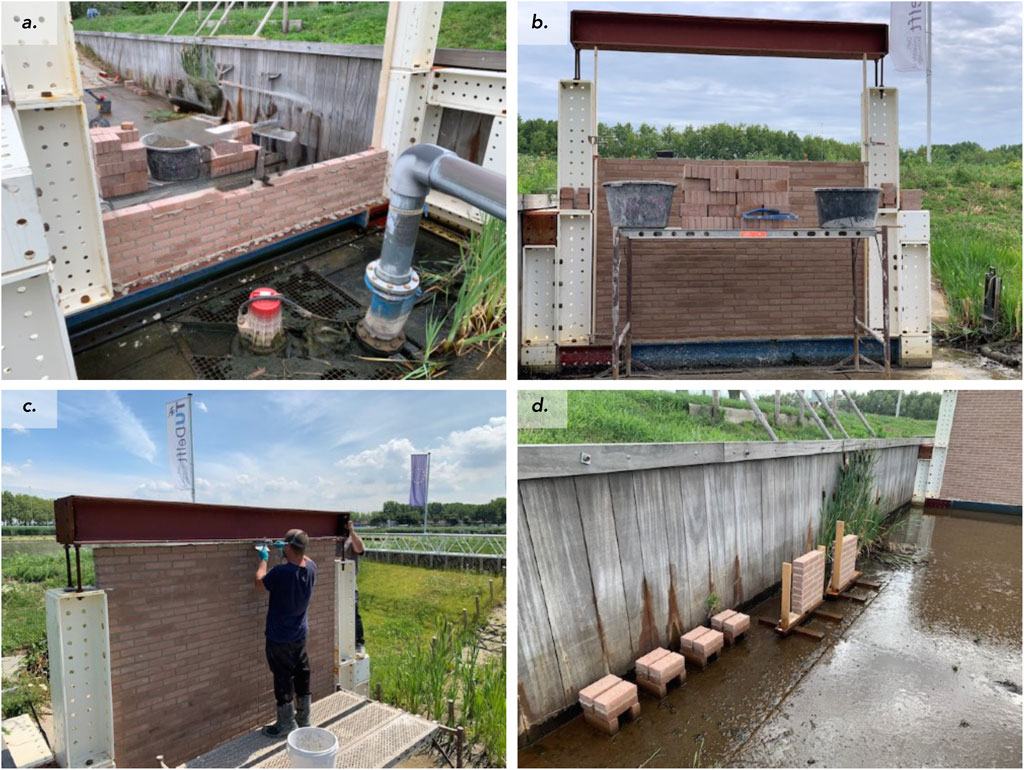
Figure 1. Construction process of the masonry wall and companion specimens by professional masons. View from the back (a), and front of the wall (b), including glueing of the last course to the top steel beam (c) and the companion specimens (d).
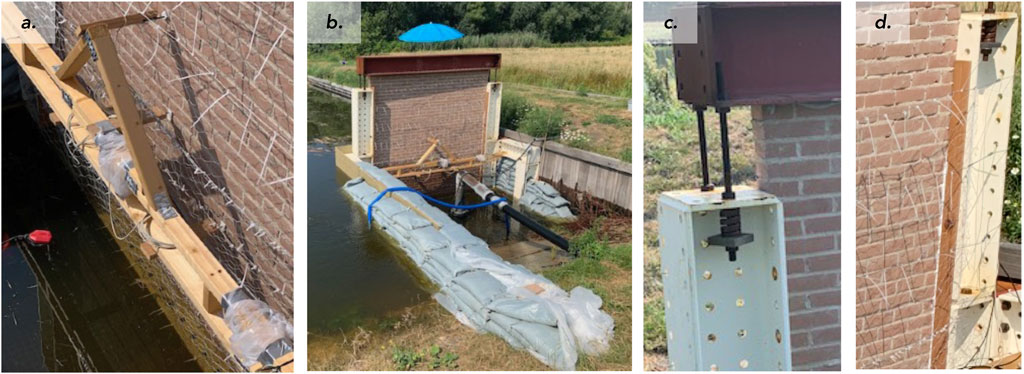
Figure 2. Experimental setup with steel rig, instrumentation, and water control system. (a) Timber support for 3 potentiometers, (b) dike made from sand bags and pump, (c) spring for application of vertical force on the masonry wall, and (d) timber support at the sides.
Companion tests were also conducted to characterise the material properties of the masonry. These included bond-wrench tests for tensile bond strength and compression wallet tests for compressive strength and Young’s modulus. These material parameters were later incorporated into analytical and finite element models to enable a direct comparison between experimental and numerical results.
By combining full-scale experimental data with validated numerical models, this study advances the understanding of flood resilience in masonry buildings. It addresses important knowledge gaps by capturing the onset of cracking, stress redistribution, and damage progression under hydrostatic and impact loads. The development and calibration of non-linear finite element models using the Total Strain Rotating Crack Model (TSRCM) enable accurate simulation of masonry behaviour, providing empirical benchmarks for fragility curves, structural assessments, and mitigation strategies in flood-prone areas.
This study is novel in that it combines full-scale experimental testing with calibrated numerical modelling to capture the out-of-plane response of unreinforced masonry walls under flood-specific loads. Unlike previous research that relied primarily on small-scale tests, seismic analogies, or simplified analytical models, this work provides empirical evidence of hydrostatic capacity, crack initiation, and progressive failure mechanisms under realistic boundary conditions and vertical pre-compression. By explicitly distinguishing the effects of soft and hard debris impacts and demonstrating the critical role of two-way bending and lateral restraint, the study advances both scientific understanding and practical assessment methods for the flood resilience of masonry buildings.
This paper is organised as follows: Section 2 describes the experimental methodology, including wall construction, testing setup, and protocols. Section 3 presents the results of hydrostatic pressure and debris impact tests, while Section 4 compares these results with analytical and numerical models. The key findings are discussed in Section 5, followed by conclusions and recommendations for future work in Section 6.
2 Experimental methodology
To investigate the behaviour of unreinforced masonry walls under flood conditions, a series of full-scale experiments are planned at the Flood Proof Holland facility. These experiments aim to measure the wall’s out-of-plane deformation and damage progression when subjected to increasing hydrostatic pressures and debris impacts. Additionally, companion material tests were performed to characterise the mechanical properties of the masonry, which were essential for subsequent numerical analyses.
2.1 Test wall construction and materials
A single-wythe masonry wall was constructed to replicate typical fired-clay brick walls commonly found in Dutch buildings (Jafari et al., 2017). The wall measured 2.7 × 2.7 m, with a thickness of 100 mm, and was built using standard ‘waalformaat’ fired-clay bricks measuring 210 × 50 × 100 mm.
The wall was laid in a standard stretcher bond pattern, with each course offset by half a brick length. Mortar joints were 10 mm thick, made from a pre-mixed mortar consisting of cement, lime, and sand in a ratio of approximately 1.3:5.5:1 by weight. The water in mortar mix was adjusted slightly on-site to account for weather conditions during construction; see Figure 1.
To ensure the wall remained securely in place during testing, the first and last brick courses were glued to the bottom and top steel beams of the rig using two-component epoxy mortar. The lateral edges of the wall were left dry against the steel columns, with flexible timber profiles bolted to the rig to provide lateral support on the backside edges of the wall.
To characterise the masonry properties, companion specimens were built alongside the test wall. These included six bond-wrench couplets and two compression wallets, which were later used to determine tensile bond strength, compressive strength, and Young’s modulus of elasticity. Both wall and companion specimens were built on the same day with the same mortar and configuration. The specimens were cured next to the wall for approximately 8 weeks to ensure comparable material properties.
2.2 Experimental setup
The masonry wall was installed within a custom-designed steel testing rig, engineered to replicate realistic boundary conditions and flood loading scenarios. The rig consisted of H-profile steel beams, bolted together to provide strong vertical and lateral supports.
• The bottom edge of the wall was fixed to the steel frame.
• The top edge was vertically restrained using a spring mechanism, which applied a pre-compression force to simulate the effects of vertical gravity loads. The maximum overburden on the wall was about 100 kPa and could be adjusted.
• The lateral edges were constrained using semi-flexible timber profiles, bolted to the rig, and filled with acrylic sealant to reduce movement and leakage.
The rig was placed inside a water basin, where hydrostatic pressure was applied by gradually filling the basin with water. The setup allowed creating a head (difference) over the wall. An impermeable sandbag dike, lined with plastic sheeting, was constructed to isolate the back of the test area and allow controlled water level adjustments; see Figures 2, 3. Instrumentation was installed to monitor wall deformation and water levels during the tests, see Figure 4.
• Displacement Sensors: Three potentiometers were positioned on the back of the wall to measure out-of-plane deformations at high precision. These sensors were mounted on a separate timber support structure.
• Pressure Sensors: Two pressure sensors were used to monitor the water levels on both sides of the wall.
• Visual Monitoring: Two cameras, positioned in front of and behind the wall, recorded wall behaviour, overall crack development, and debris impacts at regular time intervals.
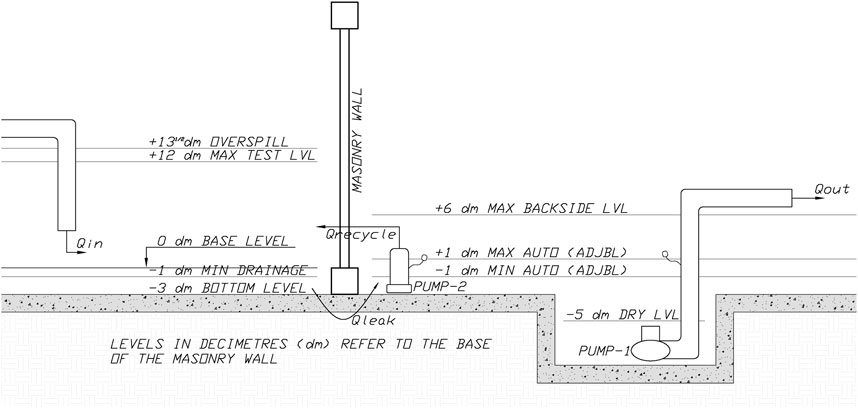
Figure 3. Water level control setup and basin arrangement. LVL=Level.
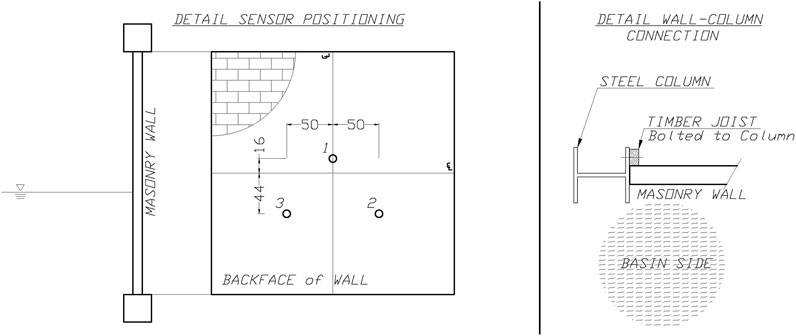
Figure 4. Placement of potentiometers on the wall surface. Position of the potentiometers referenced to the centre of the back face of the masonry wall - the lower potentiometers thus at 91 cm from the bottom of the wall. These sensors measure the out-of-plane displacement, i.e. the displacement perpendicular to the face of the wall. Right, detail of the connection between the wall and the lateral steel columns.
To ensure safety and prevent catastrophic failure during testing, a restraining mesh made of steel cables and fine wire was installed behind the wall. This mesh was designed to minimise damage to the rig and pumping system in the event of wall collapse.
It must be emphasised that this test was of pragmatic nature. Rather than simulating hydrostatic pressures with controlled airbags in the laboratory, see for instance Damiola et al. (Jafari et al., 2017), where airbag pressures, wall deformations, boundaries, and displacements can be accurately measured and manipulated, the test was outside, in a basin that could be filled with water. Such a test is inherently less instrumented and less controlled, as water levels cannot be immediately adapted to the behaviour of the wall. The pragmatic aspect and value of the experiment lies in that the masonry is shown to withstand real hydrostatic pressure in as-built conditions.
2.3 Testing protocol
2.3.1 Hydrostatic pressure tests
The wall was subjected to incremental water levels to simulate hydrostatic loading conditions. The tests were performed under varying vertical pre-compression stresses to mimic different building load scenarios where load-bearing walls carry the weight of floors, roofs and other walls, as summarised below:
During each test, water was gradually filled in the basin, and the deformation of the wall was continuously measured. To study the effects of sustained loading, water levels were sometimes held constant for several hours or drained slowly (overnight) to observe long-term behaviour.
2.3.2 Debris impact tests
After the hydrostatic tests, to investigate the effects of debris impacts on wall behaviour, two types of debris were used to simulate typical flood-borne objects:
Wooden or “Soft” Debris: A floating tree log (see Figure 5), approximately 3 m long, 0.3 m in diameter, and weighing 80 kg, was accelerated through the water to strike the wall at velocities between 0.5 and 1.8 m/s. The velocity of the impacts were manually measured with a high-speed camera right before impact. The impacts mimicked soft, deformable debris such as timber or vegetation typically carried by floodwaters.
Steel or “Hard” Debris: A 30 cm steel cube weighing 40 kg (see Figure 6) was suspended from the top of the rig and swung into the wall as a pendulum. This setup simulated hard, rigid debris such as vehicles or metal objects. The cube’s velocity and impact energy were increased progressively, with repeated strikes at the same location to assess cumulative damage. Deformations were measured before and after each impact, and visual inspections were performed to document crack initiation, propagation, and any local failure of the masonry. Hard debris represents typically stiff debris such as vehicles or floating building components; see (Wüthrich et al., 2024) for an overview of debris carried by the flood in the Ahr Valley in 2021.
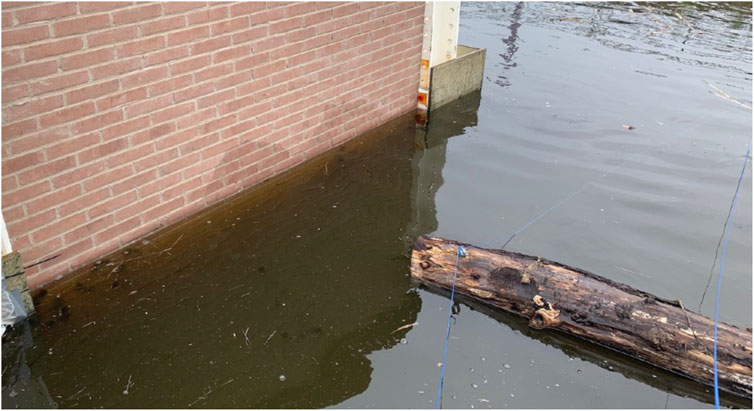
Figure 5. Floating tree log setup for soft debris impacts.
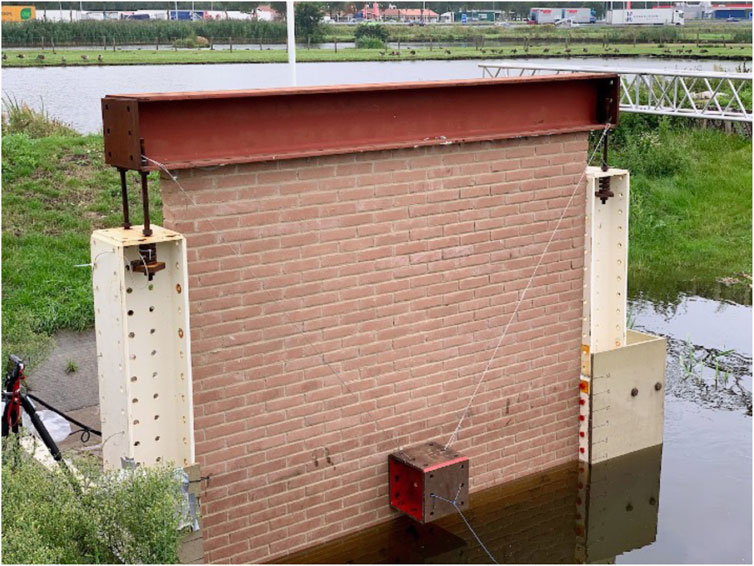
Figure 6. Steel cube setup for hard debris impacts.
2.4 Companion material tests
To characterise the mechanical properties of the masonry, two types of small-scale tests were performed: 1) Bond-Wrench Tests: These tests measured the tensile bond strength of the mortar joints by applying a bending moment to the brick couplets (see Figure 7). The results were used to estimate the flexural strength of the wall in the vertical direction. 2) Compression Wallet Tests (see Figure 8): Two compression wallets were tested vertically to determine the masonry’s compressive strength, Young’s modulus, and fracture energy (Jafari et al., 2017). These properties were critical for the calibration of numerical models. The companion material tests were performed in accordance with NEN-EN 1052–1 for compressive strength and stiffness determination, and NEN-EN 1052–5 for the tensile bond strength via the bond wrench method.
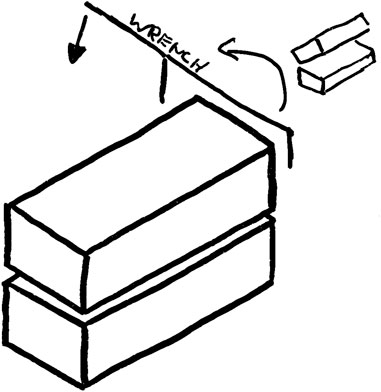
Figure 7. Bond-wrench test setup.
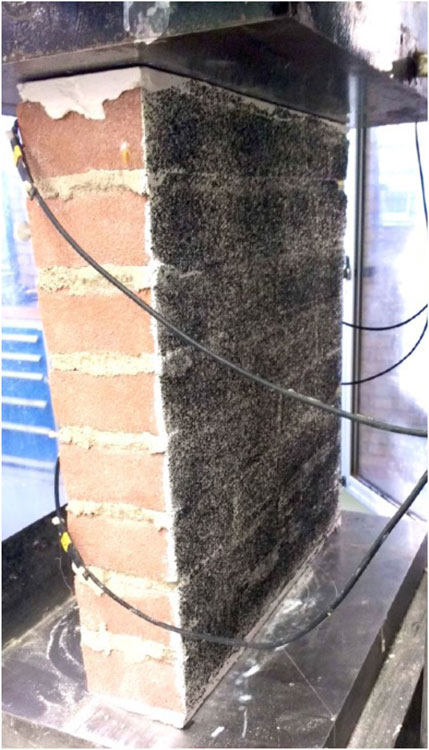
Figure 8. Compression wallet test in testing rig with Digital Image Correlation (DIC) black-and-white pattern.
3 Results and observations
This section presents the results of the hydrostatic pressure and debris impact tests conducted on the masonry wall. Key findings include the wall’s deformation behaviour, crack development, and local damage observed under increasing water loads and debris collisions. The experimental data are analysed to reveal the effects of varying water levels, vertical pre-compression, and debris impact types.
3.1 Hydrostatic pressure behaviour
The wall’s response to hydrostatic loading was characterised by measuring its out-of-plane deformation as water levels increased and decreased. Tests were performed under multiple pre-compression scenarios, representing different building load conditions. A stress of 100 kPa corresponds to a line load of 10 kN/m or 1 ton-f/m which translates to the load produced by a floor resting on the wall.
At lower water levels (below 90 cm), the wall exhibited linear-elastic behaviour with small, recoverable deformations; the latter are the clue for the linear-elastic behaviour. This means that when decreasing the water level, or allowing the water levels to equalise at the front and back of the wall, would return the OOP deformation to zero.
The deformation profile was symmetric, with maximum deflections observed in the bottom third of the wall where hydrostatic pressure was greatest; see Figure 9. However, as the water level approached 90 cm, the deformation began to increase at a faster rate, signalling the initiation of cracking and resulting redistribution of stresses within the masonry.
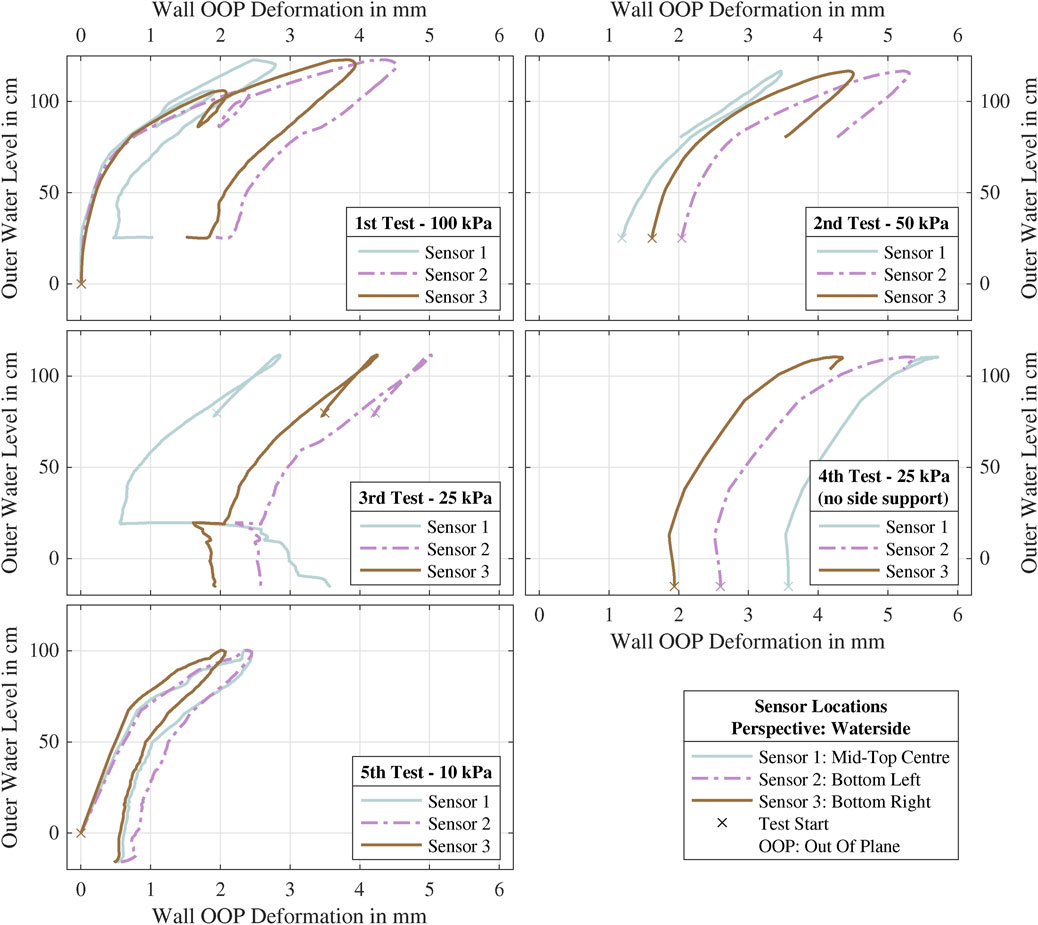
Figure 9. Water level vs. wall deformation trends. Tests 4 and 5 were not continuous and the deformations had to be reset.
Beyond this threshold, increasing the water level to 125 cm resulted in significant deformation. At this stage, the wall developed micro-cracks that gradually redistributed internal stresses, shifting support to the sides of the wall and thus allowing it to sustain higher loads. The maximum out-of-plane deformation recorded at 125 cm water depth was approximately 5 mm, concentrated near the bottom third of the wall. When the water level was reduced, the deformation was not recovered (see Figure 9), this constitutes a residual deformation.
Interestingly, for the higher water depths, the deformation of the wall was not uniform across its face. The sensors positioned off-centre recorded slightly asymmetric deflections, with Sensor 2, located closer to the left edge, consistently measuring larger deformations than Sensor three on the right. This discrepancy may be attributed to minor variations in support conditions or uneven construction of the wall.
Figure 9 shows the relationship between the outer water level and the wall deformation. During these tests, the inner water level was maintained low as per the schematics of Figure 4. Note that some tests, like Test 3, were started directly following another test. Figure 9 does not show the influence of time; some tests were allowed to drain slowly over the course of several hours; see Table 1.
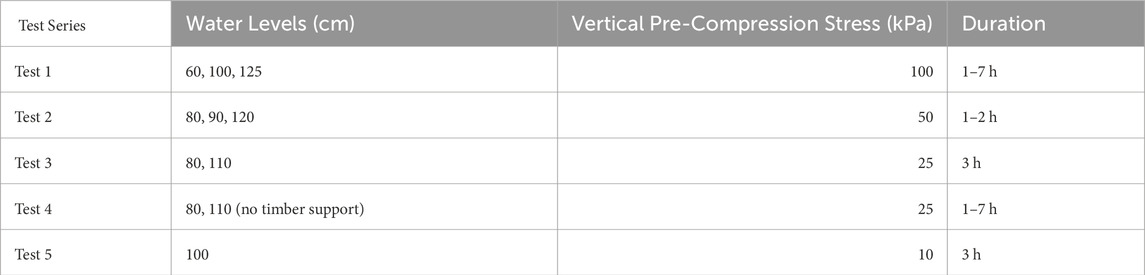
Table 1. Overview of tests including vertical overburden stress and duration.
3.1.1 Residual deformation and long-term effects
The wall exhibited permanent deformations after each test, indicating damage due to non-linear effects such as cracking. These residual deformations, which remain after loading is withdrawn, were particularly evident following tests with sustained water levels or slow drainage. For instance, the wall did not fully return to its original shape after being subjected to 125 cm of water pressure. Subsequent tests revealed a progressive degradation of stiffness. The stiffness relates the force needed to produce a certain deformation. The degradation meant that deformations increased more rapidly for similar water levels in later stages of testing; see Figure 10. Here, the loading (rising water) and unloading of the wall are represented with the deformation (on the horizontal axis) and the internal bending moment resulting from the applied hydrostatic pressure. The figure shows how earlier tests generally display a higher stiffness (or steeper slope) in this force-displacement diagram. Mainly, the plot emphasises that later tests also start at an accumulated displacement following earlier tests.
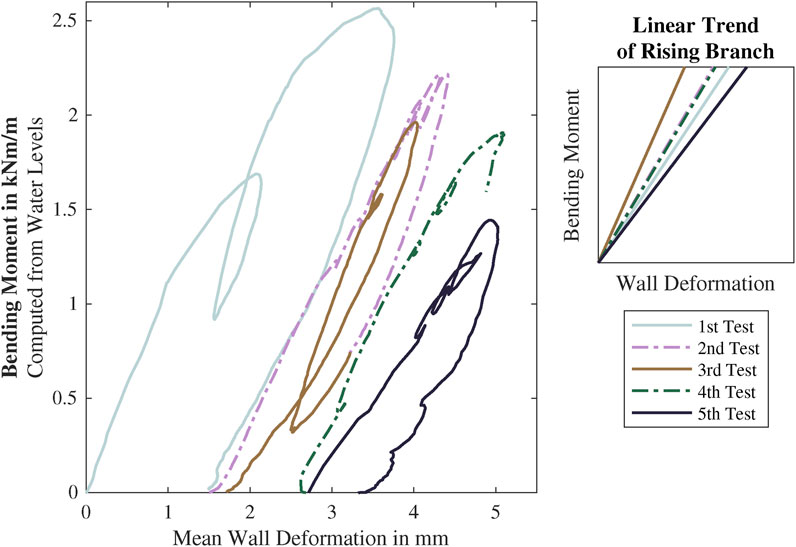
Figure 10. Accumulation of residual deformation across successive tests. Bending-moment against wall deformation. The moment is determined based on the difference between outer and inner water levels which, through hydrostatic pressure, cause out-of-plane bending on the wall.
3.1.2 Crack development
Visual inspection revealed no significant cracks during the early stages of testing. However, as water levels exceeded 90 cm, small cracks began to form in the mortar joints. These cracks were primarily concentrated in the bottom third of the wall, where the hydrostatic pressure was highest. Note that the hydrostatic pressure increases with depth and is thus maximum at the bottom of the wall; however, the bending moment is highest at the bottom third of the wall, see later Figure 14.
At higher water levels, such as 125 cm, the cracks propagated horizontally, suggesting a redistribution of bending stresses from the weaker vertical direction to the stronger horizontal direction. This crack pattern aligns well with numerical predictions, see next section, which also indicated stress redistribution as a mechanism for the wall’s increased capacity under two-way bending conditions.
3.2 Debris impact behaviour
The wall was subjected to impacts from both soft debris (a floating tree log) and hard debris (a steel cube) to simulate different types of debris collisions. These tests provided insight into the influence of impact energy and debris type on wall deformation and damage.
3.2.1 Soft debris (tree log) impacts
Soft debris impacts were performed using a floating tree log weighing approximately 80 kg and accelerated at velocities ranging from 0.5 to 1.8 m/s. Despite repeated impacts at these velocities, the wall exhibited no visible cracking or damage. The measured deformations before and after the impacts, see Figure 11 were negligible, with no significant increase in residual displacement. The impacts took place between 70 and 100 cm of water level (head) difference.
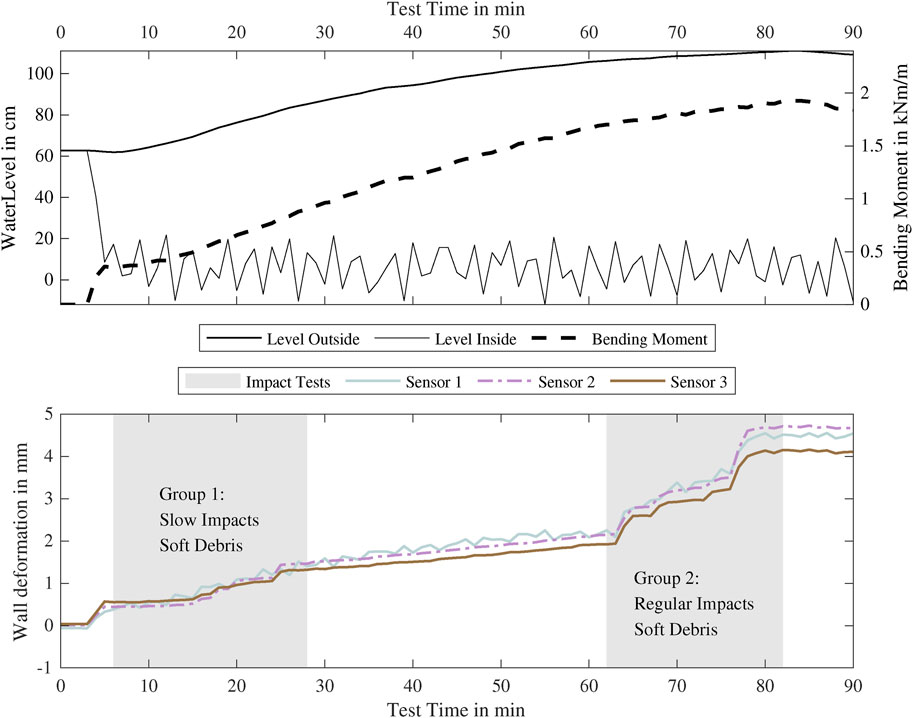
Figure 11. Deformation of the wall after impacts.
The relatively low impact energy of the soft debris (up to 90 J) and its ability to deform upon collision contributed to its minimal effect on the wall. These results suggest that typical soft debris, such as logs, poses limited risk to masonry walls during floods unless combined with significant hydrostatic pressure.
3.2.2 Hard debris (steel cube) impacts
In contrast, the impacts from hard debris had a more severe effect on the wall’s structural integrity. A 30 cm steel cube weighing 40 kg was suspended as a pendulum and swung into the wall at increasing velocities, reaching up to 3 m/s. The impacts concentrated energy into a small area of the wall, producing localised damage and progressive cracking (see Figure 12).
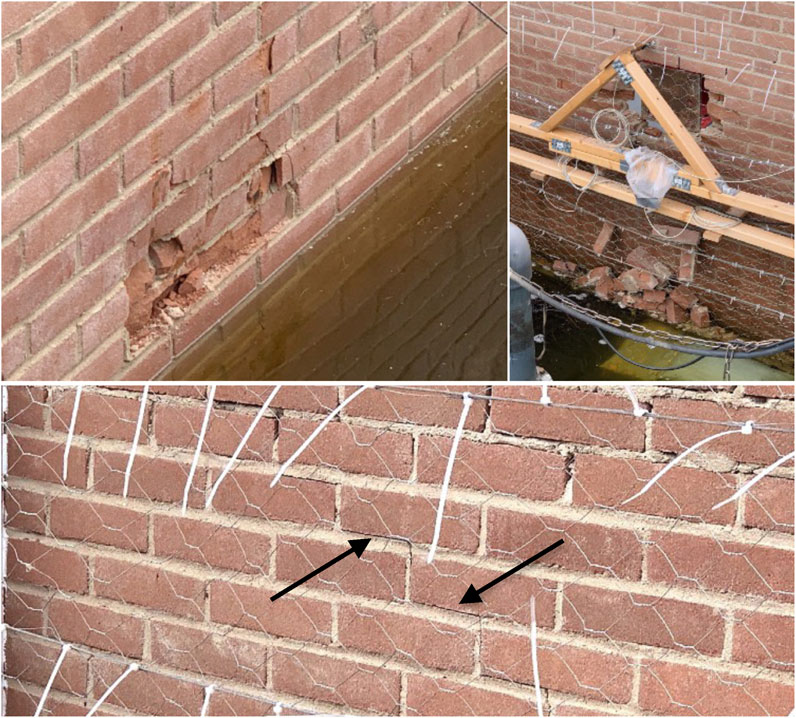
Figure 12. Localised failure and crack pattern after steel cube impacts. Left, local damage of the bricks led to a hole in the wall, right. The broken and displaced bricks were trapped by the steel net. Diagonal stair-like crack pattern from the centre going upwards.
The energy of the impacts reached up to 200 J and would be comparable to that of a small vehicle carried by a flood with a velocity of about 0.5 m/s. In the case of the cube, the impact is concentrated on a single point, which would be similar to the impact of the vehicle at an angle, if earlier impacts have removed the soft impact points such as bumpers.
During the early impacts, strong vibrations were observed, propagating through the testing rig and dissipating over time. As the impacts continued, diagonal cracks developed in a staircase pattern originating from the point of impact and extending toward the edges of the wall. Cracks appeared at the brick-mortar interface and their progression was most prominent in the lower half of the wall, where hydrostatic pressure added to the stress - water seeped-in through these cracks and was pumped back to the main basin by a dedicated pump to maintain the set water level.
Repeated collisions eventually led to localised failure of the masonry, as the bricks in the impact zone crushed and displaced. A visible hole formed after dozens of impacts, at which point the wall’s residual deformation exceeded the range of the displacement sensors.
These results demonstrate that hard debris impacts, particularly when combined with significant water pressure, as is the case of impacts from floating debris, can cause rapid and severe damage to masonry walls. However, repeated collisions are probably required to cause (partial) collapse. Indeed, unlike soft debris, hard objects transfer most of their kinetic energy to the wall triggering cracking and making them a critical factor in flood vulnerability assessments.
3.3 Leakage and boundary effects
During the experiments, minor water leakage was observed around the wall and the testing rig, despite efforts to minimise it with silicone seals and a plastic-lined sandbag dike (see Figure 13). Over time, water seeped through small gaps between the concrete basin plates, creating a piping effect beneath the rig. This phenomenon caused local erosion of the sand beneath a small concrete tile, which ultimately settled. The additional leakage meant that Pump #2 (see Figure 4) was insufficient to maintain the prescribed water level difference (Qleak > Qrecycle) and Pump #1 had to be activated.
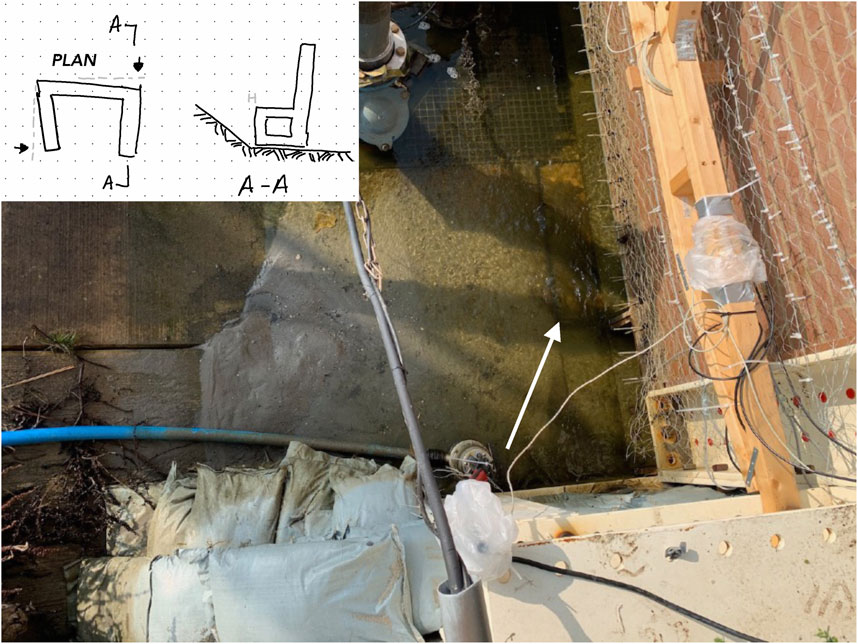
Figure 13. Water leakage and rig displacement effects. Small concrete tile (indicated with arrow) and sand scoured from underneath it. Scheme showing displacements of the frame due to the hydrostatic pressure.
Additionally, the hydrostatic pressure exerted a horizontal force on the steel rig, causing it to slide slightly backward until restrained by the basin slope. The lateral timber supports on the wall remained effective, but these observations highlight the importance of accounting for boundary conditions and support stiffness when interpreting experimental results. For subsequent tests, the setup was modified such that these issues were resolved.
3.4 Discussion of experimental results
The experimental findings provide several insights into the structural behaviour of unreinforced masonry walls under flood-specific loading that extend beyond simple observations. The transition from elastic behaviour at shallow water depths (<90 cm) to cracking and redistribution of stresses at greater depths demonstrates the importance of incorporating non-linear material behaviour in predictive models. This threshold is consistent with earlier analytical expectations (Jansen et al., 2020; Clausen and Clark, 1990) but further highlights that simplified one-way bending formulations (Kowalewski and Gajewski, 2015; Lawrence and Marshall, 2000) may substantially underestimate capacity once horizontal cracking enables two-way action.
The debris impact tests also underline that not all debris types contribute equally to wall damage. Soft debris (floating log) produced negligible additional deformation, confirming that deformable flood-borne objects have a reduced effect on structural integrity. In contrast, repeated impacts by hard debris (steel cube) led to progressive cracking and local failure, especially in the presence of elevated hydrostatic pressures. These observations align with recent work emphasising the importance of debris-related loads in flood damage (Chen et al., 2012), but provide full-scale empirical confirmation.
Boundary conditions also played a decisive role in governing capacity. The lateral supports of the test rig enhanced wall performance by facilitating two-way bending, delaying collapse, and enabling redistribution of stresses after cracking. This finding echoes the observations of Platt et al. (2020) and Vaculik & Griffith (Shen et al., 2017) on the significance of lateral restraint, but here demonstrated under realistic hydrostatic conditions. In practice, this implies that adjoining walls, floors, and openings may strongly influence the vulnerability of masonry walls during floods, a factor often neglected in fragility models.
Together, these results show that hydrostatic pressure controls the global response of masonry walls, but boundary conditions and debris stiffness determine whether localised damage progresses into structural failure. These insights have direct implications for numerical model calibration, depth–damage functions, and flood risk assessments.
3.5 Summary of results
The key experimental findings can be summarised as follows:
• The wall behaved linearly up to ∼90 cm water depth; cracking and significant non-linear deformation initiated beyond this threshold.
• Residual deformations accumulated across successive tests, indicating progressive damage under repeated or sustained hydrostatic loading.
• Soft debris (floating log) impacts up to 1.8 m/s caused negligible structural damage.
• Hard debris (steel cube) impacts caused diagonal cracking, localised crushing, and eventually perforation under repeated strikes, particularly at higher water levels.
• Boundary conditions enabled two-way bending and enhanced wall capacity, delaying failure compared to one-way analytical predictions.
These findings serve as a foundation for validating numerical models and assessing the flood resilience of masonry walls, as discussed in the next section.
4 Numerical models
To gain further insight into the structural behaviour of masonry walls under hydrostatic pressure and debris impacts, several numerical models were developed and compared to the experimental results. These models ranged from a simplified analytical approach to more sophisticated finite element method (FEM) models, incorporating both linear-elastic and non-linear material behaviour. This section describes the setup, results, and comparative analysis of these models, highlighting their accuracy and limitations in replicating the experimental observations. Table 2 next includes results and comparisons between the models presented.
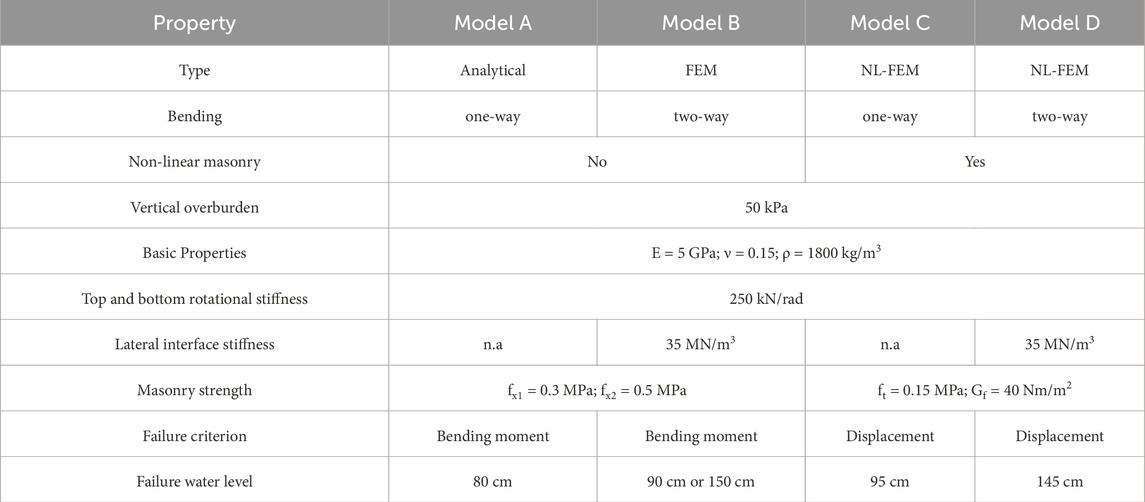
Table 2. Summary of models and their properties presented in this chapter. NL-FEM: Non-linear Finite Element Method models.
4.1 Analytical model
A simplified analytical model was first employed to assess the out-of-plane behaviour of the wall under hydrostatic loading. In this approach, the wall was modelled as a slender beam subjected to one-way bending following Euler-Bernoulli theory. The model considered the wall as divided into two regions: a loaded bottom section subjected to hydrostatic pressure (triangular load) and an unloaded top section. Rotational stiffness at the top and bottom supports was included to reflect the restraint provided by the steel beams in the experimental setup.
The model assumed that the wall would remain linearly elastic until cracking occurred, with failure defined as the point where the bending moment exceeded the vertical flexural strength (fx1). Lateral boundary effects were neglected to simplify the calculations, representing a pure one-way bending scenario; the internal forces are thus continuous over the width of the wall. Figure 14 shows the internal forces, rotation and displacement for two instances of water depth: 50 and 100 cm. The point at which the maximum bending moment occurs shifts upwards with the higher water depth, as is expected for that type of load. Most importantly, its magnitude increases six-fold. Figure 14 also includes the maximum bending moments for increasing water depth; the deflection, or out-of-plane displacement, of the wall increases almost proportionally. With the top and bottom rotational constraints assumed, corresponding to the rotation of the top flange supported by the web of the steel beams, the maximum moment occurs at the centre of the wall and not at the supports.
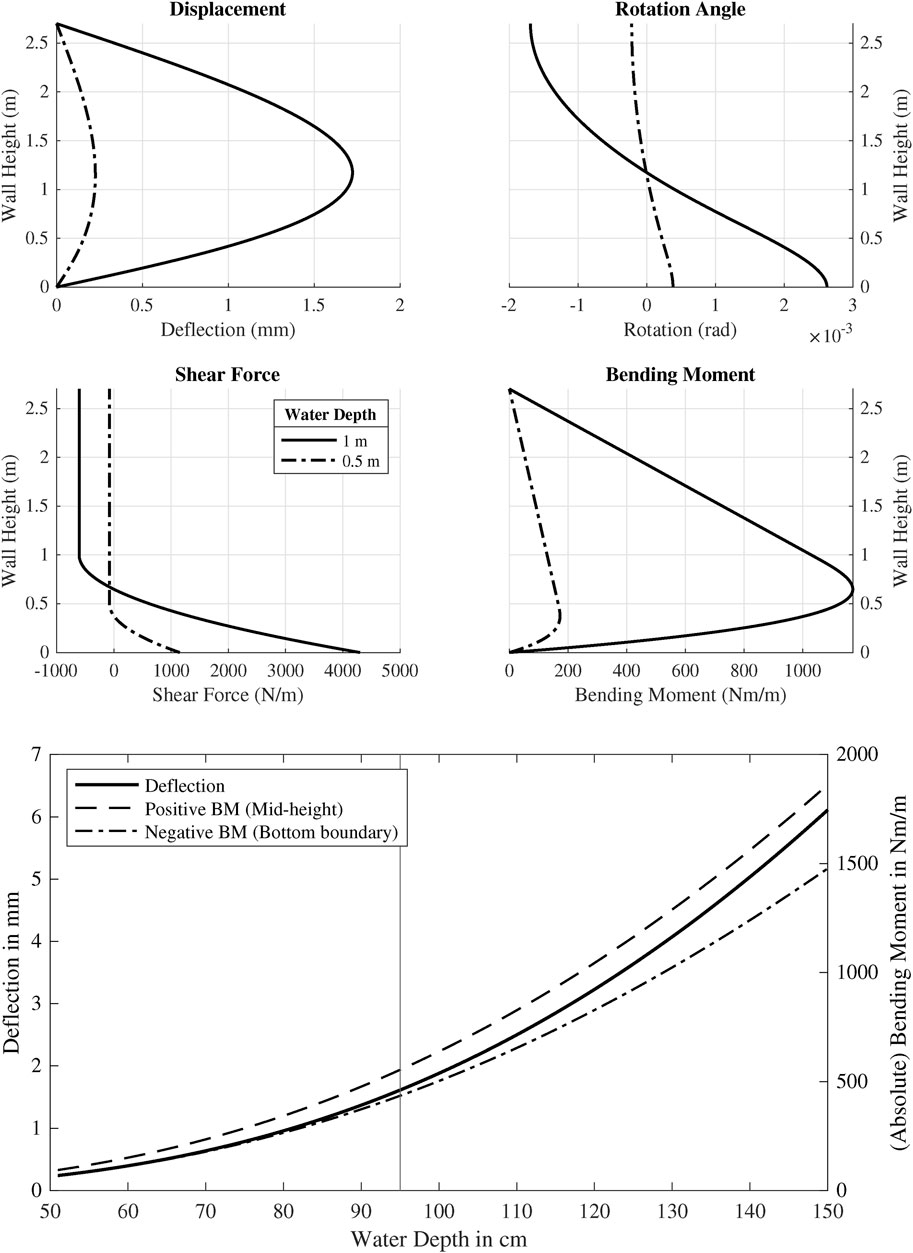
Figure 14. Analytical model results – water depth vs. bending moment and deflection. Deflection, line rotation, bending moment and shear force against wall height for a water depth of 0.5 and 1m. Maximum deflection, positive and negative (at supports) bending moments for various water depth values.
The analytical results showed that the wall would fail at a water depth between 80 and 95 cm, depending on the assumed flexural strength and boundary stiffness since the acting bending moment would exceed the elastic bending capacity; see Table 2. This failure threshold is conservative, as the model did not account for boundaries on all four edges which enforce two-way bending and thus stress redistribution when the elastic failure occurs in one of the directions first. While the analytical model provided a useful first approximation, its predictions were less accurate at higher water depths where non-linear effects became significant.
4.2 Finite element models
FE models were developed using a more detailed representation of the wall geometry, material behaviour, and boundary conditions to overcome such limitations inherent to the analytical approach. These models were designed to simulate both linear-elastic and non-linear responses under hydrostatic pressure.
4.2.1 Model configuration
The masonry wall was discretised into a finite element mesh consisting of 27 × 27 elements, each measuring 100 × 100 mm. The bottom edge of the wall was fully fixed, while the top edge was vertically restrained with a rotational spring to simulate the partial flexibility of the steel beam. Lateral translational stiffness was introduced to replicate the restraint provided by the timber supports on the experimental rig which would allow a small out-of-plane displacement. Hydrostatic pressure was applied as a triangular load distribution on the wall face, increasing linearly with water depth, while vertical pre-compression was modelled as a line load along the top edge; see Figure 15.
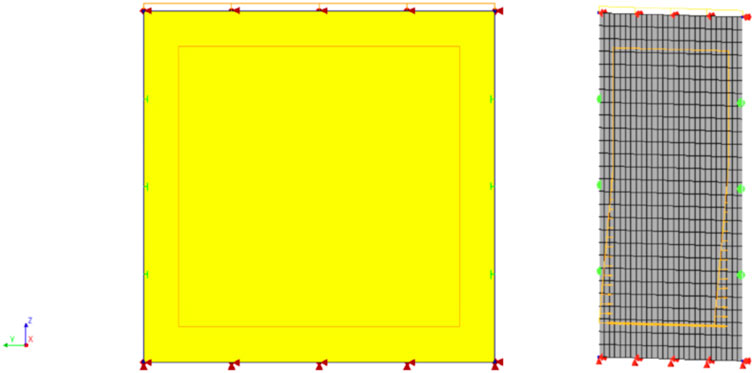
Figure 15. Finite element model setup – mesh, boundary conditions, and loading. Right, 3D view in perspective to show perpendicular hydrostatic pressure as a triangular pressure in color orange.
4.2.2 Linear elastic FE model
The first numerical model assumed linear-elastic material behaviour to replicate the wall response under small deformations. The masonry material properties were defined based on experimental results, with a Young’s modulus of 5 GPa and Poisson’s ratio of 0.15. Flexural strengths of 0.3 MPa and 0.5 MPa were used as benchmarks; since masonry is an orthotropic material, its strength for bending horizontally is higher than bending along the vertical direction which can fail with simple, purely horizontal cracks along the bed-joints.
The linear-elastic model, see Figure 16, closely replicated the experimental results at water depths below 90 cm, where the wall behaviour remained within the elastic regime. Deformation values predicted by the model aligned well with the measured out-of-plane displacements, validating its accuracy in the early stages of loading. However, as the water depth increased beyond 90 cm, the model underestimated wall deformation. The linear assumptions prevented the model from capturing the crack initiation and stress redistribution observed experimentally, leading to these discrepancies at higher water levels.
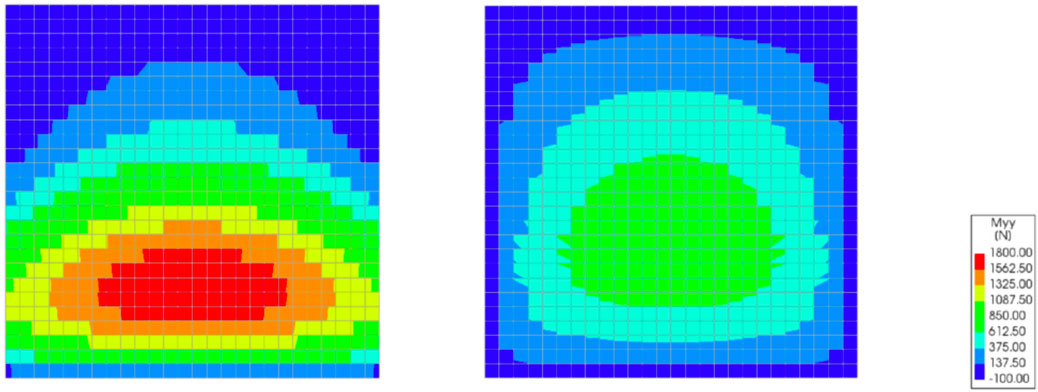
Figure 16. Comparison linear FE model deformations. Bending moment distributions for vertical (left) and horizontal (right) bending. Values are expressed in the same scale and in Nm per metre stretch for the case of 140 cm of water.
4.2.3 Non-linear FE model
To address the limitations of the linear model, non-linear finite element models were developed using the Total Strain Rotating Crack Model (TSRCM) constitutive material formulation. TSRCM is a smeared crack model in which the direction of the principal strain governs the orientation of cracks, allowing them to rotate with changes in the strain field. This approach accounts for the softening behaviour of masonry under tension, the interaction between cracks, and stress redistribution as cracking evolves. The model captures both crack initiation and propagation by tracking changes in stiffness and orientation at the integration points. This formulation is particularly suitable for quasi-brittle materials like masonry, where cracking plays a dominant role in the structural response (Korswagen et al., 2022). The numerical models were implemented in DIANA FEA v10.4. Two configurations were considered:
One-Way Bending (Model C): In this configuration, the lateral restraints were removed, simulating a scenario where the wall could bend only in the vertical direction. The model predicted sudden failure at a water depth of approximately 100 cm, with large deformations indicative of wall collapse.
Two-Way Bending (Model D): When lateral translational stiffness was included to mimic the timber supports, the wall exhibited a more gradual response under loading. Horizontal cracking developed in the bottom third of the wall, where hydrostatic pressure was greatest, while stress redistribution to the stronger horizontal bending direction increased the wall’s load-carrying capacity; see Figure 17. At a water depth of 130 cm, the wall deformed by approximately 10 mm, with crack widths reaching 3 mm. Increasing the water depth to 140 cm led to further widening of the cracks and a large increase in deformation, signalling imminent failure.
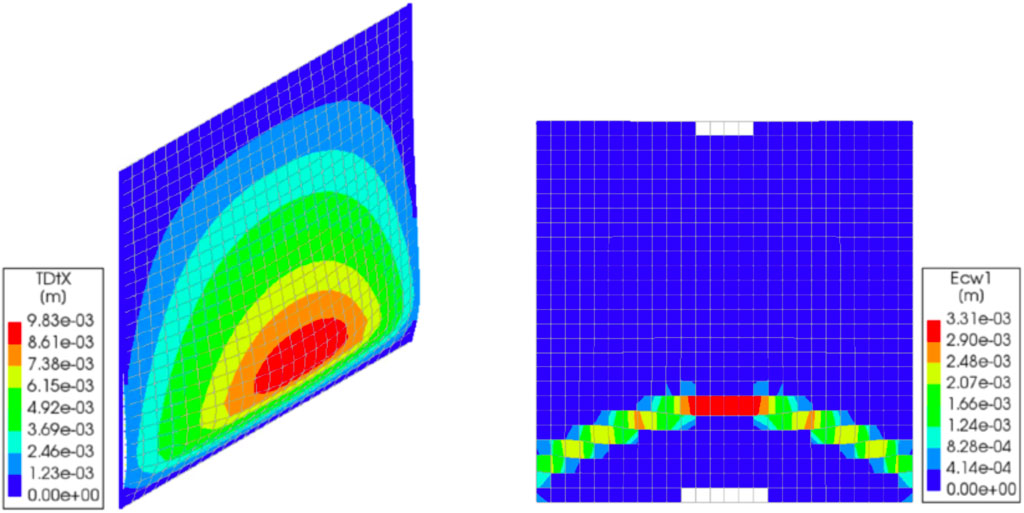
Figure 17. Non-linear FE model results – crack patterns and deformation. Two-way bending at a water depth of 130 cm.
The non-linear models demonstrated that two-way bending significantly enhanced the wall’s capacity compared to the one-way bending scenario. This was consistent with the experimental findings, where lateral supports were observed to prevent wall failure since ultimately the wall did not collapse at the maximum tested water level of 125 cm.
4.3 Comparison of models and experiments
A comparison of the analytical, linear elastic, and non-linear models against the experimental results reveals the following trends - Table 3 summarises the key findings:
• The analytical model provided conservative failure predictions, accurately identifying the water depth at which cracking began but underestimating the wall’s overall capacity.
• The linear elastic FE model was accurate at low water depths but failed to account for crack propagation and stress redistribution, leading to discrepancies at higher loads.
• The non-linear FE model with two-way bending (Model D) closely replicated the experimental behaviour, capturing both deformation and crack patterns.
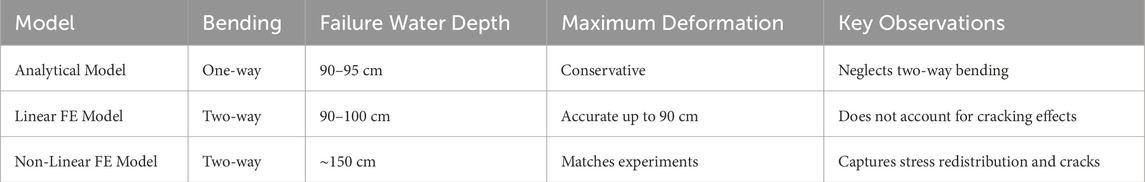
Table 3. Summary of results and insights from the various models.
The experimental data for Test 1 and Test 2, in terms of wall OOP deformation against water level, was fitted with a simple spline; see Figure 18. Data points for various water levels analysed in the models are added to this graph to compare the predicted deformation against the experimental value. These demonstrate that, at a water levels around 125cm, significant deformations take place. See also Table 4.
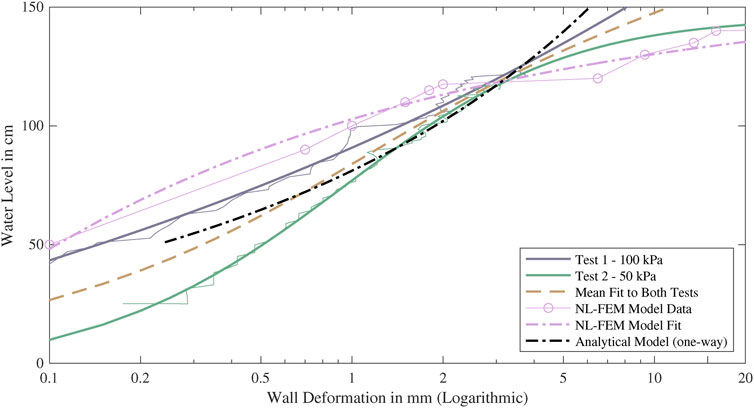
Figure 18. Experimental vs. numerical deformation trends. Comparison between Model D and experimental data. Data points from the models are included (Model Data) and fitted with a smooth curve.
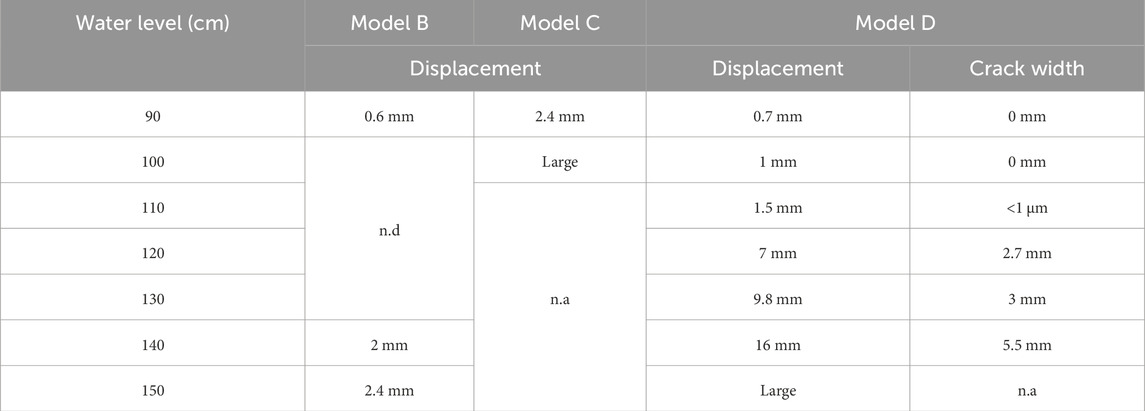
Table 4. Comparisons of displacements between the numerical models.
4.4 Discussion of model results
The numerical models highlighted the importance of two-way bending behaviour and non-linear material properties in accurately predicting the wall’s structural response. While the analytical and linear FE models provided useful benchmarks, their assumptions limited their ability to simulate progressive damage and failure mechanisms. In contrast, the non-linear FE model successfully captured the observed stress redistribution, crack propagation, and ultimate failure, demonstrating its reliability for structural assessment.
The results emphasise the role of lateral boundary conditions in enhancing the evaluation of the wall’s capacity under hydrostatic loading. Walls with lateral supports can bend in two directions and thus redistribute stresses once the first direction, typically for vertical bending, has begun cracking. This helps them delay failure and improve their resilience. Besides non-linear FEM models, other methods exist for calculating the strength-based capacity of walls in two-way bending (Kowalewski and Gajewski, 2015; Lawrence and Marshall, 2000; Shen et al., 2017; Vaculik and Griffith, 2017; Willis, 2004; Chang et al., 2020), but these are not the focus of this study.
5 Discussion
5.1 Hydrostatic pressure behaviour
The experimental results demonstrated that the masonry wall exhibited linear-elastic behaviour at water depths below 90 cm, with minimal out-of-plane deformation and no visible cracking. This behaviour aligns with the predictions of both the analytical model and the linear elastic finite element (FE) simulations, which captured the wall’s response accurately in this range. However, as the water depth increased beyond 90 cm, the wall entered a non-linear regime, with significant deformation and the initiation of cracking.
The transition from elastic to non-linear behaviour occurred together with a stress redistribution across the wall’s surface. Bending moments caused by the hydrostatic load were resisted by the mortar joints in the vertical (weak) direction. Once the tensile or bond strength of the mortar was exceeded, horizontal cracks began to form, redirecting the stresses toward the stronger horizontal direction. This phenomenon, observed experimentally and confirmed by the non-linear FE models, highlights the importance of two-way bending effects in masonry walls.
The non-linear FE model with lateral translational stiffness provided the most realistic predictions of wall behaviour, capturing both the horizontal crack patterns and the progressive deformation observed during the tests. The model demonstrated that lateral supports, such as those provided by timber profiles in the experimental setup, significantly enhance the wall’s load-carrying capacity by facilitating stress redistribution. This finding underscores the importance of considering boundary conditions of individual walls when assessing the flood resilience of masonry structures.
5.2 Failure mechanisms and ultimate capacity
The ultimate capacity of the wall was inferred from the deformation trends and crack development observed experimentally and numerically. The experiments showed that the wall remained stable up to a water depth of at least approximately 125 cm. The non-linear FE model predicted ultimate failure at a slightly higher water depth of 150 cm. The observed failure mechanism was characterised by horizontal cracking in the lower third of the wall, where hydrostatic pressure was greatest. These cracks propagated progressively as water levels increased, leading to local crushing of the bricks and eventual loss of structural integrity. In the analytical model, failure was predicted conservatively at 90–95 cm water depth, as the model did not account for the wall’s two-way bending.
The discrepancy between the experimental and analytical predictions underscores the limitations of simplified approaches in assessing the non-linear behaviour of masonry walls. While analytical models provide a quick estimate of failure thresholds, they fail to capture the effects of crack propagation and stress redistribution, which are critical for understanding the wall’s true capacity under flood loading.
It must be discussed whether these water level differences are expected during floods. This depends on several factors. First, flood depths must reach these high values which seldom appear in Dutch flood scenarios (Huizinga et al., 2017). Second, the building envelope must be sufficiently watertight that the water level difference is maintained between the outer and inner water levels. For very slow flood rise rates, leakage around openings or installations (such as the sewage system) may prevent these large water level differences (Endendijk et al., 2023). Flash floods with large water levels may be the most dangerous. In those cases, opening doors and windows to equalise inner and outer water levels may help prevent catastrophic structural damage at the cost of increased damage to the buildings interior finishings and contents. Opening the building envelope, however, would increase the chance of debris collisions if high water velocities are present. These collisions can knock out structural components, resulting in collapse (Wüthrich et al., 2024). Therefore, if doors or windows are left open, they should be on the downstream side and not be oriented towards the flood flow.
5.3 Impact of debris loads
The effects of debris impacts on the masonry wall varied significantly depending on the type of debris and the impact energy.
Soft Debris: Impacts with the floating tree log, representing soft and deformable debris, caused negligible damage to the wall. Despite velocities of up to 1.8 m/s, the impacts produced minimal additional deformation and no visible cracks. The soft debris’s ability to deform and distribute impact forces over a larger area reduced its effect on the wall. These results suggest that soft debris, such as floating logs or vegetation, poses limited structural risk to masonry walls during floods.
Hard Debris: In contrast, repeated impacts with the steel cube, representing rigid debris, led to significant local damage. The cube’s high impact energy, concentrated over a small area, caused diagonal cracks to form in a staircase pattern originating from the impact site. As the impacts continued, the localised crushing of bricks occurred, eventually leading to puncturing of the wall.
The experimental observations highlight the critical role of impact energy and debris stiffness in determining the extent of damage to masonry walls. Hard debris impacts, particularly when combined with elevated hydrostatic pressures, can accelerate crack propagation and compromise wall integrity. This finding has practical implications for flood risk assessments, emphasising the need to account for both static water loads and dynamic debris impacts when evaluating structural vulnerability. Numerical models for debris impact were not explored systematically. Impact FEM models with explicit time-step solutions could be employed to study debris impact in a parametric manner.
5.4 Boundary effects
The experiments revealed that boundary conditions can influence the wall’s overall behaviour during flood loading. The lateral timber supports used in the testing rig provided additional stiffness to the wall, enhancing its capacity to resist hydrostatic pressures. This effect was particularly evident in the non-linear FE simulations, which demonstrated that lateral constraints enable stress redistribution and delay failure. In real-world scenarios, similar effects may occur in buildings with supporting walls or stiff lateral connections. Openings, such as those for windows or doors, would also re-distribute bending stresses. Boundaries are also affected by the vertical loads, which aid stability.
5.5 Implications for flood resilience
The findings from this short experimental and numerical study have several important implications for improving the flood resilience of unreinforced masonry walls:
• Water Depth Thresholds: Traditional single-wythe masonry walls will safely withstand water depths up to 90 cm without significant damage - assuming a rigid top constrain such as a floor. Beyond this threshold, cracking and deformation become pronounced, increasing the risk of structural failure. These types of walls are common in Dutch buildings, though are usually part of a cavity wall system.
• Debris Impact Risks: While soft debris poses minimal risk, hard debris impacts can cause severe local damage, particularly when combined with high water pressures and flows. This was observed in recent floods (Wüthrich et al., 2024), where vehicles were carried by the flood and collided with buildings. Mitigation measures, such as protective barriers or reinforcement, may be necessary in flood-prone areas with high debris loads.
• Boundary Effects: The presence of lateral supports or stiff connections significantly enhances wall capacity under flood loading. Structural assessments should account for these effects to avoid overly conservative failure predictions.
• Numerical Models: Non-linear finite element models provide reliable predictions of wall behaviour, capturing both deformation and crack propagation. These models can be used to develop accurate fragility curves for masonry buildings, improving flood risk assessments and resilience strategies.
• Models for flood damage estimation and the damage functions for buildings could be updated based on the findings of this study. e.g., the dutch standard damage model (Jonkman et al., 2008).
5.6 Uncertainties and limitations
While the experiments and analyses presented here provide valuable insights into the out-of-plane behaviour of unreinforced masonry walls under flood loading, several uncertainties and limitations must be acknowledged. First, only a single full-scale test wall was constructed and tested. This limits the statistical strength of the findings and does not capture the variability in masonry workmanship, brick and mortar properties, or boundary conditions that can occur in practice. Second, the experimental setup was pragmatic in nature, using an outdoor basin and water filling system. As a result, hydrostatic loading could not be applied with the same precision as laboratory-based airbag setups (Jafari et al., 2017), and instrumentation was necessarily limited.
Material properties were characterised through companion tests, but spatial variability in masonry bond strength and stiffness is known to influence cracking and failure. Furthermore, the boundary conditions provided by the steel rig and lateral timber supports enabled two-way bending but in a way which may not be representative of all real building configurations. Finally, debris impact testing was limited to two simplified scenarios (a floating log and a steel cube) which cannot capture the full diversity of flood-borne objects encountered in real events.
These uncertainties underline the need to interpret the present findings as indicative of key mechanisms and thresholds rather than absolute capacity values. Nevertheless, the results provide a critical empirical benchmark that can guide model calibration and the development of more robust fragility functions.
5.7 Future work
While the study provides valuable insights, further research is needed to address additional factors influencing masonry wall behaviour under flood conditions:
• Cavity Walls: Investigating the behaviour of cavity walls, which are common in Dutch buildings, under similar loading conditions.
• Openings and Wall Perforations: Studying the effects of windows, doors, and other openings on wall capacity and failure mechanisms.
• Dynamic Water Loading: Simulating the effects of rapidly rising or receding water levels to replicate realistic flood scenarios or the impact of waves (Chen et al., 2012).
• Long-term effects of flooding, such as that of moisture, should also be considered.
• The calibrated FE model can be further expanded to include variations in dimensions and (material) parameters so as to assess their sensitivity and influence on wall cracking and capacity.
6 Conclusion
This study investigated the structural behaviour of a full-scale unreinforced masonry wall subjected to hydrostatic pressures and debris impacts, combining experimental results with analytical and numerical models.
Under hydrostatic pressure, the masonry wall exhibited linear-elastic behaviour up to a water depth of approximately 90 cm, demonstrating minimal deformation and no visible cracking. This stability was supported by an acting vertical stress of about 100 kPa. Beyond 90 cm, significant non-linear deformation and initial cracking became apparent, particularly in the lower third of the wall, where hydrostatic pressures were highest. The wall maintained stability up to a tested depth of 125 cm, with predicted failure at approximately 150 cm according to the non-linear finite element (FE) model. Crucially, the redistribution of stress horizontally contributed to delaying failure, highlighting the importance of two-way bending effects.
Regarding debris impact behaviour, soft debris such as floating logs (tested) resulted in negligible additional damage, even at velocities up to 1.8 m/s. These soft collisions reduced and dispersed impact forces across larger areas due to their deformable nature, minimising deformation. Conversely, hard debris impacts, exemplified by steel cube impacts, led to significant localised damage. Repeated impacts caused diagonal cracks, localised crushing of bricks, and eventual perforation. The severity of this damage was directly related to the impact energy and the concentration of forces.
The role of boundary conditions proved critical in the structural response of the wall. Lateral supports in the experimental setup substantially enhanced the wall’s structural capacity through two-way bending and effective stress redistribution after cracking. Numerical simulations confirmed that these lateral constraints significantly delayed failure and reduced overall deformations.
A comparison of modelling approaches revealed varied accuracies and limitations. The analytical model offered conservative predictions, effectively identifying the onset of cracking but lacking the capability to incorporate non-linear effects and force redistribution. The linear elastic finite element model accurately captured responses at lower water depths but failed to adequately represent deformations at higher loads, primarily due to its inability to simulate crack formation. In contrast, the non-linear FEM model accurately reflected the experimental observations, detailing progressive crack development and force redistribution. Although this model predicted ultimate failure mechanisms reliably, it required extensive input parameters, including accurate masonry strength and fracture energy.
The findings have clear implications for flood resilience practices. Unreinforced masonry walls safely withstand static water depths up to 90 cm without significant damage; however, increased water depths or hard debris impacts substantially after structural behaviour. Consequently, structural flood risk assessments should comprehensively address dynamic debris impacts, boundary conditions, and stress redistribution to avoid inaccurate or overly conservative/optimistic predictions.
Practical recommendations emerging from this study include establishing flood design thresholds, such as maintaining water depths below 90 cm for unreinforced masonry walls during extreme events, provided adequate top wall restraints exist. Protective measures, including barriers or localised strengthening, are advised for areas prone to hard debris impacts. Additionally, structural assessments using advanced non-linear finite element models, calibrated with experimental data, are recommended for precise predictions of wall deformation and failure. Damage models linking flood hazards to building damage should be updated accordingly.
Future research should expand on these insights, particularly focusing on cavity walls commonly found in Dutch residential buildings, the effects of openings such as windows and doors on wall capacity and failure mechanisms, dynamic water loading scenarios including rapidly changing water levels and waves, and the long-term effects of water infiltration and consequent masonry degradation.
Data availability statement
The original contributions presented in the study are included in the article/supplementary material, further inquiries can be directed to the corresponding author.
Author contributions
PK: Visualization, Writing – original draft, Writing – review and editing, Methodology, Formal Analysis. JB: Funding acquisition, Conceptualization, Writing – original draft, Supervision, Writing – review and editing. SJ: Writing – review and editing, Supervision. BK: Writing – review and editing, Supervision.
Funding
The author(s) declare that financial support was received for the research and/or publication of this article. This work was funded by the TKI Delta Technology project TU02 “Building Collapse and Fatality During Floods”, with support from Deltares, HKV Engineers, and Rijkswaterstaat.
Acknowledgments
The authors would like to acknowledge the assistance of various institutions and persons who helped realise these experiments. First, BSc-student Serban Alexandru, who helped substantially in the physical preparation of the experiments by working in the polder. The experiment wouldn’t have come to fruition without the input from Dr. Andrés Diaz-Loaiza and the discussions with Dr. Karin de Bruijn from Deltares, and Ir. Durk Riedstra from WVL. Furthermore, the experiments conducted at Flood Proof Holland are in debt to Lindsey Schwidder from the VP Delta - TU Delft union for the possibility to test there.
Conflict of interest
Author BK was employed by company HKV Lijn in Water.
The remaining authors declare that the research was conducted in the absence of any commercial or financial relationships that could be construed as a potential conflict of interest.
Generative AI statement
The author(s) declare that no Generative AI was used in the creation of this manuscript.
Any alternative text (alt text) provided alongside figures in this article has been generated by Frontiers with the support of artificial intelligence and reasonable efforts have been made to ensure accuracy, including review by the authors wherever possible. If you identify any issues, please contact us.
Publisher’s note
All claims expressed in this article are solely those of the authors and do not necessarily represent those of their affiliated organizations, or those of the publisher, the editors and the reviewers. Any product that may be evaluated in this article, or claim that may be made by its manufacturer, is not guaranteed or endorsed by the publisher.
References
Amiri, A., Gumiere, S. J., Gharabaghi, B., and Bonakdari, H. (2025). From warm seas to flooded streets: the impact of sea surface temperature on cutoff low and extreme rainfall in Valencia, Spain. J. Flood Risk Manag. 18, e13055. doi:10.1111/jfr3.13055
Asselman, N. (2005). Consequences of floods. Damage to buildings and casualties. WL-Delft Hydraulics. Report Q3668.00.
Brussee, A. R., Bricker, J. D., Bruijn, K. M. D., Verhoeven, G. F., Winsemius, H. C., and Jonkman, S. N. (2020). Impact of hydraulic model resolution and loss of life model modification on flood fatality risk estimation: case study of the bommelerwaard, the Netherlands. J. Flood Risk Manag. 2021, e12713. doi:10.1111/jfr3.12713
Chang, L., Messali, F., and Esposito, R. (2020). Capacity of unreinforced masonry walls in out-of-plane two-way bending: a review of analytical formulations. Structs 28, 2431–2447. doi:10.1016/j.istruc.2020.10.060
Chen, X., Hassan, W., Uijttewaal, W., Verwaest, T., Verhagen, H. J., Suzuki, T., et al. (2012). Hydrodynamic load on the building caused by overtopping waves. Coast. Eng. 2012, 59. doi:10.9753/icce.v33.structures.59
Clausen, L., and Clark, P. B. (1990). “The development of criteria for predicting dam-break flood damages using modelling of historical dam failures,” in International conference on river flood hydraulics. Wallingford, England: John Wiley and Sons Ltd. Hydraulics Research Limited.
Cuomo, G., Allsop, W., and McConnell, K. (2004). Dynamic wave loads on coastal structures: analysis of impulsive and pulsating wave loads. Coast. Struct. 2003, 356–368. doi:10.1061/40733(147)30
Damiola, M., Esposito, R., Messali, F., and Rots, J. G. (2018). “Quasi-static cyclic two-way out-of-plane bending tests and analytical models comparison for urm walls,” in 10th international masonry conference. Milan.
Diaz Loaiza, M. A., Bricker, J. D., Meynadier, R., Duong, T. M., Ranasinghe, R., and Jonkman, S. N. (2022). Development of damage curves for buildings near La Rochelle during storm Xynthia based on insurance claims and hydrodynamic simulations. Nat. Hzrds Earth Syst. Sci. 22, 345–360. doi:10.5194/nhess-22-345-2022
Drdácký, M. F. (2010). Flood damage to historic buildings and structures. J. Perform. Constr. Facil. 24 (5), 439–445. doi:10.1061/ASCECF.1943-5509.0000065
Endendijk, T., Botzen, W. J. W., de Moel, H., Aerts, J. C. J. H., Slager, K., and Kok, M. (2023). Flood vulnerability models and household flood damage mitigation measures: an econometric analysis of survey data. Water Resour. Res. 59. doi:10.1029/2022WR034192
Huizinga, J., de Moel, H., and Szewczyk, W. (2017). Global flood depth-damage functions. Methodology and the database with guidelines. Eur. 28552 En. doi:10.2760/16510
Iasio, A. D., Ghiassi, B., Briganti, R., and Milani, G. (2023). High strain rate effects in masonry structures under waterborne debris impacts. Eng. Struct. 297, 116911. doi:10.1016/j.engstruct.2023.116911
Iasio, A. D., Ghiassi, B., and Briganti, R. (2024). Effects of the structural mass on the waterborne debris impact force. Eng. Struct. 318, 118719. doi:10.1016/j.engstruct.2024.118719
Jafari, S., Esposito, R., Rots, J. G., and Messali, F. (2017). Characterizing the material properties of Dutch unreinforced masonry. Procedia Eng. 193, 250–257. doi:10.1016/j.proeng.2017.06.211
Jansen, L., Korswagen, P. A., Bricker, J. D., Pasterkamp, S., de Bruijn, K. M., and Jonkman, S. N. (2020). Experimental determination of pressure coefficients for flood loading of walls of Dutch terraced houses. Eng. Struct. 216 (2020), 110647. doi:10.1016/j.engstruct.2020.110647
Jonkman, S. N., Bočkarjova, M., Kok, M., and Bernardini, P. (2008). Integrated hydrodynamic and economic modelling of flood damage in the Netherlands. Ecol. Econ. 66, 77–90. doi:10.1016/j.ecolecon.2007.12.022
Kelman, I., and Spence, R. (2004). An overview of flood actions on buildings. Eng. Geol. 73 (2004), 297–309. doi:10.1016/j.enggeo.2004.01.010
Korswagen, P. A. (2016). Structural damage to masonry housing due to earthquake-flood Multi-hazards - a framework to assess damage from earthquakes and floods, together with a case study in the province of Groningen in the Netherlands. Groningen, Netherlands: MSc Thesis - Delft University of Technology.
Korswagen, P. A., Longo, M., and Rots, J. G. (2022). Fragility curves for light damage of clay masonry walls subjected to seismic vibrations. Bull. Earthq. Eng. 20, 6193–6227. doi:10.1007/s10518-022-01404-0
Kowalewski, Ł., and Gajewski, M. (2015). Determination of failure modes in brick walls using cohesive elements approach. Procedia Eng. 111, 454–461. doi:10.1016/j.proeng.2015.07.116
Kreibich, H., Thieken, A. H., Petrow, T., Müller, M., and Merz, B. (2005). Flood loss reduction of private households due to building precautionary measures – lessons learned from the elbe flood in August 2002. Nat. Hazards Earth Syst. Sci. 5 (5), 117–126. 1684-9981/nhess/2005-5-117. doi:10.5194/nhess-5-117-2005
Lawrence, S., and Marshall, R. (2000). “Virtual work design method for masonry panels under lateral load,” in 12Th international brick/Block masonry conference.
Moaiyedfar, Y., and Deniz, D. (2025). Collapse fragility models for unreinforced masonry buildings under flood and flow-type landslide actions. J. Build. Eng. 101, 111895. doi:10.1016/j.jobe.2025.111895
Pistrika, A. K., and Jonkman, S. N. (2009). Damage to residential buildings due to flooding of New Orleans after hurricane Katrina. Nat. Hazards. 54, 413, 434. doi:10.1007/s11069-009-9476-y
Platt, S. L., Erandi, I., Jayasinghe, C., Jayasinghe, T., Maskell, D., Ranasinghe, G., et al. (2020). Improving the lateral load resistance of vernacular masonry walls subject to flooding. Proc. Institution Civ. Engineers– Constr. Mater. 176 (3), 94–105. doi:10.1680/jcoma.20.00004
Rikkert, S., Stouten, D., Kolen, B., and Zethof, M. (2025). Aanbevelingen voor verbeteringen van slachtofferberekeningen - Kennisalliantie Slachtoffers en Evacuatie. Deltares 11210365-009-ZWS-0001, 30 januari 2025.
Schwarz, J., and Maiwald, H. (2008). “Damage and loss prediction model based on the vulnerability of building types,” in 4th international symposium on flood defence: managing flood risk, reliability and vulnerability Toronto. Ontario, Canada.
Shen, Y., Lindenbergh, R., and Wang, J. (2017). Change analysis in structural laser scanning point clouds: the baseline method. Sensors 17, 26. doi:10.3390/s17010026
Vaculik, J., and Griffith, M. C. (2017). Out-of-plane load–displacement model for two-way spanning masonry walls. Eng. Struct. 141 (2017), 328–343. doi:10.1016/j.engstruct.2017.03.024
Willis, C. R. (2004). “Design of unreinforced masonry walls for out-of-plane loading,”. The University of Adelaide. Available online at: https://librarysearch.adelaide.edu.au/permalink/61ADELAIDE_INST/rinku3/alma9927942026301811
Wüthrich, D., Korswagen, P. A., Selvam, H., Oetjen, J., Bricker, J., and Schüttrumpf, H. (2024). Field survey assessment of flood loads and related building damage from the July 2021 event in the Ahr valley (germany). J. Flood Risk Manag. doi:10.1111/jfr3.13024
Xiao, S., Li, N., and Guo, X. (2021). Analysis of flood impacts on masonry structures and mitigation measures. J. Flood Risk Manag. 14, e12743. doi:10.1111/jfr3.12743
Keywords: unreinforced masonry (URM), out-of-plane behaviour, hydrostatic pressure (flood loads), full-scale experiment, two-way bending
Citation: Korswagen PA, Bricker JD, Jonkman SN and Kolen B (2025) Experimental and numerical analysis of a masonry wall under hydrostatic and debris impact loads. Front. Built Environ. 11:1644699. doi: 10.3389/fbuil.2025.1644699
Received: 10 June 2025; Accepted: 08 September 2025;
Published: 01 October 2025.
Edited by:
Hosam Saleh, Egyptian Atomic Energy Authority, EgyptReviewed by:
Radosław Jasiński, Silesian University of Technology, PolandDaniel Cruze, Hindustan Institute of Technology and Science, India
Hamid Sadegh-Azar, Technical University of Kaiserslautern, Germany
Copyright © 2025 Korswagen, Bricker, Jonkman and Kolen. This is an open-access article distributed under the terms of the Creative Commons Attribution License (CC BY). The use, distribution or reproduction in other forums is permitted, provided the original author(s) and the copyright owner(s) are credited and that the original publication in this journal is cited, in accordance with accepted academic practice. No use, distribution or reproduction is permitted which does not comply with these terms.
*Correspondence: Paul A. Korswagen, cC5hLmtvcnN3YWdlbkB0dWRlbGZ0Lm5s