 Ammar T. Al-Sayegh
- Civil Engineering Department, College of Engineering & Petroleum, Kuwait University, Sabah Al-Salem University City, Kuwait
This study examines various reinforcement detailing approaches in Single-Story-Single-Bay (SSSB) reinforced concrete (RC) frames using the design tool SAP 2000 and nonlinear finite element analysis (NLFEA) with ABAQUS. A finite element model of the SSSB was developed in ABAQUS, adjusted based on experimental data from prior tests. The Concrete Damaged Plasticity (CDP) model simulated the behavior of concrete, while steel reinforcement bars were modelled as bilinear elastoplastic materials. After calibration, the peak lateral load and displacement values from the FEA models closely matched experimental results. The Control Model (CM) served as a basis for new models: (i) Half Diameter of Stirrups in the Beam (HDB), (ii) Half Diameter of Stirrups in both Beam and Columns (HDBC), and (iii) Double Spacing of Stirrups in Beam and Columns (DSBC). This analysis evaluated the effect of key design parameters, specifically the transverse reinforcement ratio (ρt), on SSSB’s load-carrying capacity. Results showed HDB had a 10.2% increase in lateral load compared to CM, while HDBC and DSBC demonstrated decreases of 15.8% and 15.5%, respectively, relative to experimental values.
1 Introduction
Since the mid-1950s, the construction boom in multi-story buildings has significantly expanded the roles and expertise required of structural engineers (Mohamed et al., 2009). These professionals are now responsible for ensuring the safety, durability, and cost-effectiveness of RC multi-story buildings. Over the years, structural engineering has introduced various complex analysis methods to meet these demands (ACI, 2014; EC2. Eurocode 2, 2004). Today, advanced tools are used to design new structures by updated guidelines and assess existing RC structures against these new standards (Cotsovos, 2010; Behnia et al., 2014; Said et al., 2013; Soyoz and Feng, 2009; Lignola et al., 2009; Lee et al., 2011; Zhang and Foschi, 2004; Zhao et al., 2011). This evolution has led to more intricate and detailed analyses, necessitating greater computational resources and time. Modern requirements emphasize the use of tools capable of making accurate predictions, especially concerning brittle failure modes (Abaqus, 2012; ADINA, 2015; SAP, 2013; DIANA, 2008). In recent years, significant progress has been made in developing models to predict the brittle behaviour of RC frame elements precisely. These analytical tools are crucial for several purposes, including (i) designing new RC structures, (ii) evaluating existing RC structures following contemporary standards, (iii) assessing the strength, safety, and integrity of deteriorated or damaged structures, (iv) resolving issues that emerge post-construction or due to changes in the use or functionality of existing structures, and (v) analysing the causes of structural failures or collapses (Christidis et al., 2013; Koppitz et al., 2013; Flores, 2004; Schueremans and Gemert, 2004; Zhang et al., 2025; Zha et al., 2023; Long and Lee, 2015).
To address these challenges in the construction industry, structural engineers must assess the performance and response of RC structures under extreme loading conditions (Lee et al., 2011; Zhang and Foschi, 2004; Ali et al., 2014; Balouch, 2021; Elshamandy et al., 2018; Greifenhagen and Lestuzzi, 2005; Hadad et al., 2015). This assessment involves evaluating the load-carrying capacity of RC structures, particularly their brittle response, and the failure mechanisms that occur to prevent catastrophic failure. Currently, engineers use nonlinear analysis procedures to study the brittle behavior of RC structures, which involve complex calculations. However, this nonlinear finite element analysis (NLFEA) software package, such as ABAQUS (Abaqus, 2012) and ADINA (ADINA, 2015) are commonly used for research purposes. The packages used in the industry for the analysis of such behaviour (i.e., SAP 2000 and ETABS) (SAP, 2013) are generally effective in predicting flexural failure modes; they often struggle with accurately forecasting shear (brittle) failure modes (Stratford and Burgoyne, 2003). Shear failures are brittle and occur with little warning, making accurate predictions in structural analysis essential. This ensures safe and cost-effective design solutions for RC frame structures. Inaccurate predictions may lead to unsafe designs by overestimating load-carrying capacity and ductility (Cotsovos, 2013; Guner and Vecchio, 2010; Sharma et al., 2011; Vecchio and Emara, 1992; Lai et al., 2022; Zhou et al., 2020; Ali Al-Tameemi et al., 2024; Theodossopoulos and Sinha, 2013; Nordell, 1965; Kadid and Boumrkik, 2008; Sung et al., 2013; Sharma et al., 2013).
Nonlinear finite element analysis (NLFEA) (Abaqus, 2012; ADINA, 2015) is a valuable supplement to experimental studies, providing a deeper understanding of the behavior of RC members under various loading scenarios. Researchers can accurately simulate complex structural responses by utilizing sophisticated NLFEA tools (Abaqus, 2012; ADINA, 2015). These tools incorporate advanced 3D finite element meshes to model structural geometry in detail, nonlinear material laws to capture the realistic behavior of concrete and reinforcement under stress, and failure criteria to predict crack propagation, yielding, and ultimate failure modes (Abbas et al., 2016; Abbas et al., 2010; Afifi et al., 2014; Ahmad and Shah, 2009). Furthermore, iterative solution techniques are employed to address the complexities of nonlinear behavior, ensuring convergence and stability in the analysis. This approach provides a powerful means of evaluating RC member performance, offering insights that are often challenging to achieve through experimental testing alone (Chaallal et al., 2003; Foster et al., 1996; Krawinkler and Seneviratna, 1998; Sipos et al., 2013).
Shame et al. (Hadad et al., 2015) selected a case study of a single-story-single-bay (SSSB) RC frame to investigate the effect of detailing on its capacity. After calibration, the peak lateral load and displacement of the finite element analysis (FEA) models closely matched the experimental results. The calibrated Control Model (CM) served as a base for new FEA models, including: (i) Half Diameter of Stirrups in the Beam (HDB), (ii) Half Diameter of Stirrups in both Beams and Columns (HDBC), and (iii) Double Spacing of Stirrups in Beams and Columns (DSBC). This study examined the effect of design parameters, including the transverse reinforcement ratio (ρt), on the load-carrying capacity of short-span slender beams, with a focus on brittle failure modes. Results showed that the HDB model had 10.2% more lateral load than CM, while HDBC and DSBC were 15.8% and 15.5% less compared to experimental values.
2 Case study
To enhance the strength and stiffness of multi-story structures, which are inherently more vulnerable to seismic and wind forces, the cross-sectional dimensions of structural members are often increased progressively from top to bottom. While this approach ensures structural safety, it can render the design uneconomical. Consequently, it becomes essential to incorporate specialized mechanisms or systems to improve the lateral stability of the structure (Hadad et al., 2015). Braced frames address lateral forces through the bracing action provided by diagonal members. Fully braced frames offer higher rigidity compared to other configurations. However, from an economic perspective, partially braced frames are advantageous as they induce minimal forces in the structure while maintaining displacements within acceptable limits (Hadad et al., 2015).
In 1980, a 12-story reinforced concrete building was retrofitted after a minor earthquake exposed seismic vulnerabilities. The retrofitting included bracing the perimeter frames on the shorter, weaker axis and adding a robust external steel truss system to resist overturning forces. The truss was designed for easy access to the building’s interior and underground parking, while the floor slabs were reinforced to transfer shear forces to the new stiff frames (Hadad et al., 2015). This study examines the structural behavior of steel and concrete cross-bracing and its influence on the lateral load-carrying capacity and energy dissipation characteristics of reinforced concrete frames. Furthermore, it provides a comparative analysis of braced frames versus infilled frames. The findings offer valuable insights into strengthening concrete frames by utilizing crossed steel and concrete systems to enhance their lateral load resistance and overall structural performance.
The selected case study of the Single-Story Single Bay (SSSB) RC frame was experimentally established by (Hadad et al., 2015). The design specifications and dimensions of the frame are illustrated in Figure 1. Experimental findings showed that the frame exhibits ductility and fails in a flexural mode. The concrete bracing could be integrally cast with the frame or connected separately with embedded dowels. The concrete mix aimed for a compressive strength of about 27.5 MPa after 28 days. Materials included ordinary Portland cement, natural sand, well-graded crushed limestone, and water. High-strength deformed steel bars of 12 mm and 10 mm were used for reinforcement, along with 6 mm mild steel bars for stirrups (Hadad et al., 2015).

Figure 1. Dimension and RCC details of the SSSB RC Frame.
Figure 2 depicts the general layout of the experimental setup and the instrumentation system utilized for testing all specimens. Each specimen’s lower beam was anchored to a rigid platform with two anchors. During testing, cyclic loading was applied using a displacement-controlled hydraulic jack. In the control specimen, initial cracks appeared on the tension side of the column near the base at around 6 mm of top displacement. As the lateral load increased, more cracks formed near the beam-column connections, with diagonal cracks emerging at higher load levels. Ultimately, failure occurred due to the shear failure of these connections, as shown in Figure 2.
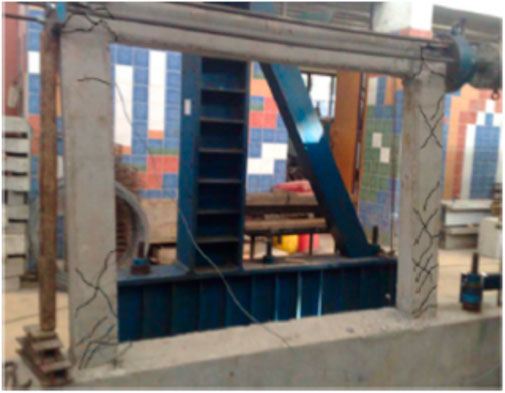
Figure 2. Experimental results of SSSB RC Frame (Hadad et al., 2015).
3 Finite element analysis of RC structural configurations
Renowned for finite element analysis (FEA) (Abaqus, 2012; ADINA, 2015) and precision in simulating materials such as concrete and steel, ABAQUS (Abaqus, 2012) facilitated the development of finite element models to predict the behavior of RC frames accurately. In this modelling framework, concrete was represented with a 3D solid stress section, while reinforcement bars used wire elements with 3D deformability. Reliable simulations involved appropriate boundary conditions and gradual loading configurations. The model was refined to address variations in key parameters, including the concrete’s shape factor, viscosity, dilation angle, and mesh characteristics. A parametric study was conducted using the updated finite element model to assess the impact of these parameters on the behavior of the RC frame, enhancing the robustness of the numerical predictions.
3.1 Compressive uniaxial stress-strain relationship for concrete
The simplified upper-bound relationship between tensile stress and displacement used in this research is illustrated in Figure 3. For the CPD model, there are key parameters that must be defined, including (i) the viscosity parameter, which helps smooth out the material response in Abaqus/Standard, and (ii) the dilation angle, ψ, representing the angle of inclination of the failure surface relative to the hydrostatic axis. The dilation angle controls the plastic flow and overall material behavior under loading (Abaqus, 2012).
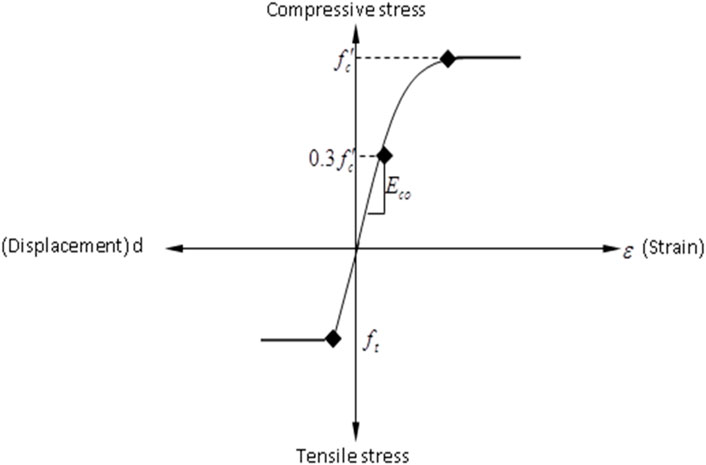
Figure 3. Complete Stress-strain curve for Concrete (Abaqus, 2012).
The different concrete material properties used in ABAQUS Standard, defining materials and step modules, are given in.
Table 1 The elasticity modulus (Ec) of concrete was calculated using the ACI code given by Equation 1.
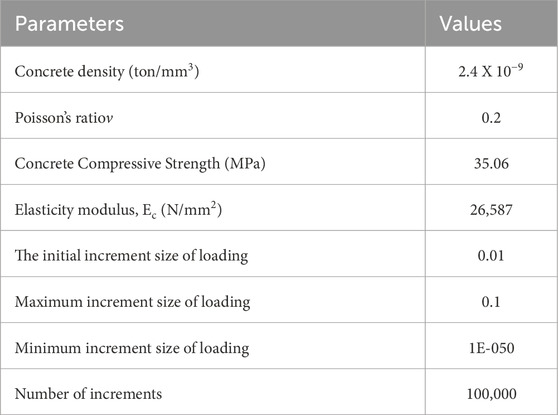
Table 1. Different properties used in ABAQUS for concrete (Abaqus, 2012).
The CPD model (Abaqus, 2012) initially developed for concrete materials (Abaqus, 2012) is versatile enough to simulate the behavior of other quasi-brittle materials, such as masonry and mortar. This model is designed to capture two primary failure mechanisms: tensile cracking and compressive crushing. The key inputs required for the CDP model are the material’s uniaxial stress-strain behavior under tension and compression (Abaqus, 2012). In tension, the material is assumed to exhibit linear-elastic behavior up to its peak tensile strength, beyond which it follows a softening curve, as illustrated in Figure 4a. In compression, the response begins with a linear elastic phase, transitions to a hardening region, and finally undergoes softening, as depicted in Figure 4b. These behavioural characteristics allow the CDP model (Abaqus, 2012) to accurately represent the progressive damage and nonlinear response of quasi-brittle materials under complex loading conditions.
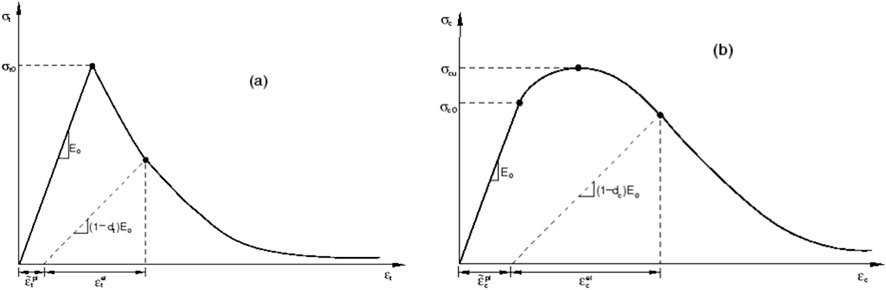
Figure 4. CPD modelling (a) under tension and (b) under compression (Abaqus, 2012).
The main advantage of this material model is its ability to differentiate between tension and compression behaviours, capturing variations in yield strengths, tension softening, and elastic stiffness degradation. In concrete, this stiffness reduction is primarily due to tensile cracking and compressive crushing, as represented by scalar-damage theory. A single scalar damage variable quantifies the extent of damage and modifies the elastic stiffness. The stress-strain relationship, incorporating this damage parameter, is expressed in Equation 2, illustrating the material’s transition from an undamaged to a damaged state.
where
and is related to the Cauchy stress through the scalar degradation variable as Equation 4.
3.2 Parameters for concrete behaviour
Different parameters, including the dilation angle, define the plasticity model of concrete
The compressive stress-strain diagram for concrete is shown in Figure 5, according to Eurocode 2 (EC2. Eurocode 2, 2004) According to the ABAQUS manual (Abaqus, 2012) the linear elastic behavior can be taken up to 0.4fcm (EC2. Eurocode 2, 2004) proposed the approximate relationships built on the experimental results provided by Equations 6, 7 to determine the strain εc1 at the average compressive strength of concrete and the ultimate strain εcu1.
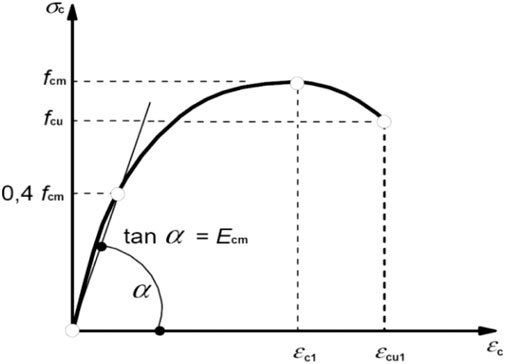
Figure 5. Concrete modelling in ABAQUS (EC2. Eurocode 2, 2004).
Equation 8 provided by EuroCode 2 (EC2. Eurocode 2, 2004) the research used nonlinear behaviour of structures to model the concrete stress-strain relationship.
Where in Equation 9
EuroCode 2 (EC2. Eurocode 2, 2004) also proposed an equation for the non-linear behaviour of the stress-strain relationship of structures, given by Equation 10
Where, εco is compressive strain at peak loads, and according to EuroCode 2 (EC2. Eurocode 2, 2004) is equal to 0.002. EuroCode 2 (EC2. Eurocode 2, 2004) modified the tension-stiffening model of RC given by Figure 6. In this modified model, the only change was that the sudden drop of the tensile stress-strain curve at the critical strain εcr was from the ultimate stress σto to 0.77σto, instead of 0.80σto.
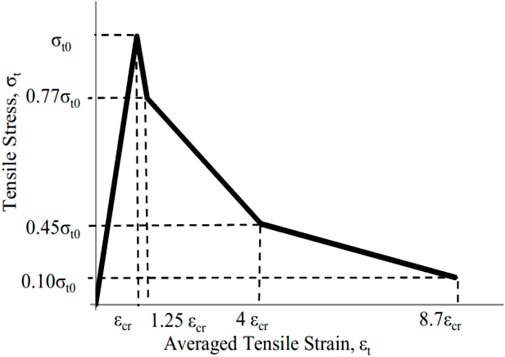
Figure 6. Tensile behaviour of Concrete in ABAQUS (EC2. Eurocode 2, 2004).
The Tensile behaviour of Concrete in ABAQUS was estimated by using Equation 11 (EC2. Eurocode 2, 2004)
The softening branches in concrete’s compressive and tensile behaviours indicate crushing and cracking. The elastic range is defined by Young’s modulus and Poisson’s ratio, while the inelastic range uses stress-inelastic strain data. Additional plasticity parameters, such as dilation angle, viscosity parameter, stress ratio, eccentricity, and shape factor (K), are needed to accurately describe the material’s plastic behavior (Abaqus, 2012). The dilation angle reflects the material’s internal friction angle and affects shear dilation during plastic deformation. Plastic Potential Eccentricity measures how quickly the hyperbolic flow potential converges, typically set at 0.1. The stress ratio compares compressive yield stress in biaxial and uniaxial states, with a default of 1.16. The shape factor (K) indicates the hydrostatic effective stress ratio between tensile and compressive meridians, affecting the yield surface shape, and ranges from 0.5 to 1, with a default value of 0.667. Lastly, viscosity is a regularization parameter that converges the concrete’s constitutive equations during Abaqus/Standard analyses (Abaqus, 2012), helping ensure numerical stability. These parameters, as summarized in Table 2, are critical for accurately modelling the nonlinear behavior of concrete under various loading conditions.
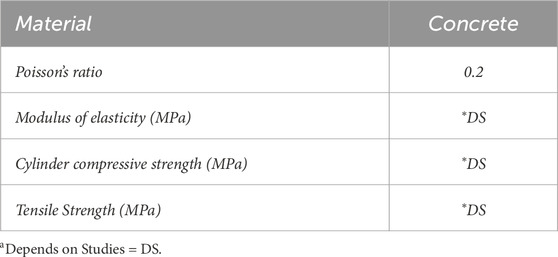
Table 2. Properties of concrete used in the model (Abaqus, 2012).
4 Modeling and calibration of control models
4.1 FEM modelling
Figures 7, 8 explain the detailed modeling process of the RC frame in ABAQUS (Abaqus, 2012). The front view of the SSSB is depicted in Figure 7a, while Figure 7b shows the beam-column connection, where the column’s bottom face is the master surface and the beam’s top face is the slave surface. This interaction approach also applies to the connection between the beam and the steel plates in Figure 7c. The RC frame’s support conditions, fixed at the bottom, are illustrated in Figure 7d. A 60 mm thick rigid steel plate was attached to the beam using a 'tie constraint' per ABAQUS standards, with the plates modeled as rigid elements having a Young’s modulus of 210 GPa and a density of 7.85 × 10⁻⁹ ton/mm3. Lateral loading was implemented to maintain the top end of the beam in a free state, thereby ensuring accurate representation of support conditions and load application. This approach guarantees a precise assessment of both support and loading parameters.
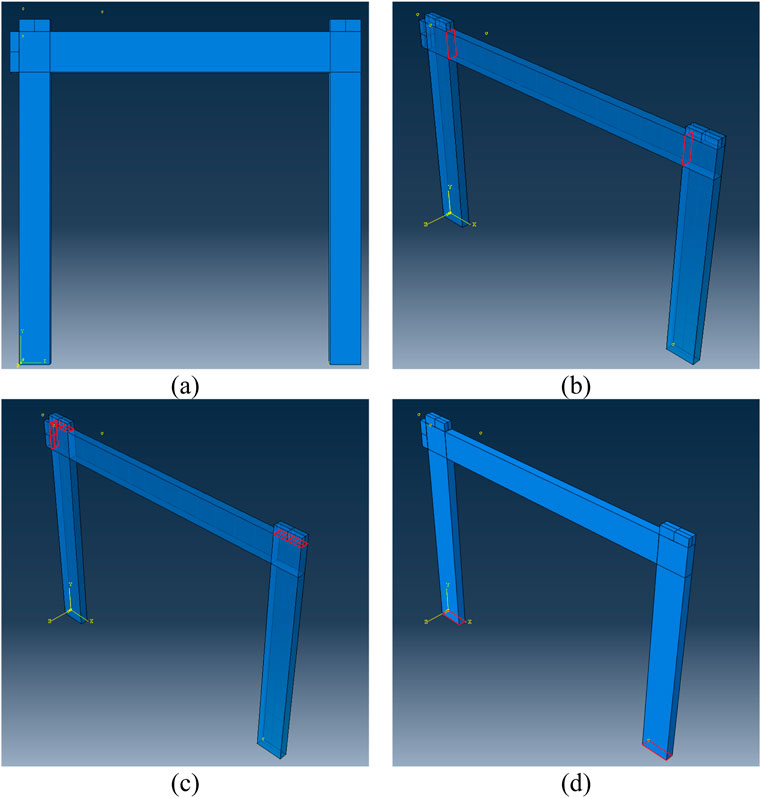
Figure 7. Modelling of SSSB in ABAQUS (a) 3D model, (b) Connection between Beam & Columns, (c) Connection between steel plates and beam, and (d) Fixed support condition of Column.
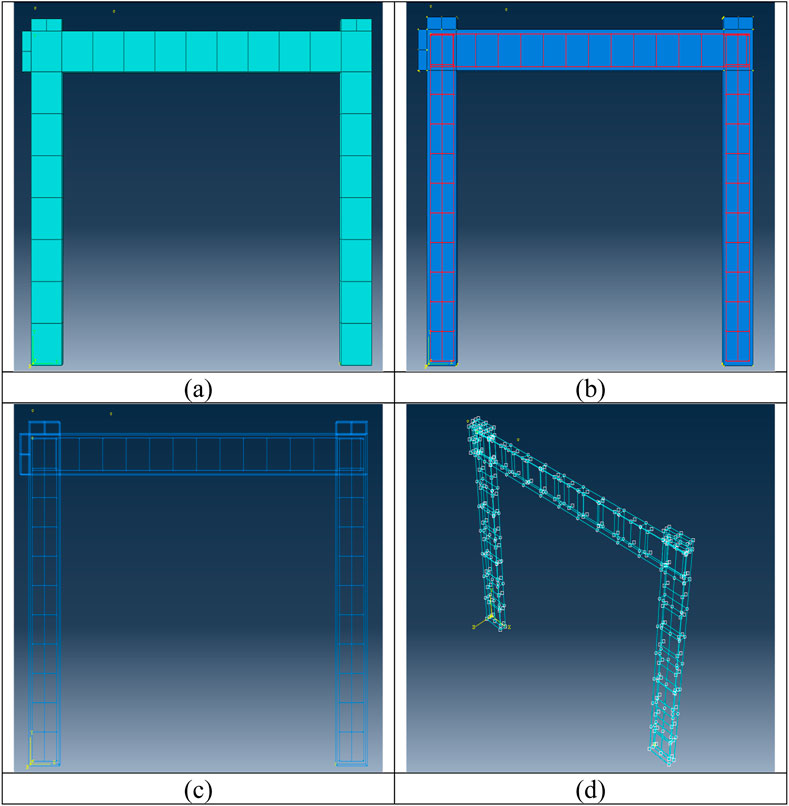
Figure 8. Modelling of SSSB in ABAQUS (a) Meshing of 3D model, (b) Steel Mesh in the frame, (c) Steel Mesh, and (d) Embedded steel mesh with concrete.
Figures 8a–d, illustrates the modelling of the steel cage in the SSSB RC frame. As per the ABAQUS guidelines, the steel mesh should be embedded within the concrete, as shown in Figure 8b. Using this technique, the nodes of the reinforcing bar elements were constrained to maintain compatibility with the degrees of freedom (DOF) of the surrounding host elements (concrete), as depicted in Figure 8c. To evaluate the lateral load-deflection behaviour of the SSSB RC frame up to failure, a static load was applied to the beam’s left side through the displacement control method, by using the Static General option in Abaqus. The displacement increment was set to 10 mm, allowing for a gradual and controlled application of load until structural failure occurred.
4.2 Calibration of CPD parameters
The essential parameters for the damage plasticity model of concrete were calibrated using experimental data in conjunction with the Static General Load option in Abaqus. The calibrated values include: (1) viscosity parameter: 0.0028, (2) dilation angle: 38°, (3) shape factor: 0.677, and (4) stress ratio: 1.0, as described in Table 3. A static load was applied until failure, with displacement increments under control. The numerical load-deflection curves for the analysed RC frame were compared with experimental results, confirming that these calibrated values accurately simulate the material’s behavior under load.
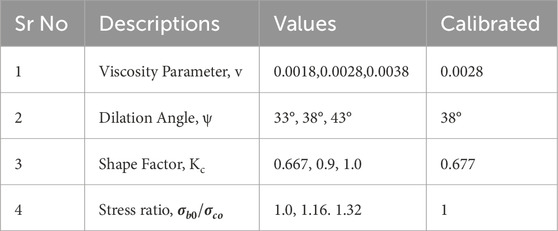
Table 3. Concrete damage plasticity parameters used in ABAQUS modelling (Abaqus, 2012).
The load-deflection curves of the examined reinforced concrete (RC) frame, when compared to those obtained through experiments, indicated the following calibrated parameter values: (1) a viscosity coefficient of 0.0028, (2) a dilation angle measuring 38°, (3) a shape factor of 0.677, and (4) a stress ratio of 1.0. These calibrated parameters were determined based on the results from the control model (CM) tests, as shown in Figures 9 –12.
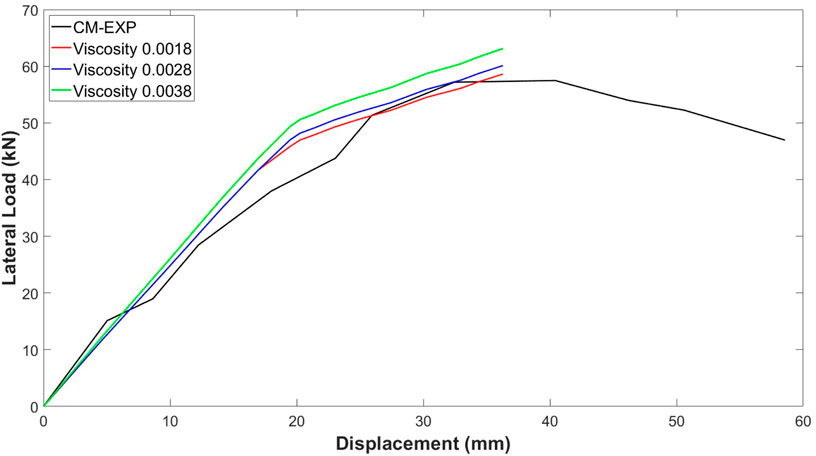
Figure 9. Lateral load-axial deformation response of CM against different values of viscosity.
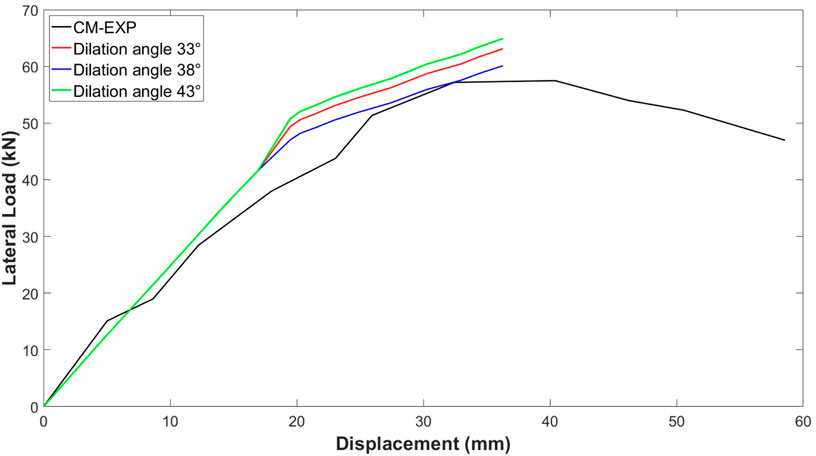
Figure 10. Lateral load-axial deformation response of CM against different values of dilation angle.
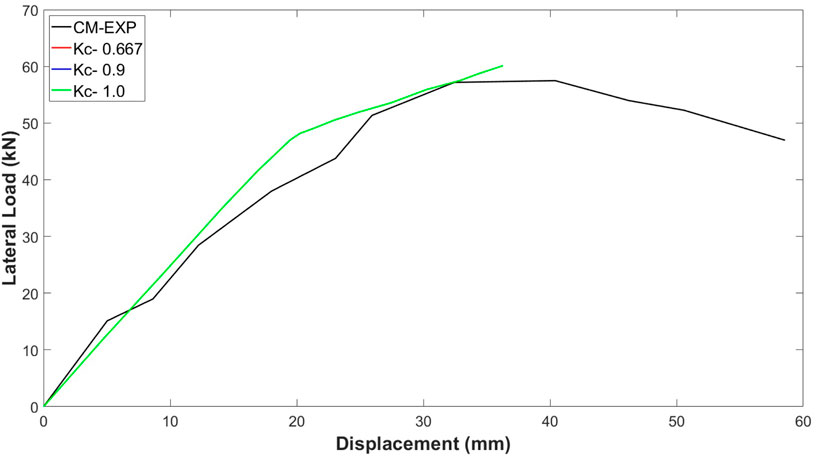
Figure 11. Lateral load-axial deformation response of CM against different values of shape factor.
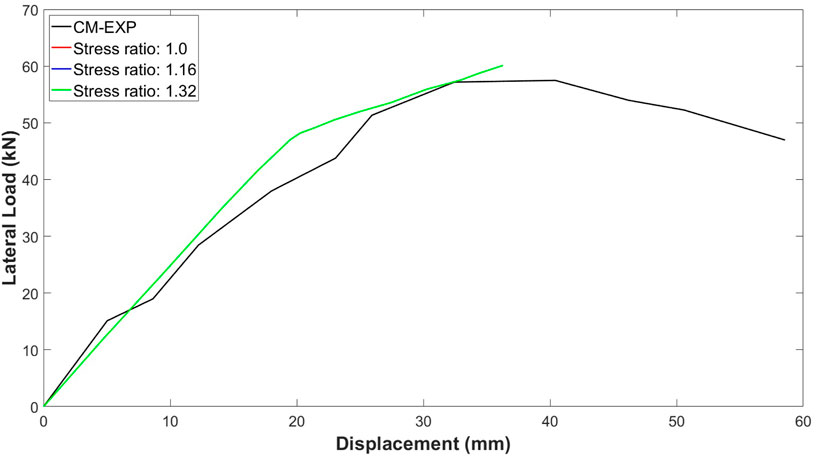
Figure 12. Lateral load-axial deformation response of CM against different values of stress ratio.
The calibrated Control Model (CM) was subsequently utilized for the numerical analysis of additional models, as detailed in the following section. Figure 9 illustrates the effect of the viscosity parameter on the columns' load-deflection response. The performance of the viscosity parameter is influenced by the size of the time increment used in the analysis. To achieve optimal results, smaller viscosity parameter values should be evaluated in conjunction with the pseudo-time scale of the finite element analysis. According to (Khan et al., 2020; Saeed et al., 2015; Ahmad et al., 2023; Raza et al., 2021; Ahmad et al., 2021; Raza et al., 2019; Ahmad and Cotsovos, 2023; Ahmad and Raza, 2020; Khan et al., 2015) the time increment step should be approximately 15% of the pseudo-time to ensure greater accuracy. In this study, the time increment step was set to automatic, with both the initial and maximum increment sizes fixed at 0.01 throughout the analysis. The most accurate approximation of the viscosity parameter was 0.0028, selected from the tested values of 0.0018, 0.0028, and 0.0038. This calibration was conducted with the dilation angle held constant at 38° and the mesh size set at 20 mm, ensuring consistency across the simulations and providing reliable results for the numerical modelling.
The dilation angle is a key material parameter for concrete, physically interpreted as the internal friction angle of the material. A sensitivity analysis of the dilation angle was conducted to evaluate its influence on the axial load-deflection response of the control sample. The Drucker–Prager plastic potential function is mathematically defined by Equations 12, 13, where αp represents the dilatancy parameter for concrete. The flow potential function utilized in the CPD model is derived from the Drucker–Prager hyperbolic function (Abaqus, 2012). This function, expressed in Equation 12, is derived from Equation 13. In this formulation, ψ represents the dilation angle, which defines the angle of inclination of the failure surface about the hydrostatic axis. The parameter ε denotes the eccentricity of the plastic flow potential function, which governs the shape of the hyperbolic flow potential curve.
Additionally, σt0 refers to the uniaxial tensile strength of the concrete at failure. Using the Drucker–Prager plastic potential function, as defined by Lee and Fenves (Abaqus, 2012) in Equation 13, the value of the dilation angle ψ is set to 38.
In Equation 13,
For the considered range of αp, the dilation angle (ψ) is expected to lie between 31° and 42°. This study analysed dilation angles of 33°, 38°, and 43°.
The results revealed that a dilation angle of 38° provided the best agreement with the experimental data when the viscosity parameter was set to 0.0028, and the mesh size was 20 mm. Consequently, a dilation angle of 38° was selected for all specimens' finite element (FE) simulations. Figure 10 illustrates the influence of the dilation angle on the axial load-axial deformation response for the control model (CM). The load-deflection curves indicate that, although changes in the dilation angle affect the results, their influence is relatively minor compared to the significant effect of the viscosity parameter.
As it is exhibited by Figures 9, 10, the load-displacement curve in relation to viscosity and dilation angle exhibits a comparable trend. This correlation can be attributed to the opposing effects of these variables on one another. During the calibration process, when one parameter is altered, the other remains constant, allowing for a comprehensive examination of the specific impacts involved.
Figure 11 illustrates the impact of different shape factor values, denoted as Kc, on the load-deflection behavior observed in the control specimen. The analysis encompasses three specific Kc values—0.667, 0.9, and 1.0—chosen to represent a range from a lower bound of 0.667 to the upper limit of 1.0. These values were selected to investigate how variations in the shape factor affect the structural response under applied loads, particularly in terms of deflection characteristics. The results indicate that increasing Kc has no significant impact on the load-displacement curve, as illustrated in Figure 11. Consequently, a value of Kc = 0.667 was selected to achieve optimized results while minimizing computational time for the control model (CM).
For the calibration of the Stress ratio,
4.3 Stresses of calibrated model
Figure 13 provides a comprehensive visualization of the structural response and failure mechanisms of the SSSB RC Frame at ULS, emphasizing the critical role of material behaviour and damage distribution. Figure 13, numerical predictions derived from finite element analysis conducted using ABAQUS demonstrate the detailed distribution of critical parameters along the span of the SSSB Reinforced Concrete Frame at the ULS;
a. Stress (S33): The distribution of vertical stress (S33) along the span reveals tensile and compressive areas in the concrete frame under load.
b. Strain (E33): Vertical strain (E33) distribution reveals deformation patterns indicating stress concentrations along the frame.
c. Compressive Damage (DAMAGEC): Visualization of compressive damage (DAMAGEC) highlights zones of concrete degradation, especially in beam-column connections.
d. Plastic Equivalent Strain (PEMAG): The Distribution of plastic equivalent strain (PEMAG) shows permanent deformations and significant inelastic behavior.
e. Comparative Values: Graphical comparison of S22 (horizontal stress), E33 (vertical strain), and PEMAG (plastic strain) provides insights into their interactions along the frame.
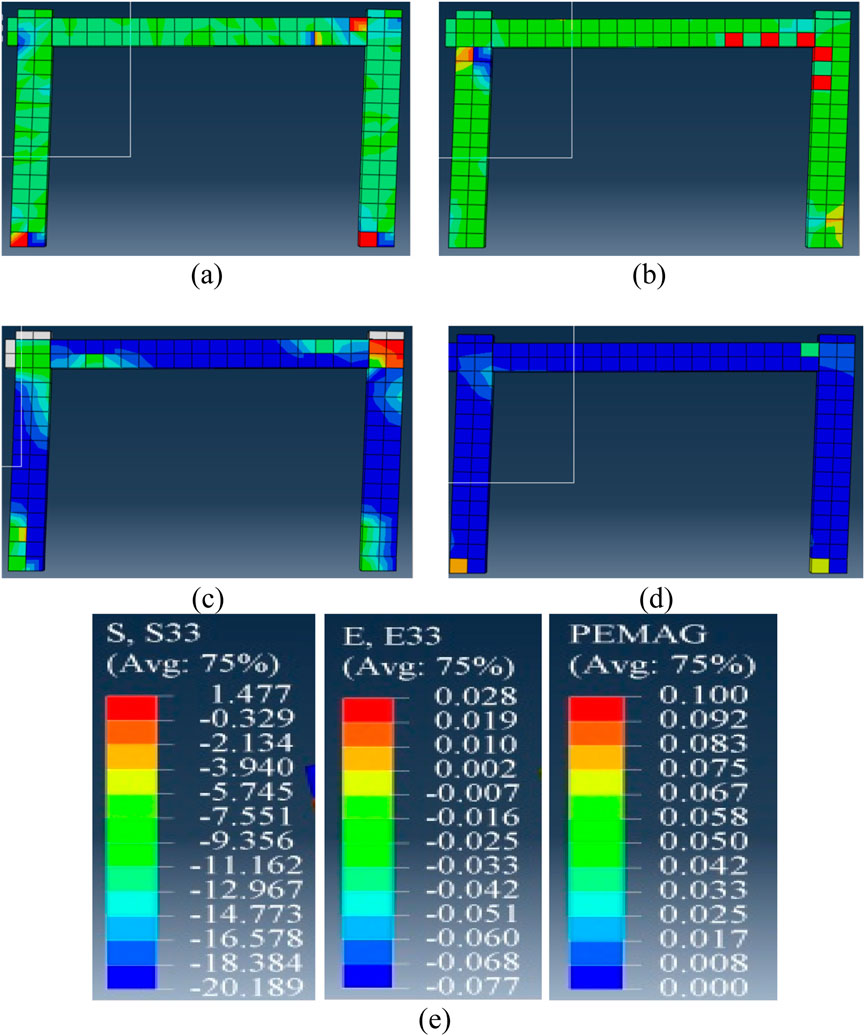
Figure 13. SSSB RC frame (a) stress S33, (b) strain E33, (c) DAMAGEC, and (d) PEMAG at ultimate limit state (e) values for S22, E33, and PEMAG.
The SSSB RC frame serves as the control model in this research due to the wealth of experimental test data available. Initially, flexural cracks were detected near the column bases when horizontal displacement reached approximately 6 mm. As the lateral load increased, additional cracks formed, especially around the connections between beams and columns, revealing significant stress concentrations in those areas. Eventually, diagonal cracks developed in the upper sections of the columns, extending into the beam-column joints. This underscores the progressive damage mechanisms and the susceptibility of these connections when subjected to lateral loading. Furthermore, the DAMAGE figure from ABAQUS is presented in Figure 15c, which compares the Damage with the experimental results and SAP 2000 results.
Figure 14 provides an in-depth view of the reinforcement’s stress and yield characteristics, emphasizing their role in resisting lateral loads and contributing to the specimen’s overall structural performance. Figure 14 Numerical predictions from the ABAQUS (Abaqus, 2012) finite element analysis illustrating the reinforcement behavior in the SSSB RC Frame at the ULS.
a) Axial Yield Criterion (AC Yield) Distribution: This illustrates where the axial yield criterion is met or exceeded in the reinforcement bars, indicating the onset of plastic deformation under load. It highlights critical zones of yielding, essential for evaluating structural capacity and safety.
b) Maximum Principal Stress (S, Max) Distribution: This analysis examines the distribution of maximum principal stress in reinforcement bars, with a focus on areas experiencing high tensile forces. These stress concentrations identify regions at risk of failure under tensile loading, providing insights for structural integrity and potential design optimizations for performance under extreme loads.
c) The plot of the Axial Yield Criterion (AC Yield) and Maximum Principal Stress (S, Max) outlines the stress-strain behavior of reinforcement bars under load. It highlights the transition from reinforcement to plastic deformation, providing insights into axial stresses and principal tensile forces. This information is crucial for assessing structural performance and identifying areas needing design modifications for enhanced safety and resilience. Positive values indicate tensile stresses and strains, while negative values reflect compressive ones. The highest stress and strain values are observed at the base of the column and within the beam-column joint region.
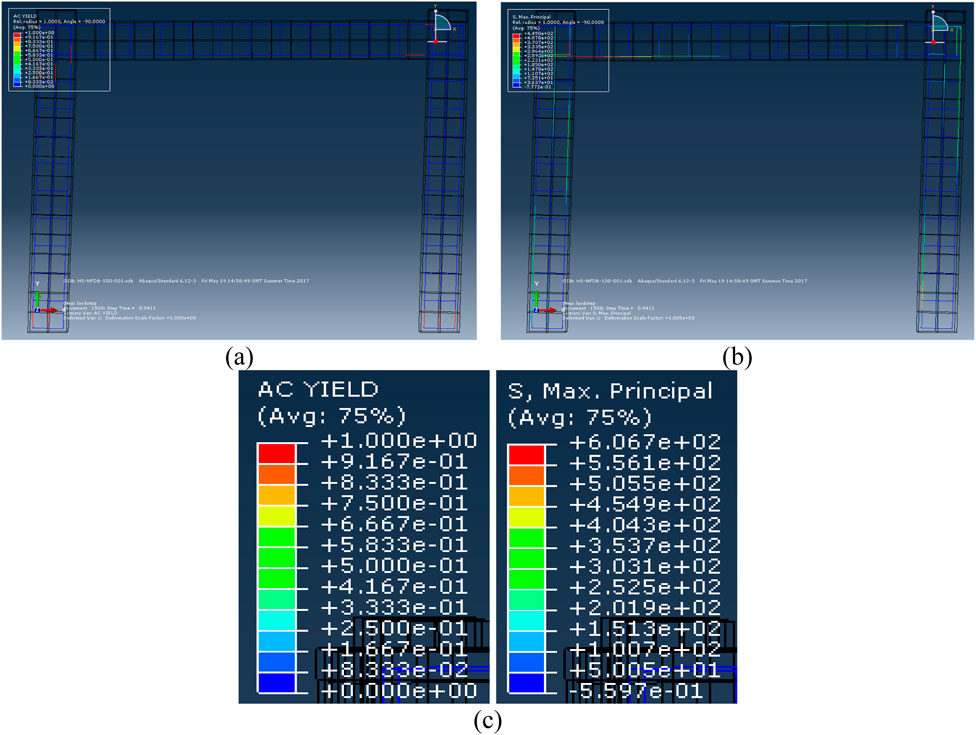
Figure 14. SSSB RC frame (a) AC yield and (b) maximum principal stress at ultimate limit state (c) values for AC yield and s, maximum.
Figure 15a: This figure illustrates the results of the push-over analysis conducted in SAP 2000 (SAP, 2013), focusing on the formation, location, and classification of plastic hinges in the frame members at the ULS. The plastic hinges are categorized into distinct performance levels B (Barely Yielded), IO (Immediate Occupancy), LS (Life Safety), CP (Collapse Prevention), D (Damaged Beyond Repair), and E (Failure)—providing a detailed depiction of the progressive failure mechanisms within the structure. Figure 15b: This counterpart visualization presents the corresponding predictions from ABAQUS. It offers an alternative perspective by showcasing the extent and severity of damage in the frame members as they approach failure. The ABAQUS (Abaqus, 2012) model captures the structure’s nonlinear behavior with higher fidelity, highlighting stress concentrations and regions of significant plastic deformation.
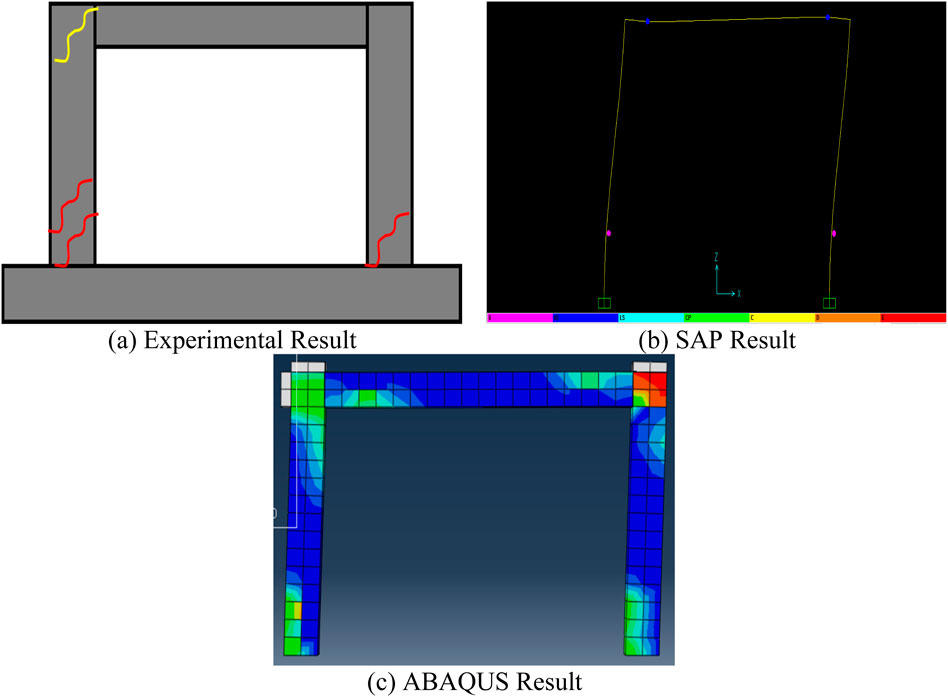
Figure 15. Results of (a)experimental (b)SAP 2000, (c)ABAQUS for SSSB RC Frame.
Figure 16 presents a comparative analysis of the load-deflection curves, showcasing the overall response of RC frames under applied loading as predicted by ABAQUS (Abaqus, 2012) and SAP 2000 (SAP, 2013) and the experimental data obtained during physical testing. The load-deflection curve from SAP2000 consistently predicts a higher load-carrying capacity for the RC frames than what is observed in experiments, highlighting the shortcomings of its modelling method. Conversely, the predictions made by ABAQUS are more in line with experimental results, successfully replicating the structural response under different loading conditions and demonstrating its reliability in modelling the complex behavior of RC frames.
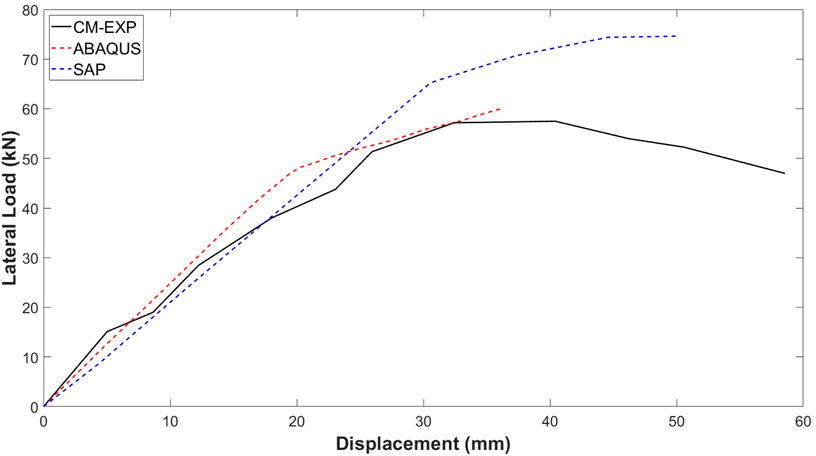
Figure 16. Comparison of Load-Deflection curves for SSSB RC Frame.
5 New fem models
To evaluate the influence of varying reinforcement detailing, this study proposes analysing three numerical models following the calibration of the control model. A parametric study will be conducted, systematically altering the transverse reinforcement (stirrups) in the beams and columns. This adjustment entails deliberately decreasing the diameter of the stirrups or widening their spacing to promote a shear-critical failure mode. The Control Model (CM) served as the reference point for creating three new finite element analysis (FEA) models that featured different stirrup arrangements. These models comprised:
i. Half Diameter of Stirrups in Beam (HDB) focuses on examining the consequences of exclusively decreasing the stirrup diameter within the beam section.
ii. Half Diameter of Stirrups in Beam and Columns (HDBC) assesses the effects of uniformly reducing the stirrup diameter across both beam and column elements.
iii. Double Spacing of Stirrups in Beam and Columns (DSBC) investigates the structural behavior when the spacing of stirrups is increased twofold in both beam and column areas.
Table 4 provides a comprehensive overview of the case studies for short and slender RC SSSB frames under shear failure (SF) conditions. This approach aims to deepen the understanding of how different reinforcement configurations impact the structural behavior and failure mechanisms of RC frames.
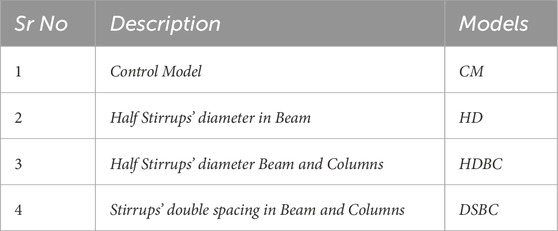
Table 4. Case studies of SB RC frame SF.
5.1 Case for HDB
For RC frame analysis (SSSB RC Frame C-SF), modifications have been made to examine the behavior of a modified frame known as HDB. The beams in this modified frame have transverse reinforcement that is half the size of the stirrups used in the control model. As a result, as shown in Table 4, the transverse reinforcement in the beams is reduced by 75% compared to the original frame that was experimentally studied. The transverse reinforcement arrangement in the modified frame under consideration is shown in Figure 17.
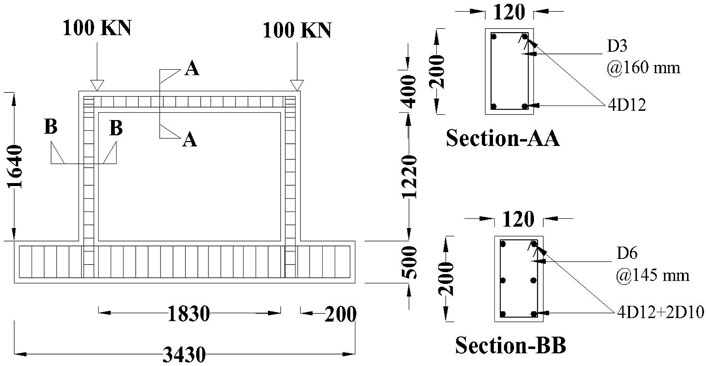
Figure 17. Reinforcement details of HDB.
Figure 18 comprehensively illustrates the structural response of the HDB with reduced transverse reinforcement, emphasizing its impact on stress distribution, damage patterns, and failure mechanisms. Figure 18 described the stress (S33), strain distribution (E33), compressive damage (DAMAGEC), plastic equivalent strain (PEMAG), and their contour damage distribution in the modified specimen HDB at the ULS.
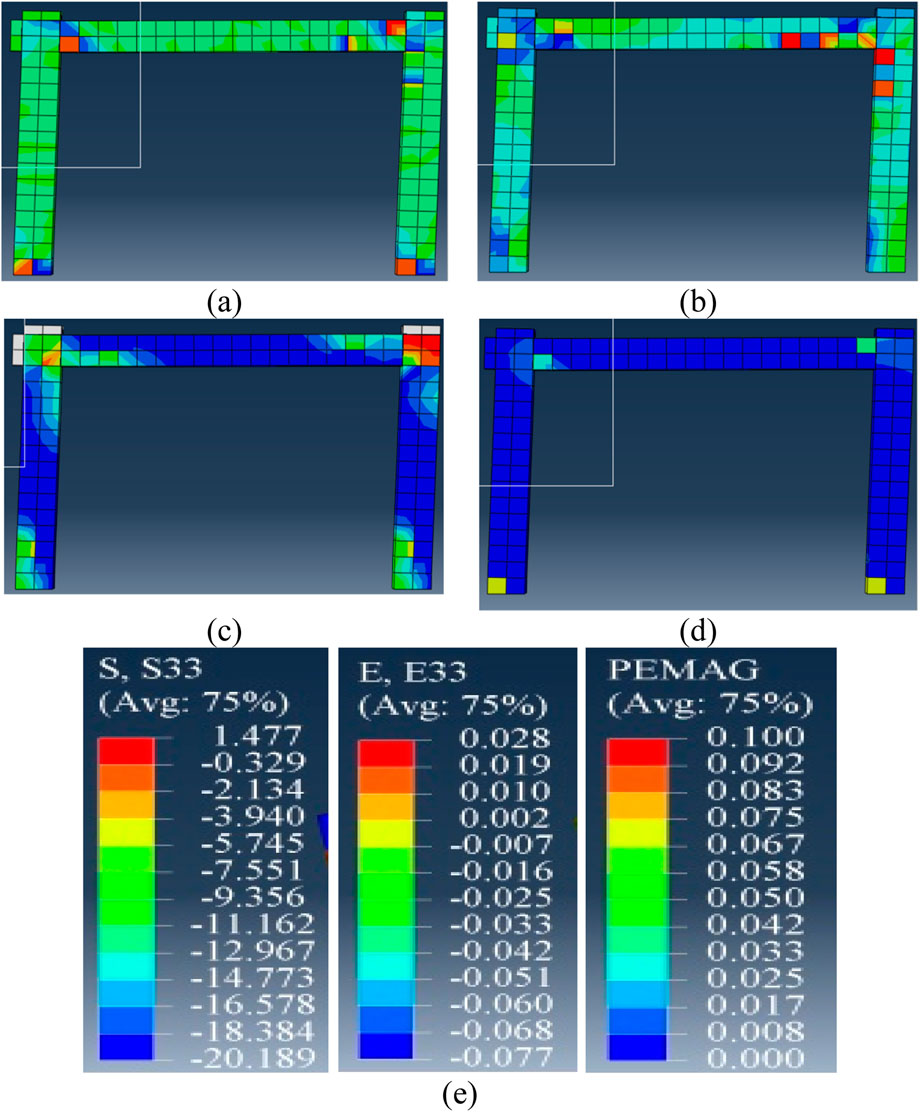
Figure 18. Hdb RC frame (a) stress S33, (b) strain E33, (c) DAMAGEC, and (d) PEMAG at ULS (e) values for S22, E33, and PEMAG.
Figure 19 provides an in-depth view of the reinforcement’s stress and yield characteristics, emphasizing their role in resisting lateral loads and contributing to the specimen’s overall structural performance. The analysis presents numerical predictions of AC Yield and Maximum Principal Stress (S, Max) from ABAQUS for the Half Diameter of Stirrups in Beam (HDB) model at ULS. It reveals stress distribution and deformation patterns in reinforcement elements, emphasizing critical areas where materials approach capacity. This visualization illustrates how a reduced stirrup diameter affects the beam’s structural integrity and load resistance under extreme conditions, offering insights into the performance of reinforced concrete components at failure.
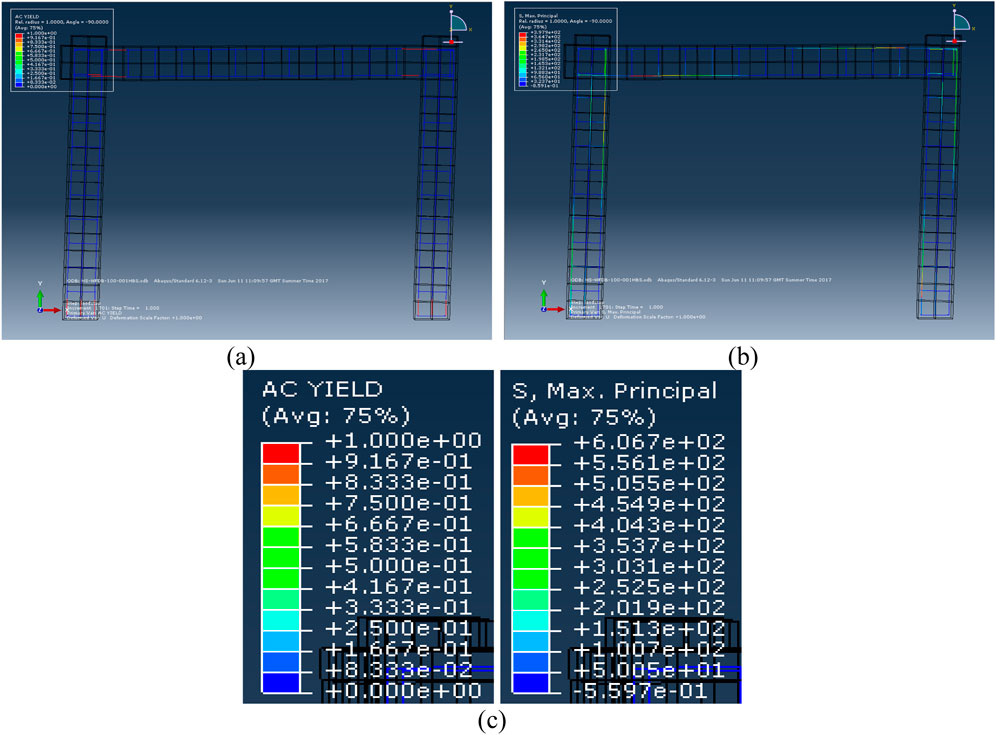
Figure 19. Hdb RC frame (a) AC yield and (b) maximum principal stress at ultimate limit state (c) values for AC yield and s, maximum.
Figure 20 provide a comparative analysis of the structural behavior of the modified Half Diameter of Stirrups in the Beam (HDB) model, as predicted by SAP2000 and ABAQUS. Together, these figures underscore the differences in predictive accuracy and detail between ABAQUS (Abaqus, 2012) and SAP 2000 (SAP, 2013) offering a comprehensive understanding of the structural response and damage mechanisms in the modified HDB model under extreme loading conditions.
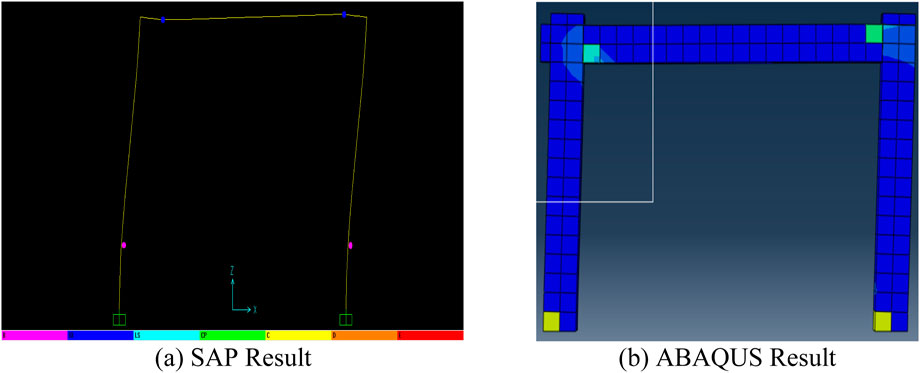
Figure 20. Results of (a) SAP 2000, (b) for HDB at ULS.
Figure 21 offers a comparative evaluation of the load-deflection behaviour derived from experimental data and computational simulations. This comparison highlights the accuracy and reliability of the modelling techniques used to capture the structural response of the control specimen, providing insights into the applicability of each approach.
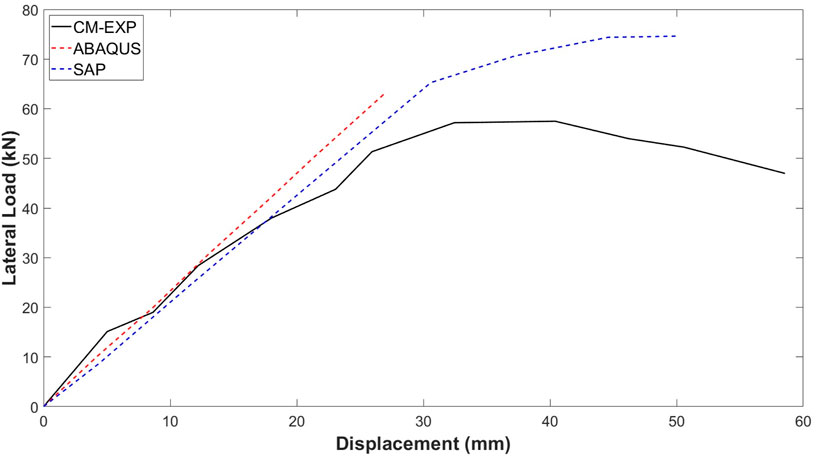
Figure 21. Comparison of Load-Deflection curves obtained for HDB.
5.2 Case for HDBC
To investigate the behavior of the RC frame with reduced transverse reinforcement, the Half Diameter of Stirrups in the Beam and Columns (HDBC) model was analyzed in comparison to the Control Model (CM), as outlined in Table 4. This modification results in a 75% reduction in transverse reinforcement in both the beams and columns compared to the original frame tested experimentally. A significant reduction in stirrup dimensions was implemented to assess its impact on structural performance, particularly in terms of load-carrying capacity, ductility, and damage progression. Figure 22 illustrates the transverse reinforcement details for the modified frame, including the updated configurations and reduced dimensions. These adjustments highlight the impact of transverse reinforcement on the structural behavior under loading conditions, providing a clear contrast between the CM and HDBC models. This comparison offers valuable insights into the critical role of stirrups in maintaining the stability and integrity of RC frames under applied loads.
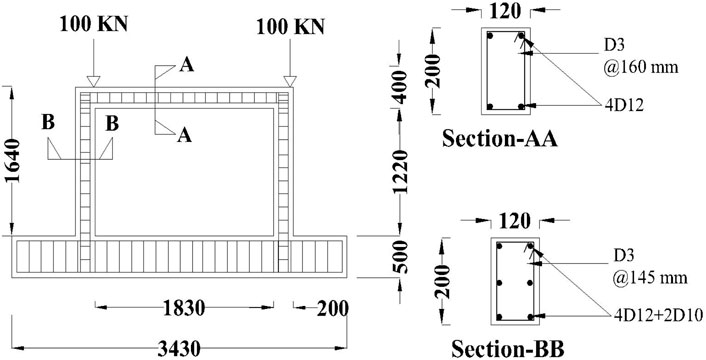
Figure 22. Reinforcement details of HDBC.
Figure 23 comprehensively illustrates the structural response of the HDBC with reduced transverse reinforcement, emphasizing its impact on stress distribution, damage patterns, and failure mechanisms. Figure 23 described the stress (S33), strain distribution (E33), compressive damage (DAMAGEC), equivalent strain (PEMAG), and the contours of these values in the modified HDBC at the ULS.
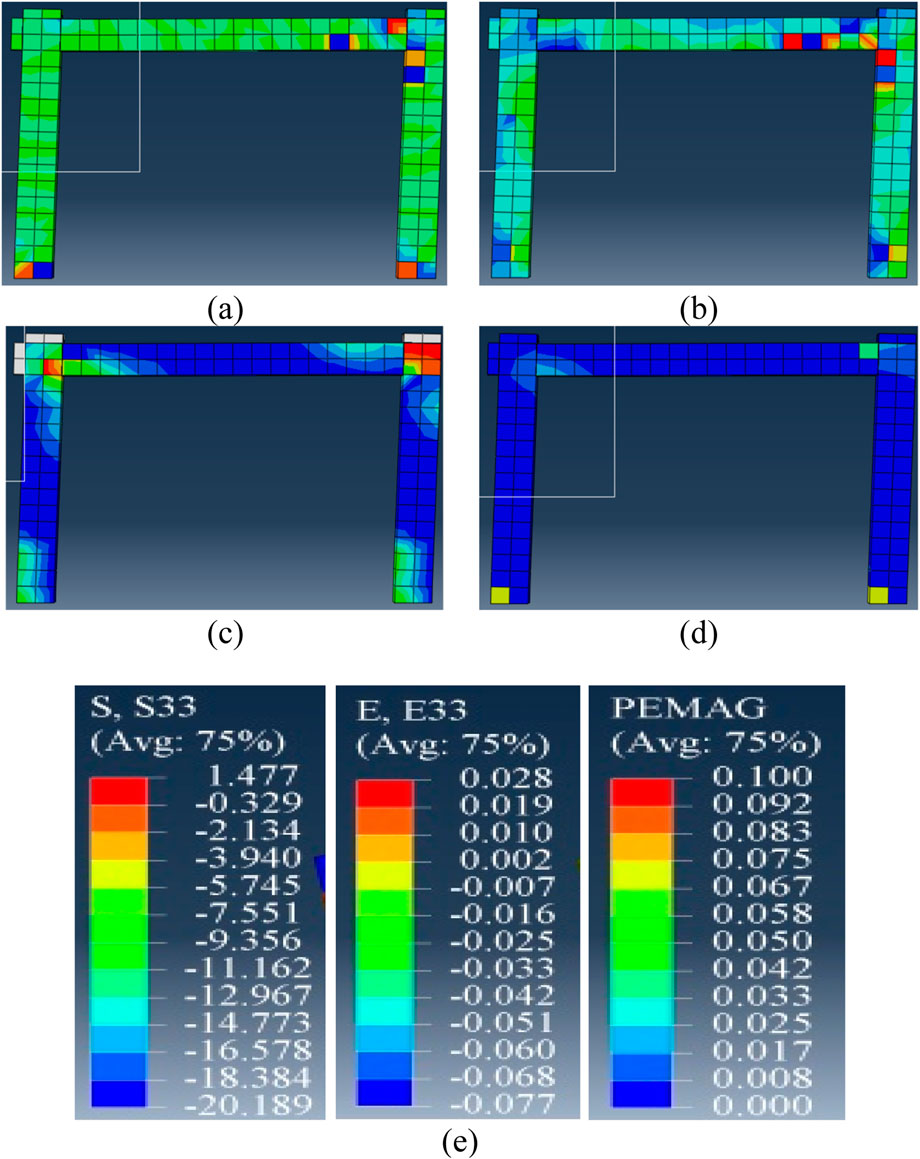
Figure 23. Hdbc (a) stress S33, (b) strain E33, (c) DAMAGEC, and (d) PEMAG at ULS (e) values for S22, E33, and PEMAG.
Figure 24 provides an in-depth view of the reinforcement’s stress and yield characteristics, emphasizing their role in resisting lateral loads and contributing to the specimen’s overall structural performance. Figure 24 describes the axial yield criterion (AC Yield), Maximum Principal Stress (S, Max), and numerical predictions from the ABAQUS finite element analysis, which illustrate the reinforcement behaviour in the HDBC at the ULS.
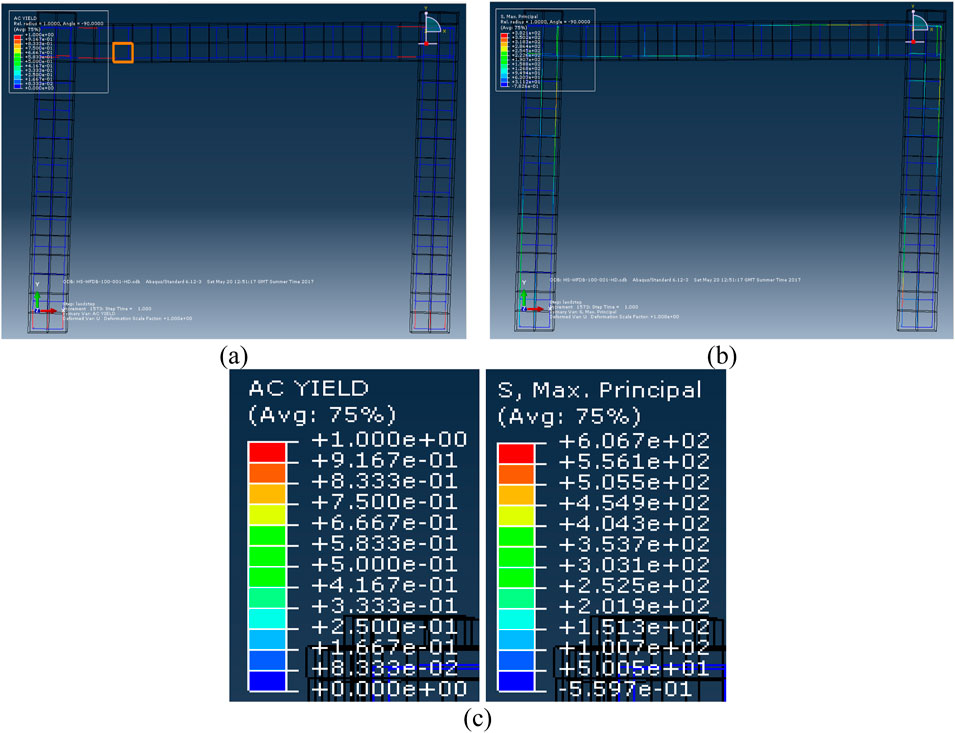
Figure 24. Hdbc (a) yield of AC and (b) maximum principal stress during ULS (c) data for AC yield and s, Max.
Figures 25, 26 present a ABAQUS (Abaqus, 2012) and SAP 2000 (SAP, 2013) comparative analysis of the predictions obtained from SAP2000 and ABAQUS for the modified HDBC frame. The analysis reveals that SAP 2000 (SAP, 2013) tends to overestimate the load-carrying capacity of the modified frame compared to the predictions provided by ABAQUS (Abaqus, 2012). This observation highlights differences in the modelling and computational approaches of the two software tools.
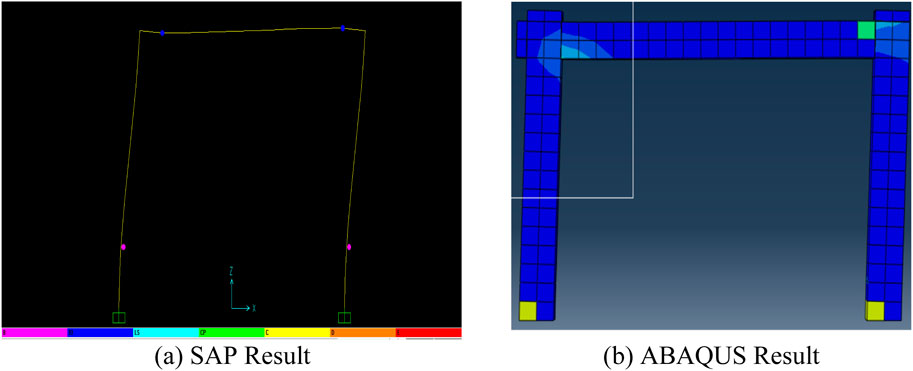
Figure 25. Results (a) SAP 2000, (b) Abaqus for HDBC.
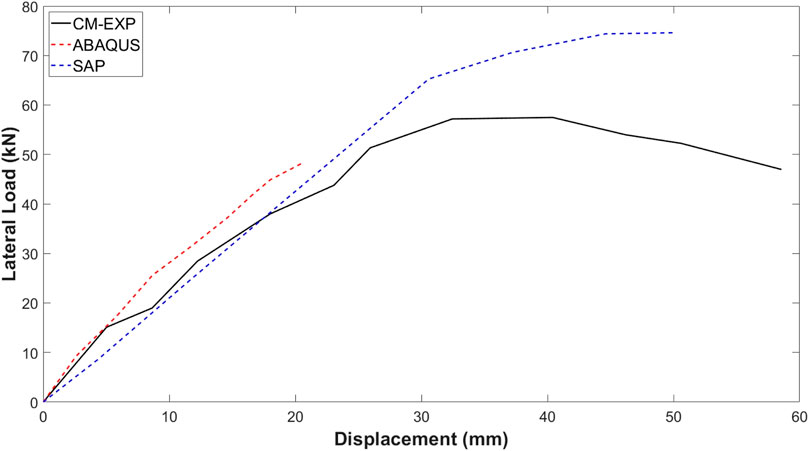
Figure 26. Comparison of Load-Deflection curves obtained for HDBC.
5.3 Case for DSBC
To investigate the behavior of the RC frame, increasing the spacing of the stirrups twice in beams and columns as DSBC, the model was analyzed in comparison to the CM as outlined in Table 4. This modification results in a 50% reduction in transverse reinforcement in both the beams and columns compared to the original frame tested experimentally. A significant reduction in stirrup dimensions was implemented to assess its impact on structural performance, particularly in terms of load-carrying capacity, ductility, and damage progression. Figure 27 illustrates the transverse reinforcement details for the modified frame, including the updated configurations and reduced dimensions. These adjustments highlight the impact of transverse reinforcement on the structural behavior under loading conditions, providing a clear contrast between the CM and DSBC models. This comparison offers valuable insights into the critical role of stirrups in maintaining the stability and integrity of RC frames under applied loads.
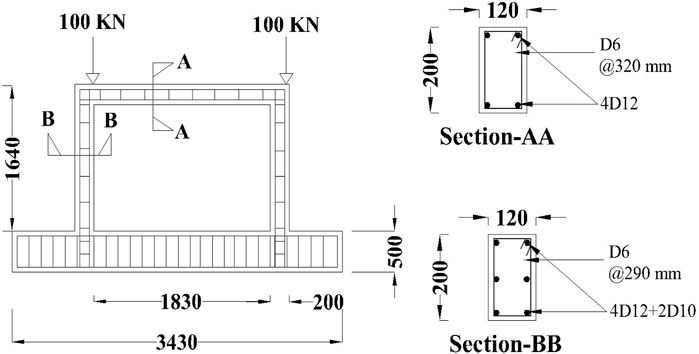
Figure 27. Reinforcement details of DSBC.
Figure 28 comprehensively illustrates the DSBC’s structural response to reduced transverse reinforcement, emphasizing its impact on stress distribution, damage patterns, and failure mechanisms. Figure 28 described the stress (S33), strain distribution (E33), compressive damage (DAMAGEC), plastic equivalent strain (PEMAG), and contours of these values distribution in the modified DSBC at the ULS.
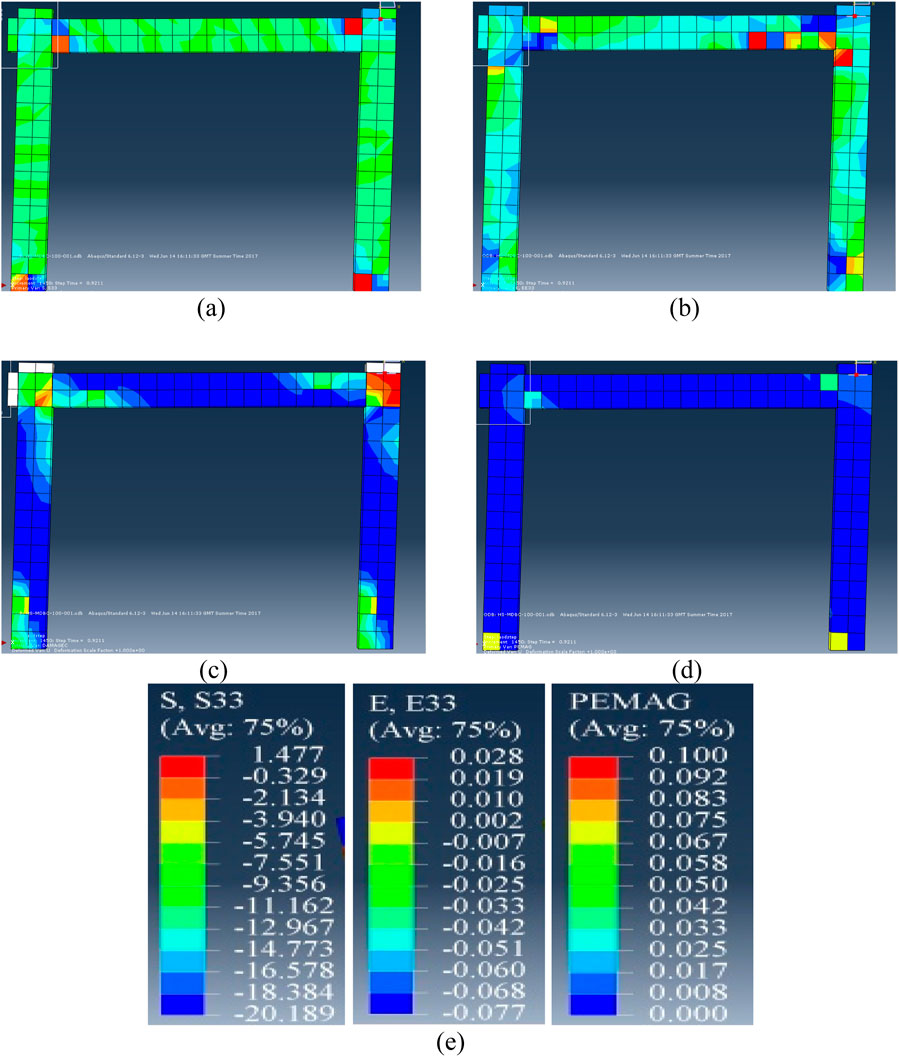
Figure 28. DSBC (a) stress S33, (b) strain E33, (c) DAMAGEC, and (d) PEMAG at ultimate limit state (ULS) (e) values for S22, E33, and PEMAG.
Figure 29 provides an in-depth view of the reinforcement’s stress and yield characteristics, emphasizing their role in resisting lateral loads and contributing to the specimen’s overall structural performance. Figure 29 describes the axial yield criterion (AC Yield), Maximum Principal Stress (S, Max), and numerical predictions from the ABAQUS finite element analysis illustrating the reinforcement behaviour in the HDBC at the ULS.
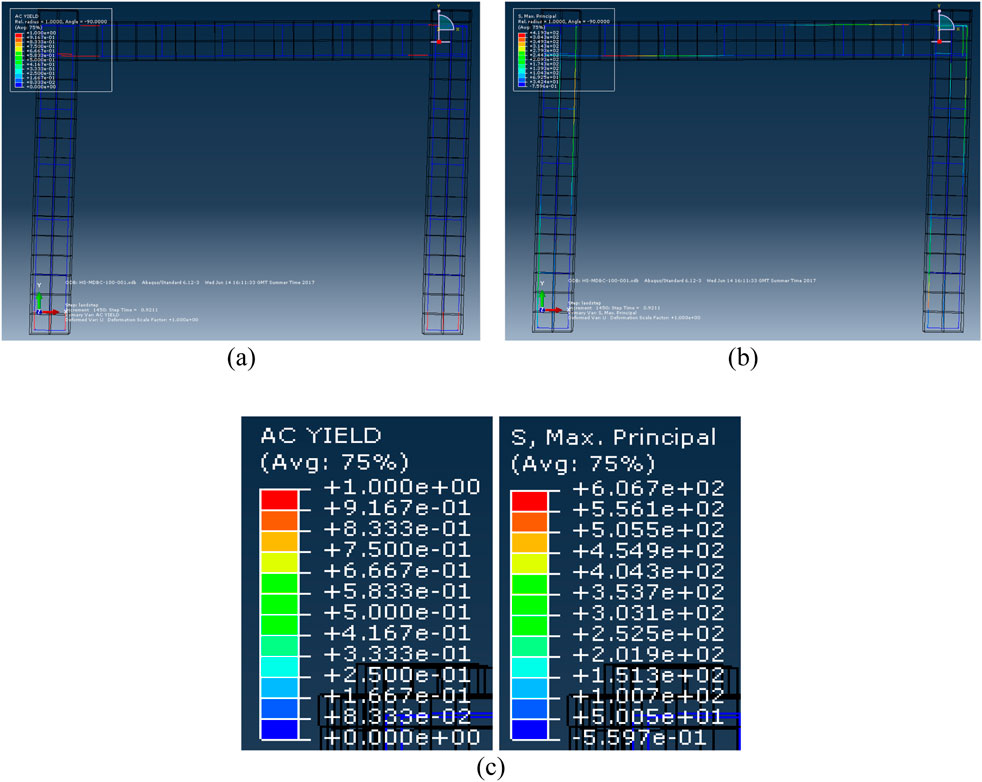
Figure 29. Dsbc (a) yield for AC and (b) maximum principal stress at ultimate limit state (c) Measurements for AC yield and s, maximum.
Figures 30, 31 present a comparative analysis of predictions obtained from ABAQUS (Abaqus, 2012) and SAP 2000 (SAP, 2013) for the modified DSBC frame. The comparison reveals that SAP2000 overestimates the modified frame’s load-carrying capacity compared to ABAQUS. This highlights differences in the computational methodologies and structural behavior predictions of the two tools for the modified DSBC frame.
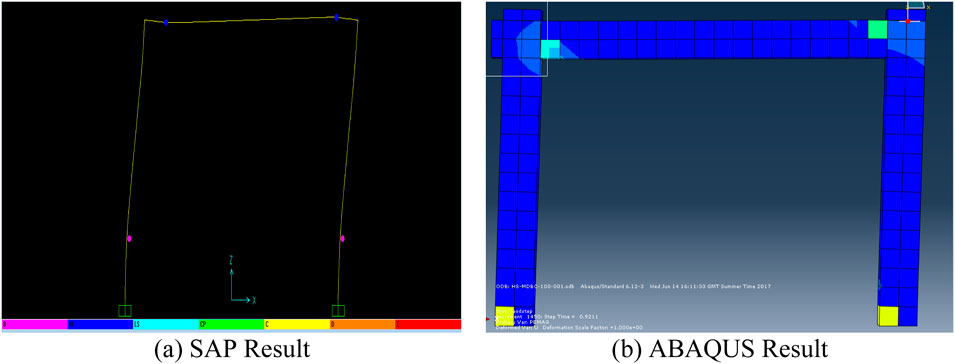
Figure 30. Results of (a) SAP 2000, (b) Abaqus for DSBC.
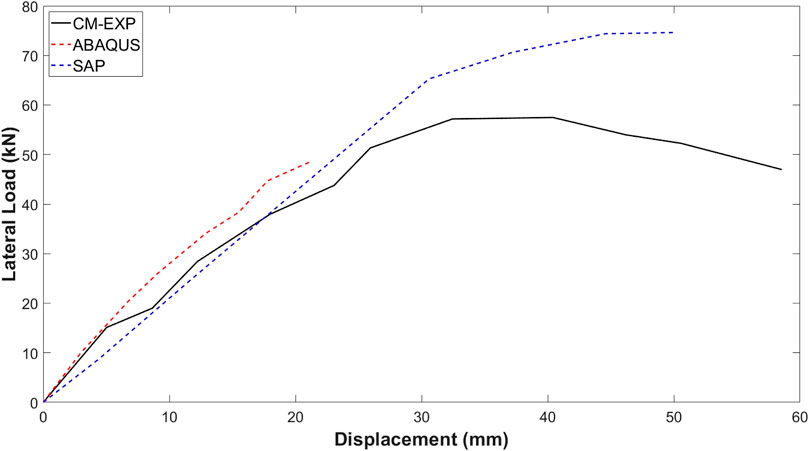
Figure 31. Comparison of Load-Deflection curves for DSBC.
5.4 Comparative study between FEM models
Figure 32 illustrates the comparison of lateral displacements by encompassing (i) experimental results, (ii) ABAQUS (Abaqus, 2012), and (iii) SAP-2000 (SAP, 2013) for the four case studies mentioned above, i.e., (a) CM, (b) HDB, (c) HDBC, and (d) DSBC. The experimental results are only available for the CM configuration, showing a lateral displacement of approximately 60 mm, whereas no experimental data is reported for HDB, HDBC, and DSBC.
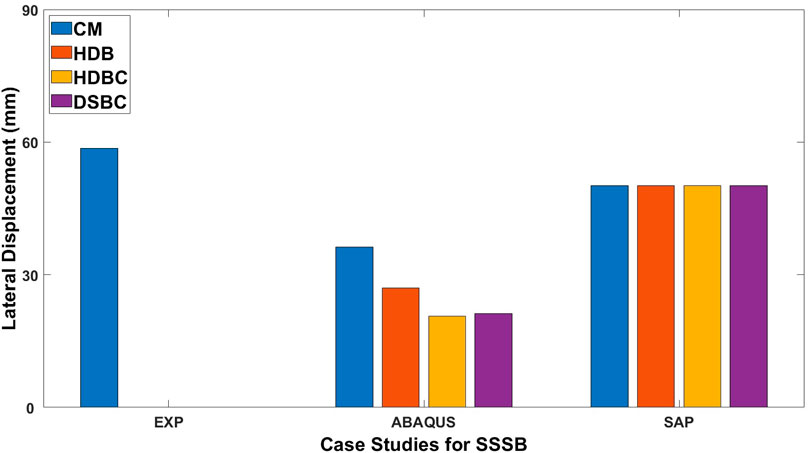
Figure 32. Lateral displacement comparison of all models.
In the numerical simulations, ABAQUS shows varying lateral displacements, with the CM model reaching 30 mm, while other configurations (HDB, HDBC, DSBC) exhibit lower values. This indicates ABAQUS’s sensitivity to material properties and boundary conditions. In contrast, SAP results display uniform lateral displacements of 90 mm across all configurations, suggesting insensitivity to material variations or oversimplifications in modelling. Notably, the experimental displacement for the CM configuration is significantly higher than the predictions from both ABAQUS and SAP 2000, indicating challenges in accurately capturing real-world structural behavior in numerical simulations. In summary, while the numerical tools offer valuable insights, the consistency in SAP-2000 results and discrepancies from experimental data highlight the need for improved modelling. Furthermore, validating all configurations experimentally is crucial for enhancing reliability and strengthening the correlation between experimental and simulation results.
Figure 33 illustration compares lateral load across (i) experimental results, (ii) ABAQUS, and (iii) SAP-2000 for four case studies: (a) CM, (b) HDB, (c) HDBC, and (d) DSBC. Experimental data is only available for the CM configuration, which shows a lateral load of approximately 60 kN. The lack of data for HDB, HDBC, and DSBC limits validation of the numerical simulations. ABAQUS shows varying lateral load capacities, with HDB having the highest load, followed closely by CM; HDBC and DSBC exhibit slightly lower values. This indicates ABAQUS’s sensitivity to material properties and boundary conditions. In contrast, SAP-2000 displays a uniform lateral load of 90 kN across all configurations, suggesting that it may not effectively capture material-specific variations. The difference between the experimental load for the CM configuration and the numerical predictions from ABAQUS and SAP-2000 suggests limitations in the simulation models, which may not fully capture real-world conditions, such as imperfections and nonlinearities. While numerical simulations provide insights into structural performance, the consistent results from SAP, combined with the lack of experimental data for certain configurations, underscore the need for validation across all setups. Additionally, improving modelling strategies in numerical tools could enhance predictive accuracy. The FEA model, HDB, shows a 10.2% increase in lateral load compared to CM, while HDBC and DSBC exhibit discrepancies of −15.8% and −15.5%, respectively, compared to the experimental values.
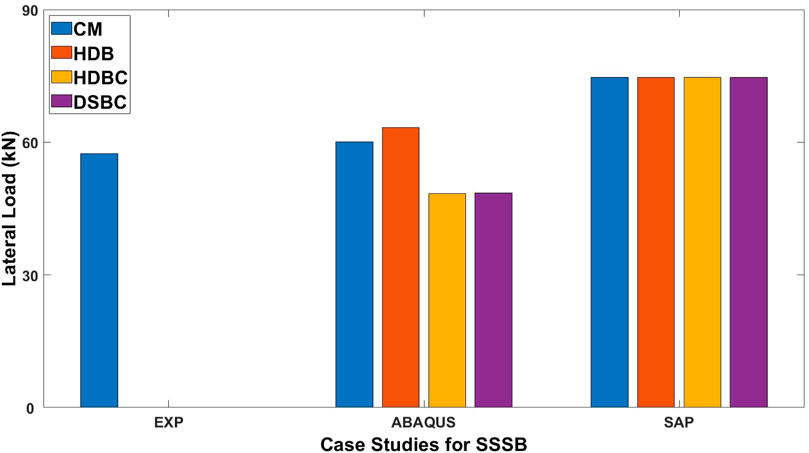
Figure 33. Lateral Load comparison of all models.
6 Discussion and conclusion
Based on the findings derived from the analysis of the four examined cases, the finite element method (FEM) models demonstrated the behavior of reinforced concrete (RC) frames characterized by varying detailing. The results of these investigations underpin the following conclusions:
• Incorporating shear effects is essential for the safe and realistic evaluation of the strength and ductility of RC frames, particularly critical frames that are still encountered in practice.
• Numerical simulations using ABAQUS demonstrate sensitivity to material properties and boundary conditions, while SAP results show uniformity across configurations, suggesting potential oversimplifications. Refining numerical modeling approaches and incorporating material-specific variations are critical for improving predictive accuracy and bridging the gap between experimental and simulated outcomes.
• The comparison of experimental and numerical results reveals significant discrepancies, particularly for the CM configuration, highlighting the limitations of numerical models in replicating real-world structural behavior. The absence of experimental data for DSN and HDN configurations underscores the need for comprehensive experimental validation to enhance the reliability of numerical simulations.
• Numerical simulations conducted using ABAQUS exhibit sensitivity to variations in material properties and boundary conditions, while SAP results demonstrate consistency across configurations. This suggests potential oversimplifications in the models. It is essential to refine numerical modeling techniques and integrate material-specific variations to enhance predictive accuracy and bridge the gap between experimental results and simulated outcomes.
• The comparison between experimental and numerical results highlights significant discrepancies, especially in the CM configuration, thereby emphasizing the limitations of numerical models in accurately reflecting real-world structural behavior. Moreover, the absence of experimental data for the HDB, HDBC, and DSBC configurations points to the necessity for comprehensive experimental validation to improve the reliability of numerical simulations.
• The Finite Element Analysis (FEA) model, referred to as HDB, demonstrates a lateral load that is 10.2% greater than that of the control model (CM). In contrast, the results from the HDBC and DSBC models reveal notable discrepancies, with values that are 15.8% and 15.5% lower, respectively, in comparison to the experimental findings.
These observations highlight significant concerns regarding the foundational assumptions underpinning current methods for assessing reinforced concrete (RC) structures. The findings indicate an urgent need to develop more sophisticated design and evaluation tools capable of accurately capturing the behavior of RC structures under complex loading scenarios, including high temperatures, fire, impact, blast, and environmental factors. Furthermore, the results highlight the need to reassess the principles and assumptions underlying existing RC design codes to ensure their reliability and relevance in contemporary structural engineering practice.
These observations raise critical concerns about the underlying assumptions used in current methods for assessing RC structures. The findings suggest a pressing need for the development of more advanced design and assessment tools that can realistically capture the behavior of RC structures under complex loading conditions, including high temperatures, fire, impact, blast, and environmental actions. Furthermore, the results underscore the need to reassess the principles and assumptions underlying current RC design codes to ensure their reliability and applicability in contemporary structural engineering practice.
Data availability statement
The original contributions presented in the study are included in the article/supplementary material, further inquiries can be directed to the corresponding author.
Author contributions
AA-S: Conceptualization, Investigation, Methodology, Software, Validation, Writing – original draft, Writing – review and editing.
Funding
The author(s) declare that no financial support was received for the research and/or publication of this article.
Conflict of interest
The author declares that the research was conducted in the absence of any commercial or financial relationships that could be construed as a potential conflict of interest.
Generative AI statement
The author(s) declare that no Generative AI was used in the creation of this manuscript.
Publisher’s note
All claims expressed in this article are solely those of the authors and do not necessarily represent those of their affiliated organizations, or those of the publisher, the editors and the reviewers. Any product that may be evaluated in this article, or claim that may be made by its manufacturer, is not guaranteed or endorsed by the publisher.
References
Abbas, A. A., Syed Mohsin, S. M., and Cotsovos, D. M. (2010). Numerical modelling of fibre-reinforced concrete, 473.
Abbas, A. A., Mohsin, S. M. S., and Cotsovos, D. M. (2016). A simplified finite element model for assessing steel fibre reinforced concrete structural performance. Comput. & Struct. 173, 31–49. doi:10.1016/j.compstruc.2016.05.017
ACI (2014). “Building code requirements for structural concrete (ACI 318-14) and commentary,”, 48331. American Concrete Institute 38800 Country Club Drive Farmington Hills, MI.
Afifi, M. Z., Mohamed, H. M., Chaallal, O., and Benmokrane, B. (2014). Confinement model for concrete columns internally confined with carbon FRP spirals and hoops. J. Struct. Eng. 141, 04014219. doi:10.1061/(asce)st.1943-541x.0001197
Ahmad, A., and Cotsovos, D. M. (2023). Reliability analysis of models for predicting T-beam response at ultimate limit response. Proc. Institution Civ. Eng. - Struct. Build. 176, 28–50. doi:10.1680/jstbu.20.00129
Ahmad, A., and Raza, A. (2020). Reliability analysis of strength models for CFRP-confined concrete cylinders. Compos. Struct. 244, 112312. doi:10.1016/j.compstruct.2020.112312
Ahmad, S., and Shah, A. (2009). Evaluation of shear strength of high strength concrete corbels using strut and tie model (STM). Arab. J. Sci. Eng. 34, 27–35.
Ahmad, A., Arshid, M. U., Mahmood, T., Ahmad, N., Waheed, A., and Safdar, S. S. (2021). Knowledge-Based prediction of load-carrying capacity of RC flat slab through neural network and FEM. Math. Problems Eng. 2021, 1–18. doi:10.1155/2021/4528945
Ahmad, A., Bahrami, A., Alajarmeh, O., Chairman, N., and Yaqub, M. (2023). Investigation of circular hollow concrete columns reinforced with GFRP bars and spirals. Buildings 13, 1056. doi:10.3390/buildings13041056
Ali Al-Tameemi, S. K., Al-hasany, E. G., Mohammad, H. K., Jabir, H. A., Ibrahim, T. H., Allawi, A. A., et al. (2024). Simulation and design model for reinforced concrete slabs with lacing systems. Adv. Struct. Eng. 27, 871–892. doi:10.1177/13694332241237576
Ali, A., Mohsin, S. M. S., Cotsovos, D. M., and Ruiz-Teran, A. M. (2014). Statically-Indeterminate SFRC columns under cyclic loads. Adv. Struct. Eng. 17, 1403–1417. doi:10.1260/1369-4332.17.10.1403
Balouch, D. S. U. (2021). SFRC modelling and non-linear analysis of Beam- column joint under cyclic loading. CTCSE 7. doi:10.33552/CTCSE.2021.07.000671
Behnia, A., Chai, H. K., and Shiotani, T. (2014). Advanced structural health monitoring of concrete structures with the aid of acoustic emission. Constr. Build. Mater. 65, 282–302. doi:10.1016/j.conbuildmat.2014.04.103
Chaallal, O., Shahawy, M., and Hassan, M. (2003). Performance of axially loaded short rectangular columns strengthened with carbon fiber-reinforced polymer wrapping. J. Compos. Constr. 7, 200–208. doi:10.1061/(asce)1090-0268(2003)7:3(200)
Christidis, K., Vougioukas, E., and Trezos, K. G. (2013). Seismic assessment of existing RC shear walls non-compliant with current code provisions. Mag. Concr. Res. 65, 1059–1072. doi:10.1680/macr.13.00051
Cotsovos, D. M. (2010). A simplified approach for assessing the load-carrying capacity of reinforced concrete beams under concentrated load applied at high rates. Int. J. Impact Eng. 37, 907–917. doi:10.1016/j.ijimpeng.2010.01.005
Cotsovos, D. M. (2013). Cracking of RC beam/column joints: implications for the analysis of frame-type structures. Eng. Struct. 52, 131–139. doi:10.1016/j.engstruct.2013.02.018
EC2. Eurocode 2 (2004). Design of concrete structures - part 1-1: general rules and rules for buildings. Manag. Cent. Ave. Marnix 17.
Elshamandy, M. G., Farghaly, A. S., and Benmokrane, B. (2018). Experimental behavior of glass fiber-reinforced polymer-reinforced concrete columns under lateral cyclic load. ACI Struct J. 115, 337–349. doi:10.14359/51700985
Flores, L. M. (2004). Peformance OF existing reinforced concrete columns under BIDIRECTIONAL shear and axial loading. Berkeley: University of California.
Foster, S. J., Powell, R. E., and Selim, H. S. (1996). Performance of high-strength concrete corbels. Struct. J. 93, 555–563.
Greifenhagen, C., and Lestuzzi, P. (2005). Static cyclic tests on lightly reinforced concrete shear walls. Eng. Struct. 27, 1703–1712. doi:10.1016/j.engstruct.2005.06.008
Guner, S., and Vecchio, F. J. (2010). Pushover analysis of shear-critical frames: verification and application. ACI Struct. J. 107, 72–81.
Hadad, H. S., Metwally, I. M., and El-Betar, S. (2015). Cyclic behavior of braced concrete frames: experimental investigation and Numerical Simulation. HBRC J. 61, 101–114. doi:10.2478/brj-2014-0008
Kadid, A., and Boumrkik, A. (2008). Pushover analysis of reinforced concrete frame structures. Asian J. Civ. Eng. Build. Hous. 9, 75–83.
Khan, Q.-U.-Z., Fiaz Tahir, M., Ahmad, A., and Iqbal, M. (2015). Seismic evaluation of repaired and retrofitted circular Bridge piers of low-strength concrete. Arab. J. Sci. Eng. 40, 3057–3066. doi:10.1007/s13369-015-1769-8
Khan, Q. U. Z., Ahmad, A., Mehboob, S., and Nouman, M. (2020). Experimental and numerical investigation of T-joint enhanced confinement using flat steel strips. Asian J. Civ. Eng. 21, 1483–1492. doi:10.1007/s42107-020-00292-6
Koppitz, R., Kenel, A., and Keller, T. (2013). Punching shear of RC flat slabs - review of analytical models for new and strengthening of existing slabs. Eng. Struct. 52, 123–130. doi:10.1016/j.engstruct.2013.02.014
Krawinkler, H., and Seneviratna, GDPK (1998). Pros and cons of A pushover analysis of seismic performance evaluation. Eng. Struct. 20:452–464. doi:10.1016/S0141-0296(97)00092-8
Lai, B.-L., Tan, W.-K., Feng, Q.-T., and Venkateshwaran, A. (2022). Numerical parametric study on the uniaxial and biaxial compressive behavior of H-shaped steel reinforced concrete composite beam-columns. Adv. Struct. Eng. 25, 2641–2661. doi:10.1177/13694332221105333
Lee, D. H., Park, J., Lee, K., and Kim, B. H. (2011). Nonlinear seismic assessment for the post-repair response of RC bridge piers. Compos. Part B Eng. 42, 1318–1329. doi:10.1016/j.compositesb.2010.12.023
Lignola, G. P., Prota, A., Manfredi, G., and Cosenza, E. (2009). Non-linear modeling of RC rectangular hollow piers confined with CFRP. Compos. Struct. 88, 56–64. doi:10.1016/j.compstruct.2008.10.001
Long, X., and Lee, C. K. (2015). Modelling of two dimensional reinforced concrete beam-column joints subjected to monotonic loading. Adv. Struct. Eng. 18, 1461–1474. doi:10.1260/1369-4332.18.9.1461
Mohamed, Z. T. U., Ueda, T., Wu, Z., and Meng, L. (2009). Experimental investigation on shear cracking behavior in reinforced concrete beams with shear reinforcement. J. Adv. Concr. Technol. 7, 79–96. doi:10.3151/jact.7.79
Nordell, W. J. (1965). Plastic Hinge Formation in reinforced concrete beams. Calif: Naval Civil Engineering Lab Port Hueneme.
Raza, A., Khan, Q. uz Z., and Ahmad, A. (2019). Numerical investigation of load-carrying capacity of GFRP-Reinforced rectangular concrete members using CDP model in ABAQUS. Adv. Civ. Eng. 2019, 1745341–21. doi:10.1155/2019/1745341
Raza, A., Khan, Q. U. Z., and Ahmad, A. (2021). Investigation of HFRC columns reinforced with GFRP bars and spirals under concentric and eccentric loadings. Eng. Struct. 227, 111461. doi:10.1016/j.engstruct.2020.111461
Saeed, H. Z., Khan, Q. U. Z., Ahmed, A., Ali, S. M., and Iqbal, M. (2015). Experimental and finite element investigation of strengthened LSC bridge piers under Quasi-Static Cyclic Load Test. Compos. Struct. 131, 556–564. doi:10.1016/j.compstruct.2015.06.013
Said, M., and Elrakib, T. M. (2013). Enhancement of shear strength and ductility for reinforced concrete wide beams due to web reinforcement. HBRC J. 9, 235–242. doi:10.1016/j.hbrcj.2013.05.011
Schueremans, L., and Gemert, V. D. (2004). Assessing the safety of existing structures: reliability based assessment framework, examples and application. J. Civ. Eng. Manag. 10, 131–141. doi:10.1080/13923730.2004.9636297
Sharma, A., Reddy, G. R., Eligehausen, R., and Vaze, K. K. (2011). Experimental and analytical investigation on seismic behavior of Rc framed structure by pushover method. Struct. Eng. Mech. 39, 125–145. doi:10.12989/sem.2011.39.1.125
Sharma, A., Reddy, G. R., Vaze, K. K., and Eligehausen, R. (2013). Pushover experiment and analysis of A full Scale non-seismically detailed Rc structure. Eng. Struct. 46, 218–233. doi:10.1016/j.engstruct.2012.08.006
Sipos, T. K., Sigmund, V., and Hadzima-Nyarko, M. (2013). Earthquake performance of infilled frames using neural networks and experimental database. Eng. Struct. 51, 113–127. doi:10.1016/j.engstruct.2012.12.038
Soyoz, S., and Feng, M. Q. (2009). Long-Term monitoring and identification of Bridge structural parameters. Computer-Aided Civ. Infrastructure Eng. 24, 82–92. doi:10.1111/j.1467-8667.2008.00572.x
Stratford, T., and Burgoyne, C. (2003). Shear analysis of concrete with Brittle reinforcement. J. Compos. Constr. 7, 323–330. doi:10.1061//ASCE/1090-0268/2003/7:4/323
Sung, Y. C., Lin, T. K., Hsiao, C. C., and Lai, M. C. (2013). Pushover analysis of reinforced concrete frames considering shear failure at beam-column joints. Earthq. Eng. Eng. Vib. 12, 373–383. doi:10.1007/s11803-013-0179-8
Theodossopoulos, D., and Sinha, B. (2013). A review of analytical methods in the current design processes and assessment of performance of masonry structures. Constr. Build. Mater. 41, 990–1001. doi:10.1016/j.conbuildmat.2012.07.095
Vecchio, F. J., and Emara, M. B. (1992). Shear deformations in reinforced concrete frames. ACI Struct. J. 89, 46–56.
Zhang, Y., Yang, Z., Zhang, H., Tsang, N., and Zhang, X. (2023). Improving the shear design of steel-bar reinforced ultra high performance fibre reinforced concrete beams using mesoscale modelling. Adv. Struct. Eng. 26, 724–740. doi:10.1177/13694332221137174
Zhang, J., and Foschi, R. O. (2004). Performance-Based design and seismic reliability analysis using designed experiments and neural networks. Probabilistic Eng. Mech. 19, 259–267. doi:10.1016/j.probengmech.2004.02.009
Zhang, S., Zhang, D., Nie, X., and Ye, J. (2025). Finite element modelling of T-shaped RC beams with locally reduced cross sections. Adv. Struct. Eng., 13694332251313866.
Zhao, X., Wu, Y.-F., Leung, A. Y., and Lam, H. F. (2011). Plastic Hinge length in reinforced concrete flexural members. Procedia Eng. 14, 1266–1274. doi:10.1016/j.proeng.2011.07.159
Keywords: reinforced concrete frame, FEM, Abaqus, CPD, SAP2000
Citation: Al-Sayegh AT (2025) Comprehensive analysis of a single-story single-bay RC frame with varied reinforcement detailing. Front. Built Environ. 11:1648231. doi: 10.3389/fbuil.2025.1648231
Received: 16 June 2025; Accepted: 29 July 2025;
Published: 26 August 2025.
Edited by:
Carlos Humberto Martins, State University of Maringá, BrazilReviewed by:
Alexandre Rossi, State University of Maringa, BrazilVinicius Moura De Oliveira, State University of Maringa, Brazil
Copyright © 2025 Al-Sayegh. This is an open-access article distributed under the terms of the Creative Commons Attribution License (CC BY). The use, distribution or reproduction in other forums is permitted, provided the original author(s) and the copyright owner(s) are credited and that the original publication in this journal is cited, in accordance with accepted academic practice. No use, distribution or reproduction is permitted which does not comply with these terms.
*Correspondence: Ammar T. Al-Sayegh, YWwuc2F5ZWdoQGt1LmVkdS5rdw==