 Shuping Ren1
 Deshan Cui
- 1Beijing Mercury Environment Co., Ltd., Beijing, China
- 2CITIC Treated Water Into River Engineering Investment Co., Ltd., Wuhan, China
- 3Central & Southern China Municipal Engineering Design and Research Institute Co., Ltd., Wuhan, China
- 4Faculty of Engineering, China University of Geosciences, Wuhan, China
With the rapid advancement of urbanization in China, the scale of construction involving narrow trench foundation pits in municipal public utility pipeline projects has witnessed a substantial expansion. However, existing research predominantly focuses on deep and wide foundation pits, and the current stability calculation methods are not applicable to narrow trench foundation pits systems. A comprehensive approach integrating model tests, numerical simulations, and theoretical analyses were used to address this gap. Results from model tests demonstrate that the failure surface of a narrow trench presents a morphological feature notably distinct from that of wide excavations: the failure surfaces of the two sidewalls converge at the trench bottom, a characteristic pattern that diverges substantially from the assumptions inherent in traditional failure modes. Numerical simulations using finite element methods further demonstrate that soil in the active zone undergoes plastic flow around the lower edge of the supporting plate toward the passive zone, forming a coupled failure mechanism where supporting plate exerts significant squeezing forces on the passive zone soil. Building upon the clarification of the morphology and mechanism of the failure surface, an improved critical failure criterion for narrow trench foundation pits is proposed. This study derives a calculation formula for anti-uplift stability using energy method, showing that decreasing foundation pit width increases the overlapping area of sliding surfaces, thereby enhancing the components of shear stress and soil self-weight along the failure surface. This mechanism significantly improves the anti-uplift stability calculation of narrow trench foundation pit, further optimizes support structures for narrow excavations to maximize their performance, reduce costs and increase efficiency. When the width of the foundation pit decreases from 1.5 times to 0.4 times its own width, the anti-uplift stability coefficient increases from 1.97 to 3.18, representing an increase by a factor of 1.61. Consequently, it provides a theoretical foundation for the design and construction of municipal utility pipelines in urban pipeline engineering.
1 Introduction
With the rapid acceleration of urbanization and development of green and recyclable geotechnical engineering in China, the exploitation of underground space has become a key measure to alleviate the shortage of land and enhance the carrying capacity of cities (Chen et al., 2018; Pan et al., 2025). Green geotechnical engineering is an interdisciplinary field that employs innovative design methodologies, environmentally friendly and recyclable materials, and low-carbon construction technologies to minimize the ecological footprint of geotechnical activities. This approach is widely applied in the support structure of narrow foundation pit, not only ensures engineering safety but also maximizes resource recycling, thereby providing significant value for narrow trench construction (Carrera et al., 2012). As an intensive urban infrastructure, the municipal utility pipe effectively solves the problems of multi-head management and maintenance difficulties of traditional underground pipelines by integrating municipal pipelines, and lays a foundation for the construction of smart cities. Given the characteristics of the pipe foundation pit, narrow width, shallow depth, and high-slope sidewalls, research on its anti-overturning stability is of significant importance for improving both the safety and cost-effectiveness of the project (Dou et al., 2018; Zhang et al., 2024).
The soft soil in Wuhan is a river-lake deposit (Yin et al., 2007). In the shallow foundation pit project, the soil layer within the excavation depth range is mostly soft plastic to plastic clay, with low shear strength, high compressibility, high water content and low permeability (Qu et al., 2014). Because the site soil is soft, the strength and stiffness of the soft soil are small, the horizontal resistance and the ability to resist deformation are small, and the shear failure is easy to occur during the excavation of narrow trench foundation pit, which weakens the overall stability of the soil. At the same time, the characteristics of high compressibility of soft soil make it easy to produce significant volume compression under loading conditions, which aggravates the deformation of the surface and supporting structure around the foundation pit, especially when the earth pressure is redistributed (Yang et al., 2022). In addition, high water content and low permeability extend the drainage consolidation time, which further increases the difficulty of foundation pit deformation control (Bulko and Mihálik, 2021). Additionally, narrow excavations are typically defined as those with excavation depths up to 5 m and widths less than its own depths (Wang, 2016; Wang, , 2011). Such excavations generally employ a single-layer support system, which offers limited effectiveness in constraining basal heave stability of the foundation soil within the excavation zone (Sutherland, 1988; Hong and Ng, 2013). It is worth studying the anti-uplift stability of this kind of narrow trench foundation pit, so as to improve the construction efficiency and economic benefits (Zhang et al., 2023).
Terzaghi (1943) first proposed the bearing capacity analysis model of the uplift failure at the bottom of the normal width foundation pit, which considers that the sliding surface of the soil is combined by the plane and the arc surface and extends to the surface when the soil is squeezed. However, this method is easy to overestimate the bearing capacity of the bottom in deep foundation pits or soil layers with hard interlayers, resulting in a low safety factor. Bjerrum and Eide (1956) introduced the bearing capacity coefficient Nc into Terzaghi’s theory, and pointed out that the slip surface of the uplift failure of deep foundation pits often ends near the wall or penetrates the bottom of the wall, rather than extending to the surface, thus proposing a modified analysis method. Wang and Xia (1983) further considered the influence of soil cohesion c and internal friction angle φ, and modified the traditional limit equilibrium formula to make it more in line with the actual mechanical properties of soft soil. Based on Terzaghi’s theory, Du (2012) derived the calculation formula of the influence range of the bottom uplift. Kong and Men (2014) considered that the assumption of soil bilateral slip in the traditional uplift stability analysis was unreasonable, and proposed a new method of unilateral slip, which included the influence of groundwater seepage and made the calculation results more realistic. Hong et al. (2015) revealed that as excavation becomes narrower, the effect of downward shear stress acting along soil–wall interface on basal resistance increases. Therefore, due to the assumptions and limitations of these methods, it is difficult to apply them to the stability analysis of trench foundation pits or relatively light structures (Watanabe et al., 2016).
Based on the shape of the sliding surface and the spatial dimensions of the narrow trench foundation pit, using the energy method to analyze the stability has a good theoretical foundation and applicability. Liu (2003) proposed an anti-uplift calculation method based on the principle of energy conservation, which can simplify the assumption of the shape of the slip surface to a certain extent, and is more suitable for foundation pits with poor soil quality or large depth. Huang et al. (2018) proposed a more complex failure mode, which is composed of multiple rigid wedges and streamlined shear zones, and considered the lateral resistance generated by the embedded section of the retaining wall, which can more reasonably reflect the contribution of the supporting structure in the deep foundation pit to the uplift stability. Ju et al. (2021) combined the energy method with the horizontal deformation control of the diaphragm wall by means of the actual monitoring data, and pointed out that the soil deformation has a significant correlation with the overall stability of the foundation pit in terms of energy consumption, which provides a new idea for further study of the uplift mechanism at the bottom of the foundation pit. Therefore, using the energy method to calculate the stability of narrow foundation pits has certain advantages.
In soft soil area, due to the significant spatial constraint effect, the deformation mechanism of narrow trench foundation pit is essentially different from that of wide foundation pit (Wang et al., 2021; Lou et al., 2022). When the soil is uplifted, it is more likely to form complex multi-curve slip surface or induce soil arching effect. Based on the finite element analysis, Ying et al. (2018) revealed the bottom heave failure law of foundation pits with different widths, proposed a correction method for anti-uplift stability under the width effect, and verified its rationality through measured and numerical results. Wang (2014); Wang (2015) pointed out that the plane shape of the foundation pit and the insertion ratio of the retaining structure have a significant impact on the bottom uplift, and the stability of this kind of foundation pit is characterized by non-uniform distribution. The proposed correction coefficient and classification method make up for the limitation of the specification only based on the depth determination. Chen et al. (2015) combined strength reduction method and numerical simulation found that the slip surface of narrow trench foundation pit uplift failure often passes through the bottom or vicinity of the retaining structure, rather than the traditional assumption of penetrating the surface, resulting in the evaluation of anti-uplift stability may be conservative, which needs to be corrected in combination with engineering conditions. Based on the finite element analysis, Huang et al. (2025) found that too small or too large insertion ratio of retaining members will lead to significant deviation of anti-uplift stability coefficient. Building upon the aforementioned studies, the upper and lower bound formulas for the insertion ratio, along with the improved circular sliding mode, are put forward to provide theoretical support for the design under complex working conditions.
In summary, although the current research on the anti-uplift stability of foundation pits in soft soil areas has formed a system, it is mostly concentrated in deep and wide foundation pits, and the applicability research of narrow trench foundation pits is still insufficient. The research on anti-uplift stability has evolved from a single limit equilibrium method to a multi-method fusion approach, such as plasticity theory, energy method, and limit analysis method. Some scholars have investigated the failure modes and slip surfaces of foundation pits through numerical simulations. However, the size effect and differences in failure modes associated with narrow trench foundation pits present limitations for traditional methods. Against this backdrop, drawing on the typical parameters of soft soil layers in the Wuhan region, this paper establishes a model test to reveal the characteristics of the sliding surface, coupled with numerical simulations to elucidate the development and failure process of the plastic zone, thereby systematically uncovering the deformation characteristics, failure modes, and stability regularity of narrow-trench foundation pits. Based on the principle of energy method, the calculation formula of anti-uplift stability is modified from the perspective of work balance, which significantly improves the design economy and safety. Through comparison with the Chinese Standard Method, it is validated that the modified formula effectively incorporates the influence of size effect, thereby offering a theoretical breakthrough for the stability evaluation of narrow trench foundation pits. The improved calculation method proposed herein exhibits significant guiding significance for the stability analysis and supporting structure design of narrow-trench foundation pits.
2 Materials and model test
2.1 Similarity ratio
This model test belongs to the frame model test under the condition of normal gravity. Based on the dimensional analysis method (Wu et al., 2007), the indoor scale model of the narrow trench foundation pit is constructed. Assuming that the material is isotropic, the gravity acceleration ratio (Cg) and the density similarity ratio (Cρ) are set to 1. Taking into account the characteristics of the narrow foundation pit’s plane strain, to minimize model scale effects while maximizing observability and operability, the geometric similarity ratio was set to Cl = N (N = 1/50).
In the municipal pipelines of Wuhan, whether it is the power pipelines or the water supply and drainage pipelines, the burial depth is generally less than 5 m, and the width of the narrow foundation pit is also less than 5 m. If it is in a soft soil layer, the supporting structure will usually be inserted into the soft soil for 2–3 m to prevent the uplift and damage of the narrow foundation pit. This paper takes the trench foundation pit with a length of 60 m, a depth of 5 m, a width of 5 m and a embedded depth of 2.5 m as the target narrow trench foundation pit. According to the existing conditions, the internal size of the model box is 500 mm × 300 mm × 200 mm. In order to ensure that the width of the soil outside the trench foundation pit is greater than 2 times the width of the foundation pit excavation, the width and depth of the trench foundation pit excavation in the model are not more than 100 mm; the size and position of the specific trench foundation pit and supporting structure are shown in Figure 1.
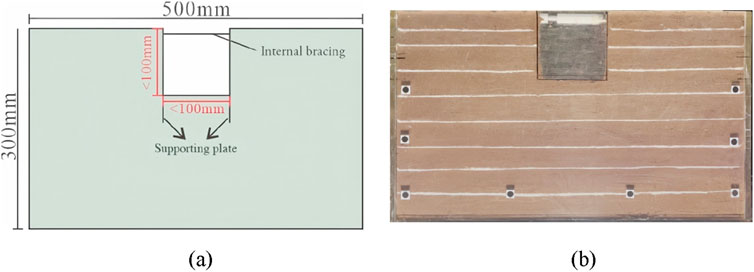
Figure 1. Schematic diagram of trench foundation pit model. (a) Model design dimensions. (b) Model box filled with soils.
2.2 Properties of model soil
The soils distribution within 20 m of Wuhan soft soil is selected, the average weight is 18.7 kN/m3, the average water content is 20%, the average internal friction angle is 13.8°, the average cohesion is 14.1 kPa, and the average compression modulus is 3.21 MPa. According to previous experience and many trial tests, the model soil material ratio is soft clay: bentonite: talc: glass beads: fine sand = 1:1:3:5:5. After being weighed in proportion and put into the mixer, it is fully stirred and sealed for 24 h, which is conducive to the full diffusion of water molecules.
Laboratory testing has confirmed that the parameters of the model soil closely approximate those of actual soil samples, as detailed in Table 1.
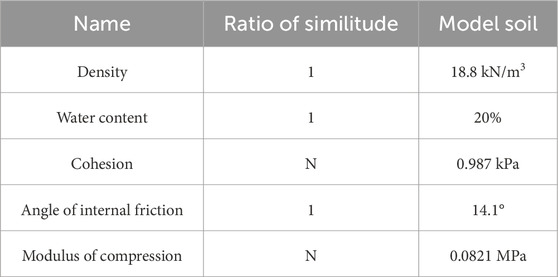
Table 1. Main parameters of model soil.
2.3 Properties of supporting structure
The model test in this instance adopts a support method that combines internal bracing with supporting plates. In practical engineering, the equivalent thickness of supporting plate is usually between 10 cm and 20 cm, and the bending strength is about 200 MPa. In this model test, the steel pipe with a diameter of 0.78 cm was used to simulate the internal bracing, and the Q235 steel plate with a size of 15 × 20 × 0.25 cm was used to simulate the supporting plate.
2.4 Test procedure
The test is conducted in accordance with the specified procedure, encompassing the placement of soil samples, layered excavation, and the application of loads, as illustrated in Table 2 and Figure 2.
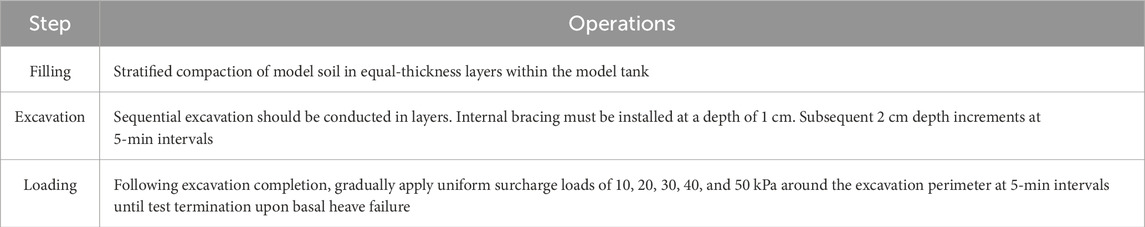
Table 2. Test Procedures of Model test.
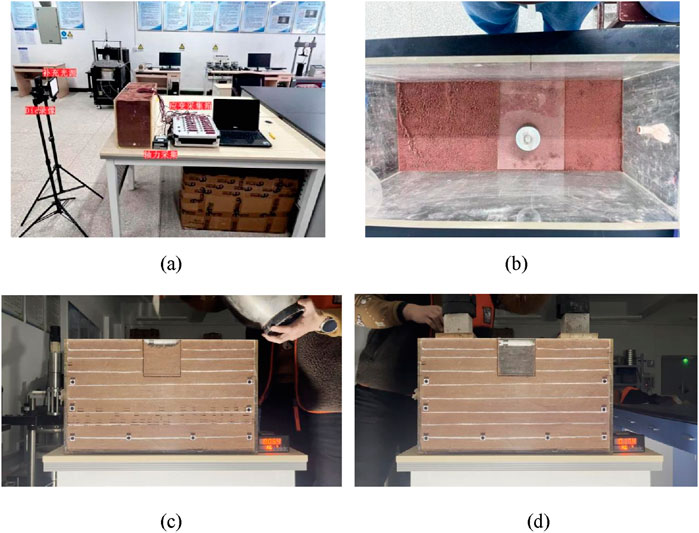
Figure 2. Model test for narrow foundation pit excavation. (a) Monitoring system. (b) Layered filling. (c) Excavation. (d) Loading.
2.5 Test result analysis
2.5.1 Axial force of the internal bracing
The results of the supporting axial force measured based on the weighing dynamometer are shown in Figure 3. As the load increases, the axial force of the internal bracing gradually increases and reaches a peak at a load of 30 kPa. After that, with the further increase of load, the axial force of the internal bracing decreases sharply. These results indicate that the trench foundation pit has undergone complete failure, characterized by the loss of stability in the retaining structure and the ineffectiveness of the internal bracing.
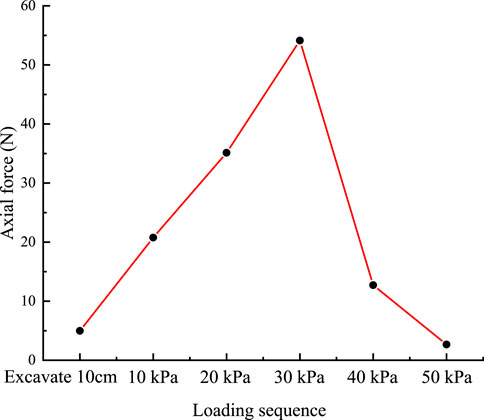
Figure 3. The change result of supporting structure axial force.
2.5.2 Active and passive earth pressure
The earth pressure is measured by the earth pressure box laid at 1 cm below the basement on both sides of the supporting structure. The results of the earth pressure test are shown in Figure 4. The initial value of the active earth pressure is 83.2 Pa, which increases gradually with the increase of the load, and rises rapidly to the maximum when the load reaches 30 kPa, and the soil enters the active failure state; when the load continues to increase to 40–50 kPa, the overall failure of the trench foundation pit is caused by the instability of the supporting structure, and the active earth pressure decreases. Consistent with the variation of passive earth pressure, it increases with the increment of load before reaching 30 kPa, which reflects the restraining effect of the soil mass. Once the load exceeds 30 kPa, the trench foundation pit undergoes complete failure, and the passive earth pressure declines sharply.
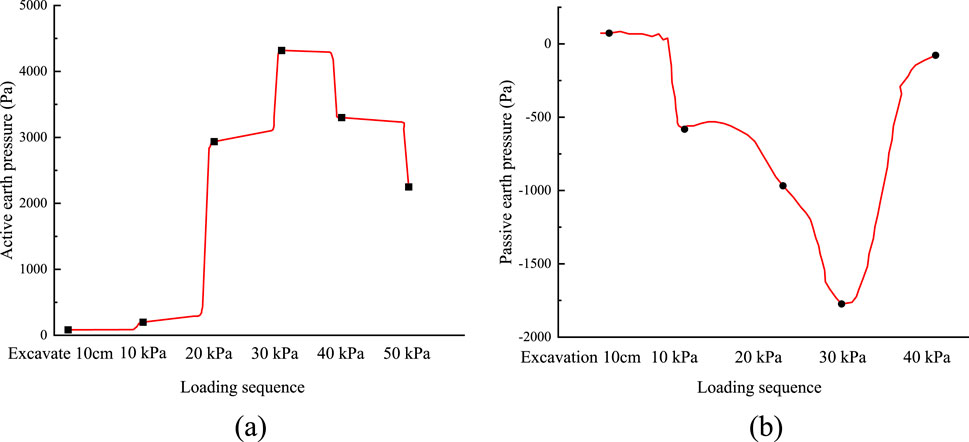
Figure 4. Soil pressure results of model test. (a) Active earth pressure. (b) Passive earth pressure.
2.5.3 Deformation and force of the supporting plate
The experimental data were collected and compiled into a summary table, as shown in Table 3. According to the monitoring data of micro strain gauge, the curve of supporting plate strain with depth during the test loading process is shown in Figure 5. The tension of the strain gauge is positive and the compression is negative. The results show that the strain distribution of the inner and outer sides of the supporting plate is roughly symmetrical, and the outer strain is slightly larger than the inner side, which is mainly caused by the direct action of soil pressure. As the load increases from 10 kPa to 30 kPa, the bending moment at the bottom of the supporting plate increases gradually. When the load exceeds 30 kPa, the foundation pit is destroyed, and the stress redistribution causes the bottom bending moment to decrease after the peak, reflecting the bottom stress concentration after instability. The variation trend of shear force is consistent with that of bending moment: it increases with the increment of load in the early stage, and undergoes changes due to stress adjustment after failure. The deflection of the supporting plate also changes significantly with the increase of load. Within the depth range from 0 to 10 cm, the rate of deflection increase is relatively small; within the depth range of 10–15 cm, the deflection increases significantly. When the load exceeds 30 kPa, the deflection at 10–15 cm decreases rapidly, which further reflects the stress release and deformation response after structural instability.
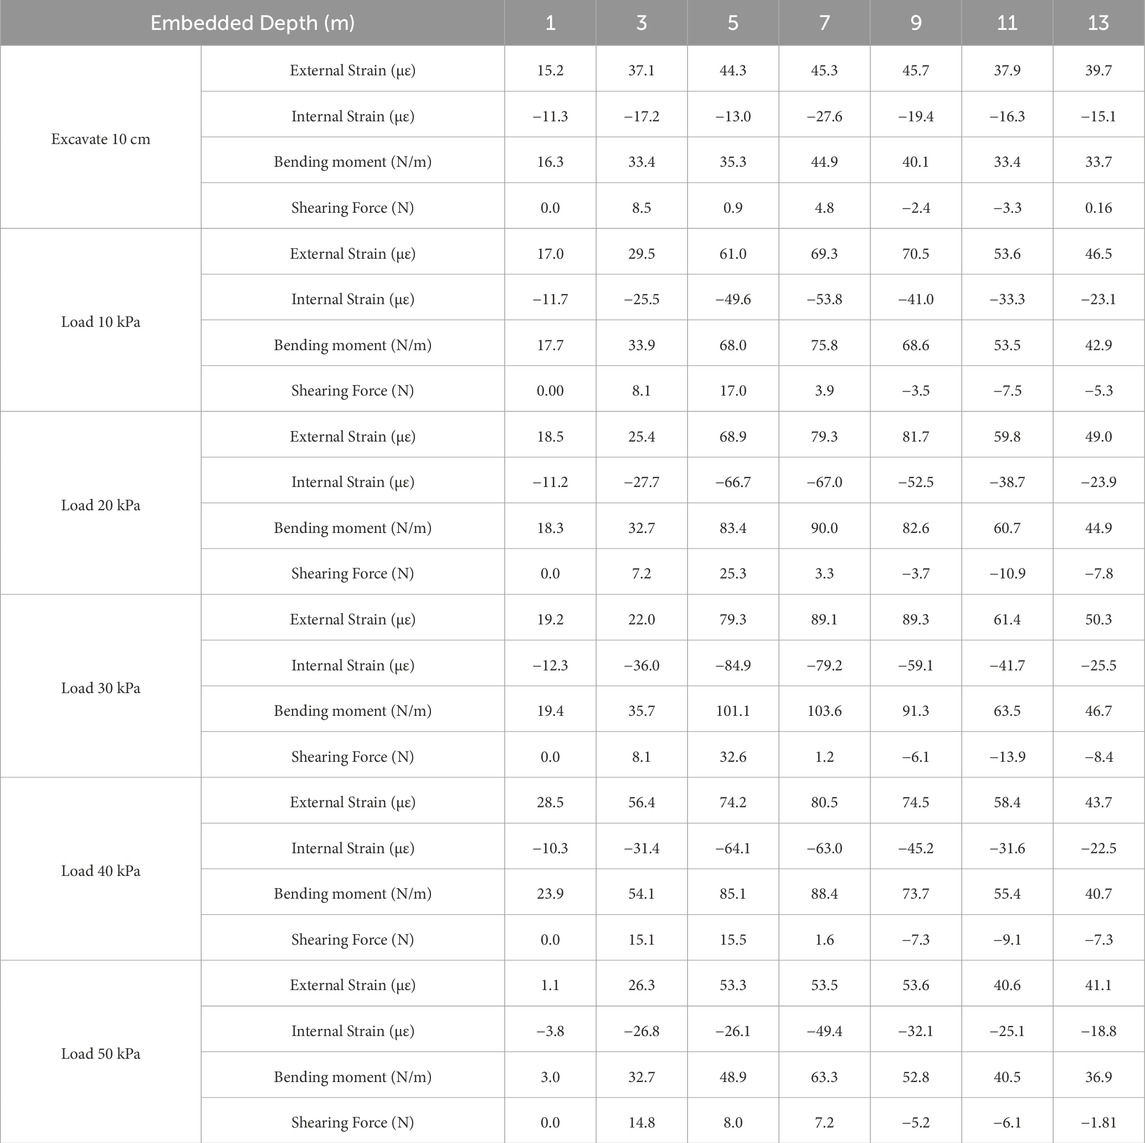
Table 3. Summary table of experimental data.
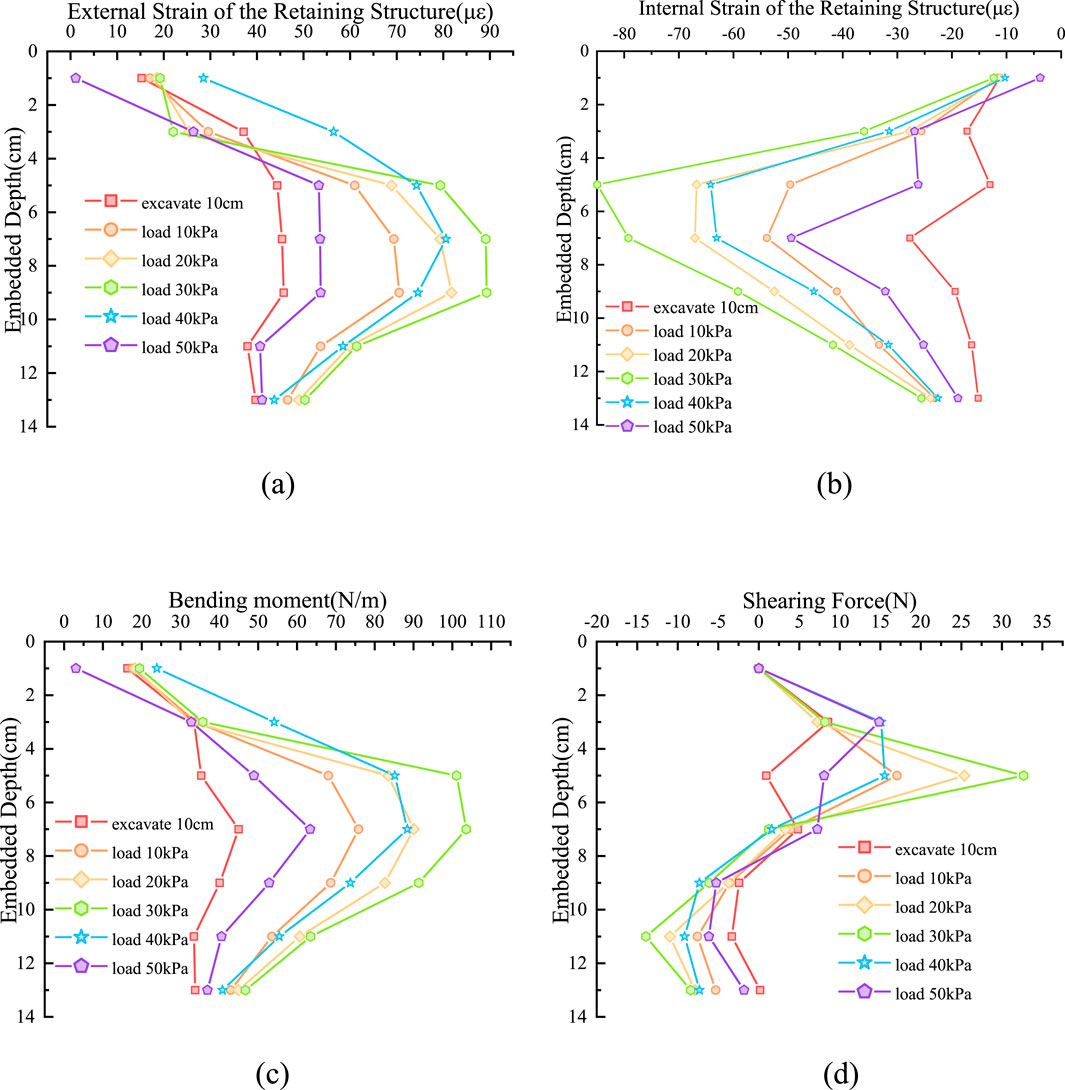
Figure 5. Characteristic curve of the model supporting plate. (a) External strain. (b) Internal strain. (c) Bending moment. (d) Shearing force.
2.5.4 Basement uplift and failure surface
Figure 6 shows the results of basal uplift and failure surface based on white tracer line analysis. When the excavation is completed Figure 6a, the white tracer line and the base change little. When 10 kPa load is applied Figure 6b, about 5 cm deep soil on both sides of the foundation pit settles, the white tracer line in the active area changes significantly, and the supporting structure has a small displacement. When 20 kPa load is applied Figure 6c, the change of the white tracer line in the active zone is intensified, the white tracer line in the passive zone is slightly raised, and the deformation of the supporting plate is small. When 30 kPa load is applied Figure 6d, the change depth of the white tracer line in the active zone reaches 15 cm, and the soil settlement is obvious. The white tracer line below the base of the passive zone is slightly deformed, and the displacement of the supporting plate is significant. When 40 kPa load is applied Figure 6e, the settlement range and depth of the soil in the active zone are expanded, the uplift of the passive zone is about 2 cm, the displacement of the supporting plate is significant, the basement uplift is destroyed, the complete slip surface is clear, and the supporting structure rotates around the supporting point. When 50 kPa load is applied Figure 6f, the displacement of the supporting plate and the uplift of the basement are intensified, the slip surfaces on both sides intersect in the middle of the trench foundation pit, and the central uplift of the bottom of the pit is peaked and decreases to both sides.
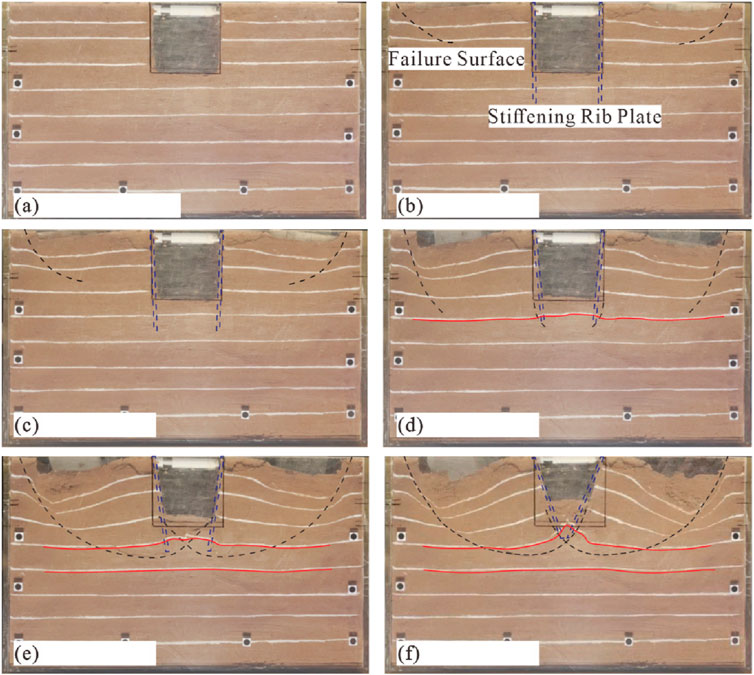
Figure 6. Model test results under different loads. (a) Excave 10 cm. (b) Load 10 kPa. (c) Load 20 kPa. (d) Load 30 kPa. (e) Load 40 kPa. (f) Load 50 kPa.
Figures 6e,f shows that the trench foundation pit finally forms a sliding surface, and the sliding surface extends downward from the active area of the top and intersects through the middle of the bottom to form a penetrating failure surface. The failure process proceeds as follows: with the increase of external load applied to the foundation pit, the supporting structure rotates about the top support point; subsequently, the soil in the active zone undergoes settlement; finally, the soil in the passive zone is uplifted due to the squeezing effect from the pit bottom. The settlement range of the active zone extends to 5 cm below the pit bottom, which indicates that the uplift of the pit bottom squeezes the soil in the passive zone and induces plastic flow of the soil in the active zone. Once the load reaches a critical value, the sliding surfaces on both sides intersect, the middle part of the pit bottom uplifts, and the trench foundation pit loses stability.
2.5.5 DIC results analysis
Figure 7 shows the DIC test results. The black line marks the shear strain concentration area. In the initial stage (10 kPa), the active zone shows an obvious trend of shear strain concentration, with the maximum value of 0.136 µε. The area is distributed in the lower part of the side wall of the trench foundation pit and extends outward. The maximum shear strain boundary is 16.87 cm away from the supporting plate, and the influence depth is 9.14 cm. When the load increases to 20 kPa, the shear strain concentration area in the active zone expands, the maximum value is 1.12 µε, and the influence depth is 12.03 cm. The strain concentration area is semi-elliptical and deep into the soil layer. The results demonstrate that the plastic deformation of the soil mass progresses, the shear strength is diminished, and a potential failure surface is generated. When the load increases to 30 kPa, the shear strain concentration area of the soil shows a trend of penetration, with a maximum value of 2.12 µε, forming a clear shear slip surface. The plastic deformation of the soil is enhanced and the stability of the trench foundation pit is reduced. When the load reaches 40 kPa, the shear strain concentration area develops to the center of the bottom of the foundation pit, which is symmetrically distributed. The maximum value is located in the center of the trench foundation pit. The shear failure zone of the soil is completely formed, the sliding surfaces intersect, the shear strain value reaches the peak value, and the trench foundation pit enters the overall slip failure stage. When the load attains 50 kPa, the strain concentration zone expands, and the shear strain reaches its maximum value, forming a plastic shear zone that penetrates the soil at the bottom of the trench foundation pit and extends toward both sides. The plastic deformation of the soil mass is substantial, the shear zone becomes fully penetrating, and the soil mass undergoes complete failure.
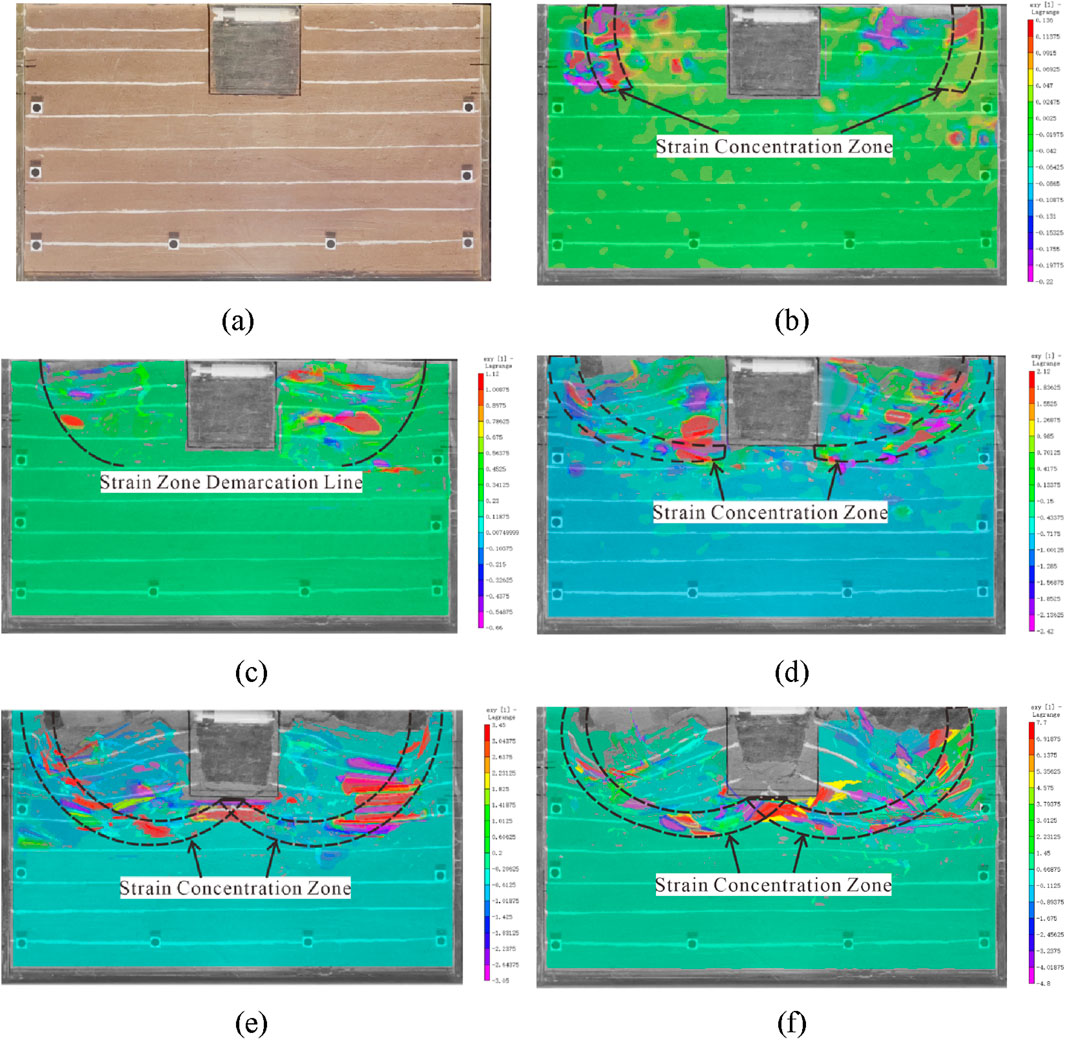
Figure 7. Shear strain from DIC results. (a) Excavation = 10 cm. (b) Loading = 10 kPa. (c) Loading = 20 kPa. (d) Loading = 30 kPa. (e) Loading = 40 kPa. (f) Loading = 50 kPa.
In summary, the failure mechanism of the trench foundation pit can be described as follows: firstly, the top supporting structure rotates around the support point under the action of the external load on the pit; subsequently, the bottom of the supporting structure displaces toward the interior of the pit, which evidently exerts a squeezing effect on the soil in the passive zone; thereafter, the settlement of the soil in the active zone intensifies; and finally, a failure mode characterized by basal uplift is formed. The slip surface presents a symmetrically curved morphology, with the slip surfaces on both sides intersecting at the bottom of the trench foundation pit. The middle part of the foundation pit bottom exhibits obvious uplift failure characteristics, which is categorized as a typical basal uplift and overturning failure mode.
3 Failure mechanism and failure surface
3.1 Finite element simulation of the model test
The numerical simulation of the trench foundation pit model test is carried out by finite element software. In order to ensure the accuracy of the numerical simulation results, the parameters are input according to the actual value of the material of the model test. The constitutive model of the soil adopts the small strain hardening model (HSS), and the small strain parameters are calculated by the empirical formula. The specific results are shown in Table 4. The numerical simulation results are compared with the deformation of the trench foundation pit retaining structure. The deformation of the inner supporting and the earth pressure inside and outside the trench foundation pit obtained from the model test to ensure the reliability of the numerical simulation results.
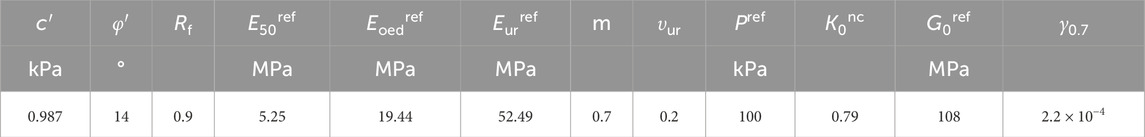
Table 4. Numerical simulation parameters of the soil.
A model with the same size (length × width × height = 0.5 m × 0.2 m × 0.3 m) as that in the model test was established. The supporting structure is simulated by a hollow circular tube beam in beam element, whose elastic model is 20 MPa, thickness is 0.01 m and diameter is 0.078 m. The supporting plate is simulated by plate element, whose elastic modulus is 20 MPa and thickness is 0.0025 m. The boundary is set to the upper surface free, the lower surface constraint displacement in three directions, and the sides constraint displacement. The loading area is within 100 mm around the foundation pit. When the foundation pit load exceeds 30 kPa, plastic failure occurs, and the simulation can no longer output the results. Therefore, the reliability analysis of the numerical model parameters is only carried out from the excavation of 10 cm to the load of 20 kPa.The specific steps are shown in Table 5.
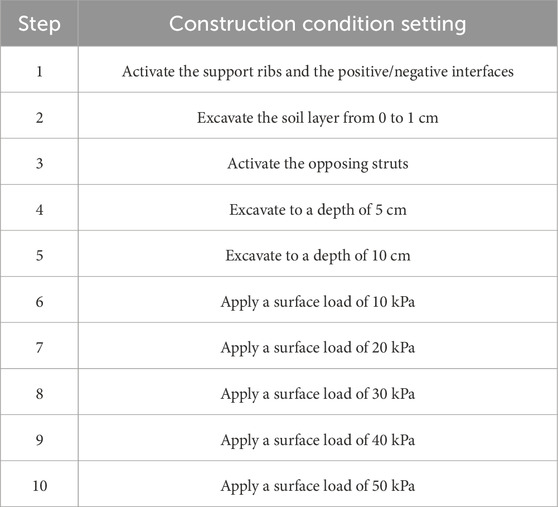
Table 5. Finite element simulation step setting.
3.1.1 Supporting plate bending moment verification
The measured value of the bending moment of the supporting plate is compared with the simulated value, as shown in Figure 8. The bending moment of the supporting plate changes with the excavation depth and the curve is arched. When the excavation depth reaches 10 cm, the simulated value of bending moment is 45.15 N m, and the measured value is 44.97 N m. When the load is 10 kPa, the simulated bending moment is 71.24 N m, and the measured value is 75.85 N m. When the load is 20 kPa, the simulated bending moment is 83.94 N m, and the measured value is 90.08 N m. The peak value of the simulated bending moment is marginally lower than the measured value; however, the peak values under various working conditions are relatively close in magnitude. At a burial depth of 11 cm, the bending moment decreases more rapidly, and the overall variation trend of the bending moment exhibits consistency.
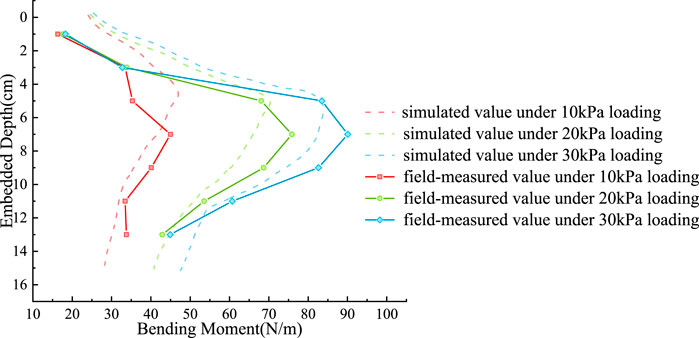
Figure 8. Comparison of measured and simulated bending moment.
3.1.2 Sliding plane verification
In the model test, when the foundation pit is completely destroyed under the load of 50 kPa, the slip surface forms and penetrates. Based on the comparative analysis of model test and numerical simulation, the reliability of numerical simulation is verified. Figure 9a white tracer line analysis shows that the failure surface of the trench foundation pit is mainly concentrated on both sides of the bottom, forming a symmetrical slip zone. The strain concentration area of Figure 9b DIC analysis is basically consistent with Figure 9a, which further verifies the failure range. The total deviatoric strain distribution of numerical simulation as shown in Figure 9c is similar to the experimental results, and the failure surface morphology is consistent. In general, the numerical simulation reproduces the failure mode of the trench foundation pit well and can be used for further parameter optimization.
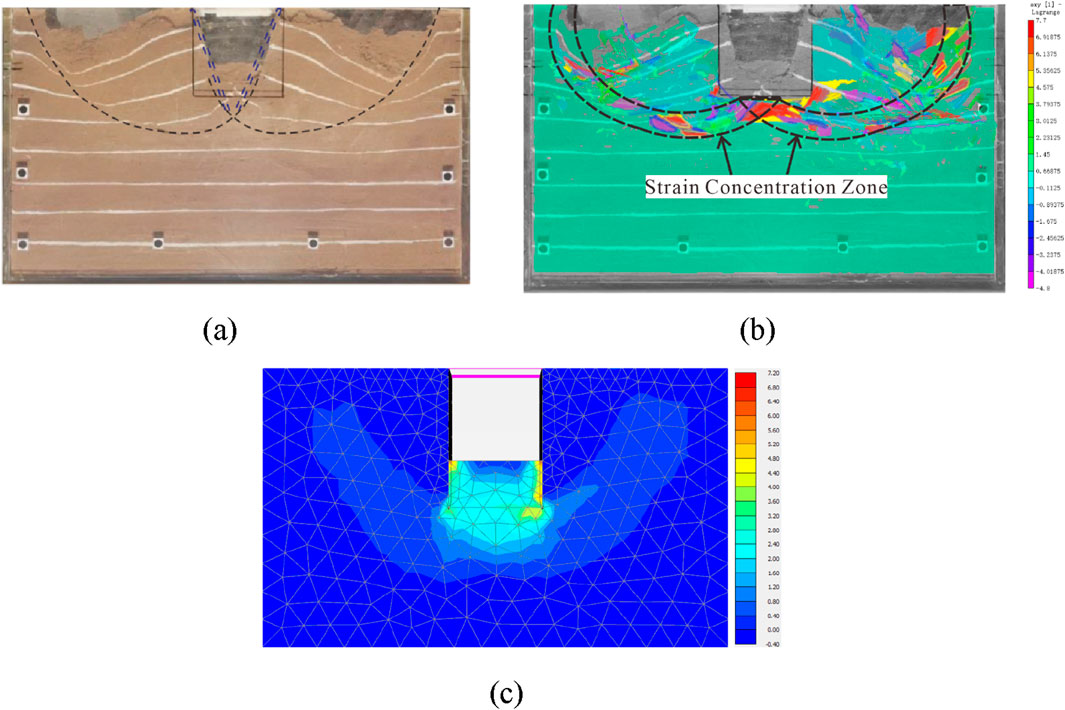
Figure 9. Comparison between model test and numerical simulation. (a) White tracer-based failure surface. (b) DIC-based strain concentration zone. (c) Total deviatoric strain zones identified via numerical simulation.
To summarize, it is evident that the finite element simulation results of the foundation pit are close to the actual monitoring data, with consistent trends. The shape and position of the shear failure surface exhibit good agreement, thereby validating the rationality of the numerical model and its parameters.
3.2 Failure mode analysis
In the process of trench foundation pit excavation, there are two typical failure modes: kicking failure and uplift failure. The deformations of the foundation pit retaining structure and the surrounding soil result from the synergistic effect of normal deformation, kicking failure deformation, and uplift failure deformation. Therefore, to analyze the uplift failure mechanism of the foundation pit, it is essential to focus on the vertical deformation and stress characteristics of the soil in the trench foundation pit.
Uplift failure is generally prevalent in deep foundation pits, particularly when the excavation depth is large. When the vertical earth pressure difference between the inside and outside of the foundation pit disrupts the vertical stress balance—specifically, when the vertical earth pressure outside the pit (encompassing soil self-weight and ground loading) exceeds that inside the pit—the soil outside the pit is subjected to extrusion from the bottom of the retaining structure, forcing the soil inside the pit to uplift upward. This failure mode typically occurs in deep foundation pits within soft clay layers, and the retaining structure may not undergo complete instability. Model test results indicate that even in narrow trench foundation pits, basal uplift phenomena emerge after the completion of excavation. This uplift is attributed to the sharp reduction in earth pressure in the passive area following foundation pit excavation; the earth pressure difference on both sides of the retaining structure induces plastic flow of the soil around the bottom of the retaining structure.
3.3 Determination of the center of the sliding circular arc
Existing standards all adopt the limit equilibrium method to analyze the anti-uplift stability of foundation pits. Neither the bearing capacity mode nor the circular sliding mode takes into account the influence of foundation pit width. The first step prior to formula optimization is to determine the form of the slip surface for foundation pit uplift failure.
This section will verify the form of the slip surface for foundation pit uplift failure through numerical simulation. An another open-cut section of a pipeline project is selected for checking calculation and analysis. The excavation depth of the foundation pit is 6 m, with a retaining structure equipped with internal bracing. The retaining piles are embedded to a depth of 10 m. Externally, two rows of high-pressure jet grouting piles serve as a waterproof curtain to prevent groundwater infiltration into the pit. This excavation is consistent with narrow excavations, whose failure slip surfaces are constrained by the bracing on the opposite side. Thus, this case study facilitates the investigation and analysis of the failure mechanism of narrow excavations. The specific soil layers and their distribution thicknesses are presented in Figure 10.
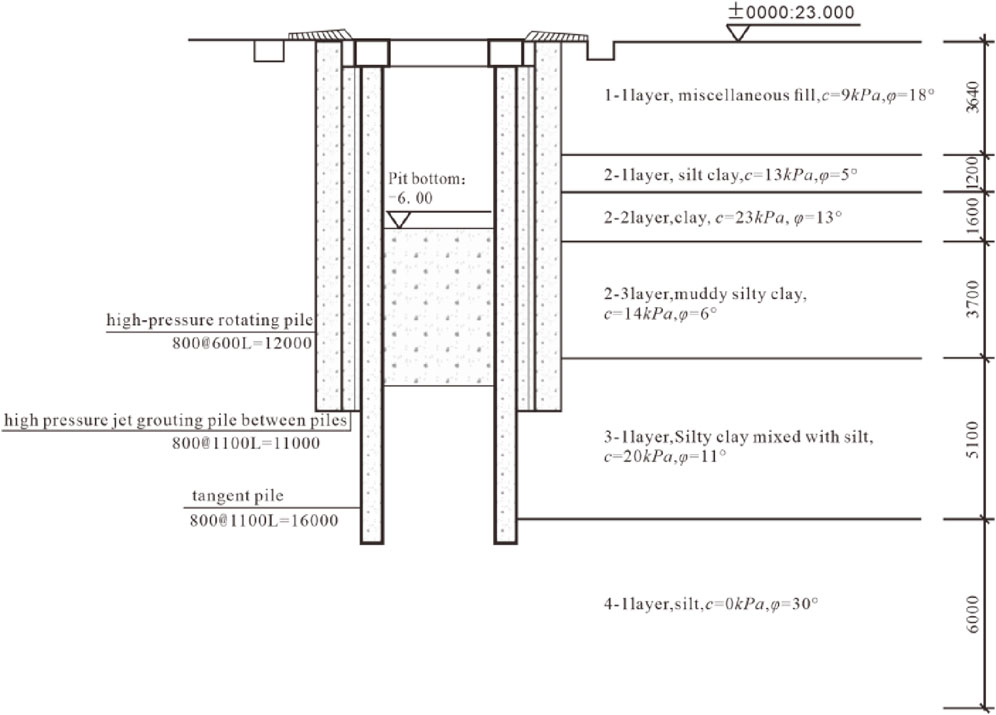
Figure 10. The profile of foundation pit case.
The soil in this case is a multi-layer soil. The foundation pit of this case is modeled as an object, and the model size is 66 m × 3 m × 30 m (length × width × depth). The top surface of the model is set free, and the horizontal displacement of the side boundary is zero. Displacement is allowed in the vertical direction, and the bottom boundary is zero in any direction. The soil model is HSS model which is more suitable for foundation pit excavation in soft soil area. The HSS model can more truly reflect the nonlinear deformation characteristics of soft soil. The stiffness change and consolidation effect meet the high-precision requirements of deformation control of foundation pit excavation. The HSS model parameters are derived from previous experience, and the specific results are shown in Table 6.
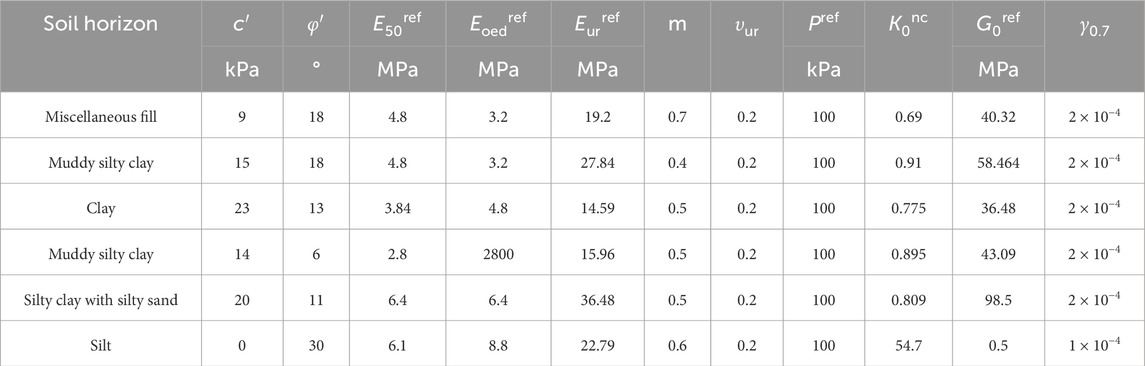
Table 6. Numerical simulation parameter of foundation pit case.
The supporting pile structure is 800@1100 bored pile, and the pile length is L = 16 m.Using the method of equivalent inertia cross-section moment, the supporting pile can be equivalent to the form of diaphragm wall supporting with a thickness of 603 mm. The elastic modulus of C35 concrete is 3.15 GPa. The supporting structure is simulated by plate element. The supporting structure is simulated by beam element, and the elastic modulus of C35 concrete of 3.15 GPa is also taken.
Through varying the embedded depth and support position of the supporting structure, it is observed that the potential uplift failure surface exhibits a circular sliding mode. However, owing to the specific support configuration of the supporting structure at the top of the foundation pit, the center of the sliding arc is not located at the support position, thus necessitating re-determination of the center position. Adopting the circular sliding mode, the factors influencing the radius of the sliding arc include the embedded depth of the foundation pit and the position of the supporting structure. Based on the original case, numerical simulations are conducted with embedded depths set to 10, 9, 8, 7, and 6 m, and the corresponding center positions are calculated. It can be observed that the radius of the sliding arc gradually decreases as the embedded depth reduces, as shown in Figure 11.
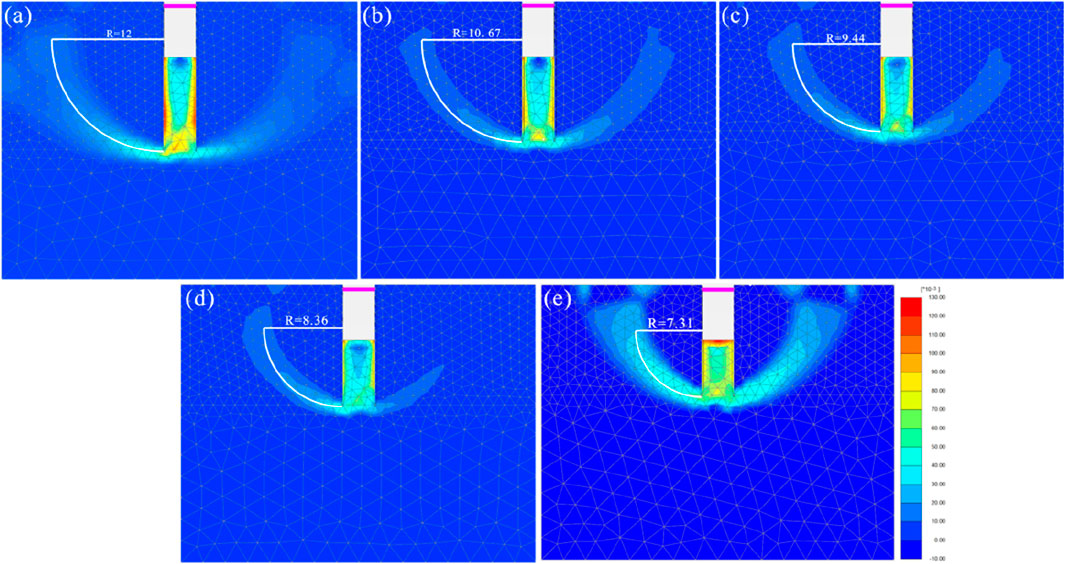
Figure 11. The change of the center of the circle with the embedded depth of (a) 10 m; (b) 9 m; (c) 8 m; (d) 7 m; (e) 6 m.
As shown in Figure 12, the relationship between the center position of the circular sliding method and the embedded depth of the supporting structure is analyzed. In order to ensure the universality of the results, the center depth/foundation pit depth is used to represent the vertical distance between the center and the top of the foundation, and the insertion ratio is used to represent the embedded depth. There is a significant negative correlation between the distance from the center of the circle to the top of the base and the embedded depth, and they satisfy the quadratic polynomial relationship. This shows that with the increase of the embedded depth, the center position gradually moves to the top of the foundation pit and shows a nonlinear growth trend.
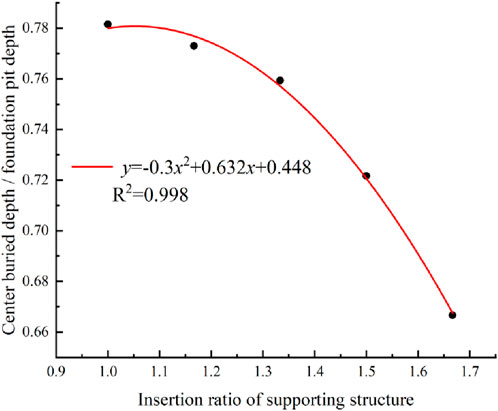
Figure 12. Relationship between center position and insertion ratio.
The supporting position is set to 0.4, 0.6, 0.8, 1.0 and 1.2 m from the base top for simulation, and the simulation results are shown in Figure 13. The results show that as the supporting position gradually moves down, the radius of the sliding arc gradually decreases.
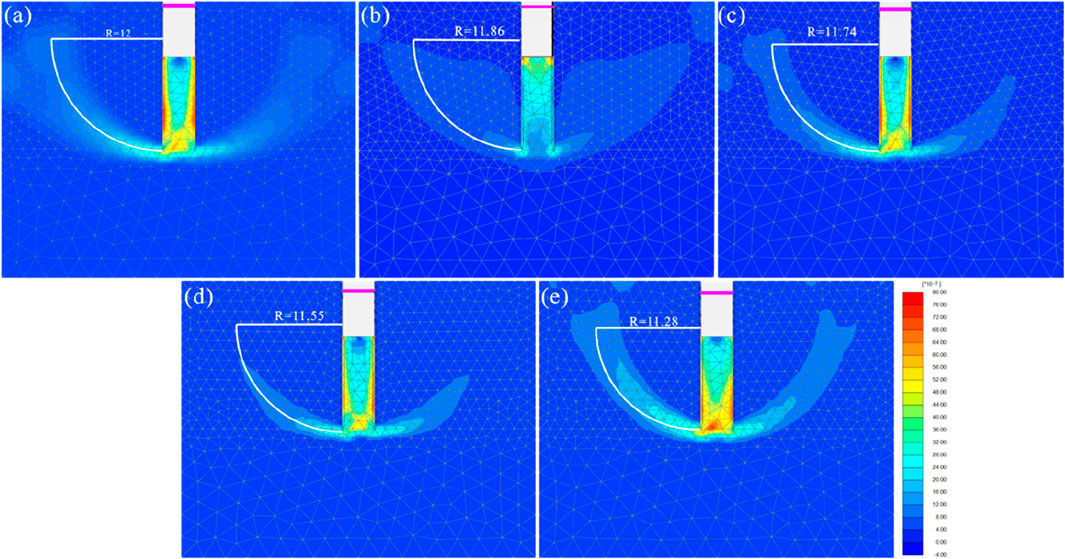
Figure 13. The change of the center of the circle with different supporting position of (a) 0.4 m; (b) 0.6 m; (c) 0.8 m; (d) 1.0 m; (e) 1.2 m.
The relationship curve between center position and supporting position is as shown in Figure 14. There is a significant positive correlation between the distance from the center of the circle to the top of the foundation and the buried depth of the supporting structure. They satisfy the quadratic polynomial relationship. With the downward movement of the supporting position, the center of the sliding arc gradually migrates to the deep part of the foundation pit, and this migration process shows a trend of nonlinear acceleration.
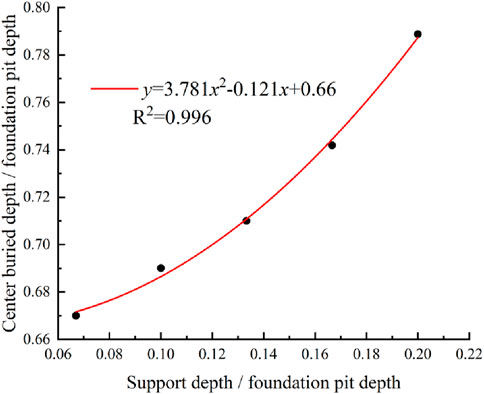
Figure 14. Relationship between center position and supporting position.
The relationships are fitted using a quadratic model, as shown in Equation 1. The supporting position and the insertion ratio are independent variables, and the center position is the dependent variable. A new quadratic polynomial is:
where, y denotes the center position; m denotes the insertion ratio; n denotes the supporting position. The coefficient of the fitting equation is: a = 1.313 × 10¹¹; b = −6.928 × 10¹¹; c = −1.439 × 10¹¹; d = −7.649 × 10¹¹; e = −2.256 × 10¹¹; f = 3.132 × 10¹¹.
Through the fitting equation, the center position of the circular arc sliding is accurately determined, so that the sliding radius can be further determined, which provides a reliable basis for the subsequent stability calculation.
After determining the center position, the identification criteria for narrow trench foundation pits can be established based on the circular slip radius. A narrow trench foundation pit is defined when overlapping of the circular slip surface occurs in the passive zone. Assuming the slip circle radius is R, foundation pit width is B, and excavation depth is H (both B and H are constants), the foundation pit width must satisfy the following condition, as shown in Equation 2.
where, R = L + m·H; L = y·H.
4 Optimization of the anti-uplift stability formula based on energy methods
Through the demonstration of numerical simulation and model test, the failure surface of the narrow trench foundation pit is the circular sliding surface as shown in Figure 15. The O point is the center of the sliding arc circle, and the distance from the bottom of the pit is H1. Through the simulation results and the empirical formula of the center position, H1 = 3H/5 can be obtained. θ1 is the angle when the circular sliding surface is not fully expanded. When the uplift failure occurs in the narrow trench foundation pit, there will be an instantaneous velocity v0 on the circular sliding surface. According to the energy method, the word of sliding force can be expressed as Equation 3:
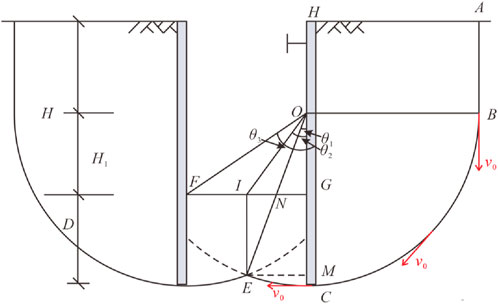
Figure 15. Slip surface diagram of uplift failure of the narrow trench foundation pit.
During the sliding process, the gravity of GCEI and the shear stress of AB, BC, CE and EI act as anti-sliding forces. The gravity work of GCEI can be regarded as the work of rectangular IEMG + fan-shaped OEC-triangle OEM.
The work of anti-sliding force can be expressed as Equation 4:
Then the anti-upheaval stability coefficient can be expressed as Equation 5:
In order to facilitate the comparison and calculation, the trench foundation pit case is still adopted. In terms of soil layer distribution, the existing soil layer is weighted and averaged to obtain the equivalent soil layer parameters. After calculation, the shear strength of a single soil layer parameter is 13.36 kPa of cohesion and 11.2° of internal friction angle. The form of retaining structure remains unchanged. The pile length is 16 m, the embedded depth is 10 m, and a supporting point is set at 0.4 m below the ground. The friction angle between the soil and the supporting structure is 10°.
Based on the calculation of the anti-uplift stability coefficient of the original width foundation pit, 0.5, 0.6, 0.7, 0.8, 0.9, 1.1,1.2,1.3,1.4,1.5 times the width of the foundation pit are set to continue to check its anti-uplift stability. The results are shown in Figure 16.
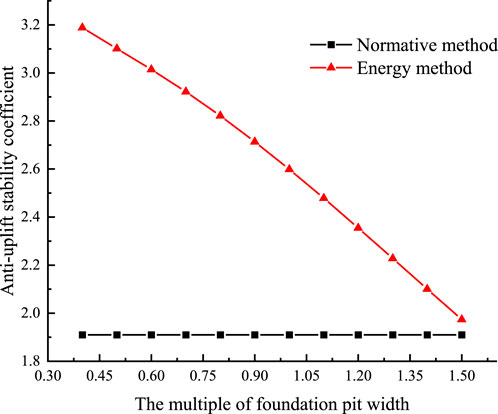
Figure 16. Anti-upheaval stability checking calculation comparison.
It can be seen that the anti-uplift stability coefficient of the trench foundation pit calculated by the Chinese National Standards (CNS) JGJ 120-2012 (hereafter referred to as the standard method) is 1.90, which meets the requirements of the anti-uplift stability coefficient (1.70) of the foundation pit, but does not have safety reserves. According to the energy method, the anti-uplift stability coefficient of the foundation pit is 2.57 > 1.7, which meets the safety level requirements of the foundation pit and has sufficient safety reserves.
The safety factor calculated according to the standard method is independent of the width of the foundation pit, that is, the anti-upheaval stability coefficient of the foundation pit remains unchanged regardless of the width of the foundation pit. In this paper, the anti-upheaval stability coefficient of the foundation pit calculated based on the energy method increases significantly with the decrease of the width of the foundation pit, but the increase gradually decreases. It shows that the anti-uplift stability coefficient of the foundation pit will not increase infinitely with the infinite decrease of the width of the foundation pit, and will eventually converge to a fixed value. When the width of the foundation pit decreases from 1.5 times the width of the foundation pit to 0.4 times the width of the foundation pit, the anti-uplift stability coefficient increases from 1.97 to 3.18, an increase of 1.61 times.
5 Conclusion
In this study, with narrow trench foundation pits as the research object, model tests, numerical simulations, and the energy method were employed to analyze the failure mechanism. Based on the analysis of the results, an improved analytical method for the anti-uplift stability of narrow trench foundation pits, which is based on the energy method, is proposed. This method was applied to calculate the anti-uplift stability of narrow trench foundation pits, and the following conclusions are drawn:
1. The failure surface of a narrow trench foundation pit exhibits a symmetrically curved morphology, with the sliding surfaces on both sides converging at the excavation base. This configuration differs significantly from the sliding surfaces observed in traditional excavations under semi-infinite space conditions.
2. The uplift failure mechanism of narrow trench foundation pits conforms to circular sliding characteristics, resulting from the synergistic effect of soil in the active zone flowing around the lower end of the supporting structure into the passive zone and the squeezing effect of the supporting structure on soil in the passive zone. The uplift sliding surfaces intersect at the level of the excavation base.
3. Numerical simulations and model tests revealed that a decrease in excavation width leads to an expansion of the overlapping area of circular sliding surfaces. This enlargement enhances both the shear stress along the sliding interface and the self-weight stress components distributed along the failure plane, thereby improving the anti-uplift stability of the excavation.
4. A critical discriminative condition for narrow excavations was established. The energy-based formula for calculating stability coefficients comprehensively incorporates the impact of excavation width on both circular sliding surfaces and passive earth pressure. According to this formulation, the anti-uplift stability coefficient increases gradually as the excavation width decreases, which is consistent with engineering experience.
Data availability statement
The original contributions presented in the study are included in the article/Supplementary Material, further inquiries can be directed to the corresponding author.
Author contributions
SR: Conceptualization, Resources, Writing – original draft. KW: Project administration, Writing – original draft, Investigation. JT: Validation, Methodology, Writing – original draft. KH: Writing – original draft, Investigation, Validation. SY: Writing – original draft, Data curation, Software. DC: Funding acquisition, Writing – review and editing, Supervision.
Funding
The author(s) declare that financial support was received for the research and/or publication of this article. This study was supported by the National Natural Science Foundation of China [Grant No: 42277171].
Conflict of interest
Author SR was employed by Beijing Mercury Environment Co., Ltd.
Author KW was employed by CITIC Treated Water Into River Engineering Investment Co., Ltd.
Authors JT and KH were employed by Central & Southern China Municipal Engineering Design and Research Institute Co., Ltd.
The remaining authors declare that the research was conducted in the absence of any commercial or financial relationships that could be construed as a potential conflict of interest.
Generative AI statement
The author(s) declare that no Generative AI was used in the creation of this manuscript.
Any alternative text (alt text) provided alongside figures in this article has been generated by Frontiers with the support of artificial intelligence and reasonable efforts have been made to ensure accuracy, including review by the authors wherever possible. If you identify any issues, please contact us.
Publisher’s note
All claims expressed in this article are solely those of the authors and do not necessarily represent those of their affiliated organizations, or those of the publisher, the editors and the reviewers. Any product that may be evaluated in this article, or claim that may be made by its manufacturer, is not guaranteed or endorsed by the publisher.
Supplementary material
The Supplementary Material for this article can be found online at: https://www.frontiersin.org/articles/10.3389/fbuil.2025.1648625/full#supplementary-material
References
Bjerrum, L., and Eide, O. (1956). Stability of strutted excavations in clay. Geotech. Londo N. 6 (1), 32–47. doi:10.1680/geot.1956.6.1.32
Bulko, R., and Mihálik, J. (2021). Deformation analysis of a construction pit in high-plasticity clay IOP conference series: materials science and engineering. IOP Publ. 1015 (1), 012058. doi:10.1088/1757-899X/1015/1/012058
Carrera, A., Dawson, A., Grenfell, J., Windsor, P., and Proctor, J. (2012). Reusing trench excavation materials as on-site backfill. Proc. Institution Civ. Engineers-Waste Resour. Manag. 165, 93–106. doi:10.1680/warm.2012.165.2.93
Chen, X. X., Zhao, J. F., and Tang, Z. Q. (2015). Strength reduction approach for analyzing safety against basal heave of long narrow and deep excavation. Chin. J. Undergr. Space Eng. 11 (S1), 59–64.
Chen, Z. L., Chen, J. Y., Liu, H., and Zhang, Z. F. (2018). Present status and development trends of underground space in Chinese cities: evaluation and analysis. Tunn. Undergr. Space Technol. 71, 253–270. doi:10.1016/j.tust.2017.08.027
Dou, H. Q., Wang, H., and Wu, F. B. (2018). Corner effects of deep excavations with multi exposed corners in square crossing of utility tunnel. J. Eng. Geol. 26 (06), 1657–1665. doi:10.13544/j.cnki.jeg.2017-473
Du, T. (2012). Research on deformation law and stability of subway long and narrow deep foundation pit. Beijing: Beijing Jiaotong University.
Hong, Y., and Ng, C. W. W. (2013). Base stability of multi-propped excavations in soft clay subjected to hydraulic uplift. Can. Geotechnical J. 50 (2), 153–164. doi:10.1139/cgj-2012-0170
Hong, Y., Ng, C. W. W., and Wang, L. Z. (2015). Initiation and failure mechanism of base instability of excavations in clay triggered by hydraulic uplift. Can. Geotechnical J. 52 (5), 599–608. doi:10.1139/cgj-2013-0343
Huang, M. S., Tang, Z., and Yuan, J. Y. (2018). Basal stability analysis of braced excavations with embedded walls in undrained clay using the upper bound theorem. Tunn. Undergr. Space Technol. 79, 231–241. doi:10.1016/j.tust.2018.05.014
Huang, M. S., Fu, C. Z., and Shi, Z. H. (2025). Improved circular arc sliding method for basal heave stability of braced excavations in soft soil. Chin. J. Geotechnical Eng. 1-10. doi:10.11779/CJGE20240330
Ju, Y. C., Gong, Q. M., and Zhao, Y. (2021). Energy method for horizontal deformation of diaphragm wall due to soft soil foundation pit excavation. Chin. J. Undergr. Space Eng. 17 (06), 1762–1774.
Kong, D. S., and Men, Y. Q. (2014). Analysis on influencing factors of basal stability in deep foundation. Chin. J. Undergr. Space Eng. 10 (4), 979–984.
Liu, Y. J. (2003). A new method for calculating the anti-upheaval stability of deep foundation pit supporting structure. J. Hunan Univ. Sci. Technol. Sci. Ed. 18 (3), 65–68.
Lou, P., Li, Y., Lu, S., Xiao, H., and Zhang, Z. (2022). Deformation and mechanical characteristics of existing foundation pit and tunnel itself caused by shield tunnel undercrossing. Symmetry 14 (2), 263. doi:10.3390/sym14020263
Pan, P., Sun, S. H., Feng, J. X., Wen, J. T., Lin, J. R., and Wang, H. S. (2025). Intelligent monitoring system for deep foundation pit based on digital twin. Buildings 15 (3), 366. doi:10.3390/buildings15030366
Qu, R. F., Xu, G. L., and Wang, J. F. (2014). Correlations of physical and mechanical properties of typical soft soils in wuhan. Chin. J. Geotechnical Eng. 36 (S2), 113–119. doi:10.11779/CJGE2014S2019
Sutherland, H. B. (1988). Uplift resistance of soils. Geotechnique 38 (4), 493–516. doi:10.1680/geot.1988.38.4.493
Wang, H. X. (2011). Influence of excavation width on enclosure-structure stability of foundation pits. China Civ. Eng. J. 44 (6), 120–126. doi:10.15951/j.tmgcxb.2011.06.002
Wang, H. X. (2014). Improvement on safety coefficient of heave-resistant stability of excavations. Rock Soil Mech. 35 (S2), 3036. doi:10.16285/j.rsm.2014.s2.068
Wang, H. X. (2015). A coefficient of heave-resistant stability considering shapes and plane sizes and its application to the stability analysis of shaped excavations. Chin. J. Rock Mech. Eng. 34 (12), 2559–2571. doi:10.13722/j.cnki.jrme.2014.1057
Wang, H. X. (2016). Size effect of foundation pits and calculation method of safety factor of heave-resistant stability considering excavation width. Rock Soil Mech. 37, 433–441. doi:10.16285/j.rsm.2016.S2.057
Wang, B. J., and Xia, M. Y. (1983). Embedment depth and internal force of diaphragm wall. Chin. J. Geotechnical Eng. (03), 105–116.
Wang, Y., Zhang, Y., Li, M., and Qi, Y. (2021). A numerical investigation of the deformation mechanism of a large metro station foundation pit under the influence of hydromechanical processes. Geofluids 2021 (1), 1–16. doi:10.1155/2021/5536137
Watanabe, K., Sawada, R., and Koseki, J. (2016). Uplift mechanism of open-cut tunnel in liquefied ground and simplified method to evaluate the stability against uplifting. Soils Found. 56 (3), 412–426. doi:10.1016/j.sandf.2016.04.008
Wu, F. F., Cao, P., and Wan, L. H. (2007). Similarity theory and its application in simulation test. Min. Technol. 7 (4), 64–65.
Yang, T., Liu, S., Wang, X., Zhao, H., Liu, Y., and Li, Y. (2022). Analysis of the deformation law of deep and large foundation pits in soft soil areas. Front. Earth Sci. 10, 828354. doi:10.3389/feart.2022.828354
Yin, H., Liu, G., Pi, J., and Chen, G. (2007). On the river–lake relationship of the middle yangtze reaches. Geomorphology 85 (3-4), 197–207. doi:10.1016/j.geomorph.2006.03.017
Ying, H. W., Wang, X. G., and Zhang, J. H. (2018). Analysis on heave-resistant stability considering the effect of excavation width. Eng. Mech. 35 (5), 118–124. doi:10.6052/j.issn.1000-4750.2017.01.0054
Zhang, W. G., Hu, X. Y., Zhang, R. H., Chen, C. x., Li, Y. q., Ye, W. y., et al. (2023). Numerical analysis of one-strut failure in deep braced excavation considering anisotropic clay behavior. J. Central South Univ. 30 (12), 4168–4181. doi:10.1007/s11771-023-5489-z
Keywords: narrow trench foundation pit, anti-uplift stability, energy method, model test, numerical simulation
Citation: Ren S, Wan K, Tai J, Hu K, Yao S and Cui D (2025) An improved analytical method for anti-uplift stability of narrow foundation pit based on energy method. Front. Built Environ. 11:1648625. doi: 10.3389/fbuil.2025.1648625
Received: 17 June 2025; Accepted: 13 August 2025;
Published: 03 September 2025.
Edited by:
Sudhakar Rao, Indian Institute of Science (IISc), IndiaReviewed by:
Zhou Zhiwu, Hunan University of Science and Engineering, ChinaLaith Sadik, University of Cincinnati, United States
Copyright © 2025 Ren, Wan, Tai, Hu, Yao and Cui. This is an open-access article distributed under the terms of the Creative Commons Attribution License (CC BY). The use, distribution or reproduction in other forums is permitted, provided the original author(s) and the copyright owner(s) are credited and that the original publication in this journal is cited, in accordance with accepted academic practice. No use, distribution or reproduction is permitted which does not comply with these terms.
*Correspondence: Deshan Cui, Y3VpZGVzaGFuQGN1Zy5lZHUuY24=