 Chiara Masnata
 Salvatore Dario Di Trapani
 Salvatore Russotto
 Antonina Pirrotta
- Department of Engineering, University of Palermo, Palermo, Italy
This study proposes a novel optimization procedure for the seismic vibration control of multi-degree-of-freedom systems incorporating Multiple Sliding Tuned Liquid Column Dampers (M-STLCDs). Unlike conventional compliant liquid-based devices, the proposed system consists of multiple translating U-shaped liquid containers, each independently tuned to a specific structural mode, enabling multi-modal control, particularly suited for stiff structures and not previously explored in the literature. The procedure can optimize and install one device at a time while accounting for the modifications introduced by prior installations, ensuring a progressive adaptation of the control system to the dynamic characteristics of the structure. For each single STLCD, the procedure considers both the optimal location in the building and the fundamental mode to be controlled. More specifically, for each STLCD, the procedure detects the optimal floor where the device should be placed and optimizes the damping and the natural frequency of the spring-dashpot unit, the head-loss coefficient and the natural frequency characterizing the liquid. To prove the effectiveness of the optimal placement of the devices, the optimization procedure was applied on two different types of shear-type structures, i.e., on a three-story and a six-story structure, subjected to a broadband and zero-mean white noise process. Moreover, the control performance of the device was evaluated both in the time and the frequency domain and under recorded seismic events, in comparison with optimized configurations of traditional devices, such as Multiple Tuned Mass Dampers (M-TMDs) and Multiple Tuned Liquid Column Dampers (M-TLCDs).
1 Introduction
In structural engineering, passive vibration control devices are widely used to enhance the capacity of structures to withstand dynamic events such as earthquakes and winds. Among these devices, the Tuned Mass Damper (TMD) was the first to be introduced and extensively studied (Den Hartog, 1956). A TMD consists of a secondary mass attached to a structure via a spring-damper system, designed to oscillate out of phase with the primary structure, dissipating vibrational energy and reducing structural response. Initially, research on TMDs primarily focused on the use of a single TMD device for mitigating vibrations (Ayorinde and Warburton, 1980; Randall et al., 1981; Warburton, 1982; Argenziano et al., 2022; Faiella et al., 2022). In this respect, the literature and real-world applications proved the effectiveness of TMDs in controlling both long-period, slender structures and short-period, stiff structures under several types of dynamic excitations. Given its efficacy, researchers started to examine the potential benefits of several TMDs installed within the same structure, exploring multi-unit configurations in both single-degree-of-freedom (SDOF) and multi-degree-of-freedom (MDOF) structures. One of the first approaches pursued in the development of multiple TMD configurations involved installing several TMD units on the same floor, all optimally tuned to the same frequency, typically corresponding to the fundamental mode of the target structure (Yamaguchi and Harnpornchai, 1993; Xu and Igusa, 1992; Abé and Fujino, 1994; Kareem and Kline, 1995; Joshi and Jangid, 1997; Jangid, 1999; Bakre and Jangid, 2004; Park and Reed, 2001; Li, 2000; Li, 2002; Shetty et al., 2017; Kim and Lee, 2018). This strategy presents both performance-related and practical advantages. From a control standpoint, its slight frequency spacing among the TMD units enhances the robustness of the system, reducing sensitivity to detuning effects and improving the overall vibration mitigation efficiency. Additionally, from an installation and maintenance perspective, dividing the overall TMD system into multiple, smaller units simplifies handling, placement, and upkeep, making it a more feasible solution in real-world applications. However, despite the benefits of improved robustness and practical implementation, this configuration, like the single TMD, primarily targeted the fundamental mode, consequently limiting its effectiveness in mitigating the influence of higher modes on the structural response. To address this limitation, two approaches were mainly explored in the literature. One approach maintained the concept of multiple TMDs installed on the same level while extending their functionality to target different modes of the MDOF structure (Mohebbi et al., 2013; Zak et al., 2024). This improvement, achieved through optimization algorithms of the TMDs’ parameters, enabled broader modal control and effectively enhanced the capabilities of the configuration beyond its initial limitation to the fundamental mode. As a result, these multiple TMD configurations achieved more effective vibration mitigation across a broader frequency range, making them suitable for controlling the complex dynamics of MDOF structures.
Meanwhile, other researchers focused on a second approach, implying the distribution of the devices across multiple levels (Clark, 1988), laying the groundwork for further advancements. In this manner, this approach retained practical advantages by dividing the system into smaller units, simplifying installation and maintenance. Additionally, distributing devices across multiple floors reduced spatial constraints at any single level, avoiding excessive concentration of mass and minimizing floor space requirements. Building on this concept, in (Chen, 1996), a Multi-Stage Tuned Mass Damper (MSTMD) strategy was introduced, specifically designed to reduce coupling effects that can arise in MDOF structures controlled by TMDs. The configuration consisted of multiple TMDs, each tuned to the first fundamental mode and each one installed on a separate floor, effectively minimizing coupling effects and leading to a reduction in structural accelerations. Then, further advances in this field were achieved in (Chen and Wu, 2001) where authors introduced the Multi-Tuned Mass Damper (M-TMD), a configuration aimed at enhancing the mitigation of higher mode contributions and improving the overall effectiveness of vibration control systems. Extending the previous concept of distributing TMDs across multiple floors, the M-TMD configuration further enhanced multi-modal control by allowing each TMD to be tuned to different vibration modes. As part of their work (Chen and Wu, 2001), the authors developed a numerical sequential optimization procedure that expanded the range of optimal tuning solutions for each device while simultaneously identifying the most effective floor for the installation. This advancement led to notable reductions in structural response, demonstrating both its effectiveness and adaptability across different seismic excitations and site-specific installation requirements. The concept of the M-TMD was further explored in the literature from multiple perspectives, including optimization strategies, structural uncertainties, and mass distribution effects, to enhance its effectiveness in multi-modal vibration control, particularly under seismic excitations (Lewandowski and Grzymisławska, 2009; Elias et al., 2016; Elias et al., 2019; Fadel Miguel et al., 2016; Suresh and Mini, 2019; Vellar et al., 2019; Zhang et al., 2022), also considering different types of structures. Another prominent example of passive control systems is the Tuned Liquid Column Damper (TLCD), which gained widespread recognition for its effectiveness and advantageous features in attenuating structural vibrations (Sakai et al., 1989; Gao et al., 1997; Ziegler, 2007; Di Matteo et al., 2016; Fei et al., 2019). The TLCD consists of a container, which can be U-shaped or V-shaped, partially filled with fluid, and fixed to the main structure. Clearly, the TLCD offers a more environmentally friendly solution, as the majority of its required mass is composed of the contained liquid, leading to lower construction and maintenance costs. Additionally, the contained liquid, typically water, can serve as a reservoir for several purposes, enhancing the overall practicality of the system. Further numerical and experimental investigations into the TLCD explored its potential to meet diverse structural demands through the exploration of advanced configurations and the use of innovative materials (Adam et al., 2017; Di Matteo et al., 2018; Di Matteo et al., 2019; Furtmüller et al., 2019; Konar and Ghosh, 2023). For instance, the use of different liquids can optimize the device’s performance by tailoring its dynamic properties to the specific needs of the structure (Ocak et al., 2022). Additionally, sealed TLCDs, incorporating gas chambers, can improve control efficiency and extend the range of tunability (Hochrainer and Ziegler, 2006). Multi-cell TLCDs, though conceptually distinct from multiple control solutions, offer some adaptability through internal tuning to specific dynamic characteristics (Kim et al., 2012). TLCDs have been implemented in various real-world structures to address specific performance requirements (Konar and Ghosh, 2023). Similarly to the TMD, with the aim of obtaining an enhanced structural control solution, many studies investigated a control solution consisting of several TLCDs having closely spaced natural frequencies. For instance (Sadek et al., 1998; Gao et al., 1999), investigated the characteristics of closely spaced TLCDs in suppressing structural vibrations, showing enhanced performance when tuned to a single mode. As demonstrated both theoretically and experimentally, configurations involving multiple TLCDs can also be employed to reduce the dynamic response of structures subjected to torsional vibrations (Shum and Xu, 2002; Xu and Shum, 2003), or to mitigate lateral displacements in wind-prone high-rise buildings (Min et al., 2005). In (Mohebbi et al., 2015) the design of multiple TLCDs was optimized for seismic applications in MDOF structures, demonstrating their effectiveness in reducing seismic responses. Similarly, in (Zhu et al., 2017) real-time hybrid simulations were employed to assess the performance of full-scale multiple TLCDs in controlling higher-order modal responses, underlining their adaptability in mitigating vibrations across multiple modes. In contrast to TMDs, TLCDs have demonstrated effectiveness primarily in long-period structures (Adam et al., 2017; Di Matteo et al., 2018; Di Matteo et al., 2019; Furtmüller et al., 2019; Hochrainer and Ziegler, 2006; Kim et al., 2012; Min et al., 2005; Mohebbi et al., 2015; Balendra et al., 1995) since optimizing the TLCD for short-period structures results in parameter values that are challenging to achieve in real applications. In fact, as determining the optimal TLCD frequency depends on the total length of the liquid column contained in the reservoir, geometrical and structural constraints arise. In this regard, to extend the use of the TLCD to different structural categories, another liquid-based device, the Sliding Tuned Liquid Column Damper (STLCD), has lately gained relevant attention. Such a device is a variant of the TLCD in which the container is not directly attached to the structure to be controlled, but it is free to translate on a sliding support and connected to the structure through a system of springs and dampers (Ghosh and Basu, 2004). By making it possible to adjust the damping and the stiffness parameters in a more flexible manner due to the presence of the spring-dashpot unit, the STLCD device extends the use of liquid devices to short-period structures, while maintaining both comparable performance to the TMD and the eco-sustainability features inherent in the TLCD, such as reduced fabrication costs and the possible reuse of the water. It is worth noting that compared to previous studied compliant liquid devices (Pandey et al., 2019), which typically omit the vertical column, the present model retains the classical TLCD column-based configuration, preserving the gravity-driven restoring force while enhancing tunability through added compliance. Further numerical and experimental investigations on the potential of the device examined its use as a hybrid solution in combination with base isolation and by streamlining the design process by means of statistical linearization techniques (Masnata and Pirrotta, 2024; Masnata et al., 2024a; Masnata et al., 2024b). However, to the best of the authors’ knowledge, although some studies have investigated the use of a single STLCD for the control of MDOF structures (Masnata and Pirrotta, 2024; Masnata et al., 2024a; Masnata et al., 2024b), also referred to as Tuned Liquid Column Mass Dampers (TLCMDs) (Wei and Zhao, 2020), no research has yet explored structural vibration control using a multiple-control system composed of several STLCD units. In particular, there are no studies addressing the coordinated operation and the optimization of these devices while maintaining their nonlinear behavior for multi-modal control. Such an investigation could contribute to a deeper comprehension of the effectiveness of these devices when interacting with real-world structures, which are generally n-story structures. Moreover, it would allow for an assessment of their performance in protecting both flexible and rigid systems from dynamic events. Based on these considerations, this study introduces a novel control configuration, comprising multiple sliding liquid column containers installed on different floors and tuned to distinct modes, which is defined herein as the Multi-Sliding Tuned Liquid Column Damper (M-STLCD). Hence, as a first contribution of this study, a numerical optimization procedure is proposed for the determination of the optimal parameters of the M-STLCD, aiming at reducing structural responses in MDOF structures subjected to different base excitations. In particular, the proposed procedure is iterative as it can install and optimize one STLCD unit per iteration while accounting for the modifications introduced by prior installations. More specifically, for each STLCD unit, the procedure targets the optimal values of the spring-dashpot unit, in terms of damping and natural frequency, and the optimal values of the liquid inside the container, in terms of head-loss coefficient and natural frequency. In addition, the procedure identifies the optimal floor for the installation of each unit, ensuring that the overall structural response is effectively minimized. In contrast to widely used metaheuristic methods, such as Genetic Algorithms (GA) (Goldberg and Holland, 1988), Particle Swarm Optimization (PSO) (Perez and Behdinan, 2007), Artificial Bee Colony (ABC), Simulated Annealing (SA) (Chen et al., 2012), Mouth Brooding Fish (MBF) (Roozbahan et al., 2025), and multi-objective approaches like NSGA-II (Ma et al., 2023), known for addressing complex optimization tasks with global solutions, the proposed algorithm operates in a discrete search space using a sequential strategy. In this manner, this approach addresses some of limitations of metaheuristics (Almufti et al., 2023; Vié, 2020; Aote et al., 2013), especially in engineering contexts where parameter transparency, solution reproducibility, and alignment with practical implementation constraints are essential. The algorithm’s reliability is demonstrated through numerical analyses and comparison with global PSO on two planar shear-type stiff structures (as defined in (American Society of Civil Engineers, 2022)), in contrast to the long-period structures typically considered in TLCD-related literature. The first model is a three-story frame, purposely constructed to explore the effectiveness of the proposed control strategy. The second is a well-established six-story frame, previously analyzed in (Chen and Wu, 2001), serving as a reference case in the field of seismic vibration control. In addition, to the best of the Authors’ knowledge, the existing literature does not provide sequential methodologies that address both the strategic placement of multiple TLCD units within n-story structures and their optimization for higher-mode control. Therefore, given the lack of similar studies using TLCDs, and for a comprehensive comparison on the performance of the M-STLCD, the implementation of the same optimization procedure for the control solution composed of multiple TLCDs distributed across different floors, here referred to as the Multi-Tuned Liquid Column Damper (M-TLCD), and the Multi-Tuned Mass Damper (M-TMD) is presented. Numerical comparisons among the response reduction achievable by these three control strategies were performed in both the time and frequency domains, using the uncontrolled structure as a reference, under different base accelerations.
The structure of the paper is organized as follows. Section 2 introduces the mathematical modeling for M-STLCD-controlled n-story structures. Section 3 describes the excitation model used for numerical simulations throughout the paper. In Section 4, some preliminary analyses are presented to investigate the effects of a single STLCD placed on an MDOF structure with respect to the different modes of the structure. The proposed sequential optimization procedure for M-STLCD-controlled n-story structures follows in Section 5. The results of the optimization in terms of device parameters for each iteration as well as the evaluation of the control performance in comparison with common control strategies (M-TMD and M-TLCD), are discussed in Sections 6, 7, focusing on the frequency and time domains, respectively. Finally, conclusions are drawn in Section 8.
2 Mathematical modeling
Let us consider the system shown in Figure 1, subjected to the ground acceleration
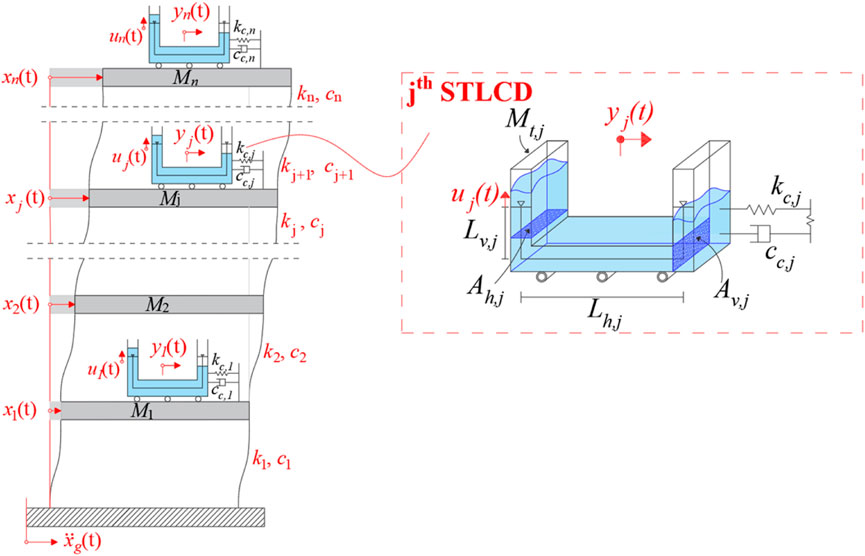
Figure 1. M-STLCD-controlled n-story structure.
In the close up of the generic jth (with j = 1,…
where
Finally,
In this regard,
The liquid behavior is herein considered as nonlinear, as can be seen from the dependence of the jth damping term on the absolute value of the liquid’s vertical velocity
where g indicates the gravitational acceleration. It should be emphasized that, although the nonlinearity in the present formulation arises exclusively from the liquid dynamics, via the velocity-dependent head-loss term, the coupled interaction between structure and fluid renders the entire system nonlinear. Importantly, this localized nonlinearity does not compromise the generalizability of the formulation, which remains valid and applicable regardless of the source or distribution of nonlinear effects within the system.
To normalize and generalize the analyses, a set of dimensionless parameters that describe the system dynamic characteristics crucial for achieving optimal control performance are introduced. One of the most relevant is the tuning ratio of the jth STLCD unit, defined as
3 Base excitation generation and response descriptors
In order to effectively design and optimize the vibration control system, it is essential to accurately characterize the seismic excitation acting on the structure. This section describes the generation of the ground acceleration used as input at the base of the structure and establishes the main response descriptors, which will serve as the basis for the successive sections focusing on both the preliminary analyses on a single STLCD and the subsequent optimization of multiple STLCD devices. In this respect, seismic ground motions are often modeled as stochastic processes to account for their inherently random nature. One of the most widely used representations for characterizing the frequency content of earthquake-induced ground accelerations is the Kanai-Tajimi power spectral density (PSD) function (Chen and Wu, 2001). This widely used formulation accounts for the filtering effects of local soil conditions on seismic waves and is expressed as:
In Equation 9,
In this equation,
Given the PSD of the input, the structural response can be described by the displacement variance
where
where
4 Preliminary analyses: effect of a single STLCD on n-story structures
This Section presents preliminary analyses on the effectiveness of a single STLCD (
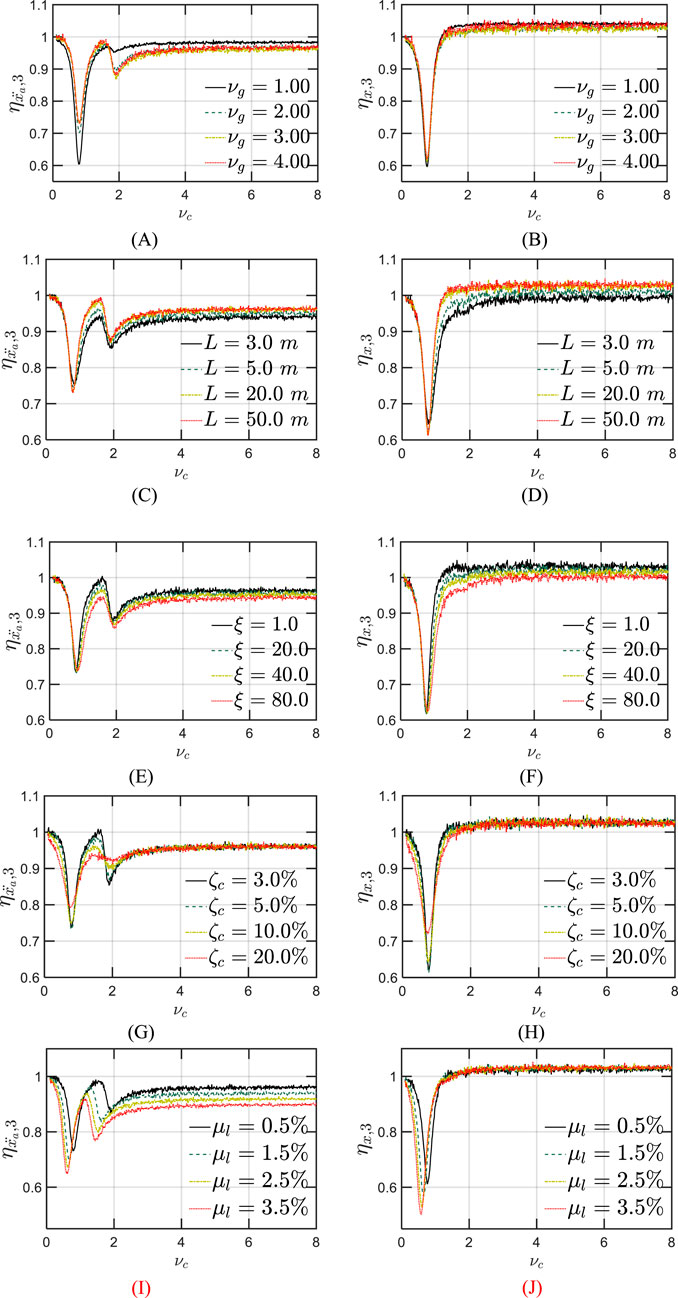
Figure 2. Effect of a single STLCD on the structural response at the top floor for various tuning ratios
5 Sequential optimization strategy for M-STLCD in n-story structures
This Section proposes an optimization procedure developed to design the M-STLCD in order to enhance the dynamic performance in n-story structures. Since the M-STLCD is composed of several STLCD units, the goal is to determine the optimal set of parameters and optimal positioning of each device within the structure to achieve an overall reduction in the structural response. Notably, the optimization follows a sequential approach, where STLCD units are installed progressively, one per iteration, ensuring that each unit adapts to the evolving dynamic characteristics of the structure. It is worth emphasizing that, to date, existing literature has not proposed any sequential optimization methodology for the coordinated design and placement of multiple nonlinear STLCD devices across multi-story structures. The proposed optimization strategy installs one STLCD at a time, excluding previously selected floors from subsequent consideration. However, analogously to (Chen and Wu, 2001), a single optimized device can later be interpreted as a set of equivalent dampers distributed across multiple floors in a subsequent phase of the analysis. While the restriction of one device per floor may limit the exploration of more synergistic configurations, such as deploying multiple devices on the same floor, the framework is inherently flexible and can be adapted to support such scenarios if desired.
Unlike most metaheuristic algorithms that operate in a “global” optimization mode, seeking the best overall solution by considering all devices simultaneously, often under a static structural configuration, the proposed method integrates the evolving structural dynamics at each iteration. It accounts for the fact that installing a single damper modifies the dynamic properties of the structure, thereby influencing the optimal parameters of subsequent devices. Although the algorithm can be readily extended to perform global optimization if required, the present study deliberately focuses on understanding the effect of each installation step rather than pursuing a globally optimal configuration. This allows for the isolated evaluation of each damper’s influence, providing ease of interpreting intermediate outcomes and clearer insight into the physical mechanisms involved and the interdependencies between design variables. Additionally, given its sequential nature, the procedure allows earlier termination if satisfactory results are achieved, or based on specific practical criteria, significantly reducing potential implementation costs. This structured, step-by-step approach thus offers a flexible and practical framework, aligned with how design and installation often evolve in real engineering practice, guiding the selection of design variables to be optimized at each stage. In this respect, as is common in optimization procedures, certain parameters are generally optimized as they significantly influence the effectiveness of the control strategy, while others remain fixed due to structural constraints or geometric limitations. For instance,
Based on the insights gained from the preliminary analyses, the
where i is the ith iteration varying from one to the number of DOF. The optimal configuration at the ith iteration corresponds to the combination of the installation floor and the set of parameters that minimizes the
1. Initialization: The algorithm generates the structural base acceleration input, defines the matrices of the uncontrolled structure, and evaluates the structural response of the nonlinear system in Equation 1 in terms of absolute acceleration variances
2. 1st iteration (placement of the 1st STLCD): The algorithm starts the 1st iteration. The 1st STLCD unit is tentatively placed on the lowest floor, removing the zero rows and columns associated with inactive STLCD degrees-of-freedom from the restore-point matrices. The
• The process is repeated for each successive floor up to the top floor, until all possible combinations of the single unit across different floors have been thoroughly explored.
• The combination of parameters, including the floor and the STLCD properties, that leads to the minimum of the
• After installing the 1st optimal STLCD unit, the algorithm updates the full-size restore-point matrices accordingly and recalculates the nonlinear structural response for the new configuration. Both the updated mathematical model and the associated structural response then serve as the new baseline for the next iteration.
3. Subsequent iterations (placement of STLCD units on remaining floors): Once the 1st iteration has been completed, the algorithm proceeds to execute the subsequent iterations, similarly retracing the aforementioned steps (clearly excluding the initialization steps). The process continues until each single, optimally tuned STLCD unit has been placed on each floor.
An overview of the sequential optimization process is provided in the flowchart shown in Figure 3.
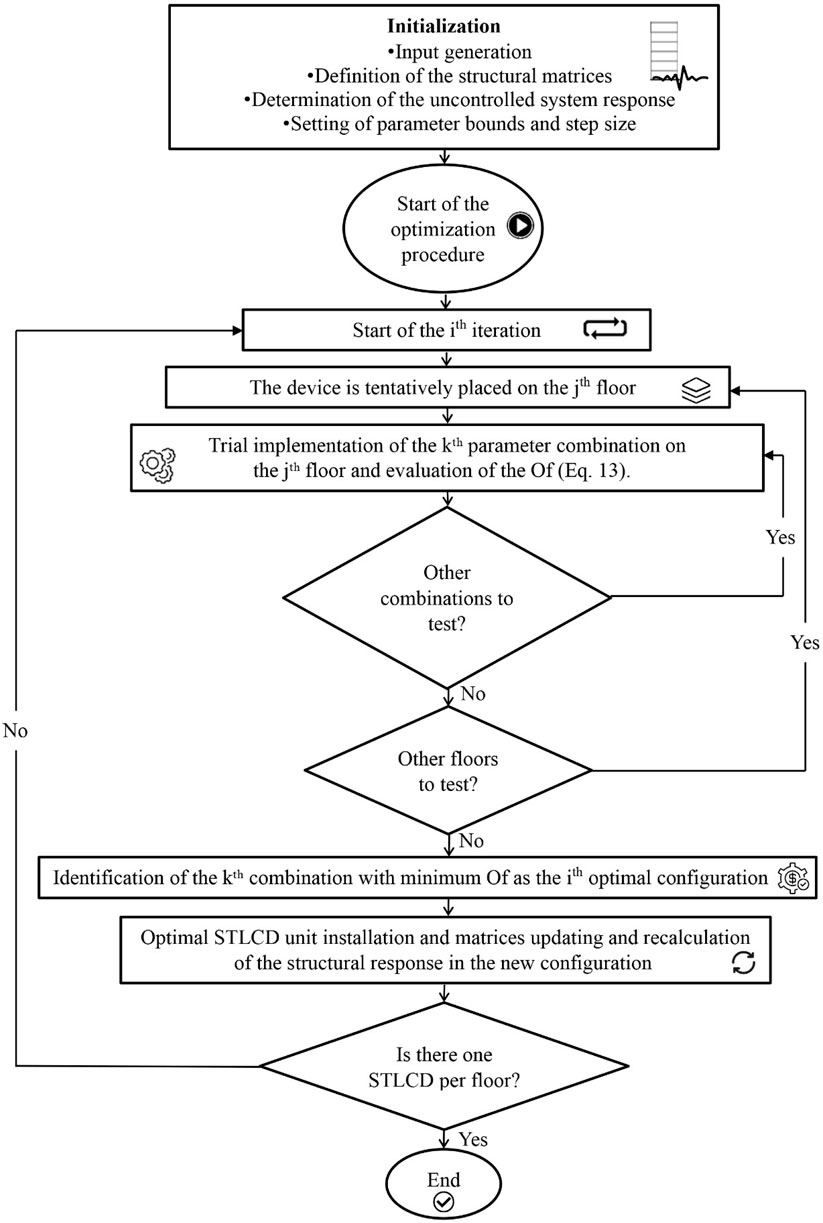
Figure 3. Flowchart of the sequential optimization process.
6 Sequential optimization outcomes
This section presents the results of the proposed optimization procedure applied to the M-STLCD system in multi-story structures, focusing on optimal parameters, placement, and the resulting reductions in structural response. To ensure a comprehensive analysis, two types of structures were examined: one with three stories and the other with six stories, both modeled as shear-type planar frames. For both structures, the outcomes of the optimization procedure are analyzed in terms of the optimal parameters determined for each STLCD, in terms of the iterative variance reduction and FRF peak reductions at a specific floor, as well as the variance reduction achieved across all floors upon completion of the optimization procedure using a broadband base excitation generated as described in Section 3. Furthermore, to provide a comprehensive examination of the procedure, the M-STLCD control strategy is compared with common strategies incorporating the M-TMD and the M-TLCD, optimized by adopting the same sequential optimization procedure as the M-STLCD. Thus, in each iteration of these procedures, one optimal unit is determined along with its corresponding installation floor. For each TMD unit, the parameters to be determined through the optimization procedure are the natural frequency and the damping ratio denoted as
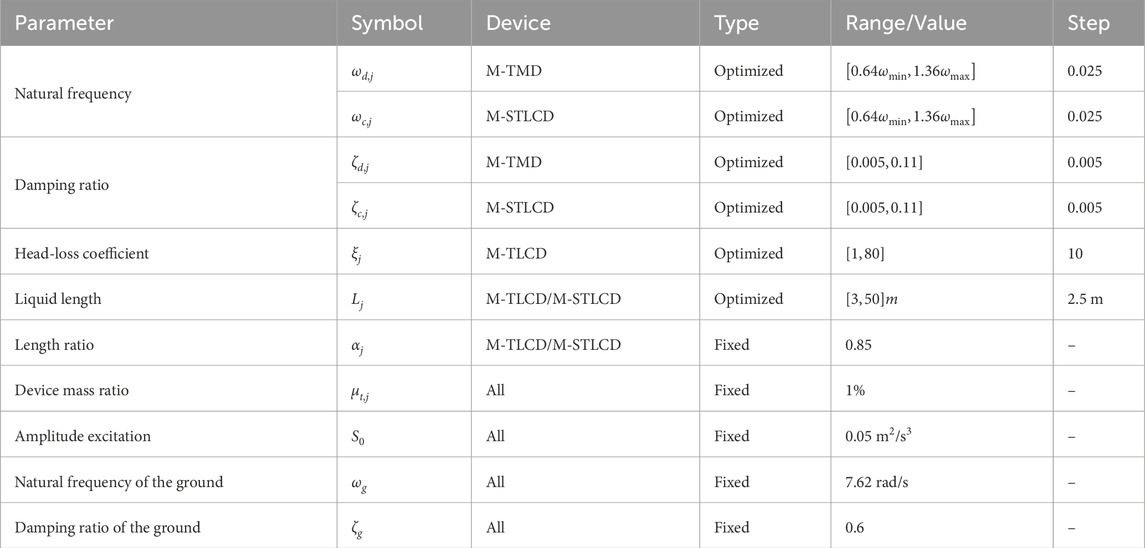
Table 1. Parameter definitions and design constraints for the damping devices and excitation used in the multi-story optimization procedure.
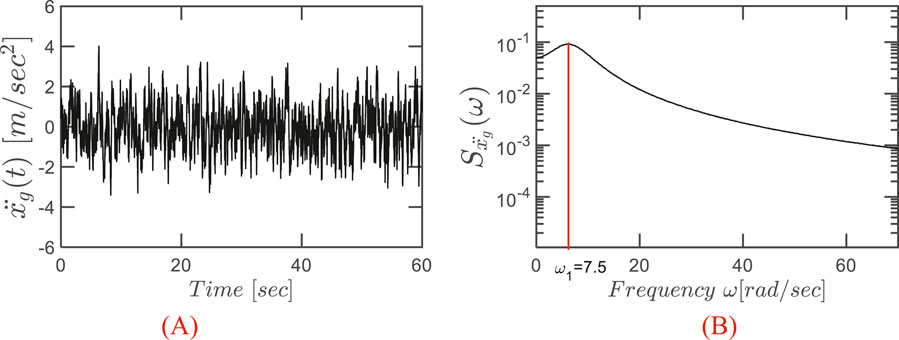
Figure 4. Broadband noise-based base excitation: (A) time history; (B) PSD.
6.1 Case study 1: three-story structure
This Section reports the optimization results for the three-story structure previously introduced in Section 4. In particular, the results are provided in terms of optimized parameters, installation floors, and the vibration modes targeted by the optimization procedure for the M-STLCD-controlled three-story structure. An intuitive representation of the optimal installation floors is provided in Figure 5, while detailed results are listed in Table 2, which shows the outcomes of each iteration of the proposed procedure. For each entry, a comparison with the global PSO algorithm, implemented using the default MATLAB package, is included by reporting, in round parentheses next to the proposed values, the corresponding PSO results in terms of both device parameters and normalized variances obtained for the M-STCLD strategy. It is important to note that, unlike the sequential nature of the proposed approach, PSO results refer to the final configuration obtained by optimizing all devices simultaneously, rather than iteratively. As can be observed, the 1st STLCD unit is tuned to the 2nd mode from the very 1st iteration and placed on the 2nd floor. The tuning decision is likely influenced by the strong contribution of the 2nd mode, partly due to its low damping ratio, while the placement is driven by the largest component of the 2nd mode at the 2nd floor, making that level the most effective location for the 1st installations to achieve optimal control performance. At the 2nd iteration, the 2nd STLCD is installed on the 3rd floor and tuned to the 1st mode. In the 3rd and final iteration, the last device is placed on the 1st floor and tuned to the 2nd mode. As can be deduced from Table 2, although the parameters obtained via PSO differ significantly from those identified by the proposed sequential algorithm, the resulting acceleration variances are practically equivalent. At the upper two floors, the PSO approach achieves slightly lower variances, whereas at the 1st floor, the proposed method provides a marginally better reduction, highlighting how PSO’s effectiveness depends on careful tuning of internal parameters. Despite its simplicity, the proposed method delivers competitive, and sometimes superior, results without requiring extensive calibration. In any case, the maximum discrepancy is limited to 1.92% at the 2nd floor. This close agreement in performance confirms the effectiveness of the proposed sequential strategy, despite its simpler and more interpretable optimization process. The results for the other M-TMD and M-TLCD control strategies are also listed in Table 2. The M-TMD follows a similar trend to the M-STLCD. The M-TLCD, however, does not exhibit the same clear pattern of mode and floor selection, suggesting that its physically realizable lengths were insufficient to properly target the 2nd mode. This deviation, compared to the other devices, stems from constraints on the liquid length, imposed to ensure the practical feasibility of the M-TLCD, which shifts the liquid frequency either too far above or too far below the structural frequency. The effectiveness of these three strategies is compared in Figure 6, where the normalized variances of absolute acceleration and displacement are shown, respectively. Figure 6 illustrates the evolution of the normalized acceleration variance at each floor of the three-story structure throughout the optimization process. A clear trend of progressive variance reduction is observed for the M-STLCD, showing performance closely aligned with the M-TMD across all iterations. In contrast, the M-TLCD exhibits higher variance levels throughout the procedure, failing to match the effectiveness of the other strategies. Similarly, Figure 7 presents the evolution of the normalized displacement variance at each floor in the final configuration. For the M-STLCD, a comparison is included with results obtained via a global PSO to highlight the effect of simultaneous optimization across all devices through a metaheuristic approach. As shown in Figure 7A, in terms of acceleration variance, PSO exhibits essentially the same performance. On the other hand, regarding displacement response (Figure 7B), although it was not directly included in the objective function, the PSO algorithm yields slightly better results. This can be attributed to the global nature of the PSO strategy, which simultaneously adjusts all device parameters in a way that may indirectly favor improved displacement performance. Despite not being explicitly targeted, such outcomes suggest that the broader search space exploration characteristic of PSO may occasionally capture favorable trade-offs among multiple dynamic response quantities. Nonetheless, the proposed sequential discrete procedure yields comparable performance, especially in terms of acceleration reduction, as seen in Figure 7A, while offering significant advantages in terms of implementation simplicity and transparency of the optimization process. It is deterministic, less sensitive to algorithmic tuning, and requires substantially fewer resources. These characteristics make it particularly suitable for practical civil engineering applications, where robustness, reproducibility, feasibility, parameter traceability, step size control, and sequential installation might outweigh marginal performance gains. Again, the M-STLCD progressively reduces displacement variances at all floors with results comparable to the M-TMD. Figure 7 presents the final variance values across all floors in terms of normalized absolute accelerations (Figure 7A) and displacements (Figure 7B). In Figure 7A, the M-STLCD closely matches the M-TMD at the 3rd floor, while the M-TMD achieves slightly lower variances at the 1st and 2nd floors. In contrast, Figure 7B shows that the M-STLCD attains slightly lower displacement variance at the 3rd floor (∼0.57), and comparable performance across all levels. The M-TLCD, on the other hand, remains the least effective solution in both acceleration and displacement responses.
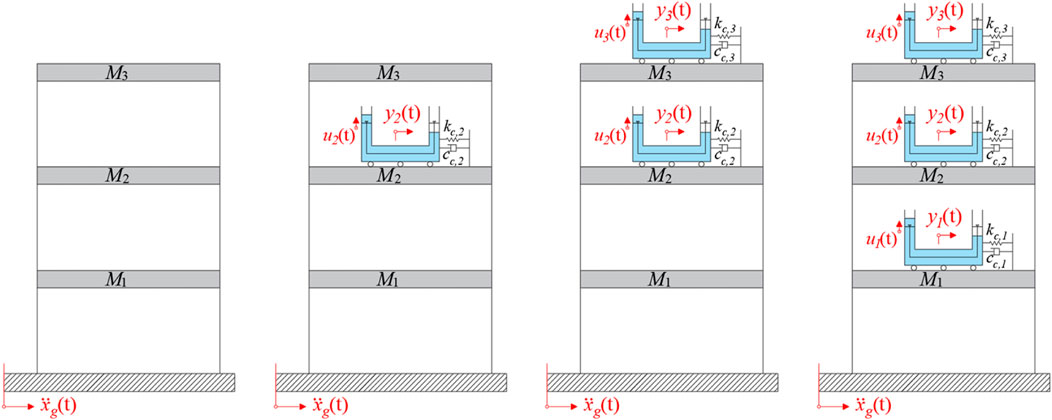
Figure 5. Installation floors for the M-STLCD-controlled three-story structure.
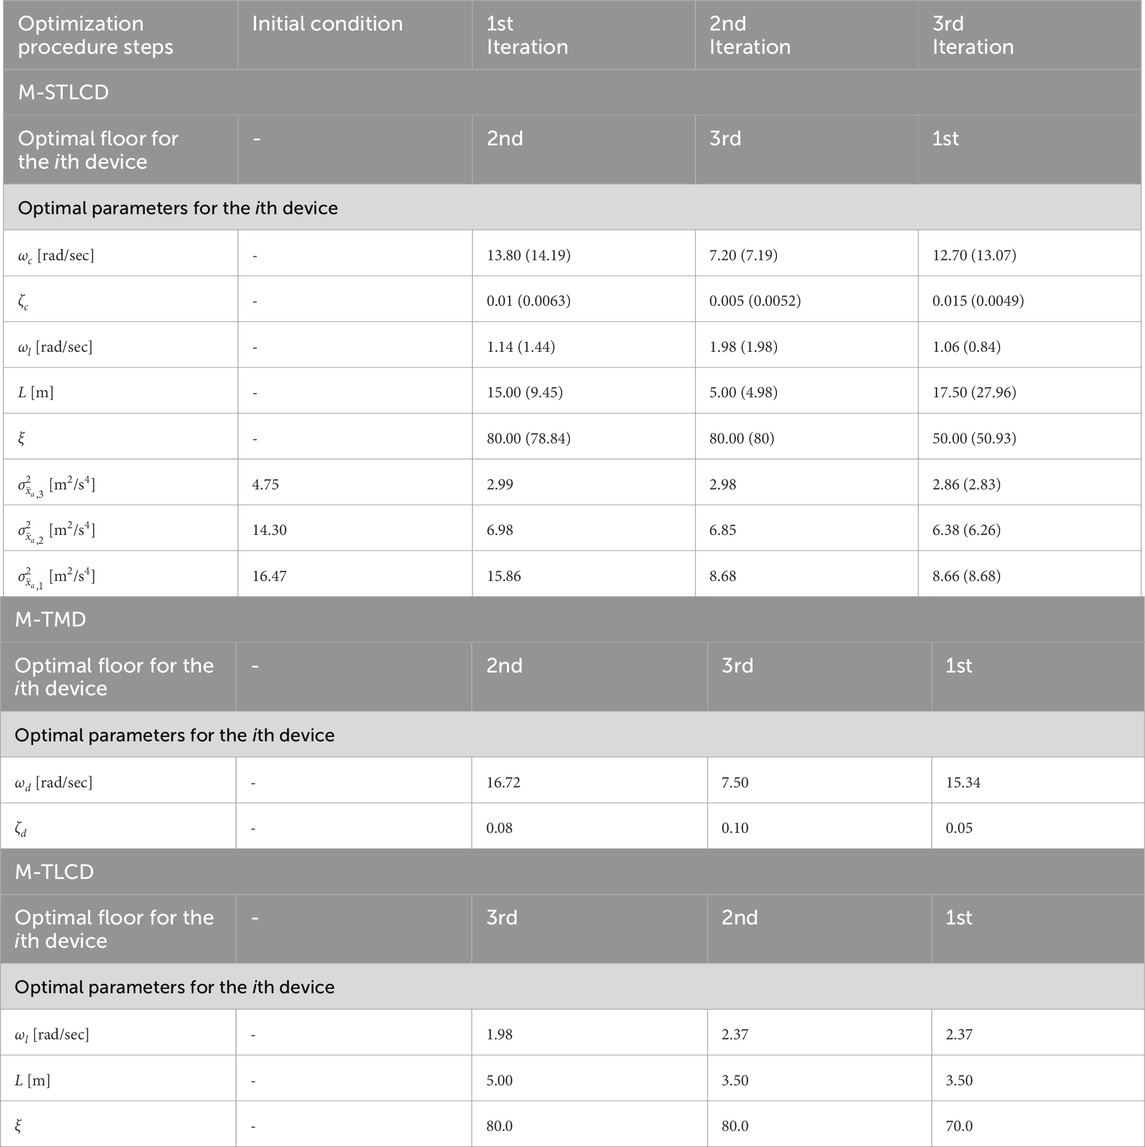
Table 2. Optimized parameters, installation floors, and tuned modes for the M-STLCD, M-TMD, M-TLCD controlled three-story structure.
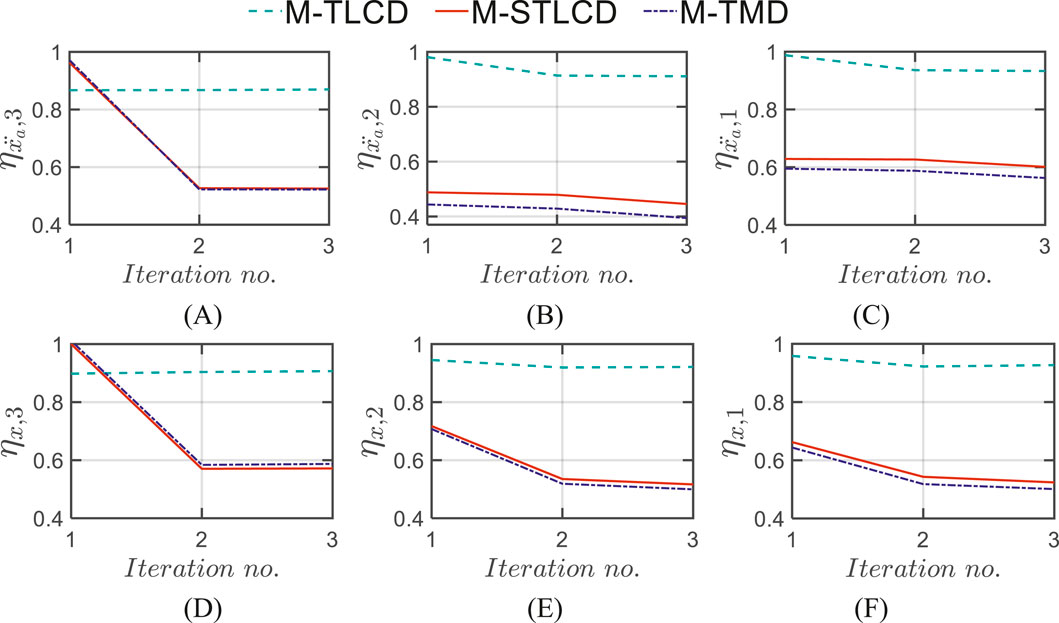
Figure 6. Normalized acceleration variance (top row) at the: (A) 3rd; (B) 2nd; (C) 1st floor, and normalized displacement variance (bottom row) at the: (D) 3rd; (E) 2nd; (F) 1st floor of the three-story structure for each iteration: M-STLCD vs. M-TMD and M-TLCD.
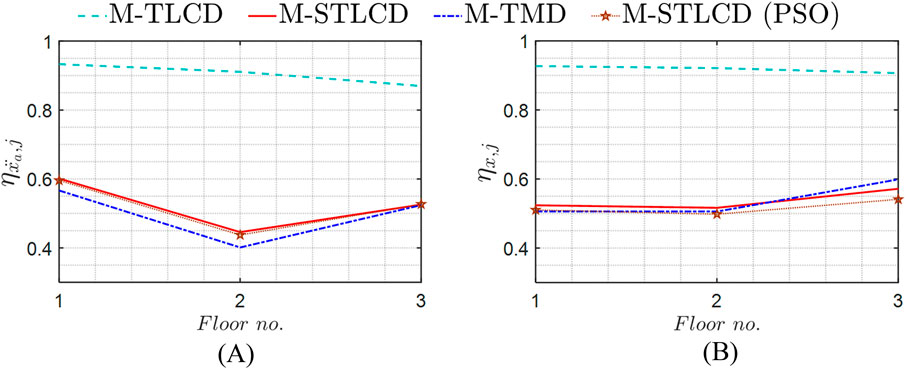
Figure 7. Normalized variance in the final configuration in terms of (A) acceleration
Figure 8 illustrates the iterative evolution of the FRFs for the three-story structure, comparing the M-STLCD-controlled system with the uncontrolled case, in terms of absolute acceleration for the 1st, 2nd, and 3rd floors, shown in panels (A)-(C), respectively. As can be seen, the device sequentially targets the 2nd mode in the 1st iteration, then the 1st mode, and finally refines the 2nd mode again. In particular, the influence of the first STLCD on the subsequent devices is evident from Figure 8A. The first STLCD is placed on the 2nd floor to target the 2nd vibration mode, which exhibits a dominant peak in the uncontrolled structure, particularly evident in Figure 8B. This device is effectively tuned to reduce the 2nd mode’s contribution, leading to a significant attenuation of the corresponding peak of 65.44%, 61.74%, and 62.14% at the 3rd, 2nd, and 1st floors, respectively. Once the 2nd mode is mitigated, the 1st mode becomes the most critical contributor to the structural response. Consequently, the second STLCD, selected in the following iteration, is tuned closer to the first natural frequency to suppress the now-dominant 1st mode, resulting in further attenuation of the lower-frequency peak by 55.48%, 27.64%, and 15.95% at the 3rd, 2nd, and 1st floors. In the 3rd iteration, the optimizer refines the response further by addressing residual contributions from the 2nd mode, achieving additional reductions of 67.50%, 64.26%, and 63.87%, respectively. This iterative pattern highlights how the optimization strategy adapts to the evolving modal content. The influence of each previously installed STLCD is inherently accounted for, as the system matrices are updated after each iteration. Although the process is sequential, inter-device interactions are implicitly captured, and each new device responds to the residual dynamics left unaddressed by earlier ones. The consistent peak attenuation across all floors confirms the effectiveness of the M-STLCD approach. Finally, Figure 9 compares the FRFs in the final configuration (last iteration) among the M-STLCD, M-TLCD and M-TMD strategies. From this comparison, it emerges that the M-TLCD consistently underperforms in mitigating the peak responses; by contrast, both the M-STLCD and the M-TMD effectively suppress the 1st and 2nd modes. Specifically, the M-STLCD achieves a higher peak reduction of the 1st mode at the 3rd floor (56.07% for M-STLCD vs. 54.51% M-TMD), and the M-TMD provides higher peak attenuations of the 2nd mode at lower floors (64.26% M-STLCD vs. 72.37% M-TMD at the 2nd floor, and 63.87% M-STLCD vs. 72.25% M-TMD at the 1st floor).
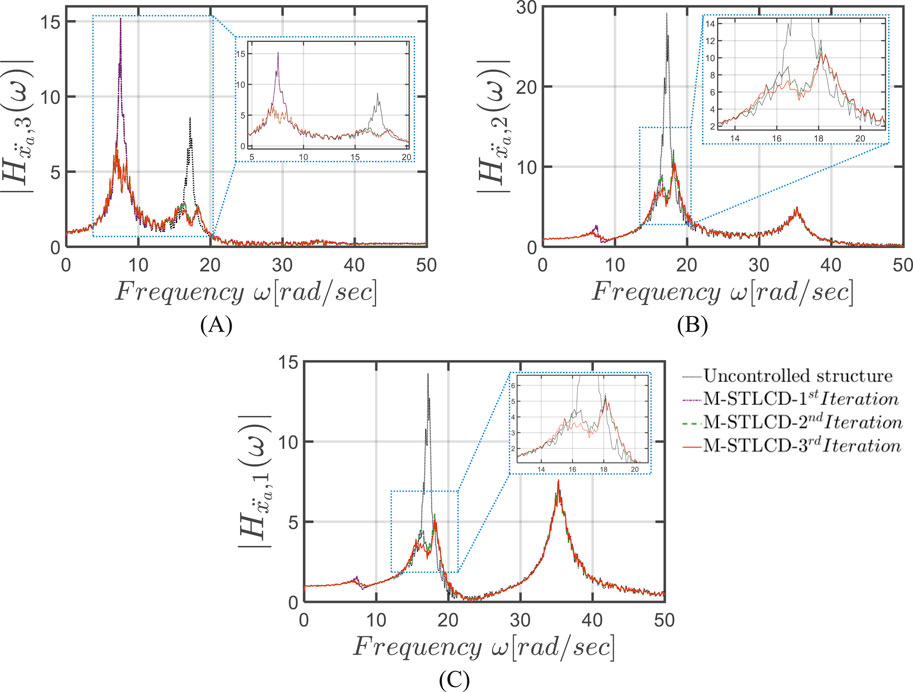
Figure 8. FRFs in terms of absolute accelerations at the: (A) 3rd; (B) 2nd; (C) 1st floor, for each iteration of the optimization procedure for the M-STLCD-controlled three-story structure.
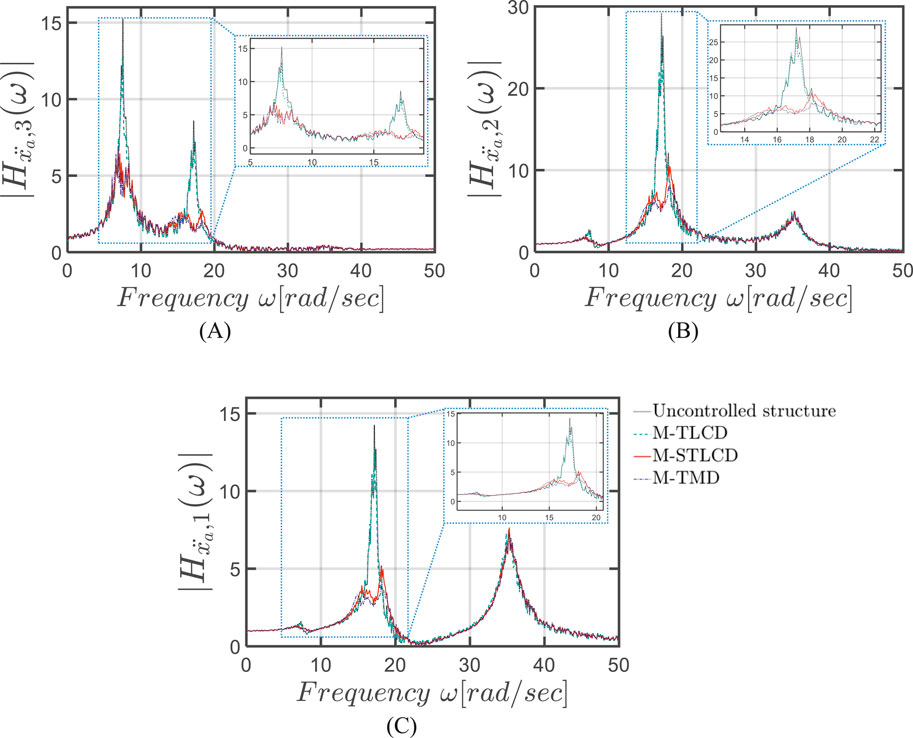
Figure 9. FRFs in terms of absolute accelerations in the final configuration at the: (A) 3rd; (B) 2nd; (C) 1st floor, of the three-story structure: M-STLCD vs. M-TMD and M-TLCD.
6.2 Case study 2: six-story structure
To demonstrate the generalization capability of the proposed optimization procedure across different structural configurations, this section presents the optimization results for the six-story reference structure, which has already been investigated in the literature for multi-modal control via TMDs (Chen and Wu, 2001). The reference structure consists of six floors having identical lumped masses
Figure 10 depicts the results of the optimization procedure in terms of the installation floors for each iteration, while Table 3 presents the details of the results of the optimization procedures for the M-STLCD-controlled six-story structure. Unlike the three-story structure, each STLCD here is installed sequentially from the top to the bottom floor, almost always targeting the 1st structural mode and switching its tuning to the 2nd mode only at the 5th iteration as a consequence of the primary influence of the fundamental mode in early iterations. In contrast to the 3-DOF case, the acceleration variances obtained through the PSO algorithm are unexpectedly higher than those achieved by the proposed sequential method highlighting the sensitivity of global optimization algorithms to the choice of their internal parameters (such as population size, inertia weight, and acceleration coefficients) which, if not properly tuned, may lead to suboptimal results. These findings further reinforce the fact that, despite its simplicity and lack of global coordination, the proposed algorithm is capable of delivering competitive, and in some cases superior, performance without the need for extensive parameter calibration. As shown in Table 3, which also includes results for the M-TMD and M-TLCD, similar trends are observed for the M-TMD. In contrast, detecting the target mode is challenging for the M-TLCD, as the identified frequencies often deviate from the fundamental ones of the uncontrolled structure, underscoring its inadequacy for this type of short-period structure. Figure 11 illustrates the variation in normalized acceleration variance at each floor of the six-story structure over the course of the optimization process, comparing the performance of the M-STLCD, M-TLCD, and M-TMD. Overall, both the M-STLCD and the M-TMD achieve comparable reductions in variance, while the M-TLCD consistently underperforms. From the 6th down to the 3rd floor (Figures 11A–D), the M-STLCD and the M-TMD progressively reduce the structural response. A similar trend is observed at the lower levels (Figures 11E,F), where the steeper drop between the 4th and 5th iterations highlights the effectiveness of the 5th unit, installed on the second floor and tuned to the 2nd mode, in mitigating local accelerations. A similar trend is observed in terms of normalized displacement variance at all floors over the course of the optimization process (Figure 12), with the M-STLCD and M-TMD demonstrating comparable effectiveness, while the M-TLCD continues to show limited effectiveness in mitigating displacements. Figure 13A illustrates the final normalized variance in terms of absolute accelerations across all floors for each control strategy in the final configuration. As can be seen in Figure 13A, and as already evident from Table 3, in terms of normalized acceleration variance, PSO exhibits essentially the same performance, albeit slightly lower. While the M-TLCD remains the least effective, the M-STLCD shows progressive improvement, ultimately approaching the performance of the M-TMD at the upper floors. Notably, the M-TMD matches or even exceeds the performance of the M-STLCD in terms of normalized displacement variance at all levels (Figure 13B), while the M-TLCD proves to be the least effective. Again, as in the case of the three-story structure, the PSO algorithm yields slightly better results.
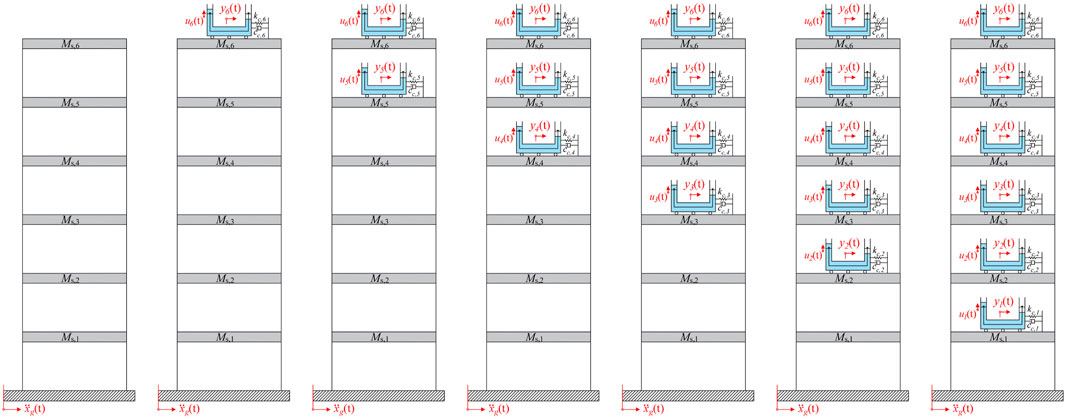
Figure 10. Installation floors for the M-STLCD-controlled six-story structure.
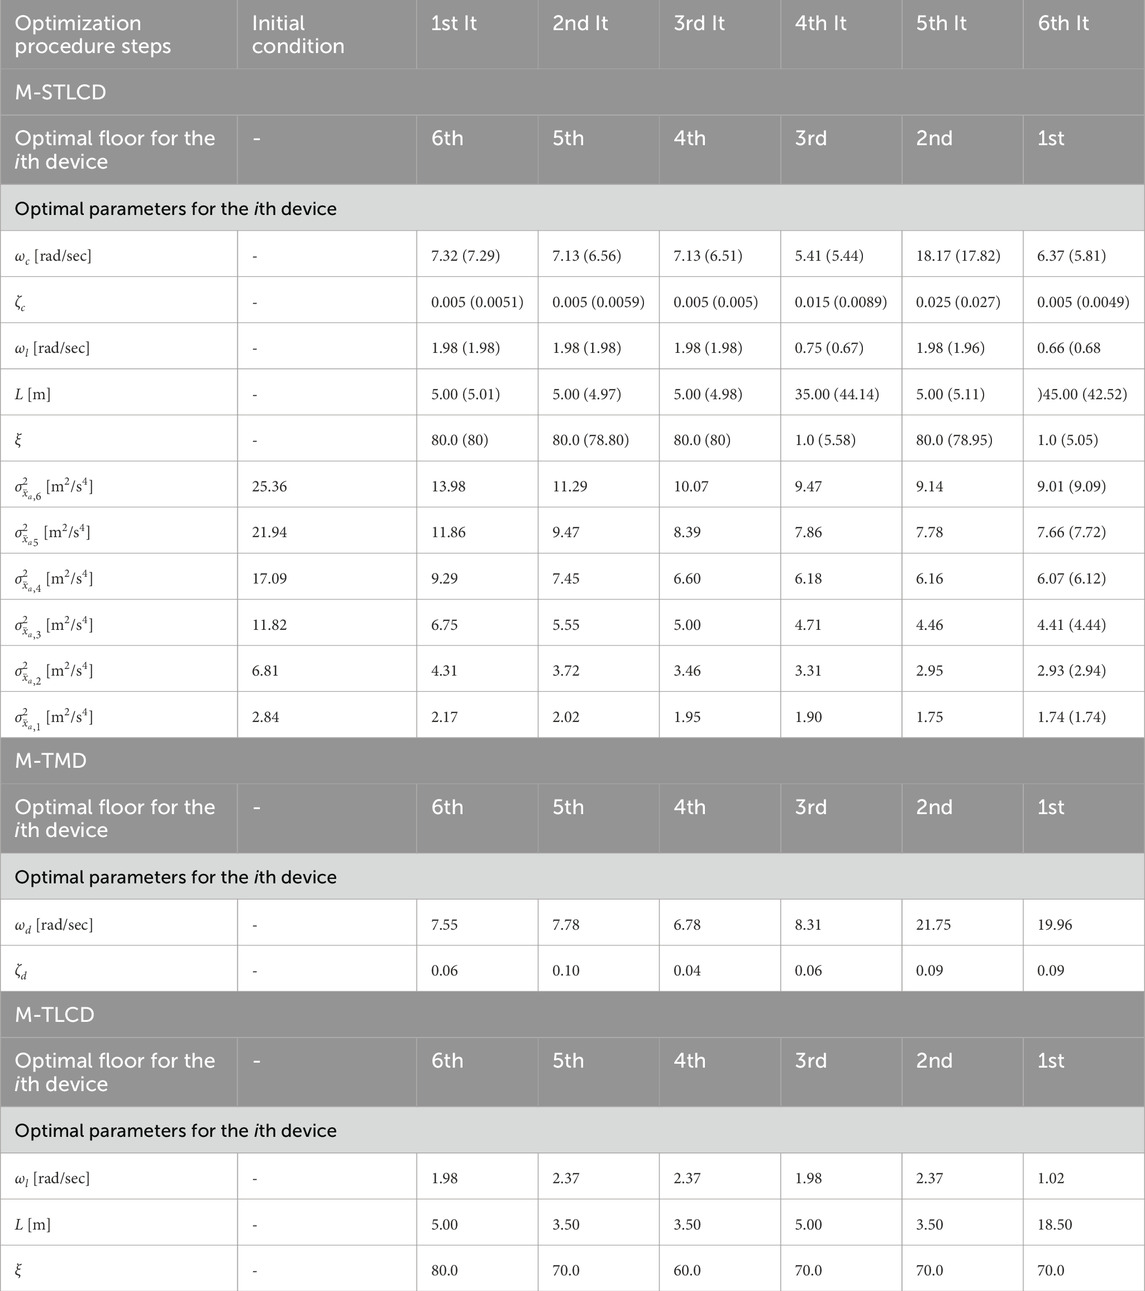
Table 3. Optimized parameters, installation floors, and tuned modes for the M-STLCD, M-TMD, M-TLCD-controlled six-story structure.
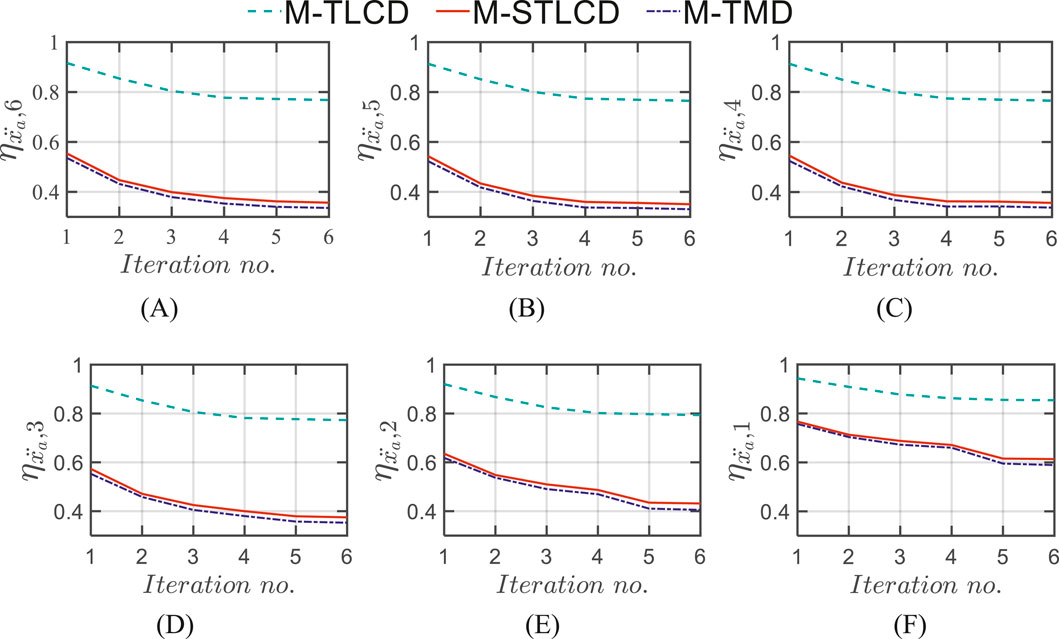
Figure 11. Normalized acceleration variance
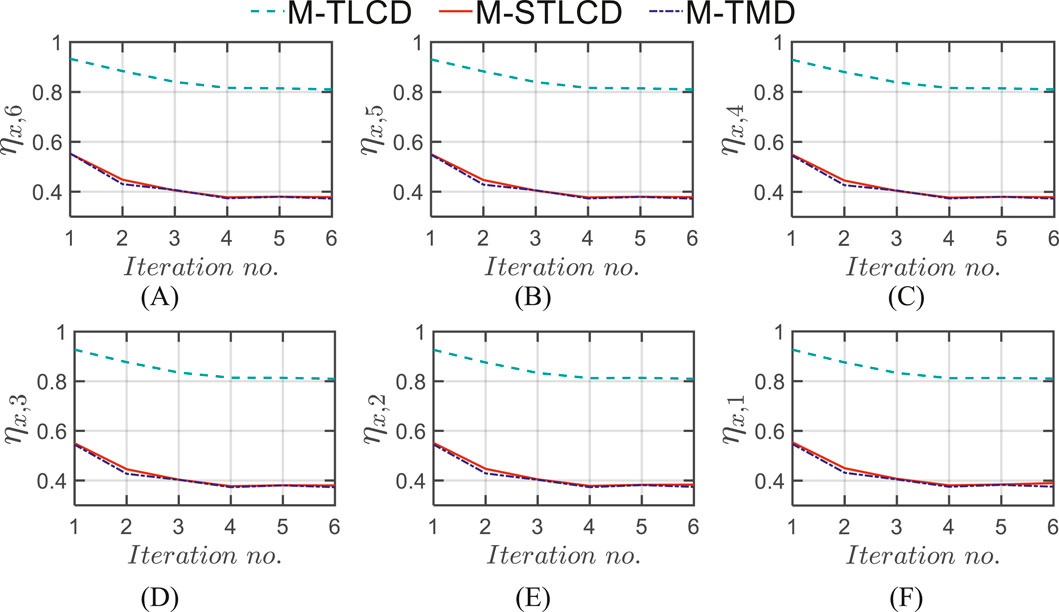
Figure 12. Normalized displacement variance
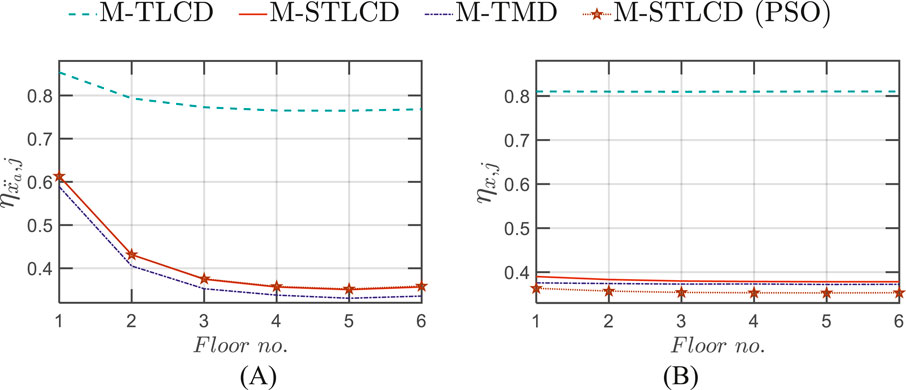
Figure 13. Normalized variance in the final configuration in terms of: (A) acceleration
Figure 14 illustrates the iterative evolution of FRFs in terms of absolute accelerations for the M-STLCD control strategy compared to the uncontrolled structure. The uncontrolled structure exhibits a dominant 1st mode, with progressively lower magnitudes from the 6th to the 1st floors. At the 2nd and 1st floors, however, the contribution of the 2nd mode becomes significant and, due to the reduced amplitude of the 1st mode at these levels, the two modes exhibit comparable magnitudes. From the 1st iteration, the initial STLCD unit substantially reduces the 1st mode across all floors, achieving a peak reduction of 57.69% at the 6th floor. The attenuation continues in iterations 2 and 3, albeit with diminishing impact, while the 4th iteration further refines the 1st mode’s reduction, leading to 71.96% peak reduction. A significant shift occurs in the 5th iteration, which specifically targets the 2nd mode, leading to a marked attenuation of the 2nd peak across all floors, reaching 52.79% at the 6th floor. Finally, Figure 15 highlights the M-STLCD’s performance relative to alternative approaches, showing that the M-STLCD and the M-TMD demonstrate comparable reductions in the 1st mode (72.21% for M-STLCD vs. 76.07% for M-TMD at the 6th floor), as well as in the 2nd mode (52.22% for M-STLCD vs. 54.22% for M-TMD at the 6th floor). In contrast, the M-TLCD achieves only modest reductions in both modes, confirming its limitations in addressing higher-mode contributions in short-period structures.
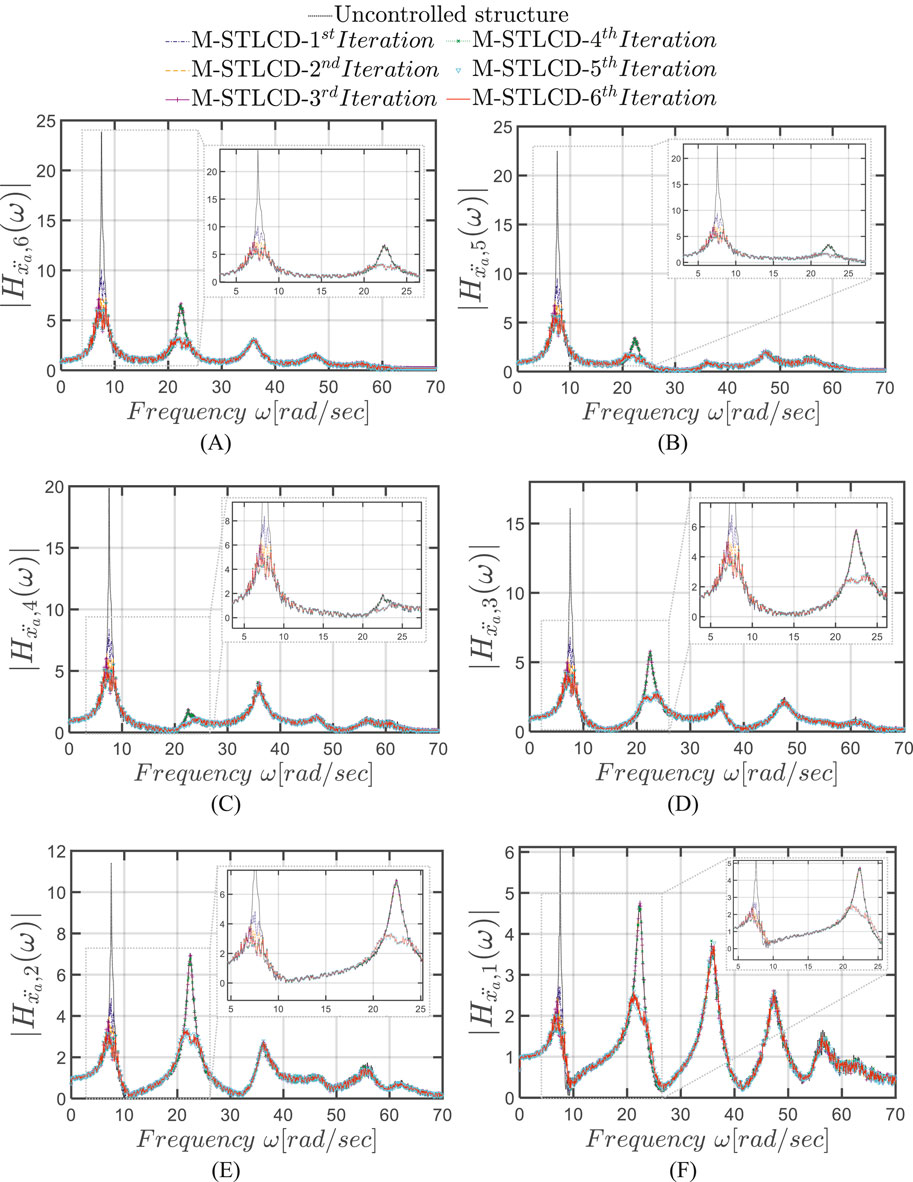
Figure 14. FRFs in terms of absolute accelerations for each iteration at the: (A) 6th; (B) 5th; (C) 4th; (D) 3rd; (E) 2nd; (F) 1st floor for each iteration of the optimization procedure for the M-STLCD-controlled six-story structure.
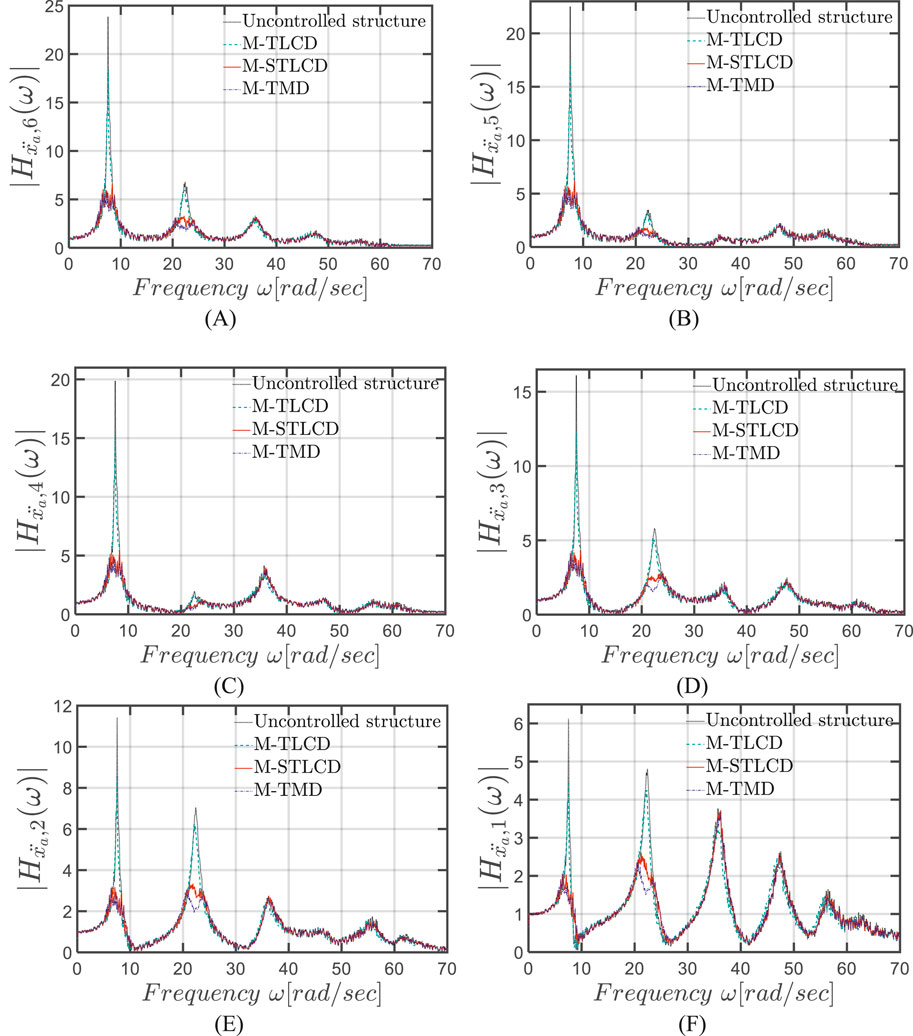
Figure 15. FRFs in terms of absolute accelerations in the final configuration at the: (A) 6th; (B) 5th; (C) 4th; (D) 3rd; (E) 2nd; (F) 1st floor of the six-story structure: M-STLCD vs. M-TMD and M-TLCD.
7 Time-history analyses of final M-STLCD-optimized configurations
This Section evaluates the control performance of the optimized M-STLCD in n-story structures through numerical simulations in the time domain in comparison with the corresponding optimal M-TLCD and M-TMD solutions. As in Section 6, results are presented separately for the three-story and six-story structures. First, time-domain assessment has been carried out under the same broadband excitation described in Section 6. The broadband noise excitation adopted for the time-history analyses has been calibrated to match the amplitude range associated with severe seismic events in seismically active regions (Joshi et al., 2019). Generated numerically through Equations 9, 10, it features a predominant frequency
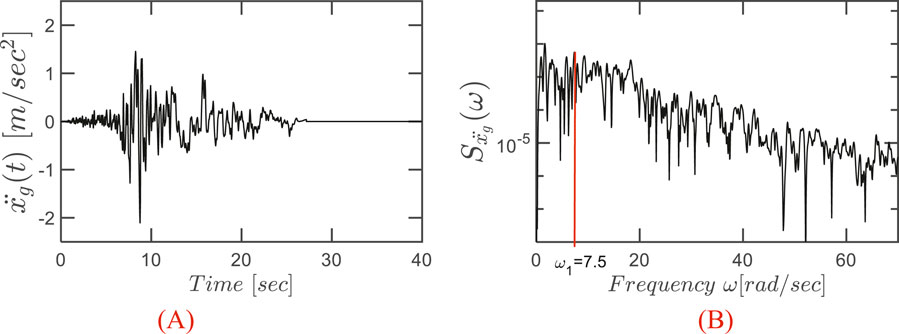
Figure 16. Kocaeli earthquake: (A) time history; (B) PSD.
7.1 Case study 1: three-story structure
The first set of results pertains to the peak responses of the three-story structure under a broadband noise excitation. In this regard, the peak absolute accelerations at all floors
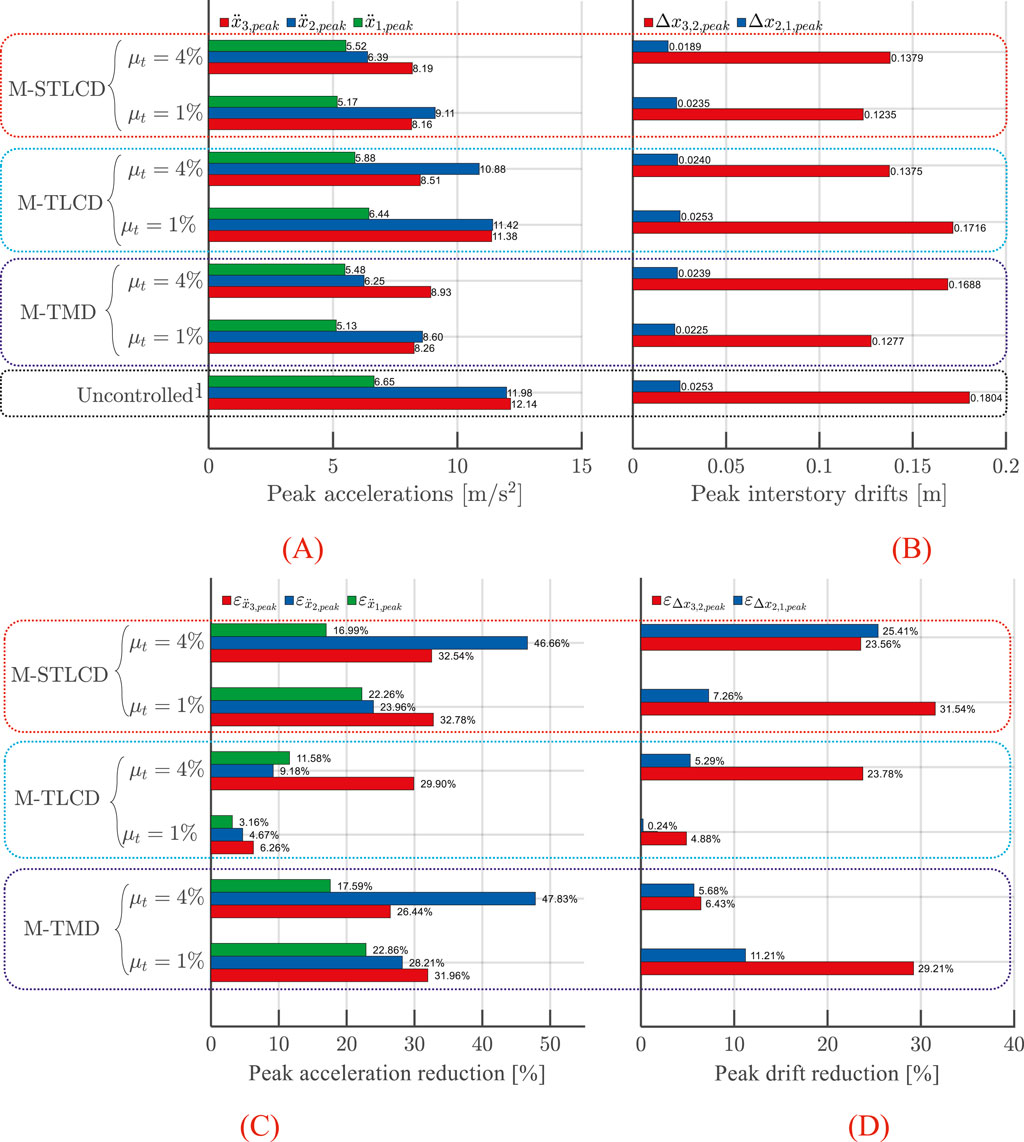
Figure 17. (A) Peak floor accelerations; (B) interstory drifts; (C) acceleration reduction; (D) drift reduction in the three-story structure: M-STLCD vs. M-TMD and M-TLCD control strategies under broadband noise excitation.
These trends are clearly illustrated in the time-history plots shown in Figure 18, which refers to the case with a 4% mass ratio. Specifically, Figures 18A,B display the time-history responses of the top floor acceleration and the interstory drift between the upper floors, respectively. In both cases, the M-STLCD demonstrates robust and consistent performance, effectively reducing the structural response throughout the event. The M-TMD shows comparable overall performance, though it occasionally exceeds the uncontrolled response in localized instances. In contrast, the M-TLCD performs the worst among the three strategies.
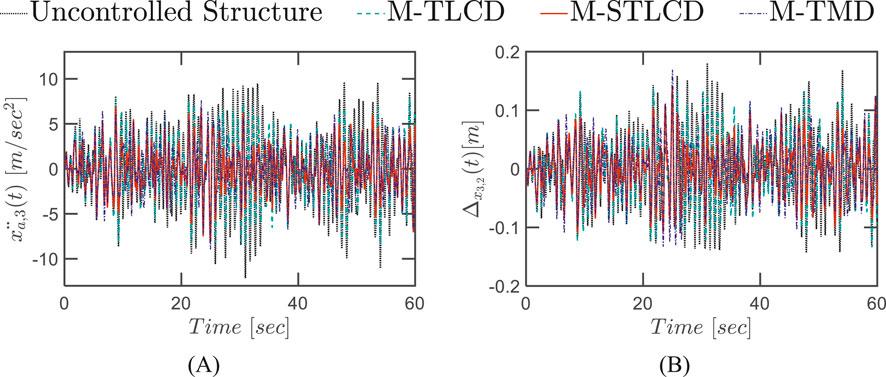
Figure 18. Time-history response of the three-story structure equipped with M-STLCD, M-TMD, and M-TLCD, each having a mass equal to 4% of the total structural mass, subjected to broadband noise excitation: (A) top floor absolute accelerations; (B) interstory drift.
Finally, similar trends are observed in Figure 19, which illustrates the structural response to the real accelerogram recorded during the 1999 Kocaeli earthquake. At the 3rd floor, the M-TMD achieves the greatest peak acceleration reduction (Figure 19A), reaching 37%, while the M-STLCD remains highly competitive with a 26% reduction. In contrast, the M-TLCD consistently delivers lower effectiveness, showing limited reductions across all floors and highlighting its reduced suitability for impulsive seismic inputs. In terms of interstory drift (Figure 19B), the M-STLCD achieves a 14% reduction between the 3rd and 2nd floors, while the M-TMD shows a more substantial reduction of 21%. Notably, the M-TLCD performs poorly, slightly exceeding the uncontrolled response at this interstory level. Overall, the M-STLCD exhibits robust and consistent performance, maintaining effective response reduction even under the challenging, impulsive nature of real earthquake excitation. Its results remain competitive with the M-TMD and clearly superior to the M-TLCD strategy. Clearly, if the goal is to assess whether the system remains within linear limits under these severe earthquake scenarios, the proposed procedure can be applied using specific structural models, alongside standard structural codes. Indeed, the current procedure is based on mass, damping, and stiffness matrices with numerical values that are detached from specific material or geometric information, which is essential for directly verifying linearity. While this aspect can be effectively addressed in a subsequent design phase, involving experiments and tailored protection strategies, the present formulation offers a solid and flexible foundation upon which more detailed, application-driven assessments can be systematically developed. Moreover, only a sample of real earthquakes has been investigated, which is, of course, not exhaustive. Nonetheless, the same procedure can be extended to a wide range of excitation scenarios using comprehensive ground motion data tailored to specific locations and seismic code requirements.
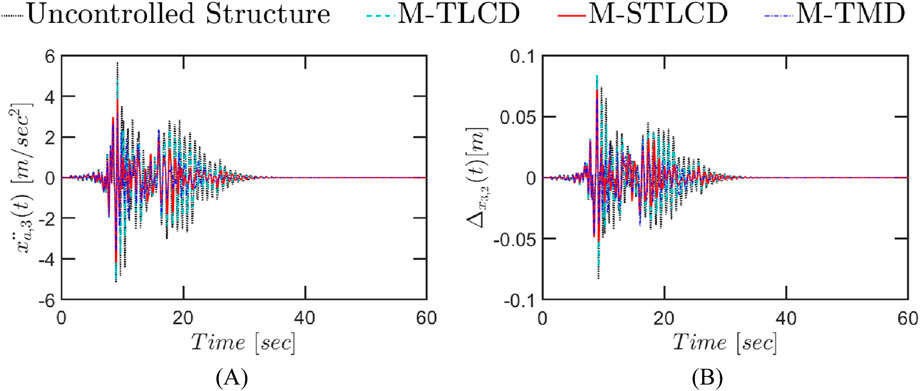
Figure 19. Time-history response of the three-story structure equipped with M-STLCD, M-TMD, and M-TLCD, each having a mass equal to 4% of the total structural mass, subjected to a real earthquake record (1999 Kocaeli): (A) top floor absolute accelerations; (B) interstory drifts.
7.2 Case study 2: six-story structure
This subsection, dedicated to the six-story structure, presents the peak values of absolute accelerations and interstory drifts across all floors, along with time-history responses under both broadband noise and real earthquake base excitations. Specifically, Figure 20 summarizes peak structural responses and corresponding reductions for the six-story structure subjected to the broadband noise excitation, comparing damper units set at 1% and 2%. Concerning absolute accelerations (Figures 20A–C), the M-STLCD strategy effectively reduces the peak responses at all floors. At the top floor, where accelerations are highest, the M-STLCD achieves a 43% reduction in peak acceleration (with mass ratio 1%) comparable to the M-TMD, while the M-TLCD lags significantly with only a 9% reduction. A similar trend continues across the lower floors: both M-STLCD and M-TMD provide consistent reductions in acceleration, with nearly equivalent performance throughout. When increasing the damper mass ratio from 1% to 2%, the M-STLCD shows further improvement, achieving the highest peak acceleration (up to 49.8%) and drift reductions (up to 47.6%), outperforming its own results at lower mass and surpassing the M-TMD at all floors which reaches 43.2% acceleration and 43.6% drift reduction. M-TLCD remains the least effective, with maximum reductions around 25% (acceleration) and 22% (drift). Increasing the mass ratio yields only minor changes for the M-STLCD, which maintains consistent drift reductions across all interstories. In contrast, the M-TMD exhibits a systematic performance decline at almost all levels compared to the 1% case, highlighting the advantage of the proposed M-STLCD configuration.
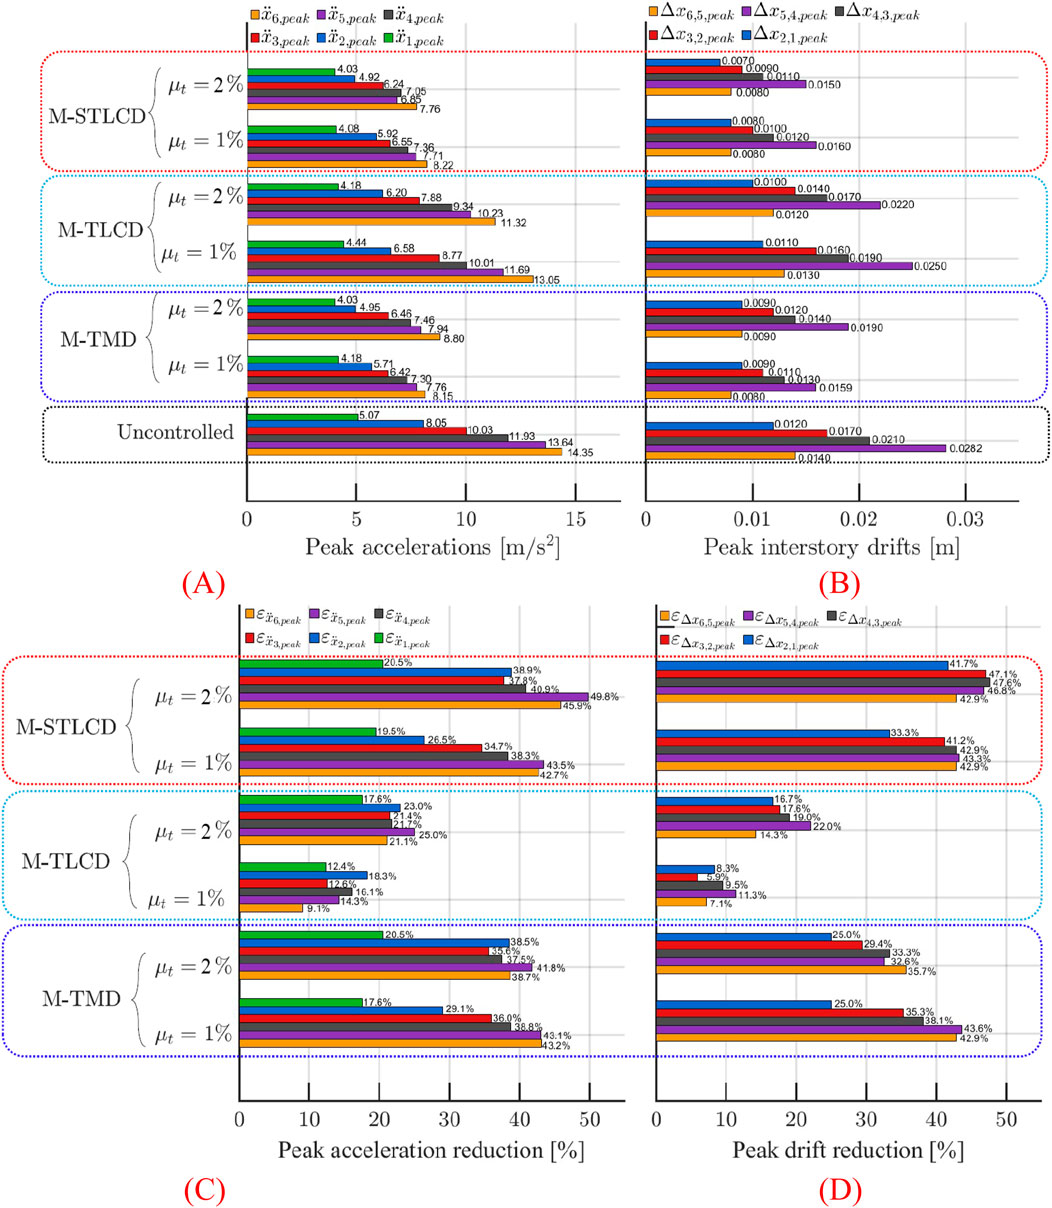
Figure 20. (A) Peak floor accelerations; (B) interstory drifts; (C) acceleration reduction; (D) drift reduction in the six-story structure: M-STLCD vs. M-TMD and M-TLCD control strategies under broadband noise excitation.
The substantial reductions are evident in Figure 21, illustrating M-STLCD’s consistent and stable performance along the seismic event for both absolute accelerations and interstory drifts, when employing an increased unit mass ratio of 2%, performing on par with, or in some cases even surpassing, the M-TMD. Conversely, the M-TLCD exhibits limited improvement, barely reducing the structural response relative to the uncontrolled baseline.
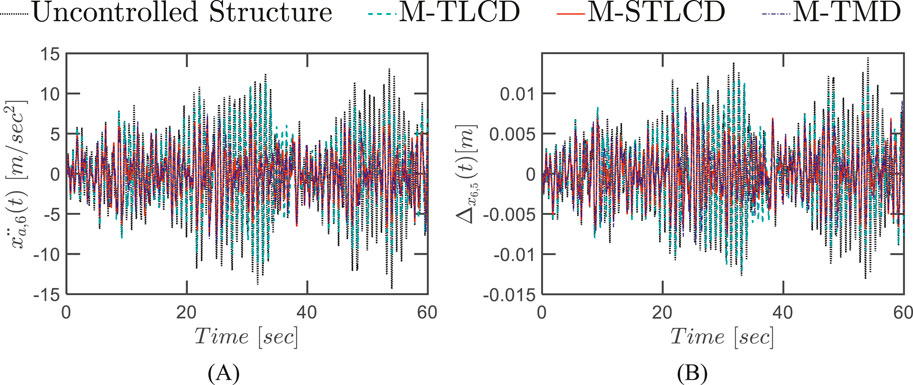
Figure 21. Time-history response of the six-story structure equipped with M-STLCD, M-TMD, and M-TLCD, each having a mass equal to 2% of the total structural mass, subjected to broadband noise excitation: (A) top floor absolute accelerations; (B) interstory drifts.
Finally, Figure 22 illustrates the effectiveness of the M-STLCD under the Kocaeli earthquake in reducing both absolute accelerations and interstory drifts throughout the time-domain response, when employing an increased unit mass ratio of 2%. The M-STLCD exhibits notably robust performance, especially considering the impulsive nature of the Kocaeli record, reducing peak acceleration at the top floor from 5.26 m/s2 (uncontrolled) to 4.85 m/s2 (8% reduction), nearly identical to M-TMD’s performance (4.86 m/s2). In terms of interstory drifts (Figure 22B), both the M-STLCD and M-TMD show slight increases in peak values compared to the uncontrolled case. This behavior aligns with the optimization objective, which prioritizes the reduction of absolute accelerations, often at the expense of drift performance, a well-known trade-off in passive control systems. If the goal is to suppress the initial transient response, it is important to note that the first acceleration peak, often inadequately controlled by passive systems, can be more effectively mitigated using active or hybrid control strategies, which are commonly employed to address this inherent limitation of passive devices. Nevertheless, the M-STLCD proves highly effective in attenuating the structural response over time, delivering sustained and stable performance throughout the remainder of the event. Additionally, compared to the other devices, it offers additional advantages, such as reduced solid mass requirements and the potential use of readily available water resources for damping.
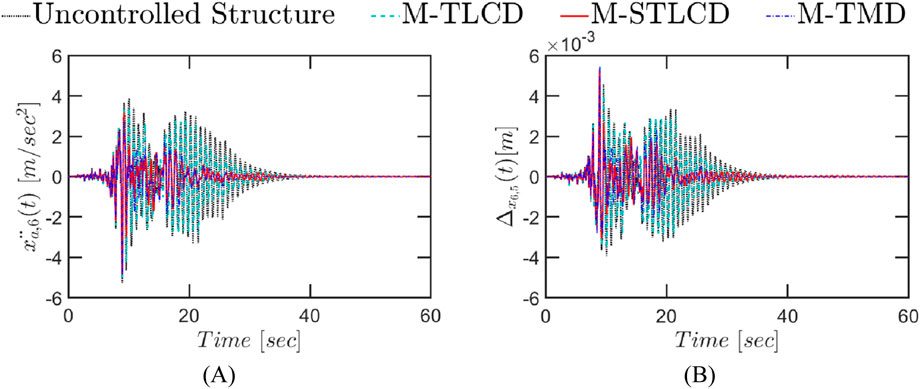
Figure 22. Time-history response of the six-story structure equipped with M-STLCD, M-TMD, and M-TLCD, each having a mass equal to 2% of the total structural mass, subjected to a real earthquake record (1999 Kocaeli): (A) top floor absolute accelerations; (B) interstory drifts.
8 Conclusion
This study proposes a novel vibration control system composed of multiple Sliding Tuned Liquid Column Damper (STLCD) units, collectively referred to as the M-STLCD, for mitigating seismic-induced vibrations in multi-story, stiff structures. Given its modular and distributed design, multiple STLCD units, consisting of mobile U-shaped liquid containers, can be easily integrated throughout the structural layout. Specifically, a sequential optimization procedure, structured in iterative steps, has been developed to progressively identify an optimal configuration tailored to the dynamic properties of the structure and the characteristics of the input seismic excitation. At each iteration, the procedure optimizes a single STLCD unit by determining the optimal parameters and installation floor for each damper unit. Based on preliminary analyses carried out on a three-story building, the proposed optimization focuses on minimizing absolute accelerations. To evaluate the response in terms of control performance, in addition to the three-story structure, a six-story building has also been considered as a benchmark. For comparative purposes, analogous sequential optimization procedures have also been developed and applied to multiple Tuned Mass Damper (M-TMD) and multiple Tuned Liquid Column Damper (M-TLCD) systems. The proposed optimization framework has been initially assessed in the frequency domain by subjecting the two benchmark structures to a broadband noise excitation. Results demonstrate the M-STLCD’s ability to effectively target first vibration modes, consistently lowering response variances across all floors matching the performance of M-TMD and outperforming M-TLCD, which exhibits clear limitations in tuning to stiff structures. Subsequently, the effectiveness of the M-STLCD control strategy is further assessed in the time domain, considering both structures equipped with optimal device configurations subjected to a broadband noise excitation and a real seismic event. An increased mass configuration is also explored to evaluate performance under varying control mass conditions. Results confirm the M-STLCD’s control capabilities across these diverse inputs, achieving peak acceleration reductions of up to 47% under the broadband noise excitation and up to 39% under the recorded seismic event. Notably, the M-STLCD consistently exhibits performance comparable to M-TMD systems while offering additional advantages, such as reduced solid mass requirements and the potential use of available water resources for damping. Unlike M-TLCD systems, typically unsuitable for short-period structures, the M-STLCD effectively extends the applicability of liquid-based devices to stiff buildings characterized by shorter periods, thus presenting a robust, scalable, and promising solution for vibration mitigation in multi-story structures.
Data availability statement
The raw data supporting the conclusions of this article will be made available by the authors, without undue reservation.
Author contributions
CM: Methodology, Writing – review and editing, Writing – original draft, Supervision, Data curation, Conceptualization, Formal Analysis. SD: Writing – original draft, Investigation, Software. SR: Writing – review and editing. AP: Supervision, Writing – review and editing.
Funding
The author(s) declare that financial support was received for the research and/or publication of this article. Funded by the European Union - Next-Generation EU, Mission 4 Component 1 CUP B53D23006220006. The authors gratefully acknowledge financial support from the Italian Ministry of Education, University and Research (MIUR) under the P.R.I.N. 2022 National Grant ‘‘Innovative metamaterial components and absorbers for vibration mitigation (METAVIBRA)’’ (Project Code 2022LA43E2_001; University of Palermo Research Unit). AP gratefully acknowledges the support received from the project SiciliAn MicronanOTecH Research And Innovation CEnter’’SAMOTHRACE‘‘(MUR, PNRR-M4C2, ECS_00000022), spoke 3-Universita’ degli Studi di Palermo’’ S2-COMMs-Micro and Nanotechnologies for Smart and Sustainable Communities.
Conflict of interest
The authors declare that the research was conducted in the absence of any commercial or financial relationships that could be construed as a potential conflict of interest.
The author(s) declared that they were an editorial board member of Frontiers, at the time of submission. This had no impact on the peer review process and the final decision.
Generative AI statement
The author(s) declare that no Generative AI was used in the creation of this manuscript.
Any alternative text (alt text) provided alongside figures in this article has been generated by Frontiers with the support of artificial intelligence and reasonable efforts have been made to ensure accuracy, including review by the authors wherever possible. If you identify any issues, please contact us.
Publisher’s note
All claims expressed in this article are solely those of the authors and do not necessarily represent those of their affiliated organizations, or those of the publisher, the editors and the reviewers. Any product that may be evaluated in this article, or claim that may be made by its manufacturer, is not guaranteed or endorsed by the publisher.
References
Abé, M., and Fujino, Y. (1994). Dynamic characterization of multiple tuned mass dampers and some design formulas. Earthq. Eng. and Struct. Dyn. 23, 813–835. doi:10.1002/eqe.4290230802
Adam, C., Di Matteo, A., Furtmüller, T., and Pirrotta, A. (2017). Earthquake excited base-isolated structures protected by tuned liquid column dampers: design approach and experimental verification. Procedia Eng. 199, 1574–1579. doi:10.1016/j.proeng.2017.09.060
Almufti, S., Shaban, A., Ali, R., Jayson, F., and A. Dela Fuente, J. (2023). Overview of metaheuristic algorithms. Polaris Glob. J. Sch. Res. Trends 2, 10–32. doi:10.58429/pgjsrt.v2n2a144
American Society of Civil Engineers (2022). Minimum design loads and associated criteria for buildings and other structures (ASCE/SEI 7-22). Reston, VA: ASCE.
Aote, S., Raghuwanshi, M. M., and Malik, L. (2013). A brief review on particle swarm optimization: Limitations and future directions. Int. J. Comput. Sci. Eng. 14 (1), 196–200.
Argenziano, M., Faiella, D., Carotenuto, A. R., Mele, E., and Fraldi, M. (2022). Generalization of the den Hartog model and rule-of-thumb formulas for optimal tuned mass dampers. J. Sound Vib. 538, 117213. doi:10.1016/j.jsv.2022.117213
Ayorinde, E. O., and Warburton, G. B. (1980). Minimizing structural vibrations with absorbers. Earthq. Eng. and Struct. Dyn. 8, 219–236. doi:10.1002/eqe.4290080303
Bakre, S. V., and Jangid, R. S. (2004). Optimum multiple tuned mass dampers for base-excited damped main System. Int. J. Struct. Stab. Dyn. 04, 527–542. doi:10.1142/S0219455404001367
Balendra, T., Wang, C. M., and Cheong, H. F. (1995). Effectiveness of tuned liquid column dampers for vibration control of towers. Eng. Struct. 17, 668–675. doi:10.1016/0141-0296(95)00036-7
Basili, M., and Angelis, M. D. (2022). Experimental dynamic response of a multi-story frame structure equipped with non-conventional TMD implemented via inter-story isolation. Appl. Sci. 12 (18), 9153. doi:10.3390/app12189153
Bilello, C., Di Paola, M., and Pirrotta, A. (2002). Time delay induced effects on control of non-linear systems under random excitation. Meccanica 37, 207–220. doi:10.1023/A:1019659909466
Chen, G. (1996). “Multi-stage tuned mass dampers,” in Proceedings of the 11th world conference on earthquake engineering. Acapulco, Mexico, 1–8.
Chen, G., and Wu, J. (2001). Optimal placement of multiple tune mass dampers for seismic structures. J. Struct. Eng. 127, 1054–1062. doi:10.1061/(ASCE)0733-9445(2001)127:9(1054)
Chen, S. M., Sarosh, A., and Dong, Y. F. (2012). Simulated annealing based artificial bee colony algorithm for global numerical optimization. Appl. Math. Comput. 219 (8), 3575–3589. doi:10.1016/j.amc.2012.09.052
Clark, A. J. (1988). “Multiple passive tuned mass dampers for reducing earthquake induced building motion,” in Proceedings of the 9th world conference on earthquake engineering, 779–784.
Di Matteo, A., Di Paola, M., and Pirrotta, A. (2016). Innovative modeling of tuned liquid column damper controlled structures. Smart Struct. Syst. 18, 117–138. doi:10.12989/sss.2016.18.1.117
Di Matteo, A., Furtmüller, T., Adam, C., and Pirrotta, A. (2018). Optimal design of tuned liquid column dampers for seismic response control of base-isolated structures. Acta Mech. 229, 437–454. doi:10.1007/s00707-017-1980-7
Di Matteo, A., Masnata, C., and Pirrotta, A. (2019). Hybrid passive control strategies for reducing the displacements at the base of seismic isolated structures. Front. Built Environ. 5, 132. doi:10.3389/fbuil.2019.00132
Elias, S., Matsagar, V., and Datta, T. K. (2016). Effectiveness of distributed tuned mass dampers for multi-mode control of chimney under earthquakes. Eng. Struct. 124, 1–16. doi:10.1016/j.engstruct.2016.06.006
Elias, S., and Matsagar, V. (2017). Research developments in vibration control of structures using passive tuned mass dampers. Annu. Rev. Control 44, 129–156. doi:10.1016/j.arcontrol.2017.09.015
Elias, S., Matsagar, V., and Datta, T. K. (2019). Distributed tuned mass dampers for multi-mode control of benchmark building under seismic excitations. J. Earthq. Eng. 23, 1137–1172. doi:10.1080/13632469.2017.1351407
Fadel Miguel, L. F., Lopez, R. H., Miguel, L. F. F., and Torii, A. J. (2016). A novel approach to the optimum design of MTMDs under seismic excitations. Struct. Control Health Monit. 23, 1290–1313. doi:10.1002/stc.1845
Faiella, D., Argenziano, M., and Mele, E. (2022). Improving the seismic response of tall buildings: from diagrid to megastructures and mega-subcontrol systems. Open Constr. and Build. Technol. J. 16 (1), e187483682201030. doi:10.2174/18748368-v16-e2201030
Fei, Z., Jinting, W., Feng, J., and Liqiao, L. (2019). Control performance comparison between tuned liquid damper and tuned liquid column damper using real-time hybrid simulation. Earthq. Eng. Eng. Vib. 18, 695–701. doi:10.1007/s11803-019-0530-9
Furtmüller, T., Di Matteo, A., Adam, C., and Pirrotta, A. (2019). Base-isolated structure equipped with tuned liquid column damper: an experimental study. Mech. Syst. Signal Process. 116, 816–831. doi:10.1016/j.ymssp.2018.06.048
Gao, H., Kwok, K. C. S., and Samali, B. (1997). Optimization of tuned liquid column dampers. Eng. Struct. 19, 476–486. doi:10.1016/S0141-0296(96)00099-5
Gao, H., Kwok, K. S. C., and Samali, B. (1999). Characteristics of multiple tuned liquid column dampers in suppressing structural vibration. Eng. Struct. 21, 316–331. doi:10.1016/S0141-0296(97)00183-1
Ghosh, A., and Basu, B. (2004). Seismic vibration control of short period structures using the liquid column damper. Eng. Struct. 26, 1905–1913. doi:10.1016/j.engstruct.2004.07.001
Goldberg, D. E., and Holland, J. H. (1988). Genetic algorithms and machine learning. Mach. Learn. 3, 95–99. doi:10.1023/a:1022602019183
Hochrainer, M. J., and Ziegler, F. (2006). Control of tall building vibrations by sealed tuned liquid column dampers. Struct. Control Health Monit. 13, 980–1002. doi:10.1002/stc.90
Jangid, R. S. (1999). Optimum Multiple Tuned Mass Dampers for base-excited undamped system. Earthq. Eng. and Struct. Dyn. 28, 1041–1049. doi:10.1002/(SICI)1096-9845(199909)28:9<1041::AID-EQE853>3.0.CO;2-E
Joshi, A. S., and Jangid, R. S. (1997). Optimum parameters of multiple tuned mass dampers for base-excited damped systems. J. Sound Vib. 202, 657–667. doi:10.1006/jsvi.1996.0859
Joshi, A., Devi, S., Kumar, P., Sah, S. K., Lal, S., et al. (2019). Strong motion generation area modelling of the 2008 Iwate earthquake, Japan using modified semi-empirical technique. J. Earth Syst. Sci. 128, 202. doi:10.1007/s12040-019-1221-7
Kareem, A., and Kline, S. (1995). Performance of multiple mass dampers under random loading. J. Struct. Eng. 121, 348–361. doi:10.1061/(ASCE)0733-9445(1995)121:2(348)
Kim, S.-Y., and Lee, C.-H. (2018). Optimum design of linear multiple tuned mass dampers subjected to white-noise base acceleration considering practical configurations. Eng. Struct. 171, 516–528. doi:10.1016/j.engstruct.2018.06.002
Kim, D.-I., Min, K.-W., Park, J.-H., Lee, H.-R., Kim, J.-K., Hwang, K.-S., et al. (2012). Tunable tuned liquid column dampers with multi-cells for wind vibration control of tall buildings. Proc. SPIE 8345, 83452L–1. doi:10.1117/12.914452
Konar, T., and Ghosh, A. (2023). A review on various configurations of the passive tuned liquid damper. J. Vib. Control 29, 1945–1980. doi:10.1177/10775463221074077
Lewandowski, R., and Grzymisławska, J. (2009). Dynamic analysis of structures with multiple tuned mass dampers. J. Civ. Eng. Manag. 15, 77–86. doi:10.3846/1392-3730.2009.15.77-86
Li, C. (2000). Performance of multiple tuned mass dampers for attenuating undesirable oscillations of structures under the ground acceleration. Earthq. Eng. and Struct. Dyn. 29, 1405–1421. doi:10.1002/1096-9845(200009)29:9<1405::AID-EQE976>3.0.CO;2-4
Li, C. (2002). Optimum multiple tuned mass dampers for structures under the ground acceleration based on DDMF and ADMF. Earthq. Eng. and Struct. Dyn. 31, 897–919. doi:10.1002/eqe.128
Ma, H., Zhang, Y., Sun, S., Liu, T., and Shan, Y. (2023). A comprehensive survey on NSGA-II for multi-objective optimization and applications. Artif. Intell. Rev. 56 (12), 15217–15270. doi:10.1007/s10462-023-10526-z
Masnata, C., and Pirrotta, A. (2024). Optimal control of base-isolated systems with sliding TLCD under stochastic process. Eng. Struct. 318, 118754. doi:10.1016/j.engstruct.2024.118754
Masnata, C., Di Matteo, A., Adam, C., and Pirrotta, A. (2024a). Sliding TLCD for vibration control of base-isolation systems: experimental comparison with traditional TLCD and TMD. J. Phys. Conf. Ser. 2647, 172005. doi:10.1088/1742-6596/2647/17/172005
Masnata, C., Adam, C., and Pirrotta, A. (2024b). Optimal design of short-period structures equipped with sliding tuned liquid column damper and numerical and experimental control performance evaluation. Acta Mech. 235, 1603–1622. doi:10.1007/s00707-023-03832-8
Min, K.-W., Kim, H.-S., Lee, S.-H., Kim, H., and Kyung Ahn, S. (2005). Performance evaluation of tuned liquid column dampers for response control of a 76-story benchmark building. Eng. Struct. 27, 1101–1112. doi:10.1016/j.engstruct.2005.02.008
Mohebbi, M., Shakeri, K., Ghanbarpour, Y., and Majzoub, H. (2013). Designing optimal multiple tuned mass dampers using genetic algorithms (GAs) for mitigating the seismic response of structures. J. Vib. Control 19, 605–625. doi:10.1177/1077546311434520
Mohebbi, M., Dabbagh, H. R., and Shakeri, K. (2015). Optimal design of multiple tuned liquid column dampers for seismic vibration control of MDOF structures. Period. Polytech. Civ. Eng. 59, 543–558. doi:10.3311/PPci.7645
Ocak, A., Bekdaş, G., Nigdeli, S. M., Kim, S., and Geem, Z. W. (2022). Optimization of tuned liquid damper including different liquids for lateral displacement control of single and multi-story structures. Buildings 12, 377. doi:10.3390/buildings12030377
Pandey, D. K., Sharma, M. K., and Mishra, S. K. (2019). A compliant tuned liquid damper for controlling seismic vibration of short period structures. Mech. Syst. Signal Process. 132, 405–428. doi:10.1016/j.ymssp.2019.07.002
Park, J., and Reed, D. (2001). Analysis of uniformly and linearly distributed mass dampers under harmonic and earthquake excitation. Eng. Struct. 23, 802–814. doi:10.1016/S0141-0296(00)00095-X
Perez, R. E., and Behdinan, K. (2007). Particle swarm approach for structural design optimization. Comput. Struct. 85 (19), 1579–1588. doi:10.1016/j.compstruc.2006.10.013
Randall, S. E., Halsted, D. M., and Taylor, D. L. (1981). Optimum vibration absorbers for Linear damped systems. J. Mech. Des. 103, 908–913. doi:10.1115/1.3255005
Roozbahan, M., Masnata, C., Turan, G., and Pirrotta, A. (2025). Efficiency evaluation of optimal TLCD and TMD for the seismic response reduction of buildings considering soil-structure interaction effect. Meccanica. doi:10.1007/s11012-025-01981-9
Sadek, F., Mohraz, B., and Lew, H. S. (1998). Single- and multiple-tuned liquid column dampers for seismic applications. Earthq. Eng. and Struct. Dyn. 27, 439–463. doi:10.1002/(SICI)1096-9845(199805)27:5<439::AID-EQE730>3.0.CO;2-8
Sakai, F., Takeda, S., and Tamaki, T. (1989). “Tuned liquid column damper—new type device for suppression of building vibrations,” in Proceedings of the international conference on highrise buildings. Nanjing, China, 926–931.
Shetty, K. K., Krishnamoorthy, A., and Nayak, G.Dhanalakshmi (2017). The effect of multiple tuned mass dampers on response control of base isolated multi-storey space frame structure. Int. J. Struct. Eng. 8, 148–168. doi:10.1504/IJSTRUCTE.2017.084650
Shum, K. M., and Xu, Y. L. (2002). Multiple-tuned liquid column dampers for torsional vibration control of structures: experimental investigation. Earthq. Eng. and Struct. Dyn. 31, 977–991. doi:10.1002/eqe.133
Suresh, L., and Mini, K. M. (2019). Effect of multiple tuned mass dampers for vibration control in high-rise buildings. Pract. Periodical Struct. Des. Constr. 24, 04019031. doi:10.1061/(ASCE)SC.1943-5576.0000453
Vellar, L. S., Ontiveros-Pérez, S. P., Miguel, L. F. F., and Fadel Miguel, L. F. (2019). Robust Optimum design of multiple tuned mass dampers for vibration control in buildings subjected to seismic excitation. Shock Vib. 2019, 9273714. doi:10.1155/2019/9273714
Vié, A. (2020). Qualities, challenges and future of genetic algorithms: a literature review. arXiv Neural Evol. Comput. Available online at: http://export.arxiv.org/pdf/2011.05277.
Wang, Q., Tiwari, N. D., Qiao, H., and Wang, Q. (2020). Inerter-based tuned liquid column damper for seismic vibration control of a single-degree-of freedom structure. Int. J. Mech. Sci. 184, 105840. doi:10.1016/j.ijmecsci.2020.105840
Warburton, G. B. (1982). Optimum absorber parameters for various combinations of response and excitation parameters. Earthq. Eng. and Struct. Dyn. 10, 381–401. doi:10.1002/eqe.4290100304
Wei, X., and Zhao, X. (2020). Vibration suppression of a floating hydrostatic wind turbine model using bidirectional tuned liquid column mass damper: vibration suppression of a floating HWT using BTLCMD. Wind Energy 23, 1887–1904. doi:10.1002/we.2524
Wu, J.-C., Shih, M.-H., Lin, Y.-Y., and Shen, Y.-C. (2005). Design guidelines for tuned liquid column damper for structures responding to wind. Eng. Struct. 27 (13), 1893–1905. doi:10.1016/j.engstruct.2005.05.009
Xu, K., and Igusa, T. (1992). Dynamic characteristics of multiple substructures with closely spaced frequencies. Earthq. Eng. and Struct. Dyn. 21, 1059–1070. doi:10.1002/eqe.4290211203
Xu, Y. L., and Shum, K. M. (2003). Multiple-tuned liquid column dampers for torsional vibration control of structures: theoretical investigation. Earthq. Eng. and Struct. Dyn. 32, 309–328. doi:10.1002/eqe.227
Yamaguchi, H., and Harnpornchai, N. (1993). Fundamental characteristics of Multiple Tuned Mass Dampers for suppressing harmonically forced oscillations. Earthq. Eng. and Struct. Dyn. 22, 51–62. doi:10.1002/eqe.4290220105
Zakian, P., and Bakhshpoori, T. (2024). Optimal design of multiple tuned mass dampers for controlling the earthquake response of randomly excited structures. Acta Mech. 235, 511–532. doi:10.1007/s00707-023-03749-2
Zhang, X., Han, Q., Bi, K., and Du, X. (2022). An improved multi-mode seismic vibration control method using multiple tuned mass dampers. Adv. Struct. Eng. 25, 804–819. doi:10.1177/13694332211050977
Zhu, F., Wang, J.-T., Jin, F., and Lu, L.-Q. (2017). Real-time hybrid simulation of full-scale tuned liquid column dampers to control multi-order modal responses of structures. Eng. Struct. 138, 74–90. doi:10.1016/j.engstruct.2017.02.004
Keywords: sequential optimization algorithm, passive control device, liquid-based absorbers, STLCD, multi-modal control, optimal design
Citation: Masnata C, Di Trapani SD, Russotto S and Pirrotta A (2025) Optimal placement and design of M-STLCDs in n-story buildings: a comparative study with M-TMDs and M-TLCDs. Front. Built Environ. 11:1652972. doi: 10.3389/fbuil.2025.1652972
Received: 24 June 2025; Accepted: 29 August 2025;
Published: 25 September 2025.
Edited by:
Maria I. Todorovska, University of Southern California, United StatesReviewed by:
Subrata Chakraborty, Indian Institute of Engineering Science and Technology, Shibpur, IndiaMuhammet Burhan Navdar, Sakarya University, Türkiye
Copyright © 2025 Masnata, Di Trapani, Russotto and Pirrotta. This is an open-access article distributed under the terms of the Creative Commons Attribution License (CC BY). The use, distribution or reproduction in other forums is permitted, provided the original author(s) and the copyright owner(s) are credited and that the original publication in this journal is cited, in accordance with accepted academic practice. No use, distribution or reproduction is permitted which does not comply with these terms.
*Correspondence: Chiara Masnata, Y2hpYXJhLm1hc25hdGFAdW5pcGEuaXQ=