 Zhi-Yong Zhou1
 Qing-Yi Mu
- 1Engineer, Shandong Electric Power Engineering Consulting Institute Co., Ltd., Jinan, China
- 2Engineer, State Grid Corporation of China, Extra High Voltage Construction Branch, Beijing, China
- 3Engineer, China JIKAN Research Institute of Engineering Investigations and Design, Co., Ltd., Xi’an, China
- 4College of Geological Engineering and Geomatics, Chang’an University, Xi’an, China
Soil water content and dry density are critical parameters for assessing loess collapsibility and other geotechnical applications. However, existing time-domain reflectometry (TDR) calibration methods are often constrained by soil-specific limitations. This study aimed to develop soil type-independent calibration relationships for TDR measurements of soil water content and dry density. Laboratory experiments were conducted on four distinct soil types to calibrate and validate the existing TDR models. The results indicated that the current models exhibited suboptimal performance, necessitating parameter calibration for specific soil types. To enhance the accuracy and applicability of TDR measurements, the multi-expression programming (MEP) algorithm was employed to develop a soil type-independent calibration relationship for dry density. The MEP model demonstrated robust performance in both training and validation phases, achieving a slope of 0.925 and an R2 value of 0.88 for the training dataset, with most validation data points falling within a ±10% relative error range. Additionally, a soil type-independent calibration relationship for water content was established based on the dry density model, achieving high accuracy, with most predicted values exhibiting absolute errors within ±0.04. The developed calibration relationships were further validated using 64 datasets from the literature, covering various soil types, and through two field in situ tests. The validation results demonstrated that the developed model could accurately determine dry density, with relative errors of less than ±10% for most test points. Water content measurements also showed strong agreement with laboratory oven-drying results, with absolute errors within ±0.02 for the majority of test points. This work provides a reference for applying TDR to rapid in situ measurement of soil water content and dry density, which is of significant importance for evaluating loess collapsibility and other geotechnical applications.
1 Introduction
Loess is distributed worldwide, particularly in northwestern China, where it covers an area of 640,000 km2 (Li, 2018; Jia et al., 2020; Ji et al., 2021). It is well-known that many geotechnical problems, such as ground subsidence (Rogers et al., 1994; Muñoz-Castelblanco et al., 2011; Zhang et al., 2022) and slope failure (Peng et al., 2018; Wang et al., 2018), occur in loess areas due to wetting-induced collapse. Therefore, evaluating the collapsibility of loess prior to construction is essential. However, the unique structure of loess inevitably becomes disturbed during field sampling and subsequent laboratory testing, which compromises the accuracy of the collapsibility assessments (Atkinson et al., 1992; Mu Q. et al., 2020; Wu et al., 2025). Furthermore, evaluating large-scale or deep loess sites requires extensive drilling and the collection of numerous samples for laboratory analysis, which makes it expensive. In the laboratory experiments, conventional compression tests at constant water content require 24 h of equilibrium at each loading increment, whereas suction-controlled compression tests of unsaturated soil need several days (Ng and Pang, 2000; Mu et al., 2020a; Mu et al., 2023 Q.; 2023c), rendering the evaluation of numerous samples extremely time-consuming. Given these limitations of the existing methods, there is an urgent need to develop novel techniques for the in situ evaluation of loess collapsibility.
Implementing in situ collapsibility evaluation for loess involves establishing an evaluation model that comprehensively considers the main influencing factors and conducting in situ testing to obtain the model parameters. Regarding the evaluation models, Holtz and Hillf (1961) proposed a model based on the void ratio at the liquid limit state and the natural void ratio, successfully evaluating the collapse in various unsaturated soil types. Based on Holtz and Hillf (1961), Gibbs and Bara (1962) utilized the dry density at the liquid limit state and the liquid limit to define a collapse criterion line, effectively assessing collapsibility in loess from a US canal and channel site. Basma and Member (1992) investigated the effects of physical properties, such as dry density, water content, and overburden load, on wetting-induced collapse and subsequently developed an empirical model using multiple regression analysis. Lim and Miller (2004) proposed a new empirical model based on the study by Basma and Member (1992), which was found to have good predictive performance in in situ tests. Wang L. et al. (2020) established an exponential equation to simulate the one-dimensional compression behavior of loess under different moisture conditions. Mu et al. (2023b) developed a new and simple method for predicting loading- and wetting-induced collapse of intact loess within an elastoplastic framework. In conclusion, the current models are mainly related to soil dry density and water content, which are consistent with the results of a large number of geotechnical tests based on the theory of unsaturated soil mechanics (Ng et al., 2024). Consequently, the precise and expeditious measurement of soil water content and dry density is imperative for evaluating the collapse susceptibility of in situ sites.
Time-domain reflectometry (TDR) is a geophysical technique widely utilized in geological exploration and soil analysis, enabling the measurement of soil apparent permittivity and electrical conductivities. Since its initial application for measuring water content by Topp et al. (1980), TDR has been extensively studied and applied within the field of geotechnical engineering (Lin et al., 2006; Zhang et al., 2017; Mu et al., 2019; 2020b; 2023b; Bittelli et al., 2021). For instance, Siddiqui et al. (2000) proposed a two-step method to establish a correlation between the apparent dielectric constant and soil parameters such as dry density and water content. This method requires separate testing of the two soil samples on-site, which may introduce errors due to inconsistencies in the state of the two soil samples. Yu and Drnevich (2004) further enhanced the two-step method by incorporating soil electrical conductivity, developing a relationship between water content and conductivity, and introducing a correction equation to account for differences in water conductivity between in situ and laboratory conditions. Jung et al. (2013) introduced a new TDR measurement parameter,
In Northwest China, the wide variety of soil types (e.g., sandy, silty, and clayey loess) exhibits substantial differences in physical properties. Consequently, it is challenging to use a single set of TDR parameters for rapid in situ measurement of dry density and water content across different types of soil. The objectives of this study are to (1) prepare and test four distinct types of soil at different gravimetric water contents and dry densities in the laboratory to calibrate and validate the existing TDR theoretical models; (2) employ machine learning to develop a soil type-independent calibration relationship for water content and dry density; and (3) validate the applicability of the proposed model using two field in situ tests. This study innovatively develops a soil type-independent calibration relationship based on the multi-expression programming (MEP) algorithm, eliminating the need for soil-specific calibration parameters. This advancement significantly enhances the applicability of TDR technology for rapid in situ measurements across diverse soil types, thereby providing a more efficient and accurate method for assessing soil properties in geotechnical applications.
2 Existing calibration relationship for measuring
The one-step TDR method provides a procedure for the in situ measurement of soil water content (
where
The calibration parameters
Equation 5 also contains three calibration parameters (
In summary, the existing calibration relationships exhibit a reasonable capacity for predicting soil dry density and water content. However, in practical applications, the soil physical properties can vary significantly, which, in turn, may influence their electrical properties. As demonstrated by Jung et al. (2013), the parameters
3 Test apparatus and TDR waveform processing
As illustrated in Figure 1, the Campbell Scientific TDR200, in conjunction with a three-rod TDR probe, was used to measure the reflection waveforms of soil specimens. The TDR200 was connected to an electric source with a constant voltage of 12 V for the power supply. The three-rod TDR probe consists of three stainless steel rods with a diameter of 6 mm and a length of 150 mm. The distance between two neighboring rods (center to center) is 30 mm. Based on the numerical method proposed by Zhan et al. (2014), Zhan et al. (2015), the sampling area of the three-rod TDR probe is approximately characterized as an ellipse with a major axis of 36.6 mm and a minor axis of 18.3 mm. Furthermore, the blue area in the figure indicates 90% measurement sensitivity, corresponding to an ellipse with a short semi-axis of 18.3 mm and a long semi-axis of 36.6 mm, with an area of approximately 2,141 mm2. This area is larger than the representative unit of the soil under test. A coaxial cable with an impedance of 50 Ω was used to connect the three-rod TDR probe to the TDR200. In addition, a plastic cylinder with a diameter of 150 mm and a height of 200 mm was used to house the soil specimen, where the three-rod probe is inserted. Based on the numerical calculation result, the volume of the plastic cylinder is sufficient to cover the sampling area of the three-rod probe.
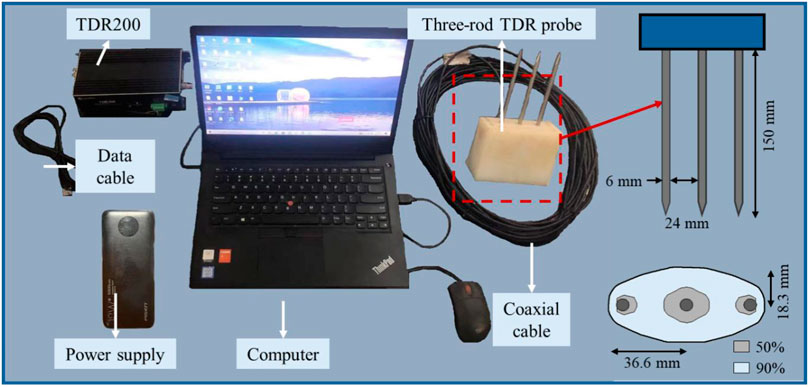
Figure 1. Illustration of the TDR in situ measurement.
During measurement, the TDR200 sends a step voltage pulse (i.e., 1 V) that travels along the coaxial cable and the three-rod TDR probe. The reflections of the step voltage pulse occur at the sections of impedance mismatch and are recorded by the TDR200. A typical TDR waveform is illustrated in Figure 2. The points A and B in the TDR waveform are associated with the first reflections of the step voltage pulse at the surface of the soil specimen and at the end of the three-rod TDR probe, respectively. The TDR waveform beyond point B represents the subsequent multiple reflections of the step voltage pulse in the three-rod TDR probe. Based on previous studies, apparent permittivity (
where
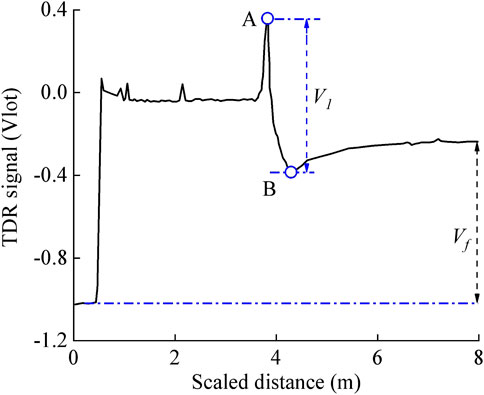
Figure 2. Illustration of a typical TDR waveform.
4 Test material and specimen preparation
4.1 Test material
To develop the soil type-independent relationship, four soil types (i.e., Fujian standard sand, Qiantang River silt, clayey loess, and kaolin clay) are used for TDR measurements. The particle size distribution curves and physical properties of the tested soil samples are shown in Figure 3 and Table 1, respectively. The chosen soil types represent a broad range of particle size distributions and index properties present in engineering practices. The four selected soil types have a clay content ranging from 0 to 48.2%, a silt content ranging from 2.8% to 84.2%, and a sand content ranging from 0 to 97.2%. On the other hand, the plastic limits and liquid limits range from 17.4% to 35.5% and from 31.8% to 70.3%, respectively. According to ASTM D2487-11 (2011), the Fujian standard sand, Qiantang River silt, clayey loess, and kaolin clay are classified as SP, ML, CL, and CH, respectively. More details regarding the physical properties of the tested soil types are provided in previous studies (Mu Q. et al., 2023; Mu Q. et al., 2023c).
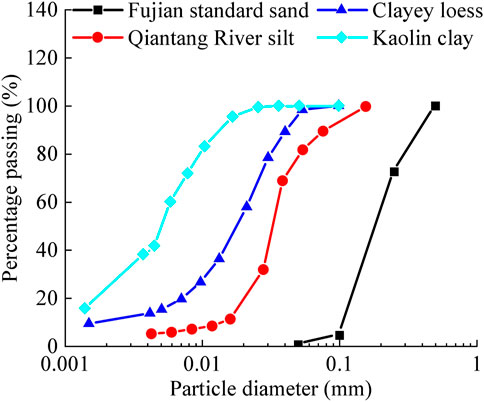
Figure 3. Particle size distributions of the tested soil types.
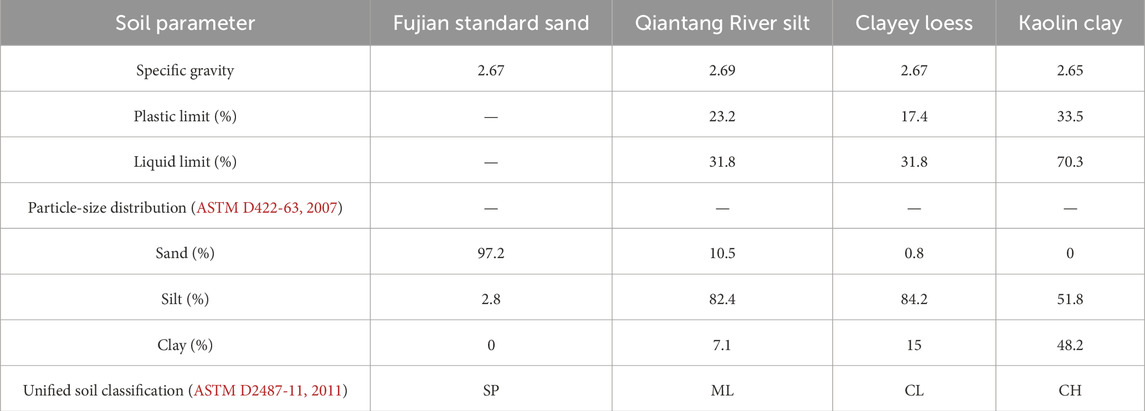
Table 1. Physical properties of the tested soil types.
4.2 Specimen preparation
The soil samples are first oven-dried and mixed with water to generate various moisture contents using a plant mister. The prepared wet soils are wrapped in cling film and allowed to equilibrate for 48 h. After moisture equalization, the soil samples are compacted into plastic cylinders with a diameter of 100 mm and a height of 150 mm. The compaction of each specimen was divided into five layers (i.e., 30 mm height for each layer). The top surface of each layer was scarified before the compaction of the subsequent layer to ensure better contact. After compaction, the specimen was left for 24 h to allow the equilibration of pore water across the specimen prior to the TDR measurement. For Fujian standard sand, the compaction dry densities ranged from 1.50 g/cm3 to 1.65 g/cm3 in steps of 0.5 g/cm3. The compaction dry densities of Qiantang River silt and clayey loess ranged from 1.30 g/cm3 to 1.60 g/cm3, while the kaolin clay had dry densities ranging from 0.80 g/cm3 to 1.10 g/cm3, both in steps of 0.1 g/cm3. The soil specimens prepared above were uniformly divided into two groups; group I was used for calibration and training of the machine learning model, and group II was used for validation of both the existing model and the developed machine learning model.
Note that the compaction of the soil samples with high water contents is unrealistic to achieve the predefined dry densities mentioned above. To prepare the specimens with high water contents, the relatively dry soil samples were first compacted into plastic cylinders to the predefined dry densities. With the known water content, the volume of the plastic cylinder, and the dry density, the required amount of water was calculated and sprayed into the plastic cylinder to achieve the predefined high water contents. Similar to the specimens with low water contents, the prepared specimens with high water contents were also left for pore water equilibration. Based on the targeted water contents, the specimens with high water contents need 3–10 days for pore water equilibration. To check the uniformity of the prepared specimens, three sub-specimens from the top, middle, and bottom parts of the prepared specimens were collected. The results show that the differences in dry density and water content are less than ±0.07 g/cm3 and ±0.1%, respectively. More details of the soil physical properties of the prepared specimens are provided in Table 2.

Table 2. Properties of the soil types used for TDR calibration and validation in this study.
5 Calibration and calculation of the existing models
In this research, the calibration relationships proposed by Jung et al. (2013) and Curioni et al. (2018) were utilized to assess the dry density and water content of soil, respectively. The calibration of Equation 1 involves two soil constants, which are denoted as a and b. The measured parameters, including water content, dry density, and apparent permittivity, were represented in the
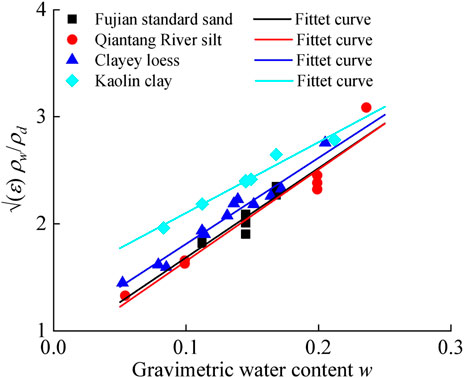
Figure 4. Calibration results of Equation 1 related to water content from laboratory experiments.

Table 3. Summary of the calibration coefficients.
The calibration of Equation 4, as proposed by Jung et al. (2013), incorporates the three soil parameters
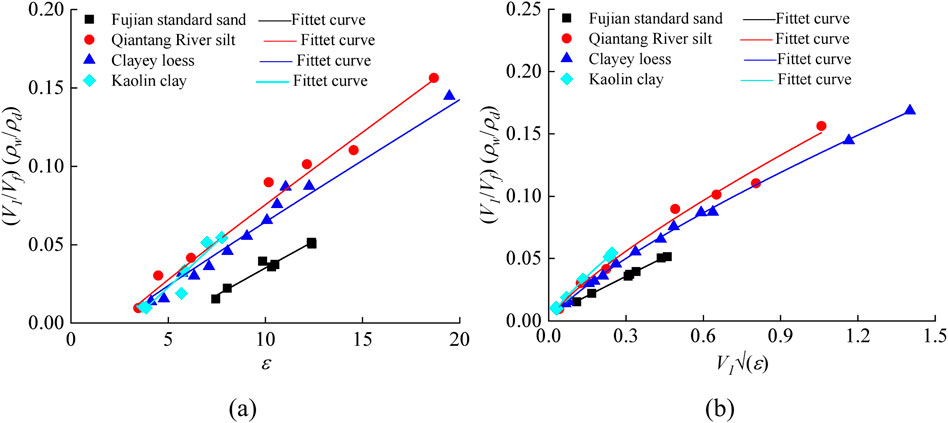
Figure 5. Calibration results related to dry density in the models of (a) Jung et al. (2013) and (b) Curioni et al. (2018).
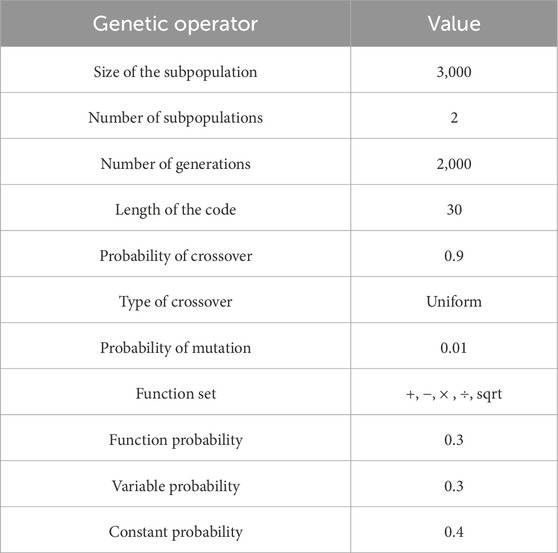
Table 4. Optimized MEP parameters.
Additionally, the calibration of Equation 5 for dry density, as proposed by Curioni et al. (2018), also includes three parameters (
Once the parameters
Once
Figure 6a presents the performance of the models proposed by Jung et al. (2013) in measuring the soil dry density. The results reveal that the dry densities computed using the model proposed by Jung et al. (2013) exhibit suboptimal performance compared to the direct measurements derived from the oven-drying method (ASTM D2216, 2010), with a relative error exceeding ±20% for 14 out of 33 test points, particularly in the case of kaolin clay. This deviation can be attributed to the model’s inability to account for the interference effects of the multiplexer, which distort the test waveforms and consequently affect the precise calculation of electrical properties such as
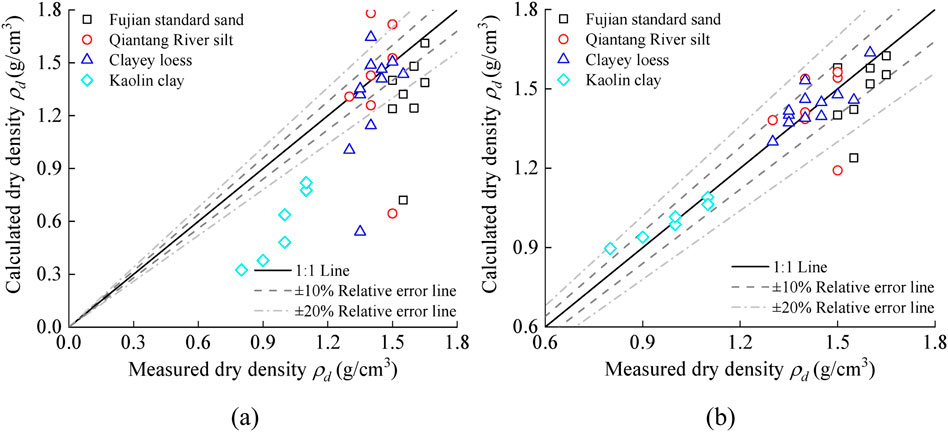
Figure 6. Performance in measuring soil dry density using the models proposed by (a) Jung et al. (2013) and (b) Curioni et al. (2018).
The gravimetric water content of the soil was assessed using Equation 9 combined with the calculated dry densities from Equation 7, as illustrated in Figure 7a. It was found that the gravimetric water content derived from the model proposed by Jung et al. (2013) demonstrated limited agreement with the results obtained from the oven-drying method, exhibiting an absolute error greater than ±0.04 at 15 out of the 33 test points. This may be attributed to the requirement of integrating the calculated dry density from Equation 7 into Equation 9 during the calculation of gravimetric water content, which consequently propagates errors from the dry density estimation into the outcomes of gravimetric water content. Figure 7b illustrates a comparison between the gravimetric water content calculated from the model proposed by Curioni et al. (2018) and the results obtained from the oven-drying method. As shown in Figure 7b, with the exception of a few points, most data points fall within an absolute error of ±0.04 relative to the results obtained by the drying method. This observation is attributed to the improved accuracy of the dry density calculated using the model proposed by Curioni et al. (2018) (Equation 8). It emphasizes that the application of Equation 9 facilitates a more accurate prediction of gravimetric water content when underpinned by more reliable dry density estimation. Therefore, in the forthcoming development of soil type-independent calibration relationships, the primary emphasis will be on refining the model of dry density while maintaining the existing model of gravimetric water content.
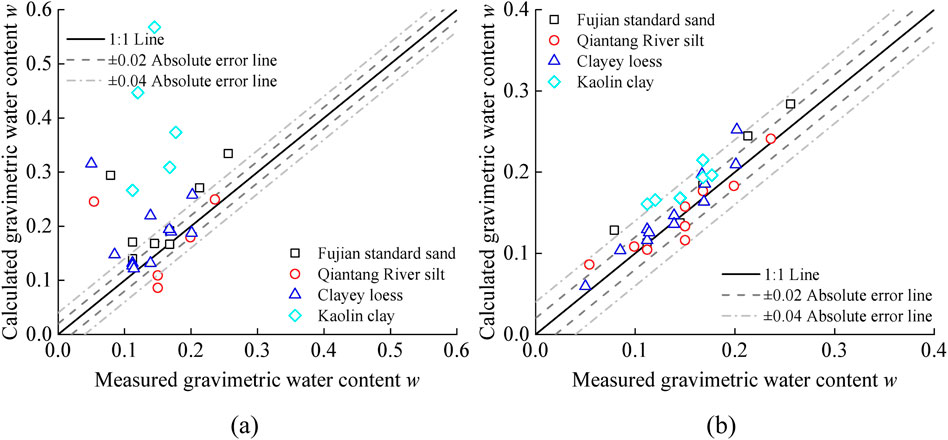
Figure 7. Performance in measuring soil water content using the models proposed by (a) Jung et al. (2013) and (b) Curioni et al. (2018).
6 Soil type-independent calibration relationships and their verifications
Machine learning methods have an advantage in solving nonlinear mathematical problems with multiple variables and data sources (Yin et al., 2017; Zhang et al., 2021; Qin et al., 2023; Onyelowe et al., 2024; Velastegui et al., 2024; Vatin et al., 2025). MEP, a type of genetic algorithm inspired by genetics and natural selection principles, is a computational technique used for symbolic regression and modeling purposes, and it can generate explicit mathematical expressions (Oltean and Groşan, 2003; Severcan, 2012; Jesswein and Liu, 2022; Rehman et al., 2022). MEP has been effectively applied in diverse fields such as predicting the compressive and tensile strength of concrete (Asif et al., 2024), a shallow foundation’s ultimate bearing capacity (Zhang and Xue, 2022), air entry value (Wang H.-L. et al., 2020), soil compaction parameters (Wang and Yin, 2020), and the collapse susceptibility of loess (Mu et al., 2024). Consequently, this study proposes using MEP to establish a calibration relationship for dry density, given the complex nonlinear relationship between dry density and electrical properties within different soil types.
A dataset comprising 67 data points was constructed based on the physical and electrical properties of four soil types measured by TDR tests and laboratory experiments, as detailed in Section 4. The properties include the first voltage drop (
This study employed the MEP algorithm as shown in Figure 8. The method randomly creates an initial population using the replacement sampling method from the training database. After that, two parents are selected from the initial population using a fitness-based binary tournament, and two offspring are generated from the selected parents through crossover and mutation. Following that, the worst individual is replaced with the superior one identified in the existing population. Finally, the above steps are repeated until the target number of generations is reached (Wang and Yin, 2020; Wang H.-L. et al., 2020; Asif et al., 2024).
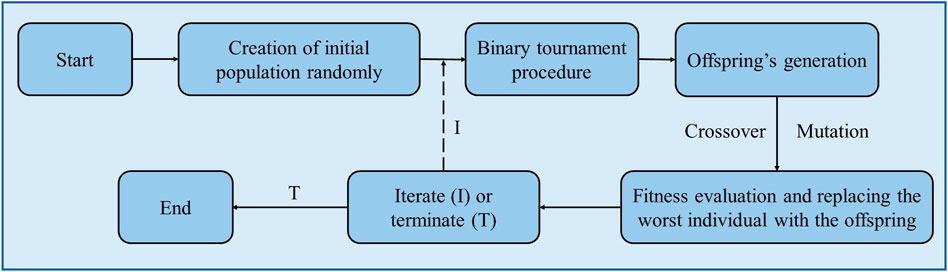
Figure 8. Illustration of the computational flow chart of MEP.
The effectiveness of establishing a calibration relationship for dry density using the MEP model largely depends on parameter selection and adjustment (Farooq et al., 2021). Initially, the model was trained on the training dataset and was subsequently evaluated on the testing dataset. Parameters were iteratively adjusted to enhance the model’s performance, enabling it to produce results closer to the optimal solution. The process continued until the established fitness function (e.g.,
This study used MEPX software to develop a closed-form mathematical formula for a soil type-independent calibration relationship for dry density, as shown in Equation 10. The parameter settings and basic arithmetic operators are listed in Table 4, and symbols are defined as before.
Figure 9a presents the comparison of the measured and predicted values of the MEP model for dry densities of various soil types during the training phase. It is widely accepted in the literature that an efficient model should exhibit R2 and slope values exceeding 0.8 (Khan et al., 2023). In this study, the MEP model demonstrated a slope of 0.925 and an R2 of 0.88 for the training data, indicating a robust correlation between the predicted and actual values. The data points were found to closely align with the 45-degree lines (1:1), with the majority exhibiting relative errors within ±10%, which is a strong indicator of effective model training (Khan et al., 2021; Nazar et al., 2022). Figure 9b illustrates the model validation of the developed MEP model across different soil types. The findings reveal a close alignment between the predicted and measured values, with most of the 33 validation data points falling within a ±10% relative error, which confirms the performance of the developed soil type-independent calibration relationship for dry density. Overall, the MEP model demonstrated strong performance in both the training and validation phases, showing great potential as a reliable tool for predicting dry density across various soil types.
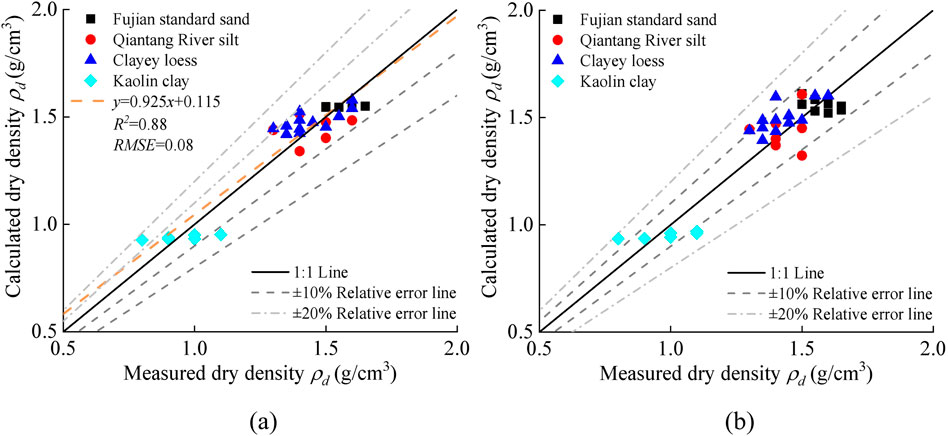
Figure 9. Soil type-independent calibration relationship for dry density based on MEP: (a) model development and (b) model validation.
As discussed in Section 5, the calibration relationship for water content as depicted in Equation 1 could present a good performance when underpinned by more reliable dry density estimation. Thus, a soil type-independent calibration relationship for water content was established using Equation 1. As shown in Figure 10a, the calibration parameters for the four soil types were consistent. The calibrated a and b values from Equation 1 were 1.01 and 7.99, respectively, with an R2 exceeding 0.88, indicating a good fit. Then, the soil type-independent calibration relationship for water content was developed as follows:
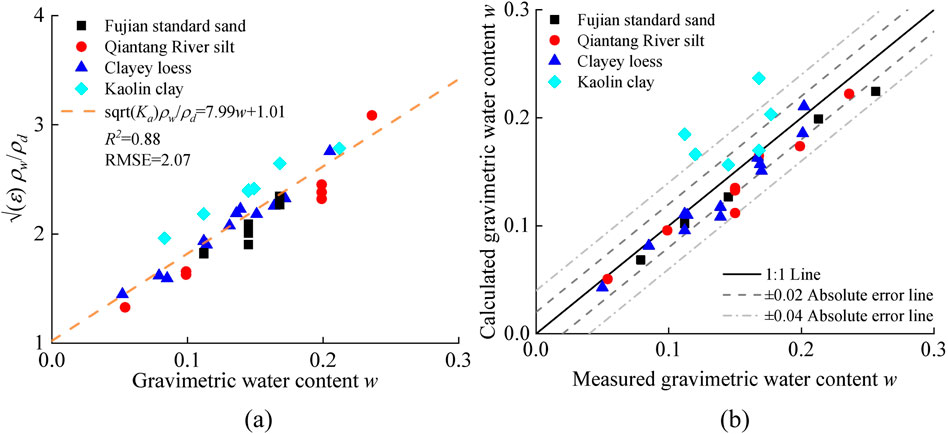
Figure 10. Soil type-independent calibration relationship for gravimetric water content based on Equation 1: (a) parameter calibration and (b) model validation.
The water content of different soil types was calculated based on the measured electrical properties and Equation 11. Figure 10b shows a comparison of the predicted and measured water content. It reveals that only three of the 33 predicted data points had absolute errors exceeding ±0.04, which highlights the accuracy of the soil type-independent calibration relationship for water content.
Additionally, 64 sets of data from the literature, covering various soil types (CL, CI, CH, MH, SW, and GW), were collected to validate the developed soil type-independent calibration relationships for dry density and water content. Figure 11a shows the comparison between the dry densities calculated from Equation 10 and those obtained from the literature, showing that most data points had relative errors within ±20% of the measured values. This demonstrates the applicability of the calibration relationship for dry density across different soil types. Figure 11b presents a comparison of the results calculated from Equation 11 and measured water content. It shows the high accuracy of Equation 11, with most data points having calculation errors within ±0.04 compared to the measured values. This indicates the good performance of the soil type-independent calibration relationship for water content across different soil types. In summary, the calibration relationships developed using the MEP model can rapidly determine water content and dry density for different soil types through TDR measurements and physical properties, without the need for parameter calibration for a specific soil type. This work provides a reference to assist ASTM D6780/D6780M − 19 (2019) in predicting soil properties.
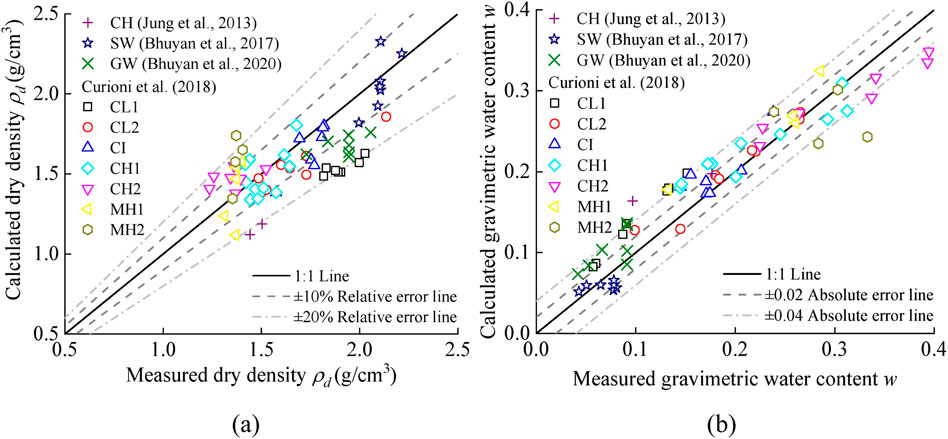
Figure 11. Validation of the developed soil type-independent calibration relationships with the data from the literature: (a) dry densiyt; (b) gravimetric water content.
7 Verification of the new model using in situ measurements
To further verify the practical applicability of the developed soil type-independent calibration relationships, this study preformed two in situ TDR tests. Specifically, the TDR test sites were situated in Xi’an and Jingyang, Shaanxi Province, as illustrated in Figure 12a. Notably, at the site in Jingyang, 16 in situ TDR test points and corresponding laboratory oven-drying tests were conducted on loess specimens from varying depths within an exploratory well profile (Figure 12b). The oven-drying results revealed that the dry density of the Jingyang loess in the exploratory well profile ranged from 1.34 g/cm3 to 1.43 g/cm3, while the gravimetric water content fluctuated within the range of 14.6%–23.8%. Notably, the detailed physical properties of the tested Jingyang loess are same as that of the clayey loess, as mentioned in Table 2. Additionally, a total of 32 TDR in situ and laboratory oven-drying tests were carried out at a site in Xi’an, Shaanxi Province (Figure 12c), including two soil types, Xi’an loess and Xi’an sand. The laboratory tests show that the dry densities of the loess specimens range from 1.51 g/cm3 to 1.78 g/cm3, with gravimetric water content spanning from 14.0% to 19.7%. Following the ASTM D4318-17 (2010), the liquid limit and plastic limit of Xi’an loess were determined to be 31.1% and 18.8%, respectively. Furthermore, the particle size distribution of Xi’an loess was 43.7% sand, 31.5% silt, and 24.8% clay. In contrast, the dry densities of the Xi’an sand were observed to vary between 1.38 g/cm3 and 1.58 g/cm3. Additionally, the natural water content of the Xi’an sand was found to be less than 10%, which is attributed to a sand content of 94.6%. More details of the physical and electrical properties of the in situ tested soil types are summarized in Table 5.

Figure 12. Overview of the in situ test site: (a) testing site; (b) schematic diagram of the in situ test point in Jingyang; (c) in situ test in Xi’an.
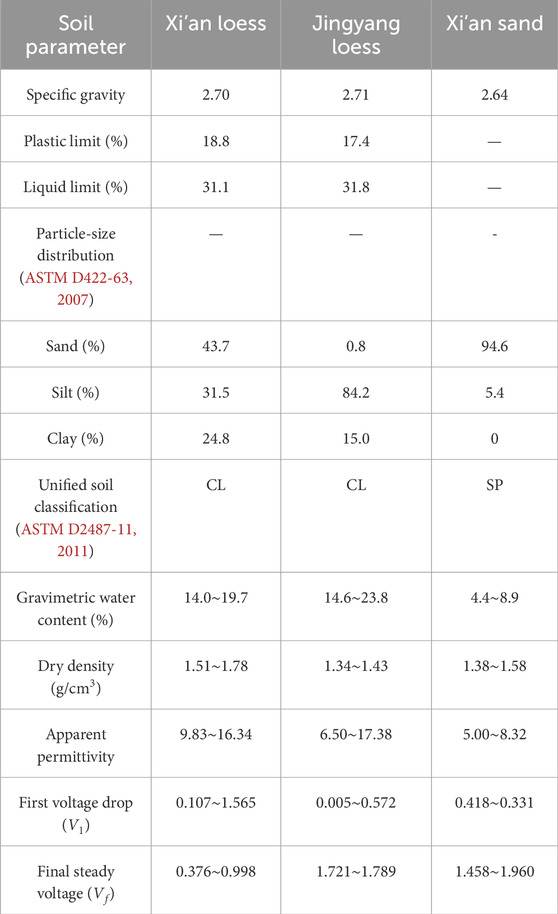
Table 5. Physical and electrical properties of the in situ tested soil types.
The dry densities derived from Equation 10 and those obtained using the oven-drying method are depicted in Figure 13a. It is observed that the developed model for calculating dry density demonstrates a better performance. At both testing sites, the relative error compared to that of the oven-drying results was less than ±10% for the majority of the 48 test points, indicating the feasibility of soil type-independent calibration relationships for dry density in in situ testing. Figure 13b presents the comparison results between in situ TDR testing and the laboratory oven-drying method for soil gravimetric water content. As illustrated in the figure, the gravimetric water content calculated using Equation 11 in this study exhibits strong agreement with the results obtained from the oven-drying method. A total of 41 out of 48 test points have absolute errors within ±0.02, indicating that the soil type-independent calibration relationship for water content calculated by Equation 11 has applicability in field testing.
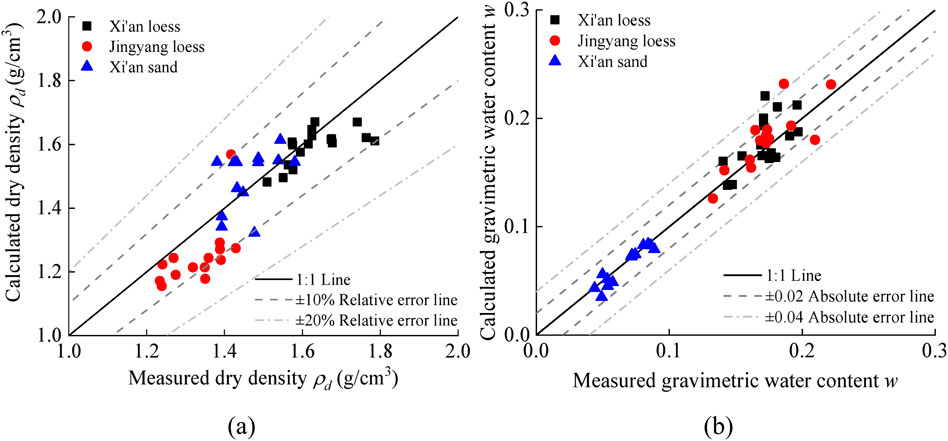
Figure 13. Performance for the developed soil type-independent calibration relationships of (a) dry density and (b) gravimetric water content.
8 Conclusion
Accurate assessment of soil water content and dry density is crucial for evaluating the collapsibility of loess and other geotechnical applications. However, existing TDR calibration methods are constrained by soil-specific limitations. This study successfully developed soil type-independent calibration relationships for TDR measurements of soil water content and dry density. The following conclusions are drawn:
1. Laboratory experiments were conducted on four distinct soil types to calibrate and validate the existing TDR models. Curioni’s model demonstrated superior accuracy for dry density measurement, with most data points exhibiting relative errors within ±10%. In contrast, Jung’s model showed relative errors exceeding ±20% for several test points.
2. A soil type-independent calibration relationship for dry density was successfully developed using the MEP algorithm. The MEP model exhibited robust performance in both the training and validation phases, achieving a slope of 0.925 and an R2 value of 0.88 for the training database. Most validation data points fell within a ±10% relative error range. Building upon this model, a soil type-independent calibration relationship for water content was established, demonstrating high accuracy, with most predicted values exhibiting absolute errors within ±0.04.
3. The developed calibration relationships were further validated using 64 datasets from the literature, covering various soil types, and through two field in situ tests conducted in Xi’an and Jingyang, Shaanxi Province. The in situ validation demonstrated that the developed model could accurately determine dry density with relative errors less than ±10% for most test points. Water content measurements showed strong agreement with laboratory oven-drying results, with absolute errors within ±0.02 for the majority of test points.
This research provides a valuable tool for rapid in situ assessment of soil properties, particularly for evaluating loess collapsibility, without requiring soil-specific calibration. The proposed soil type-independent calibration relationships based on MEP and TDR technology offer a reference to assist ASTM D6780/D6780M − 19 (2019) in geotechnical applications.
Data availability statement
The raw data supporting the conclusions of this article will be made available by the authors, without undue reservation.
Author contributions
Z-YZ: Writing – original draft. LL: Investigation, Methodology, Writing – original draft. W-TY: Investigation, Methodology, Validation, Writing – original draft. R-SZ: Investigation, Methodology, Validation, Writing – original draft. HT: Investigation, Methodology, Supervision, Writing – original draft. Q-YM: Conceptualization, Supervision, Writing – review and editing.
Funding
The author(s) declare that financial support was received for the research and/or publication of this article. This work was supported by the National Science Foundation of China (52279109).
Conflict of interest
Authors Z-YZ and LL were employed as an Engineer at Shandong Electric Power Engineering Consulting Institute Co., Ltd. Author W-TY was employed as an Engineer at the State Grid Corporation of China, Extra High Voltage Construction Branch. Authors R-SZ and HT were employed as an Engineer at China Jikan Research Institute of Engineering Investigations and Design, Co., Ltd.
The remaining author declares that the research was conducted in the absence of any commercial or financial relationships that could be construed as a potential conflict of interest.
Generative AI statement
The author(s) declare that no Generative AI was used in the creation of this manuscript.
Any alternative text (alt text) provided alongside figures in this article has been generated by Frontiers with the support of artificial intelligence and reasonable efforts have been made to ensure accuracy, including review by the authors wherever possible. If you identify any issues, please contact us.
Publisher’s note
All claims expressed in this article are solely those of the authors and do not necessarily represent those of their affiliated organizations, or those of the publisher, the editors and the reviewers. Any product that may be evaluated in this article, or claim that may be made by its manufacturer, is not guaranteed or endorsed by the publisher.
References
Asif, U., Javed, M. F., Alyami, M., and Hammad, A. W. (2024). Performance evaluation of concrete made with plastic waste using multi-expression programming. Mater. Today Commun. 39, 108789. doi:10.1016/j.mtcomm.2024.108789
ASTM D2216 (2010). Test methods for laboratory determination of water (Moisture) content of soil and rock by mass. doi:10.1520/D2216-10
ASTM D2487-11 (2011). Practice for classification of soils for engineering purposes Unified Soil Classification System. Conshohocken, PA. ASTM International. doi:10.1520/D2487-11
ASTM D4318-17 (2010). Standard test methods for liquid limit, plastic limit, and plasticity index of soils.
ASTM D6780/D6780M − 19 (2019). Test method for water content and density of soil in situ by time Domain Reflectometry (TDR). doi:10.1520/D6780_D6780M-19
Atkinson, J. H., Allman, M. A., and Böese, R. J. (1992). No AccessInfluence of laboratory sample preparation procedures on the strength and stoffness of intact Bothkennar soil recovered using the Laval sampler. Géotechnique 42, 349–354. doi:10.1680/geot.1992.42.2.349
Basma, A. A., and Member, A. (1992). Evaluation and control of collapsible soils. J. Geotechnical Eng. 118, 1491–1504. doi:10.1061/(ASCE)0733-9410(1992)118:10(1491)
Bhuyan, H., Scheuermann, A., Bodin, D., and Becker, R. (2020). Soil moisture and density monitoring methodology using TDR measurements. Int. J. Pavement Eng. 21, 1263–1274. doi:10.1080/10298436.2018.1537491
Bittelli, M., Tomei, F., Anbazhagan, P., Pallapati, R. R., Mahajan, P., Meisina, C., et al. (2021). Measurement of soil bulk density and water content with time domain reflectometry: algorithm implementation and method analysis. J. Hydrology 598, 126389. doi:10.1016/j.jhydrol.2021.126389
Curioni, G., Chapman, D. N., Pring, L. J., Royal, A. C. D., and Metje, N. (2018). Extending TDR capability for measuring soil density and water content for field condition monitoring. J. Geotech. Geoenviron. Eng. 144, 04017111. doi:10.1061/(ASCE)GT.1943-5606.0001792
Dalton, F. N., Herkelrath, W. N., Rawlins, D. S., and Rhoades, J. D. (1984). Time-Domain reflectometry: simultaneous measurement of soil water content and electrical conductivity with a single probe. Science 224, 989–990. doi:10.1126/science.224.4652.989
Farooq, F., Ahmed, W., Akbar, A., Aslam, F., and Alyousef, R. (2021). Predictive modeling for sustainable high-performance concrete from industrial wastes: a comparison and optimization of models using ensemble learners. J. Clean. Prod. 292, 126032. doi:10.1016/j.jclepro.2021.126032
Gibbs, H. J., and Bara, J. P. (1962). Predicting surface subsidence from basic soil tests Special Technical Publication, 322. Conshohocken, PA. ASTM International, 231–247.
Giese, K., and Tiemann, R. (1975). Determination of the complex permittivity from thin-sample time domain reflectometry improved analysis of the step response waveform. Adv. Mol. Relax. Process. 7, 45–59. doi:10.1016/0001-8716(75)80013-7
Holtz, W. G., and Hillf, J. W. (1961). “Settlement of soil foundations due to saturation,” in Proceedings of the 5th international conference on soil mechanics and (Paris: Foundation Engineering).
Jesswein, M., and Liu, J. (2022). Using a genetic algorithm to develop a pile design method. Soils Found. 62, 101175. doi:10.1016/j.sandf.2022.101175
Ji, W., Xiao, J., Toor, G. S., and Li, Z. (2021). Nitrate-nitrogen transport in streamwater and groundwater in a loess covered region: sources, drivers, and spatiotemporal variation. Sci. Total Environ. 761, 143278. doi:10.1016/j.scitotenv.2020.143278
Jia, X., Shao, M., Wei, X., Zhu, Y., Wang, Y., and Hu, W. (2020). Policy development for sustainable soil water use on China’s loess Plateau. Sci. Bull. 65, 2053–2056. doi:10.1016/j.scib.2020.09.006
Jung, S., Drnevich, V. P., and Abou Najm, M. R. (2013). New methodology for density and water content by time domain reflectometry. J. Geotech. Geoenviron. Eng. 139, 659–670. doi:10.1061/(ASCE)GT.1943-5606.0000783
Khan, S., Ali Khan, M., Zafar, A., Javed, M. F., Aslam, F., Musarat, M. A., et al. (2021). Predicting the ultimate axial capacity of uniaxially loaded CFST columns using multiphysics artificial intelligence. Materials 15, 39. doi:10.3390/ma15010039
Khan, M., Nassar, R.-U.-D., Khan, A. U., Houda, M., El Hachem, C., Rasheed, M., et al. (2023). Optimizing durability assessment: machine learning models for depth of wear of environmentally-friendly concrete. Results Eng. 20, 101625. doi:10.1016/j.rineng.2023.101625
Li, Y. (2018). A review of shear and tensile strengths of the malan loess in China. Eng. Geol. 236, 4–10. doi:10.1016/j.enggeo.2017.02.023
Lim, Y. Y., and Miller, G. A. (2004). Wetting-induced compression of compacted Oklahoma soils. J. Geotech. Geoenviron. Eng. 130, 1014–1023. doi:10.1061/(ASCE)1090-0241(2004)130:10(1014)
Lin, C., Tang, S., and Chung, C. (2006). Development of TDR penetrometer through theoretical and laboratory investigations: 1. Measurement of soil dielectric permittivity. Geotechnical Test. J. 29, 306–313. doi:10.1520/GTJ14093
Mu, Q. Y., Zhou, C., Ng, C. W. W., and Zhou, G. G. D. (2019). Stress effects on soil freezing characteristic curve: equipment development and experimental results. Vadose Zone J. 18, 1–10. doi:10.2136/vzj2018.11.0199
Mu, Q. Y., Dong, H., Liao, H. J., Dang, Y. J., and Zhou, C. (2020a). Water-retention curves of loess under wetting−drying cycles. Géotechnique Lett. 10, 135–140. doi:10.1680/jgele.19.00025
Mu, Q. Y., Zhan, L. T., Lin, C. P., and Chen, Y. M. (2020b). Non-invasive time domain reflectometry probe for transient measurement of water retention curves in structured soils. Eng. Geol. 264, 105335. doi:10.1016/j.enggeo.2019.105335
Mu, Q., Zhou, C., and Ng, C. W. W. (2020c). Compression and wetting induced volumetric behavior of loess: macro- and micro-investigations. Transp. Geotech. 23, 100345. doi:10.1016/j.trgeo.2020.100345
Mu, Q., Meng, L., Lu, Z., and Zhang, L. (2023a). Hydro-mechanical behavior of unsaturated intact paleosol and intact loess. Eng. Geol. 323, 107245. doi:10.1016/j.enggeo.2023.107245
Mu, Q. Y., Dai, B. L., Zhou, C., Meng, L. L., Zheng, J. G., Zhang, J. W., et al. (2023b). A new and simple method for predicting the collapse susceptibility of intact loess. Comput. Geotechnics 158, 105408. doi:10.1016/j.compgeo.2023.105408
Mu, Q. Y., Meng, L. L., and Zhou, C. (2023c). Stress-dependent water retention behaviour of two intact aeolian soils with multi-modal pore size distributions. Eng. Geol. 323, 107233. doi:10.1016/j.enggeo.2023.107233
Mu, Q., Song, T., Lu, Z., Xiao, T., and Zhang, L. (2024). Evaluation of the collapse susceptibility of loess using machine learning. Transp. Geotech. 48, 101327. doi:10.1016/j.trgeo.2024.101327
Muñoz-Castelblanco, J., Delage, P., Pereira, J. M., and Cui, Y. J. (2011). Some aspects of the compression and collapse behaviour of an unsaturated natural loess. Géotechnique Lett. 1, 17–22. doi:10.1680/geolett.11.00003
Nadler, A., Dasberg, S., and Lapid, I. (1991). Time domain reflectometry measurements of water content and electrical conductivity of layered soil columns. Soil Sci. Soc Amer J 55, 938–943. doi:10.2136/sssaj1991.03615995005500040007x
Nazar, S., Yang, J., Ahmad, W., Javed, M. F., Alabduljabbar, H., and Deifalla, A. F. (2022). Development of the new prediction models for the compressive strength of nanomodified concrete using novel machine learning techniques. Buildings 12, 2160. doi:10.3390/buildings12122160
Ng, C. W. W., and Pang, Y. W. (2000). Experimental investigations of the soil-water characteristics of a volcanic soil. Can. Geotechnical J. 37, 1251–1264. doi:10.1139/t00-05
Ng, C. W. W., Zhou, C., and Ni, J. (2024). Advanced unsaturated soil mechanics: theory and applications.
Oltean, M., and Groşan, C. (2003). A comparison of several linear genetic programming techniques. ComplexSystems 14, 285–313. doi:10.25088/ComplexSystems.14.4.285
Onyelowe, K. C., Ebid, A. M., Fernandez Vinueza, D. F., Estrada Brito, N. A., Velasco, N., Buñay, J., et al. (2024). Estimating the compressive strength of lightweight foamed concrete using different machine learning-based symbolic regression techniques. Front. Built Environ. 10, 1446597. doi:10.3389/fbuil.2024.1446597
Peng, J., Tong, X., Wang, S., and Ma, P. (2018). Three-dimensional geological structures and sliding factors and modes of loess landslides. Environ. Earth Sci. 77, 675. doi:10.1007/s12665-018-7863-y
Qin, S., Xu, T., Cheng, Z.-L., and Zhou, W.-H. (2023). Analysis of spatiotemporal variations of excess pore water pressure during mechanized tunneling using genetic programming. Acta Geotech. 18, 1721–1738. doi:10.1007/s11440-022-01728-w
Rehman, Z. U., Khalid, U., Ijaz, N., Mujtaba, H., Haider, A., Farooq, K., et al. (2022). Machine learning-based intelligent modeling of hydraulic conductivity of sandy soils considering a wide range of grain sizes. Eng. Geol. 311, 106899. doi:10.1016/j.enggeo.2022.106899
Rogers, C. D. F., Dijkstra, T. A., and Smalley, I. J. (1994). Hydroconsolidation and subsidence of loess: studies from China, Russia, North America and Europe. Eng. Geol. 37, 83–113. doi:10.1016/0013-7952(94)90045-0
Severcan, M. H. (2012). Prediction of splitting tensile strength from the compressive strength of concrete using GEP. Neural Comput. & Applic 21, 1937–1945. doi:10.1007/s00521-011-0597-3
Siddiqui, S., Drnevich, V., and Deschamps, R. (2000). Time domain reflectometry development for use in geotechnical engineering. Geotechnical Test. J. 23, 9–20. doi:10.1520/GTJ11119J
Topp, G. C., Davis, J. L., and Annan, A. P. (1980). Electromagnetic determination of soil water content: measurements in coaxial transmission lines. Water Resour. Res. 16, 574–582. doi:10.1029/WR016i003p00574
Vatin, N. I., Hematibahar, M., and Gebre, T. H. (2025). Chopped and minibars reinforced high-performance concrete: machine learning prediction of mechanical properties. Front. Built Environ. 11, 1558394. doi:10.3389/fbuil.2025.1558394
Velastegui, L., Velasco, N., Sanchez Quispe, H. R., Barahona, F., Onyelowe, K. C., Hanandeh, S., et al. (2024). Predicting the impact of adding metakaolin on the flexural strength of concrete using ML classification techniques – a comparative study. Front. Built Environ. 10, 1434159. doi:10.3389/fbuil.2024.1434159
Wang, H.-L., and Yin, Z.-Y. (2020). High performance prediction of soil compaction parameters using multi expression programming. Eng. Geol. 276, 105758. doi:10.1016/j.enggeo.2020.105758
Wang, J., Xu, Y., Ma, Y., Qiao, S., and Feng, K. (2018). Study on the deformation and failure modes of filling slope in loess filling engineering: a case study at a loess Mountain airport. Landslides 15, 2423–2435. doi:10.1007/s10346-018-1046-5
Wang, H.-L., Yin, Z.-Y., Zhang, P., and Jin, Y.-F. (2020a). Straightforward prediction for air-entry value of compacted soils using machine learning algorithms. Eng. Geol. 279, 105911. doi:10.1016/j.enggeo.2020.105911
Wang, L., Shao, S., and She, F. (2020b). A new method for evaluating loess collapsibility and its application. Eng. Geol. 264, 105376. doi:10.1016/j.enggeo.2019.105376
Wu, X.-J., Dang, F.-N., and Li, J.-Y. (2025). Research on structural parameters of loess and its experimental determination method. Front. Built Environ. 11, 1529204. doi:10.3389/fbuil.2025.1529204
Yin, Z.-Y., Jin, Y.-F., Shen, S.-L., and Huang, H.-W. (2017). An efficient optimization method for identifying parameters of soft structured clay by an enhanced genetic algorithm and elastic–viscoplastic model. Acta Geotech. 12, 849–867. doi:10.1007/s11440-016-0486-0
Yu, X., and Drnevich, V. P. (2004). Soil water content and dry density by time domain reflectometry. J. Geotech. Geoenviron. Eng. 130, 922–934. doi:10.1061/(ASCE)1090-0241(2004)130:9(922)
Zhan, L., Mu, Q., Chen, Y., and Chen, R. (2013). Experimental study on applicability of using time-domain reflectometry to detect NAPLs contaminated sands. Sci. China Technol. Sci. 56, 1534–1543. doi:10.1007/s11431-013-5211-8
Zhan, L., Mu, Q., and Chen, C. (2014). Analysis and experimental verification of sampling area of three-rod time-domain reflectometry probe. Chin. J. Geotechnical Eng. 36, 757–762. doi:10.11779/CJGE201404022
Zhan, T. L., Mu, Q., Chen, Y., and Ke, H. (2015). Evaluation of measurement sensitivity and design improvement for time domain reflectometry penetrometers. Water Resour. Res. 51, 2994–3006. doi:10.1002/2014WR016341
Zhang, R., and Xue, X. (2022). Determining ultimate bearing capacity of shallow foundations by using multi expression programming (MEP). Eng. Appl. Artif. Intell. 115, 105255. doi:10.1016/j.engappai.2022.105255
Zhang, N., Yu, X., and Pradhan, A. (2017). Application of a thermo-time domain reflectometry probe in sand-kaolin clay mixtures. Eng. Geol. 216, 98–107. doi:10.1016/j.enggeo.2016.11.016
Zhang, P., Yin, Z.-Y., and Jin, Y.-F. (2021). State-of-the-Art review of machine learning applications in constitutive modeling of soils. Arch. Comput. Methods Eng. 28, 3661–3686. doi:10.1007/s11831-020-09524-z
Zhang, H., Zeng, R., Zhang, Y., Zhao, S., Meng, X., Li, Y., et al. (2022). Subsidence monitoring and influencing factor analysis of Mountain excavation and valley infilling on the Chinese loess Plateau: a case study of Yan’an new district. Eng. Geol. 297, 106482. doi:10.1016/j.enggeo.2021.106482
Nomenclature
Keywords: time-domain reflectometry, soil type-independent calibration relationships, soil gravimetric water content, dry density, machine learning
Citation: Zhou Z-Y, Li L, Yu W-T, Zhang R-S, Tang H and Mu Q-Y (2025) Development of soil type-independent calibration relationships for water content and dry density measurements using time-domain reflectometry. Front. Built Environ. 11:1653550. doi: 10.3389/fbuil.2025.1653550
Received: 25 June 2025; Accepted: 18 August 2025;
Published: 15 September 2025.
Edited by:
Xinbao Yu, University of Texas at Arlington, United StatesReviewed by:
Mario Riccio, Juiz de Fora Federal University, BrazilZbigniew Suchorab, Lublin University of Technology, Poland
Copyright © 2025 Zhou, Li, Yu, Zhang, Tang and Mu. This is an open-access article distributed under the terms of the Creative Commons Attribution License (CC BY). The use, distribution or reproduction in other forums is permitted, provided the original author(s) and the copyright owner(s) are credited and that the original publication in this journal is cited, in accordance with accepted academic practice. No use, distribution or reproduction is permitted which does not comply with these terms.
*Correspondence: Qing-Yi Mu, cWluZ3lpbXVAY2hkLmVkdS5jbg==