 Robby Yussac Tallar
 Golan Geldoffer Mauregar
 Jian-Ping Suen
- 1Magister of Civil Engineering Department, Universitas Kristen Maranatha (Maranatha Christian University), Bandung, Indonesia
- 2Maranatha Water Sustainability Research Center, Civil Engineering Department, Universitas Kristen Maranatha (Maranatha Christian University), Bandung, Indonesia
- 3Ecological Water Resources Management, Hydraulic and Ocean Engineering Department, National Cheng Kung University (NCKU), Tainan, Taiwan
Urban river systems play a vital role in balancing ecological health, recreational utility, and visual harmony in densely built environments. While numerous studies have assessed water quality and flood vulnerability, limited research has focused on the spatial quantification of aesthetic value in urban rivers. This study introduces a novel geographic information system (GIS)-based aesthetic river index (ARI) that integrates ecological [normalized difference vegetation index (NDVI)], physical [normalized difference turbidity index (NDTI)], and structural components through an analytical hierarchy process (AHP). The index was applied to three case study rivers with distinct urban characteristics: the Kalimas River (Indonesia), the Love River (Taiwan), and the Chao Phraya River (Thailand). Landsat 8 imagery and local land use data were processed to assess vegetation vigor and water clarity, while structural features were digitized and scored for visual impact. Results show that the Love River attained the highest ARI score due to its integrated landscape planning and high water transparency, while the Chao Phraya exhibited the greatest aesthetic diversity. Validation using field-based perception surveys yielded strong correlations (ρ > 0.68), affirming the ARI as a robust tool for riverfront planning. This methodology contributes a replicable framework for incorporating human-centric aesthetics into sustainable river management strategies.
1 Introduction
Urban rivers occupy a unique position at the intersection of ecological function, recreational opportunity, and urban aesthetics. As cities expand, river management has traditionally focused on flood control, water quality, and hydraulic efficiency, often overlooking the visual and experiential dimensions that contribute to public wellbeing and local tourism economies (Chibana, 2024; Nardini and Conte, 2021; Horta et al., 2023; Watson et al., 2003; Bhonde et al., 2024). Yet aesthetic appreciation of rivers rooted in factors such as water clarity, riparian vegetation, and the design of man-made structures has been shown to influence mental health, encourage outdoor activity, and foster a sense of place among urban populations (Amuah and Kpiebaya, 2022; Tallar and Suen, 2015a; Tallar and Suen, 2015b; Tallar et al., 2017; Tallar, 2023). Recognizing these multifaceted benefits, there is growing impetus to develop standardized methods that can quantify aesthetic quality in a manner compatible with geographic information systems (GIS), thereby equipping planners and managers with actionable, spatially explicit insights (Bulu et al., 2008; Zhou, 2022; Lee, 2017; Nestler et al., 2016; Smith et al., 1995).
Previous efforts to integrate visual quality into water assessments have largely centered on static landscape evaluation protocols or broad-scale water quality indices, leaving a gap at the micro-spatial scale where urban design interventions are most feasible (Zheng and Paul, 2020; Kim, 2019; Rahman and Mamun, 2022; Lee, 2016; Shin et al., 2023; Jang, 2015). Our earlier work introduced indices such as the flood potential index (Tallar et al., 2017) and the stream island index for habitat complexity (Tallar, 2023), demonstrating the value of micro-scale, GIS-based frameworks in riverine studies. Building on these foundations, the present research advances an aesthetic river index (ARI) methodology that synthesizes spectral proxies—normalized difference vegetation index (NDVI) and normalized difference turbidity index (NDTI)—with participatory weighting via the analytical hierarchy process (AHP). The ARI is applied to three distinct Asian urban rivers—Kalimas (Surabaya, Indonesia), Love River (Kaohsiung, Taiwan), and Chao Phraya (Bangkok, Thailand)—to evaluate its robustness across varied environmental, cultural, and infrastructural contexts.
The core objectives of this study are to 1) articulate and justify key aesthetic indicators for urban rivers grounded in ecological and social science literature; 2) operationalize these indicators within a GIS environment to produce a replicable ARI workflow; 3) validate the index against field-based perception surveys; and 4) derive practical recommendations for urban river governance that integrate aesthetic enhancement alongside ecological health. By situating aesthetic quality at the heart of urban river assessment, this research aims to broaden the toolkit available to resource managers, landscape architects, and policymakers committed to creating healthy, attractive, and sustainable urban waterscapes.
2 Materials and methods
This study used digital maps of the surrounding river area loaded into mapping software (GIS). The software used a visibility tool to determine what could be seen from specific lookout points along the river. It then automatically calculated scores for key beauty factors based on the map data. Finally, it combined these scores and created color-coded maps showing which parts of the river were visually the most and least appealing, providing an objective tool to understand and manage the river’s scenic value.
Several famous rivers for tourism in Asian countries (Indonesia, Taiwan R.O.C., and Thailand) were selected as representatives of the study area of the paper (Figure 1). The selected rivers are the Kalimas River (Indonesia), the Love River (Taiwan), and the Chao Phraya River (Thailand). Further information about the physical characteristics of selected rivers can be seen in Table 1.

Figure 1. Existing condition in study area: (a) Kalimas River, Indonesia; (b) Love River, Taiwan; (c) Chao Phraya River, Thailand.
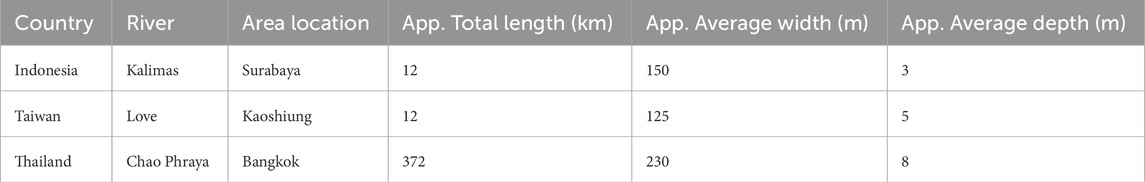
Table 1. Selected rivers of study area.
The Chao Phraya River plays a significant role in the economy and culture of Thailand. The land use types surrounding the Chao Phraya River are diverse and include residential, commercial, industrial, transportation, historical, and recreational areas. These areas reflect a blend of anthropogenic activities that collectively shape the landscape and dynamics of this iconic river in Thailand. Types of land use surrounding this river are dominated by residential, commercial, and business areas for tourism purposes, such as hotels, shops, cafés, and restaurants. Some historical areas (Wat Arun to the Grand Palace), landmarks, and government offices are also located along the banks of the Chao Phraya River. Therefore, the Chao Phraya River is a vital river for tourism and economic activities. The Chao Phraya River also serves as a strategic water transportation route that connects to other areas with decent water infrastructure, such as piers and ferries. Hence, the main function of this river is to facilitate mobility and ease traffic congestion surrounding Bangkok City.
Taiwan R.O.C. has a famous landmark river called the Love River or Ai River in Kaohsiung City. Various land use types surrounding this river consist of residential, commercial, recreational, and cultural areas. Modern changes in land use types have been increasingly affected by anthropogenic activities in these residential and commercial areas. The banks of the Love River provide a mix of urban living, scenic views, parks, recreational spaces, historical sites, green spaces, and waterfront walkways. The river offers opportunities for residents, locals, visitors, or tourists to participate in activities such as outdoor activities, jogging, cycling, or simply enjoying the scenic views of the river. The other function of the presence of open areas and/or green spaces is to contribute to a better quality of life and environment, as well as to promote sustainable urban development for the surrounding river areas. The Love River also has a public green area and a remarkable water infrastructure for ensuring locals and tourists can have easy access to the areas surrounding the Love River.
The typical land use types of the surrounding areas in Kalimas River, Surabaya City, Indonesia, are residential, commercial, and industrial areas, which play a crucial role in the anthropogenic activities within. Other land use types surrounding the Kalimas River are recreational and green spaces such as fields, large and small parks, walkways, and waterfront infrastructures that provide important ecological buffers to maintain biodiversity, environmental, and also increase air quality. Residents, locals, and tourists adore this environment as a vital area for enhancing the quality of life for Surabaya residents and providing opportunities for leisure activities, exercise, and social gatherings along the riverfront. Transportation infrastructure, like roads, bridges, and public transportation hubs, is critical for connecting different parts of Surabaya and facilitating movement across the city. The proximity of these infrastructures to the river plays a significant role in urban mobility and accessibility.
To support this assessment, Landsat 8 Operational Land Imager (OLI) scenes were acquired for the dry season of 2023. Bands 4 (red), 5 (near-infrared), and 3 (green) were used to calculate two spectral indices: NDVI for vegetation cover and NDTI for water clarity. Radiometric and atmospheric corrections were applied using the dark object subtraction method, and cloud contamination was minimized using the Fmask algorithm. Each raster was clipped to a 200-m buffer around river centerlines to isolate riparian influence zones.
The NDVI and NDTI values were reclassified into five ordinal categories to translate continuous spectral data into discrete aesthetic scores. Man-made structures were digitized from satellite imagery and high-resolution basemaps, then scored manually based on design aesthetics and visibility. These three data types—NDVI, NDTI, and structural features—formed the core of the ARI. To integrate subjective visual preference into the index, 12 experts (landscape architects, hydrologists, and urban designers) completed a Saaty-scale AHP to determine the relative weights of each variable. The resulting weights (w1 = NDTI; w2 = NDVI; w3 = structures) were applied to compute the ARI for each pixel.
Field validation was conducted through on-site surveys at 10 observation points per river. Observers provided aesthetic ratings using a 5-point Likert scale, which were compared to ARI scores using Spearman’s correlation. This helped verify the alignment of computed aesthetic values with human perception.
To complement the analysis, statistical summaries of NDVI, NDTI, and ARI were compiled, and a comparative visualization of index means and standard deviations was also generated (Figure 2).
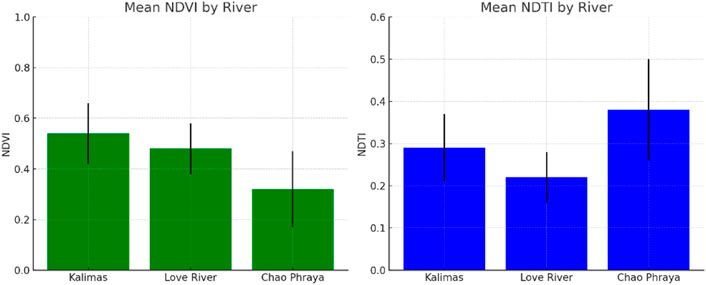
Figure 2. Statistical summary of NDVI and NDTI by river.
3 Methodology
In many previous studies, an index has been used to assess the water-related problems (Kavya, 2015; Ajoke Adelagun et al., 2021; Shah, 2013; Marselina et al., 2020). Previous literature reviews pointed out that it is necessary to develop a formula index for assessing the condition with micro-scale and spatially explicit information in the targeted study area (Tallar and Mauregar Geldoffer, 2022; Tallar, 2023). After collecting data, the next step is to define attributes of aesthetic value on river management and analyze them using a GIS-based method (Schiebe et al., 2002; Das, 2021). We examined the aesthetic value of the river environmental attribute preferences of river users, in terms of physical attributes (water turbidity), ecological attributes (vegetation cover), and man-made structures (dykes and bridges). The offered methodology research can be seen in Figure 3.
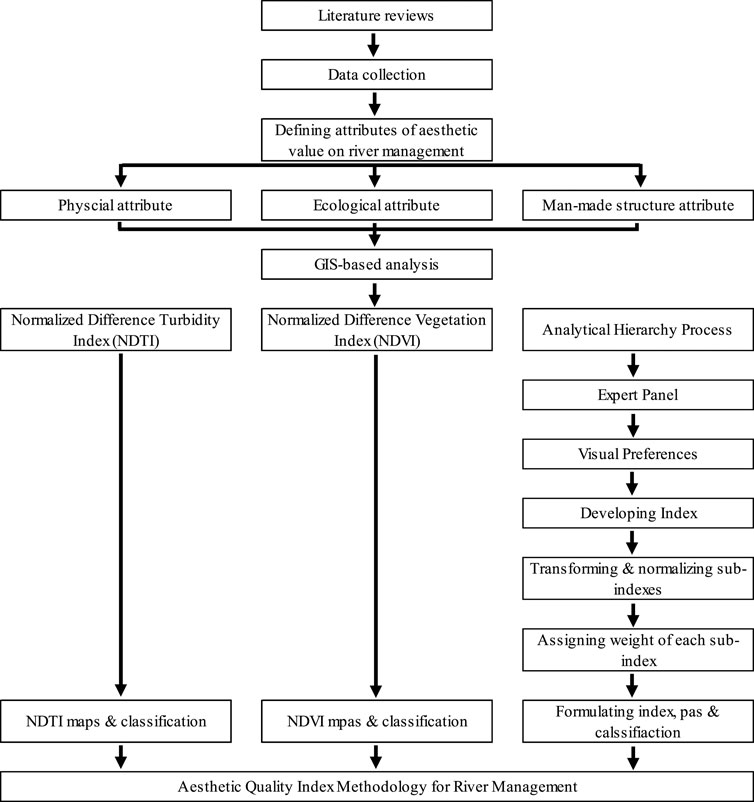
Figure 3. Methodology research.
The NDTI is used to represent physical attributes, and the NDVI obtained from Landsat 8 interpretation is used to represent ecological attributes (Alldredge et al., 2012; Khillare and Patil, 2022). The AHP method is also used as the appropriate logic scoring of the preference method as a representative of man-made structure attributes. All the data collected for the AHP method were processed by using ArcGIS software version 10.5 as an application for the digital mapping process. Scoring, weighting, and overlaying are the subsequent processes in the AHP method. This method also uses the ranking method to assign weight values of variables by ranking order for each variable (Rajasekhar et al., 2022; Motiee et al., 2023).
4 Results and discussion
The spatial analysis conducted in this study leverages GIS-based methods to evaluate the aesthetic quality of urban rivers by integrating remote sensing indices and vector-based structural data. This integrated approach enabled the development of the aesthetic river index (ARI), which synthesizes biophysical conditions (via NDVI and NDTI) with built-environment attributes. The methodology was applied to three rivers—Kalimas River (Indonesia), Love River (Taiwan), and Chao Phraya River (Thailand)—to identify spatial patterns of visual quality and diagnose areas requiring targeted improvements.
Consistent with field observation and NDVI analysis, the Kalimas River demonstrated a relatively higher riparian vegetation score (mean NDVI = 0.54 ± 0.12) than the other rivers. The classification of vegetation conditions (non-vegetation, low vegetation, and high vegetation) showed a more balanced distribution, with green patches especially concentrated in public parks and community-managed spaces. However, despite having a better ecological profile, the Kalimas River’s aesthetic scores were moderately constrained by less-developed structural elements and variable water clarity (NDTI = 0.29). Consequently, the ARI value for Kalimas averaged 3.4 ± 0.5, placing it in the “medium aesthetic” range.
In contrast, the Love River in Kaohsiung exhibited the highest overall ARI performance (mean = 4.1 ± 0.4), primarily due to excellent turbidity conditions (mean NDTI = 0.22 ± 0.06) and uniformly distributed green and recreational infrastructure. This supports findings from the NDVI–NDTI integration and stakeholder evaluations that rank the Love River as the most aesthetically optimized case. As shown in Figure 3 (center), the spatial consistency of blue-colored “good” and “fair” condition zones reflects sustained urban landscape planning and riverfront revitalization initiatives. The vegetation conditions were categorized into low to moderate NDVI ranges, which were effectively enhanced by urban structural design elements such as walkways, bridges, and green corridors.
The Chao Phraya River, though home to the highest density of tourism activities—ranging from sightseeing boats to ferry services with multiple piers—showed a more heterogeneous pattern in aesthetic distribution. Turbidity levels were significantly higher (mean NDTI = 0.38 ± 0.12), likely due to continuous river traffic and sediment resuspension. Riparian vegetation was sparse and unevenly distributed (NDVI = 0.32 ± 0.15), limiting its contribution to aesthetic value. Consequently, although certain iconic heritage zones scored highly due to the visual appeal of landmarks, the average ARI value remained lower (mean = 3.0 ± 0.6), and the standard deviation was the highest among the three rivers. This indicates a polarized riverfront, with attractive zones interspersed with visually degraded segments.
Figures 4–6 together provide a comprehensive visual analysis of the aesthetic conditions across the study rivers. Figure 7 presents a comparative bar chart of ARI scores alongside Spearman’s correlation coefficients with field-based perception. These visualizations confirm that higher ARI values align not only with strong ecological indicators but also with coherent urban design elements and perceived scenic harmony of the riverscapes. Despite Chao Phraya’s cultural and tourism prominence, its lower ARI scores highlight the importance of ecological and structural harmony in generating a positive visual experience. This supports findings from prior studies, where riverfront management strategies must integrate both ecological and human-centric parameters to optimize value.
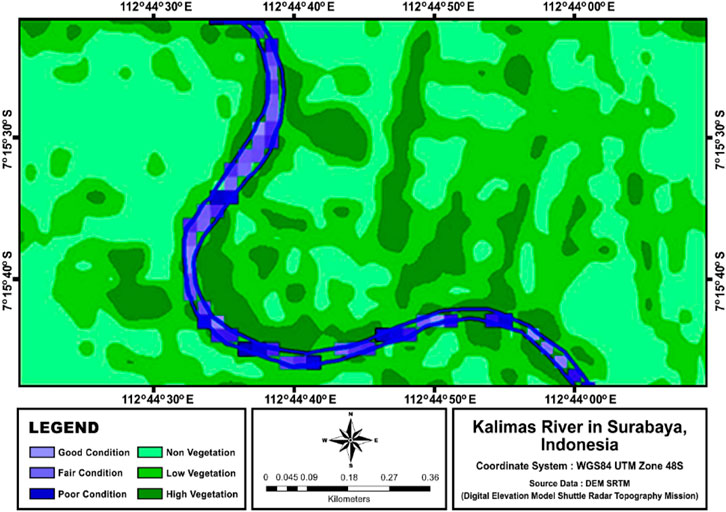
Figure 4. Results of the NDTI and NDVI map of the Kalimas River, Surabaya City, Indonesia.
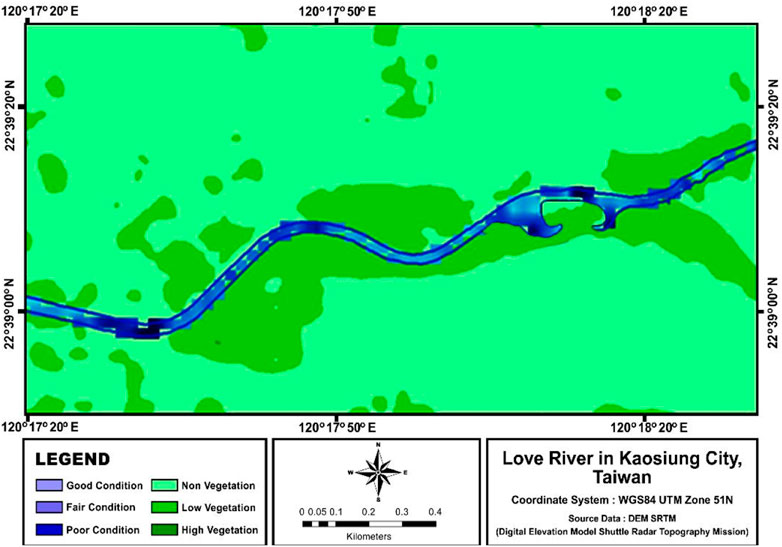
Figure 5. Results of the NDTI and NDVI map of the Love River, Kaohsiung City, Taiwan.

Figure 6. Results of the NDTI and NDVI map of the Chao Phraya River, Bangkok City, Thailand.
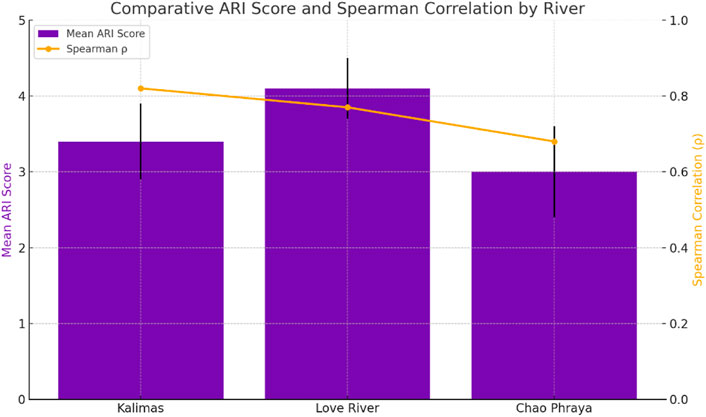
Figure 7. ARI score and Spearman correlation.
Field validation further confirmed the robustness of the ARI model. Spearman’s rank correlation coefficients between observer-based Likert ratings and computed ARI values were statistically significant in all three rivers (ρ = 0.82 for Kalimas, ρ = 0.77 for Love River, and ρ = 0.68 for Chao Phraya), as shown in Figure 7, confirming strong alignment between the model and human perception.
5 Conclusion
The aesthetic river index presented herein represents a robust, GIS-enabled tool for quantifying the visual quality of urban rivers at micro-spatial scales. By synthesizing spectral indicators of vegetation and turbidity with expert-derived structural weightings, the ARI delivers spatially explicit maps that correlate strongly with field-based perception surveys. Application to three Asian case studies (Kalimas, Love, and Chao Phraya rivers) demonstrates the methodology’s adaptability across varied hydrological, ecological, and cultural contexts.
Key contributions include methodological transparency in index computation, validation through both sensitivity analysis and observer surveys, and practical insights for riverfront planners seeking to balance ecological health with aesthetic enrichment. While the current framework relies on Landsat 8 imagery and expert panels, future enhancements might incorporate higher-resolution remote sensing data, participatory weighting from broader stakeholder groups, and integration of soundscape or user-behavior metrics to capture multidimensional perceptions of aesthetic quality. In an era of rapid urbanization and heightened demands on urban waterways, the ARI offers a scalable decision-support instrument. By foregrounding aesthetic considerations alongside conventional water management objectives, it empowers municipalities, designers, and environmental agencies to craft riverscapes that nurture both ecosystem integrity and human wellbeing.
Data availability statement
The original contributions presented in the study are included in the article/supplementary material; further inquiries can be directed to the corresponding author.
Author contributions
RT: Writing – review and editing, Writing – original draft. GM: Visualization, Data curation, Writing – original draft, Software. JS: Writing – review and editing, Supervision.
Funding
The author(s) declare that financial support was received for the research and/or publication of this article. This research was supported by funding provided by LPPM Maranatha.
Acknowledgments
The authors gratefully acknowledge the support for this research provided by Universitas Kristen Maranatha (Maranatha Christian University), Indonesia, and under collaborative research with the Hydraulics and Ocean Engineering Department, National Cheng Kung University, Taiwan R.O.C.
Conflict of interest
The authors declare that the research was conducted in the absence of any commercial or financial relationships that could be construed as a potential conflict of interest.
Generative AI statement
The author(s) declare that no Generative AI was used in the creation of this manuscript.
Publisher’s note
All claims expressed in this article are solely those of the authors and do not necessarily represent those of their affiliated organizations, or those of the publisher, the editors and the reviewers. Any product that may be evaluated in this article, or claim that may be made by its manufacturer, is not guaranteed or endorsed by the publisher.
References
Ajoke Adelagun, O., Edet Etim, E., and Emmanuel Godwin, O. (2021). Application of water quality index for the assessment of water from different sources in Nigeria. Promis. Tech. Wastewater Treat. Water Qual. Assess. doi:10.5772/intechopen.98696
Alldredge, B., and Moore, G.Assessment of riparian vegetation sensitivity to river hydrology downstream of a major texas dam (2012). River Res. Appl. 30 (2), 230–244. doi:10.1002/rra.2625
Amuah, E. E. Y., and Kpiebaya, P. (2022). A comparative assessment of the novel water pollution index and the water quality index using empirical data. Improv. Water Qual. Eval. doi:10.21203/rs.3.rs-1527234/v1
Bhonde, U., Choudhury, B., and Sachdeva, R. (2024). Urban river management: scope and spectrum. Manag. Urban Rivers, 25–39. doi:10.1016/b978-0-323-85703-1.00015-8
Bulut, Z., and Yilmaz, H. (2008). Determination of waterscape beauties through visual quality assessment method. Environ. Monit. Assess. 154 (1–4), 459–468. doi:10.1007/s10661-008-0412-5
Chibana, T. (2024). Urban river management: harmonizing river ecosystem conservation. CSUR-UT Ser. Libr. Sustain. Urban Regen., 47–66. doi:10.1007/978-4-431-78397-8_3
Das, A. (2021). Surface water quality assessment along mahanadi river using WQI and GIS. J. Water Eng. Manag. 2 (3). doi:10.47884/jweam.v2i3pp40-78
Horta, A., Turner, C., and Belbase, D. (2023). Mapping river infrastructure for improved water resource management. FAO. doi:10.4060/cc7591en
Jang, C.-S. (2015). Using probability-based spatial estimation of the river pollution index to assess urban water recreational quality in the tamsui river watershed. Environ. Monit. Assess. 188 (1), 36. doi:10.1007/s10661-015-5040-2
Kavya, M. (2015). Assessment of water quality using multi-variate Analysis,Water quality index and geo-statistical analysis. Int. J. Sci. Res. Manag. doi:10.18535/ijsrm/v3i8.05
Khillare, A., and Patil, K. A. (2022). NDVI: vegetation performance evaluation using RS and GIS. Lect. Notes Civ. Eng., 425–435. doi:10.1007/978-981-19-2145-2_33
Kim, J. S. (2019). The production of han-river: south korea’s developmental urbanization and more-than-human waterscape. Korean Assoc. Space Environ. Res. 67, 93–155. doi:10.19097/kaser.2019.29.1.93
Lee, L.-H. (2016). The relationship between visual satisfaction and water clarity and quality management in tourism fishing ports. J. Water Resour. Prot. 08 (08), 787–796. doi:10.4236/jwarp.2016.88064
Lee, L.-H. (2017). Appearance’s aesthetic appreciation to inform water quality management of waterscapes. J. Water Resour. Prot. 09 (13), 1645–1659. doi:10.4236/jwarp.2017.913103
Marselina, M., Sabar, A., and Fahimah, N. (2020). “Seasonal and temporal assessment of surface water quality in saguling reservoir Indonesia using water quality index”. doi:10.21203/rs.3.rs-20562/v1
Motiee, H., khalili, R., Gholami, B., and Motiee, S. (2023). A decision making approach for water transfer systems by analytical hierarchy process (AHP) and GIS. Water Resour. Manag. 37 (12), 4623–4637. doi:10.1007/s11269-023-03559-0
Nardini, A. G. C., and Conte, G. (2021). River management and restoration: what river do we wish for. Water 13 (10), 1336. doi:10.3390/w13101336
Nestler, J. M., Stewardson, M. J., Gilvear, D. J., Angus Webb, J., and Smith, D. L. (2016). Ecohydraulics exemplifies the emerging ‘paradigm of the interdisciplines. J. Ecohydraulics 1 (1–2), 5–15. doi:10.1080/24705357.2016.1229142
Rahman, M. A., and Mamun, M. D. (2022). “Retrieving urban waterscape as the quality of public space: a case study of shitalakshya river, Narayanganj,” in Proceedings of the 58th ISOCARP world planning congress. doi:10.47472/2ig3nhko
Rajasekhar, M., Sudarsana Raju, G., and Sreenivasulu, Y. (2022). Using analytical hierarchical process (AHP)-based geospatial approach for identification of suitable sites for artificial recharge structures for sustainable water resource management. GIScience Sustain. Manag. Water Resour. Oct. 14, 41–60. doi:10.1201/9781003284512-4
Schiebe, F., Waits, D., Salisbury, J., Garbrecht, J., and Starks, P. (2002). Selection, development, and use of GIS coverages for the little washita river research watershed. GIS Water Resour. Watershed Manag., 69–75. doi:10.1201/9780203217917.ch7
Shah, S. K. (2013). Water quality assessment of mardi river by using water quality index. BIBECHANA 10 (October 31), 100–107. doi:10.3126/bibechana.v10i0.7106
Shin, J., Ku, T. G., Seo, Il W., and Kim, Y.Do (2023). River recreational activity vulnerability assessment and the hydraulic index proposal. Water 15 (20), 3587. doi:10.3390/w15203587
Smith, D. G., Croker, G. F., and Kay, M. F. (1995). Human perception of water appearance. N. Z. J. Mar. Freshw. Res. 29 (1), 29–43. doi:10.1080/00288330.1995.9516637
Tallar, R., and Suen, J.-P. (2017). Measuring the aesthetic value of multifunctional Lakes using an enhanced visual quality method. Water 9 (4), 233. doi:10.3390/w9040233
Tallar, R. Y. (2023). The conceptual design of a stream island index for physical habitat complexity assessment in stream restoration projects. Front. Built Environ. 9. doi:10.3389/fbuil.2023.1286484
Tallar, R. Y., and Mauregar Geldoffer, G. (2022). A micro-scale study of flood risk assessment in urban fluvial areas using the flood potential index. Front. Environ. Sci. 10 (February 25). doi:10.3389/fenvs.2022.846450
Tallar, R. Y., and Suen, J.-P. (2015a). Aquaculture water quality index: a low-cost index to accelerate aquaculture development in Indonesia. Aquac. Int. 24 (1), 295–312. doi:10.1007/s10499-015-9926-3
Tallar, R. Y., and Suen, J.-P. (2015b). Identification of waterbody status in Indonesia by using predictive index assessment tool. Int. Soil Water Conservation Res. 3 (3), 224–238. doi:10.1016/j.iswcr.2015.06.009
Watson, D., Arrowsmith, C., and Goudey, R. (2003). Water availability: a regional water quality problem. Int. J. River Basin Manag. 1 (4), 321–330. doi:10.1080/15715124.2003.9635215
Zheng, G., and Paul, D. G. (2020). A simple water clarity-turbidity index for marine andinland waters. Gt. Lakes. Case Study. doi:10.1002/essoar.10503921.1
Keywords: visual assessment, river management, index, aesthetic, GIS
Citation: Tallar RY, Mauregar GG and Suen J-P (2025) Aesthetic river index: a GIS-based multi-criteria framework for assessing visual quality in recreational urban rivers. Front. Built Environ. 11:1655317. doi: 10.3389/fbuil.2025.1655317
Received: 27 June 2025; Accepted: 21 July 2025;
Published: 08 September 2025.
Edited by:
Alfrendo Satyanaga, Nazarbayev University, KazakhstanReviewed by:
Nura Bello, Nazarbayev University, KazakhstanSaltanat Orazayeva, Nazarbayev University, Kazakhstan
Copyright © 2025 Tallar, Mauregar and Suen. This is an open-access article distributed under the terms of the Creative Commons Attribution License (CC BY). The use, distribution or reproduction in other forums is permitted, provided the original author(s) and the copyright owner(s) are credited and that the original publication in this journal is cited, in accordance with accepted academic practice. No use, distribution or reproduction is permitted which does not comply with these terms.
*Correspondence: Robby Yussac Tallar, cm9iYnl5dXNzYWNAeWFob28uY29t, cm9iYnkueXRAZW5nLm1hcmFuYXRoYS5lZHU=