 Salvatore Russotto
 Marco Migliore
 Salvatore Orlando1,2
 Antonina Pirrotta
- 1Engineering Department, Universitá degli Studi di Palermo, Palermo, Italy
- 2National Sustainable Mobility Center (Centro Nazionale per la Mobilitá Sostenibile – CNMS), Milan, Italy
The condition of road pavements significantly impacts transportation systems, affecting driving comfort, road safety, vehicle durability, and fuel consumption. Consequently, effective road maintenance represents a crucial task for governmental agencies, necessitating reliable, scalable, and preferably cost-effective assessment tools. Commonly employed indices, specifically the Pavement Condition Index (PCI) and the International Roughness Index (IRI), exhibit distinct limitations. Particularly, accurate IRI calculation requires expensive instrumentation, thus limiting its scalability. Regarding PCI computation, which is based on the type, number, and severity of pavement anomalies, 3D reconstruction methods, although accurate, are costly and complex, whereas visual-based methods are sensitive to environmental conditions and computationally intensive. Conversely, vibration-based methods are economical and typically involve low computational demands. However, they face challenges in anomaly classification and necessitate precise calibration for each vehicle used. Consequently, PCI calculation also suffers from limited scalability. In this paper, an innovative and cost-effective vibration-based approach is proposed for monitoring road surface quality. The proposed approach relies on a home-made low-cost acquisition unit combined with a novel algorithm that employs the Hilbert transform to calculate a new index, called Road Surface Quality Index (RSQI). The proposed methodology allows to perform large-scale data collection via cloud connectivity and generates intuitive grayscale maps that highlight road segments with poor surface quality. Experimental validations conducted along the Palermo-Altofonte route using a plug-in hybrid vehicle, together with comparative analyses against both IRI and visual-based approaches, confirm the effectiveness of the proposed approach that can be considered reliable for supporting targeted and sustainable road maintenance strategies.
1 Introduction
The condition of road pavement significantly influences several critical aspects related to transportation systems, including road safety, vehicle durability, and energy efficiency. Specifically, deteriorated road surfaces considerably compromise driving safety, increasing the probability of accidents due to diminished vehicle stability, reduced traction, and impaired handling capabilities (Sattar et al., 2021; Al-Masaeid et al., 2025; Lebaku et al., 2025). Additionally, poor conditions of road pavements accelerate the degradation of key vehicle components, such as suspension systems, resulting in higher maintenance costs and decreased vehicle lifespan. Furthermore, low quality of road surfaces negatively affect vehicle fuel efficiency, causing increased fuel consumption and consequent economic and environmental impacts (Celaya-Padilla et al., 2018).
From an economic perspective, the proportion of road networks maintained in optimal condition serves as a reliable indicator of a country’s economic strength, infrastructural effectiveness, and overall competitiveness (Martinez-Ríos et al., 2022; Ivanova and Masarova, 2013). Indeed, countries characterized by well-maintained transport infrastructures typically exhibit high economic productivity, greater logistic efficiency, and improved standards of living, all of which contribute to sustained economic growth and enhanced social wellbeing.
Given the aforementioned considerations, adopting targeted and intelligent road maintenance strategies, supported by tools capable of assessing pavement conditions and prioritizing maintenance interventions, represents a fundamental task for government agencies (El-Wakeel et al., 2018). Therefore, the successful formulation and implementation of strategic pavement maintenance decisions require comprehensive and accurate monitoring of road surface conditions. Such monitoring should rely on advanced diagnostic techniques, characterized by scalability, accuracy, ease of implementation, and preferably, low costs, thus facilitating widespread application and sustainable road infrastructure management. In particular, diagnostic techniques that combine scalability and low costs, thereby enabling broad deployment and long-term sustainability, include approaches based on connected vehicles equipped with low-cost sensors, which can be exploited for crowdsensing applications to continuously collect and analyze road condition data over extensive transportation networks (Mahlberg et al., 2023; Lebaku et al., 2025). In order to assess the quality of road surfaces, various types of sensor-equipped vehicles can be employed. Among these, recent applications have involved the use of all-terrain vehicles (Guerra et al., 2024), e-scooters (Virin et al., 2025), and bicycles (Zang et al., 2018; Lee et al., 2025). Nevertheless, passenger cars remain the most commonly used vehicles to date.
The condition of road pavements is commonly evaluated using either the Pavement Condition Index (PCI) or the International Roughness Index (IRI) (Dela Cruz et al., 2021), both of which are influenced by several factors, including the structural characteristics of the pavement (Xiaoyan et al., 2023). Although some studies have sought to establish a correlation between PCI and IRI (Rijal and Medis, 2019), also incorporating approaches based on genetic algorithms or artificial neural networks (Hanandeh et al., 2022), typically only one of these indices is used.
The PCI, originally developed by the U.S. Army Corps, evaluates pavement quality based on the number, type, and severity of road surface anomalies, disregarding road roughness in segments without anomalies. Conversely, the IRI, proposed in 1986 (Sayers et al., 1986), is calculated by simulating the response of a standardized vehicle, known as quarter-car and also called golden car, traveling at a speed of 80 km/h over a road profile (Múčka, 2017). Therefore, IRI calculation requires the knowledge of the road profile, which is obtained with direct or indirect measurements. Direct measurements involve the use of high-performances profilometers, like laser profilometers, to directly measure the road profile elevation with high accuracy. Such instruments, which must have a precision at least of 0.38 mm and that have to be able to acquire samples with a maximum distance of 25 mm, make the direct measurements very expensive. On the other hand, although indirect measurements based on signals acquired by using accelerometers mounted on a moving vehicle are cheaper than direct measurement, they require precise calibrations and the road profile cannot be obtained with the same accuracy of direct measurements. Therefore, indirect measurements may lead to inaccurate estimation of the IRI. Moreover, although simplified methods for the direct estimation of IRI from vibration measurements without employing the quarter-car model have been developed and used for different type of vehicles (Setiawan and Nurdin, 2019; Zang et al., 2018; Guerra et al., 2024), innovative approaches combining vibration measurements with Kalman filtering have been proposed (Li J. et al., 2025), specific maintenance thresholds applicable to particular regions have been suggested (Chen et al., 2020), speed-dependent thresholds for road surface condition assessment have been introduced (Yu et al., 2006), and even original convolutional neural network models for long-term IRI trend prediction have been created (Wu et al., 2025), estimating IRI solely from vibration measurements remains challenging.
As for computation of the PCI, detailed knowledge of existing pavement anomalies is required. These anomalies, defined as variations from standard road surface conditions (Luo et al., 2020), include potholes, cracks, bumps, bridge joints, and manholes. Several methodologies to identify the anomalies of the road surfaces can be found in literature. These methodologies, also including those based on machine learning or deep learning approaches (Radwan et al., 2025; Afridi et al., 2025; Magdy et al., 2025), are classified into three distinct categories: 3D reconstruction methods, visual-based methods, and vibration-based methods (Sattar et al., 2018).
3D reconstruction methods typically involve advanced sensing technologies, such as laser scanners, to achieve highly detailed monitoring of road surfaces. These approaches not only allow accurate identification and classification of pavement anomalies, but also enable precise retrieval of three-dimensional geometric properties with a high level of resolution (Kim et al., 2022). Although this type of methodology has been extensively studied by various authors and provides exceptional accuracy, it is generally characterized by high operational costs, substantial computational complexity, and limited suitability for large-scale crowdsensing applications (Sattar et al., 2021; Kim et al., 2022).
Visual-based methods, which rely on image-processing techniques and texture-extraction algorithms, employ georeferenced images captured using cameras or video recorders typically mounted within vehicles. Although extensively investigated by numerous researchers (Kim et al., 2022; Koch and Brilakis, 2011; 2018; Varona et al., 2020; Wang et al., 2017) and further enhanced through approaches like those based on deep learning (Ibragimov et al., 2024) and mask region-based convolutional neural network (Li D. et al., 2025), visual-based methods, while generally less costly than 3D reconstruction techniques, remain computationally intensive. Additionally, their reliability and robustness are often negatively impacted by variable lighting conditions, shadows, and environmental factors affecting image quality (Sattar et al., 2018). Therefore, their applicability to large-scale crowdsensing-based assessments remains significantly constrained.
Vibration-based methods involve acquiring and analyzing vibrational signals produced by vehicles in transit. Specifically, vehicle vibrations exhibit higher amplitudes when traversing pavement segments characterized by poor conditions and surface anomalies. Although these vibration-based approaches typically face challenges regarding the precise classification of specific anomalies and the detailed extraction of their geometric features, they have become increasingly attractive due to their relatively low implementation costs compared to both 3D reconstruction and visual-based methods (Sattar et al., 2021). The economic feasibility and accessibility of these methods have significantly improved, particularly following the widespread adoption of micro-electromechanical systems (MEMS) accelerometers, which offer high performance at significantly reduced costs. Moreover, vibration-based methodologies exhibit low computational complexity.
Vibration-based methods can be divided into threshold-based methods and learning-based methods. The first ones allow to detect both the position of road surfaces anomalies and their severity. Specifically, the presence of a road anomaly is detected when changes in the amplitude of the accelerations acquired in vertical direction exceed a certain value. Among these techniques, the most used are those based on sliding windows (Nguyen et al., 2019). Although these methods are very cheap, they struggle to precisely classify anomaly types. Moreover, they require specific calibrations for each vehicle, complicating their adoption in widespread crowdsensing. Conversely, advanced vibration-based methods employing deep-learning or machine learning algorithms provide effective anomaly classification but necessitate computationally intensive model training and extensive datasets acquired from various vehicle types across diverse road conditions.
Vibration-based methods have also been used to analyze data collected from smartphones, enabling widespread crowdsensing (Sattar et al., 2018; Setiawan and Nurdin, 2019; Zang et al., 2018; Lee et al., 2025). However, the use of smartphones introduces uncertainties related to sensor variability and differences in the positioning of the smartphones within vehicles, potentially compromising the accuracy of road pavement quality assessment (Martinez-Ríos et al., 2022).
Due to the aforementioned reasons, achieving a comprehensive, cost-effective, and crowdsensing-compatible assessment of pavement quality remains challenging. Therefore, in this paper, an alternative approach for pavement quality assessment is proposed. It is based on a low-cost acquisition unit, developed at the Experimental Dynamics Laboratory of the University of Palermo, and an innovative algorithm that employs both the Hilbert transform and a georeferenced random variable, obtained by originally combining georeferenced segments of the first derivative of the Hilbert transform of the accelerations, to compute a novel index called the Road Surface Quality Index (RSQI). Notably, since the low-cost acquisition unit allows to send the acquired data to a cloud server, the proposed approach is not only very cheap, but also suitable for widespread crowdsensing applications. Moreover, the proposed approach generates a grayscale map as output, wherein darker shades correspond to road segments with poorer quality, thus facilitating a straightforward and intuitive interpretation of the results. Such maps can therefore effectively support governmental agencies in adopting sustainable mobility strategies based on intelligent and targeted road maintenance interventions. The reliability of the proposed approach is assessed through experimental tests performed in situ, with a plugin hybrid vehicle, along the Palermo-Altofonte route. Comparisons with IRI and classical visual-based methods are also reported.
2 Proposed algorithm
In this section, the proposed algorithm for the assessment of the road surface quality is presented and described in detail. It is structured in different sequential steps, each contributing to achieving an accurate mapping of the road surface conditions.
The first step of the proposed algorithm consists of signal acquisition. Specifically, two distinct types of signals must be acquired: accelerometric signals and position data. Regarding accelerometric signals, their acquisition should be carried out by means of an accelerometer capable of accurately capturing vibrations over a broad range of amplitudes and frequencies. A wide amplitude range is necessary in order to detect road surface conditions that may induce significantly high accelerations, such as severe surface irregularities or potholes. Similarly, an extensive frequency range is essential for capturing impulsive effects that typically result from vehicle interactions with anomalies or discontinuities on the road surface. It is to be stressed that a high sampling frequency
Regarding the acquisition of the vehicle’s position, it must be recorded using a GNSS receiver. The recording of positional data should be carefully synchronized with the acceleration data acquisition through appropriate instrumentation and synchronization procedures, ensuring temporal consistency between the acquired signals. Although no stringent technical specifications are strictly required for the GNSS receiver, it is advisable to select a device capable of providing sufficient positional accuracy. Moreover, it is recommended that the GNSS receiver should have a sampling frequency of at least 1 Hz, that corresponds to a time sampling step
Once the accelerometric signals, denoted as
The second step of the proposed algorithm is the signal filtering. Specifically, a band-pass filter ranging from 0.5 Hz to the 40% of the sampling frequency is applied to the acquired acceleration
After the signal filtering, the Hilbert transform of the filtered acceleration
in which
After computing
This differentiation step enhances the sensitivity of the analysis to rapid temporal changes and transient features in the signal, thereby improving the capability to clearly highlight localized variations associated with road surface anomalies. The use of the first derivative thus contributes significantly to increasing the resolution and effectiveness of the proposed approach for the assessment of the road surface quality.
After computing
At this point, the construction of a spatial grid in which the segments of
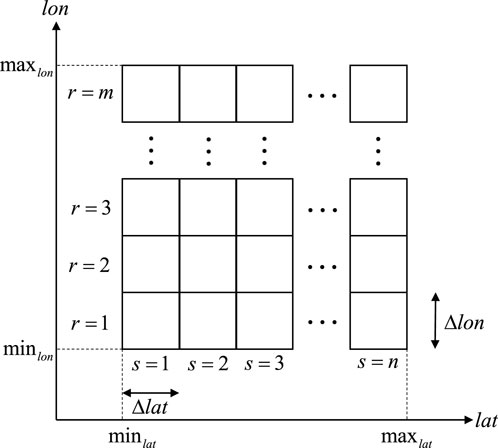
Figure 1. Construction of the spatial grid.
Following the construction of the spatial grid, all the segments of
At this stage, denoting by
and
Once that the average geographical position coordinates within the cell have been calculated, a new random variable is defined, for the cell positioned at row

Figure 2. Mean of the geographical positions inside each cell and introduction of the random variable
The random variable
in which
is the mean value of the random variable
The results obtained in terms of RSQI are subsequently plotted into the spatial grid using a monochromatic scale (grayscale), where darker shades, corresponding to higher RSQI values, indicate poor road surface quality, while lighter shades, associated with lower RSQI values, reflect good surface conditions.
3 Proposed low-cost acquisition system
For the acquisition of the data, a low-cost acquisition system, that consists of different parts, has been properly designed. Specifically, for the acquisition of the accelerations, a tri-axial digital MEMS accelerometer (model ADXL345) has been used (Figure 3a). This sensor allows to acquire a wide range of acceleration magnitudes (up to
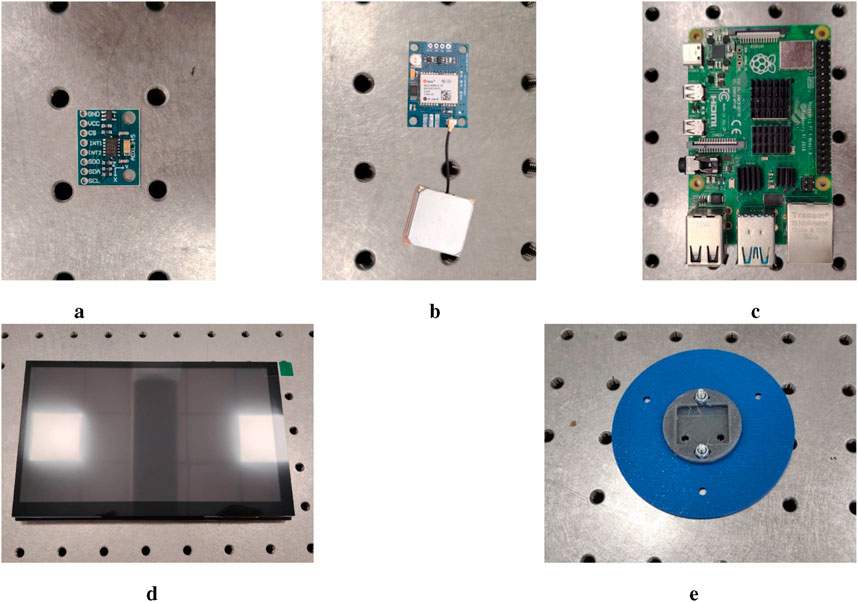
Figure 3. Components of the proposed low-cost acquisition system. (a) Tri-axial MEMS accelerometer (mod. ADXL345), (b) GNSS sensor (mod. NEO8MV2), (c) Acquisition unit (mod. Raspberry PI 4B), (d) 7″ touchscreen display, (e) 3D-printed support.
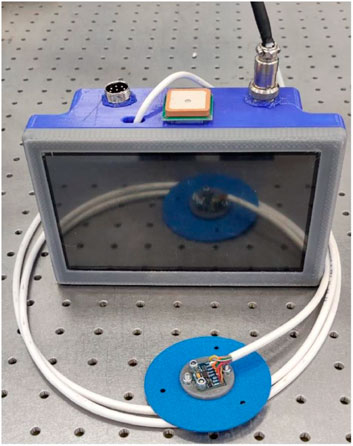
Figure 4. Proposed low-cost acquisition system.
Although designed with cost-effectiveness as a primary objective, the vibration measurement system underwent rigorous evaluation in terms of reliability and accuracy. Experimental testing was conducted at the Experimental Dynamics Laboratory of the University of Palermo by means of a comparative analysis against a conventional high-cost reference measurement system. The reference setup consisted of a PCB393B04 piezoelectric accelerometer interfaced with a NI PXIe-4497 data acquisition module, housed within an NI PXIe-1082 chassis. This equipment is widely recognized and commonly employed in high-precision vibration measurement applications.
To guarantee a reliable and consistent evaluation, both the ADXL345 accelerometer, connected to the Raspberry Pi 4B, and the PCB393B04 accelerometer were mounted on a properly designed holder. This configuration ensured that both devices were subjected to identical vibrational input. The vibration signals were generated by using an APS400 shaking table, connected to a PA 800M amplifier, in turn connected to the NI PXIe-1082 chassis. Such a configuration ensured uniform experimental conditions, eliminating potential variability in environmental factors. The complete experimental setup is illustrated in Figure 5.
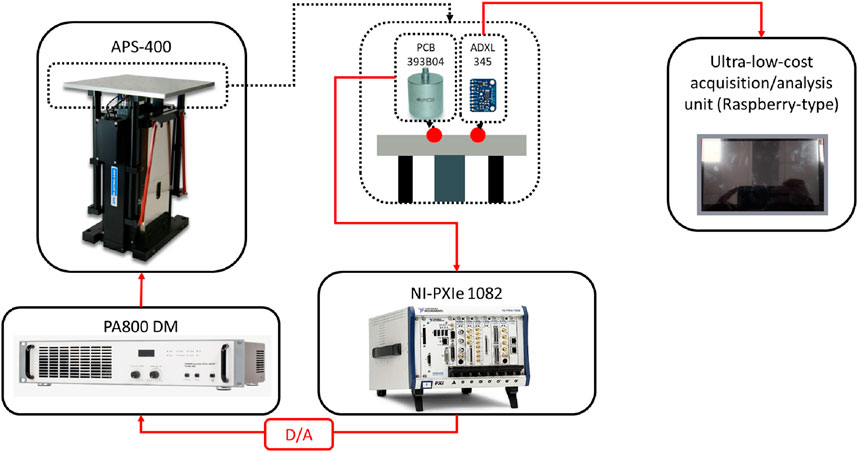
Figure 5. Experimental setup.
A series of vibration signals was generated to evaluate the reliability of the proposed system. In particular, harmonic signals of 30 s were generated at various frequencies (0.5 Hz, 1.0 Hz, 2.0 Hz, 10.0 Hz, 20.0 Hz, and 50.0 Hz) using the APS 400 shaking table and were simultaneously acquired by both accelerometers with a sampling frequency equal to 500 Hz. Before the comparison, a pre-processing of the data acquired has been performed. Specifically, the signals simultaneously acquired by both accelerometers have been filtered by using a low-pass filter (Butterworth-type) of

Figure 6. Comparison between a segment of signal recorded by the ADXL345 accelerometer (dashed line) and those obtained from the PCB393B04 accelerometer (continuous line).
This concordance is particularly noteworthy given the substantial cost difference between the two measurement systems. Consequently, the results highlight the significant potential of the proposed low-cost solution as a viable alternative for vibration measurement applications, especially in scenarios constrained by limited budgets but still demanding reliable measurement performance.
4 In-situ test
In this section, the in situ test performed in order to prove the reliability of the proposed approach is described in detail. Specifically, in Section 4.1 the information on both the experimental setup and the experimental investigation are reported, in Section 4.2 the methodology adopted is described in detail, while in Section 4.3 the results obtained are discussed also considering a comparison with IRI and classical visual-based techniques. Finally, Section 4.4 includes a discussion of the current limitations of the proposed approach, along with possible future developments aimed at enhancing its accuracy and robustness.
4.1 Setup and experimental investigation
For the in situ test, a Kia Xceed plug-in hybrid vehicle has been used (Figure 7).
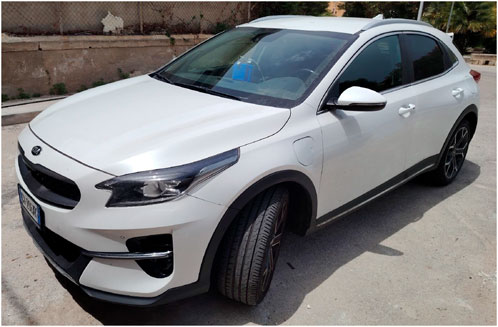
Figure 7. Plug-in hybrid vehicle used for the in situ test.
The choice of this specific vehicle allows for the minimization of vibrations induced by the engine, thereby enabling the acquisition of signals that are less affected by vibration sources unrelated to road surface quality.
The vehicle has been equipped with the acquisition system described in Section 4.1 in order to acquire, simultaneously, accelerations and position (Figure 8). Specifically, the accelerometer ADXL345 has been positioned under the seat (Figure 8a), while the acquisition unit and the GNSS receiver have been placed so as not to disturb the driver while driving (Figure 8b). Finally, a camera has been used to record video during the experimental tests, allowing to perform a comparison with visual-based methods (Figure 8c). The test route selected was the SS 624, specifically a 6.55 km section between Palermo and Altofonte, two localities in Sicily, Italy (Figure 9). This section of the road was selected for its variety of surface conditions. In fact, different types of road anomalies, such as speed bumps, potholes, bridge joints, and other surface irregularities, are present in the selected route.

Figure 8. Setup for the experimental investigation. (a) Low-cost acquisition unit, (b) ADXL345 accelerometer, (c) Camera.
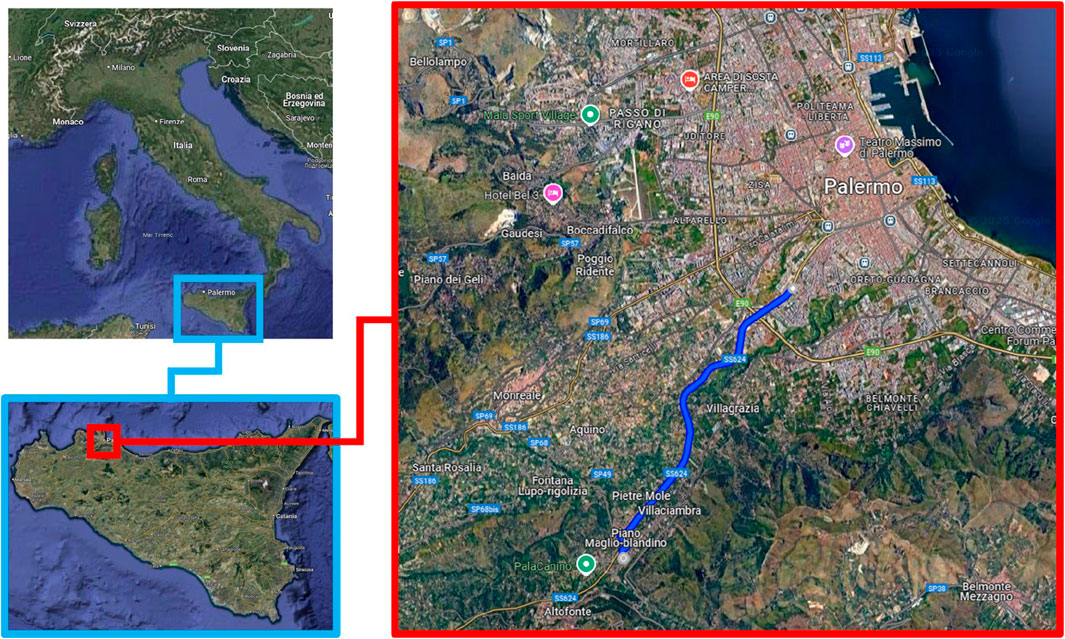
Figure 9. Palermo-altofonte route.
The route was traversed eight times in direction Altofonte and eight times in direction Palermo. Therefore, a total distance of 104.8 km has been traveled. Considering that the mean velocity of the vehicle was equal to 57.48 km/h, the total traveling time was 6,540 s (1 h and 49 min).
4.2 Methodology
The signals acquired in terms of vertical acceleration and geographic position, respectively acquired with a time sampling step
Subsequently, the Hilbert transform was applied to the filtered acceleration signals (Equation 1), and its first derivative with respect to time was computed (Equation 2). After re-discretizing
As for the spatial grid, a
For each grid cell, identified by row
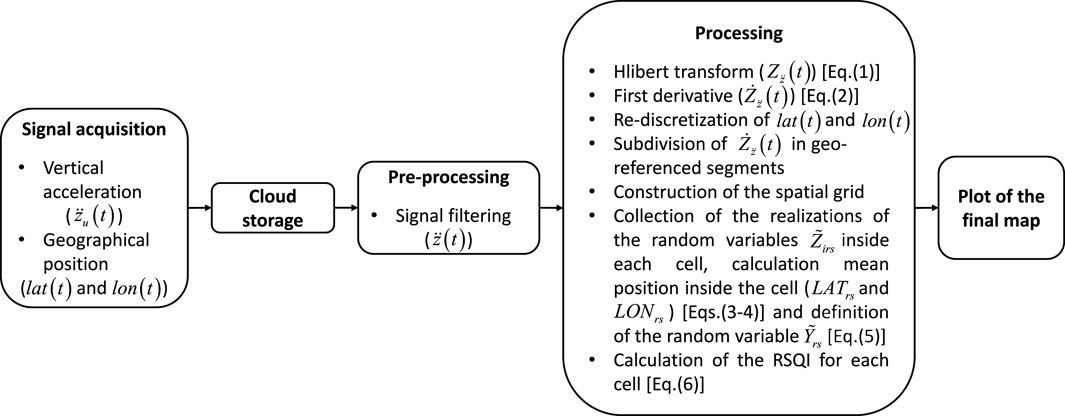
Figure 10. Flowchart of the adopted approach.
It is important to highlight that the proposed approach was initially applied to each individual run performed during the experimental tests, in order to conduct a statistical analysis aimed at quantifying the variability of the obtained results. Subsequently, two runs (specifically the second and the fifth) were excluded from the analysis due to the presence of outliers. These outliers were caused by isolated road surface anomalies located at two distinct points along the test route. In one run, the vehicle passed over the first anomaly, while in the other run it encountered the second. Since the vehicle did not traverse these anomalies during the remaining runs, the results exhibited inconsistencies that hindered a reliable interpretation of the variability across the rest of the route. Therefore, the two affected runs were removed. However, it is worth noting that in large-scale crowdsensing applications involving a high number of vehicles, the removal of such samples would not be necessary, as even isolated anomalies are likely to be detected by multiple vehicles. After removing the outliers, the statistical analysis was repeated by reapplying the proposed approach separately to each of the remaining runs, in order to assess result variability. Finally, the proposed method was applied once to the entire set of non-excluded runs combined, to obtain the final results.
4.3 Results and comparison with IRI and visual-based methods
To evaluate the reliability of the proposed approach, a comparison was performed with both the IRI computed for the same road segment and conventional visual-based methods. Specifically, the visual inspection was carried out by analyzing the video recordings acquired during the tests using the camera mounted on the vehicle, while the IRI was calculated from the filtered vertical acceleration using a simplified procedure available in the literature (Zang et al., 2018). The results obtained in terms of RSQI and IRI are presented in Figure 11.
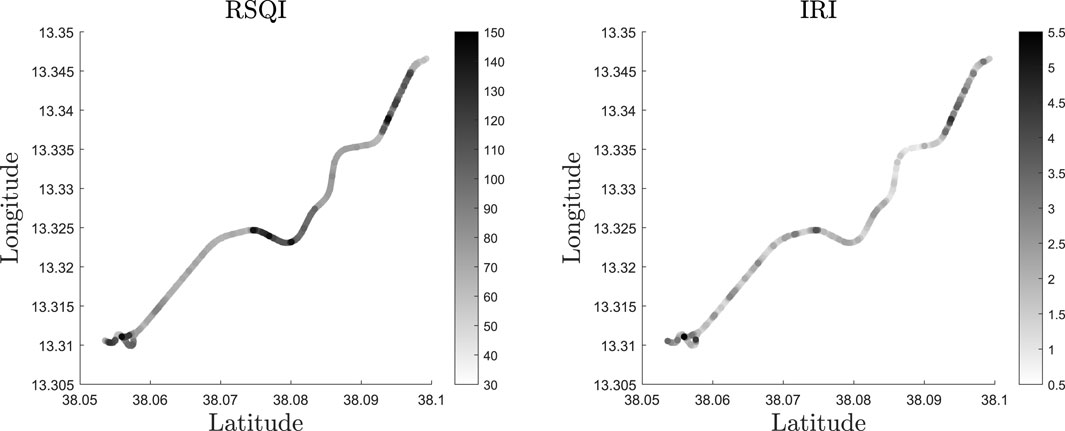
Figure 11. Results obtained in terms of RSQI (left) and IRI (right).
From the results in terms of RSQI reported in Figure 11, three distinct zones characterized by darker color shades can be identified, indicating higher RSQI values and, consequently, lower road surface quality. However, when comparing the results in terms of RSQI with those in terms of IRI, also shown in Figure 11, significant discrepancies can be immediately observed. These differences are further confirmed by the Pearson correlation analysis between the RSQI and IRI results, which yields a p-value of 0.4. Specifically, the first zone, located in the lower-left part of the plots in Figure 11, corresponds to the area closest to Altofonte and, as evidenced by the visual inspection results shown in Figure 12, it is characterized by several deteriorated bridge joints. These defects are distributed throughout almost the entire zone, as also indicated by the results in terms of RSQI. Conversely, the results in terms of IRI suggest that only few points within the same area are in poor condition, which contrasts with the findings from the visual inspections.
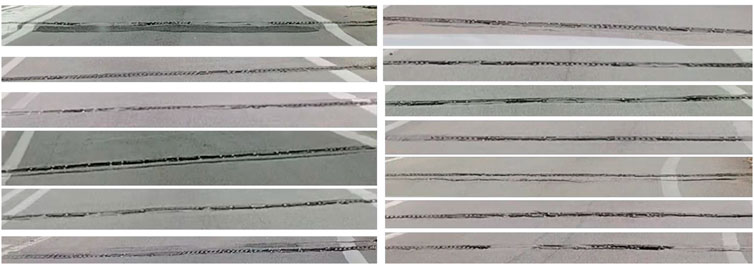
Figure 12. Deteriorated bridge joints of the first area.
The second zone, located approximately midway along the route, is also characterized by the presence of several bridge joints. As shown in Figure 13, these joints are in very poor maintenance conditions, a finding that is also confirmed by the RSQI results reported in Figure 11. In contrast, the IRI-based results suggest that this area is in relatively good condition if compared to those of the first zone, which is inconsistent with the observations from the visual inspections presented in Figure 13.
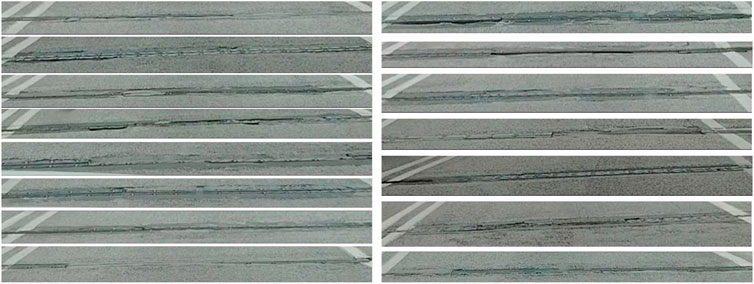
Figure 13. Deteriorated bridge joints of the second area.
The third zone, which is closest to Palermo, is characterized by severe road surface anomalies of various types, such as potholes, manholes, cracks, and asphalt discontinuities (Figure 14). In this case, both the RSQI and IRI results highlight the poor condition of the road surface, although the IRI-based results appear to slightly underestimate the severity of the actual conditions.

Figure 14. Anomalies of the road surface in the third area.
Finally, visual inspections conducted in the areas between the first and second zones and between the second and third zones revealed the presence of only a few minor anomalies. This finding is confirmed by the RSQI results and, for the area between the second and third zones, also by the IRI-based results. However, for the area between the first and second zones, the IRI results suggest road conditions comparable to, or even worse than, those observed in the second zone.
Based on the results obtained, it can be stated that the proposed approach is more effective than the IRI computed using low-cost methods based on accelerometric signal acquisition in detecting zones characterized by poor conditions of the road surface.
Further analyses were conducted to investigate the variability of the results obtained across multiple runs over the same road. In particular, Figure 15 reports the standard deviations of both RSQI and IRI computed from repeated runs.
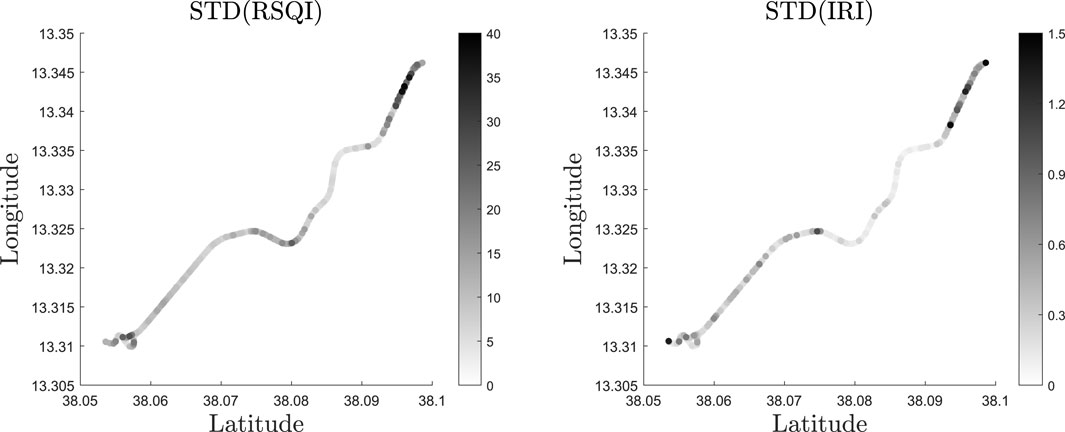
Figure 15. Standard deviation of RSQI (left) and IRI (right).
From Figure 15, it can be observed that both RSQI and IRI exhibit the largest variations in the third zone, as this area is characterized by several localized anomalies. The same figure also shows that, in the first zone, the variations in IRI, when compared with the values reported in Figure 11, are greater than those observed for RSQI, particularly at the terminal point. In the second zone, IRI exhibits smaller variations than RSQI. Finally, in the areas between the first and second zones and between the second and third zones, IRI shows slightly greater and slightly smaller variations, respectively, compared to RSQI. Overall, however, IRI appears to exhibit slightly smaller variations than RSQI.
Although the IRI computed using low-cost methods exhibits slightly smaller overall variations compared to the RSQI, the RSQI appears to be more effective in identifying areas characterized by poor road surface conditions.
4.4 Discussion
The results obtained, described in the previous section, confirm the reliability of the proposed approach for the low-cost assessment of the road surfaces quality. Nonetheless, certain aspects of the current implementation could be further improved to enhance the robustness and generalizability of the method. At present, the gravitational component is attenuated by applying a band-pass Butterworth filter to the accelerations. While this filtering strategy has proven effective in isolating the dynamic content associated with road-induced vibrations, it does not fully correct for the influence of road geometry and vehicle attitude, such as the effects of superelevation, sudden slope variations, or body roll during cornering. Future developments may address this aspect through the integration of IMU-based orientation correction or the use of compensatory mechanisms such as inclinometer data, which would allow for a more precise estimation of the true vertical component of acceleration regardless of the vehicle’s instantaneous orientation.
Similarly, the dynamic response of the vehicle to surface irregularities inherently depends on factors such as speed, suspension configuration, tire stiffness, and chassis damping. Although these dependencies are not explicitly modeled in the current RSQI formulation, their impact is expected to be mitigated by the crowdsensing strategy. Aggregating data from a wide and heterogeneous fleet of vehicles can help average out vehicle-specific dynamics and reduce individual biases. Nevertheless, future studies could explore the introduction of vehicle-specific calibration procedures or correction factors, allowing for a more refined normalization of the acceleration data and, consequently, a more consistent estimation of surface quality across different vehicle types and operating conditions.
Moreover, although the results obtained suggest that RSQI values greater than 90 indicate poor road surface conditions, it should be emphasized that future studies involving crowdsensing applications performed on a wide range of vehicles would be valuable for establishing more precise threshold values.
Finally, the proposed method currently relies on GNSS data for spatial referencing and trajectory segmentation. While this solution proves effective in most scenarios, its accuracy can be reduced in urban environments or areas with limited satellite visibility. Future enhancements may consider the integration of Assisted GNSS (A-GNSS) techniques to improve satellite signal acquisition and reliability, particularly under challenging conditions. In addition, the incorporation of topological constraints and map-matching algorithms could further increase positional accuracy by aligning the estimated trajectory with known road network geometries.
In light of these considerations, the proposed methodology provides a solid and scalable foundation for road surface quality assessment, and its current limitations, although present, do not compromise the validity of the approach. Instead, they offer clear opportunities for future enhancement through targeted extensions aimed at increasing accuracy, robustness, and applicability across a broader range of operational conditions.
5 Concluding remarks
This study presented an innovative, cost-effective methodology for the assessment of road surface quality based on vibration signals acquired using a custom-designed low-cost system. The proposed approach introduces the Road Surface Quality Index (RSQI), a novel metric derived from the Hilbert transform and its first time derivative, enabling enhanced sensitivity to surface irregularities. The introduction of georeferenced signal segments, combined in an original way to derive random variables representative of specific spatial points, enables the proposed approach to be ideally suited for crowdsensing applications involving a large number of connected vehicles, while the generation of intuitive grayscale maps supports a rapid identification of deteriorated road segments.
The good agreement between signals acquired with the low-cost system and those obtained using a high-end reference setup supports the reliability of the acquisition unit.
Experimental validations conducted along a test route in Sicily using a plug-in hybrid vehicle demonstrated the system’s capability to assess the road surface quality and the comparisons with both International Roughness Index (IRI) and visual-based methods confirmed the effectiveness of the proposed approach.
Thanks to its affordability, scalability, and suitability for crowdsensing applications, the proposed approach represents a promising solution for large-scale low-cost monitoring of the road surface quality. It can serve as a valuable decision-support tool for governmental agencies in the context of sustainable and data-driven road maintenance strategies.
Data availability statement
The raw data supporting the conclusions of this article will be made available by the authors, without undue reservation.
Author contributions
SR: Formal Analysis, Visualization, Methodology, Software, Data curation, Writing – review and editing, Validation, Writing – original draft, Conceptualization, Investigation. MM: Writing – original draft, Supervision, Project administration. SO: Writing – review and editing, Software, Investigation, Writing – original draft, Data curation. AP: Project administration, Supervision, Writing – review and editing, Writing – original draft.
Funding
The author(s) declare that financial support was received for the research and/or publication of this article. European Union - NextGenerationEU - National Sustainable Mobility Center CN00000023, Italian Ministry of University and Research Decree n.1033 -17/06/2022, Spoke 2, CUP B73C22000760001.
Conflict of interest
The authors declare that the research was conducted in the absence of any commercial or financial relationships that could be construed as a potential conflict of interest.
The author(s) declared that they were an editorial board member of Frontiers, at the time of submission. This had no impact on the peer review process and the final decision.
Generative AI statement
The author(s) declare that no Generative AI was used in the creation of this manuscript.
Any alternative text (alt text) provided alongside figures in this article has been generated by Frontiers with the support of artificial intelligence and reasonable efforts have been made to ensure accuracy, including review by the authors wherever possible. If you identify any issues, please contact us.
Publisher’s note
All claims expressed in this article are solely those of the authors and do not necessarily represent those of their affiliated organizations, or those of the publisher, the editors and the reviewers. Any product that may be evaluated in this article, or claim that may be made by its manufacturer, is not guaranteed or endorsed by the publisher.
References
Afridi, M. A., Erlingsson, S., Sjögren, L., and Englund, C. (2025). Predicting pavement condition index using an ml approach for a municipal street network. J. Transp. Eng. 151, 04025025. doi:10.1061/JPEODX.PVENG-1568
Al-Masaeid, H., Assolie, A. A., and Al-Migdady, A. (2025). Effect of pavement conditions on urban road accidents. Jordan J. Civ. Eng. 19, 74–85. doi:10.14525/JJCE.v19i1.06
Celaya-Padilla, J. M., Galván-Tejada, C. E., López-Monteagudo, F. E., Alonso-González, O., Moreno-Báez, A., Martínez-Torteya, A., et al. (2018). Speed bump detection using accelerometric features: a genetic algorithm approach. Sensors 18, 443. doi:10.3390/s18020443
Chen, S.-L., Lin, C.-H., Tang, C.-W., Liang-Ping, C., and Cheng, C.-K. (2020). Research on the international roughness index threshold of road rehabilitation in metropolitan areas: a case study in Taipei city. Sustainability 12, 10536. doi:10.3390/su122410536
Cottone, G., Pirrotta, A., and Salamone, S. (2008). Incipient damage identification through characteristics of the analytical signal response. Struct. Control Health Monit. 15, 1122–1142. doi:10.1002/stc.255
Dela Cruz, O. G., Mendoza, C. A., and Lopez, K. D. (2021). International roughness index as road performance indicator: a literature review. IOP Conf. Ser. Earth Environ. Sci. 822, 012016. doi:10.1088/1755-1315/822/1/012016
Di Matteo, A., Masnata, C., Russotto, S., Bilello, C., and Pirrotta, A. (2021). A novel identification procedure from ambient vibration data. Meccanica 56, 797–812. doi:10.1007/s11012-020-01273-4
El-Wakeel, A. S., Li, J., Noureldin, A., Hassanein, H. S., and Zorba, N. (2018). Towards a practical crowdsensing system for road surface conditions monitoring. IEEE Internet Things J. 5, 4672–4685. doi:10.1109/JIOT.2018.2807408
Guerra, K., Raymundo, C., Silvera, M., Zapata, G., and Moguerza, J. M. (2024). Pothole detection and international roughness index (iri) calculation using atvs for road monitoring. Sci. Rep. 14, 19761. doi:10.1038/s41598-024-70936-z
Hanandeh, S., Hanandeh, A., Alhiary, M., and Al Twaiqat, M. (2022). Application of soft computing for estimation of pavement condition indicators and predictive modeling. Front. Built Environ. 8, 895210. doi:10.3389/fbuil.2022.895210
Ibragimov, E., Kim, Y., Lee, J. H., Cho, J., and Lee, J.-J. (2024). Automated pavement condition index assessment with deep learning and image analysis: an end-to-end approach. Sensors 24, 2333. doi:10.3390/s24072333
Ivanova, E., and Masarova, J. (2013). Importance of road infrastructure in the economic development and competitiveness. Econ. Manag. 18, 263–274. doi:10.5755/j01.em.18.2.4253
Kim, Y. M., Kim, Y. G., Son, S. Y., Lim, S. Y., Choi, B. Y., and Choi, D. H. (2022). Review of recent automated pothole-detection methods. Appl. Sci. 12, 5320. doi:10.3390/app12115320
Koch, C., and Brilakis, I. (2011). Pothole detection in asphalt pavement images. Adv. Eng. Inf. 25, 507–515. doi:10.1016/j.aei.2011.01.002
Koch, C., and Brilakis, I. (2018). Road damage detection and classification using deep neural networks with smartphone images. Computer-Aided Civ. Infrastructure Eng. 33, 1017–1141. doi:10.1111/mice.12387
Lebaku, P. K. R., Gau, L., Sun, J., Wang, X., and Kang, X. (2025). Assessing the influence of pavement performance on road safety through crash frequency and severity analysis. Int. J. Pavement Res. Technol. doi:10.1007/s42947-025-00568-7
Lee, D.-y., Yoo, H.-j., Lee, J.-y., and Jeong, G.-o. (2025). Development of a bicycle road surface roughness and risk assessment method using smartphone sensor technology. Sensors 25, 3520. doi:10.3390/s25113520
Li, D., Zhang, H., Chen, L., Zhou, Y., Li, Y., Qian, R., et al. (2025a). Rural road surface distress detection algorithm based on mask r-cnn with data augmentation. Front. Built Environ. 11, 1566979. doi:10.3389/fbuil.2025.1566979
Li, J., Wang, L., Miao, Y., Tong, X., and Ye, Z. (2025b). Road roughness detection based on discrete kalman filter model with driving vibration data input. Int. J. Pavement Res. Technol. 18, 480–492. doi:10.1007/s42947-023-00359-y
Lo Iacono, F., Navarra, G., and Pirrotta, A. (2012). A damage identification procedure based on hilbert transform: experimental validation. Struct. Control Health Monit. 19, 146–160. doi:10.1002/stc.432
Luo, D., Lu, J., and Guo, G. (2020). Road anomaly detection through deep learning approaches. IEEE Access 8, 117390–117404. doi:10.1109/ACCESS.2020.3004590
Magdy, S., Rowan Ahmed, E., Hassan, G., and Wael, A. B. (2025). Explainable and economical ai-based approach for pci assessment. Int. J. Pavement Eng. 26, 2531195. doi:10.1080/10298436.2025.2531195
Mahlberg, J. A., Li, H., Zachrisson, B., Mathew, J. K., and Bullock, D. M. (2023). Applications of using connected vehicle data for pavement quality analysis. Front. Future Transp. 4, 1239744. doi:10.3389/ffutr.2023.1239744
Martinez-Ríos, E. A., Bustamante-Bello, M. R., and Arce-Sáenz, L. A. (2022). A review of road surface anomaly detection and classification systems based on vibration-based techniques. Appl. Sci. 12, 9413. doi:10.3390/app12199413
Múčka, P. (2017). International roughness index specifications around the world. Road Mater. Pavement Des. 18, 929–965. doi:10.1080/14680629.2016.1197144
Nguyen, V. K., Éric, R., and Milocco, R. (2019). Environment monitoring for anomaly detection system using smartphones. Sensors 19, 3834. doi:10.3390/s19183834
Pirrotta, A., and Russotto, S. (2023). A new oma method to perform structural dynamic identification: numerical and experimental investigation. Acta Mech. 234, 3737–3749. doi:10.1007/s00707-023-03558-7
Radwan, M. M., Faris, S. A., Barakat, A. Y., and Mousa, A. (2025). Distress-based pavement condition assessment using artificial intelligence: a case study of Egyptian roads. Eng 6, 114. doi:10.3390/eng6060114
Rijal, P. H., and Medis, S. S. (2019). Study of pavement condition index (Pci) relationship with international roughness index (iri) on flexible pavement. MATEC Web Conf. 258, 03019. doi:10.1051/matecconf/201925803019
Sattar, S., Li, S., and Chapman, M. (2018). Road surface monitoring using smartphone sensors: a review. Sensors 18, 3845. doi:10.3390/s18113845
Sattar, S., Li, S., and Chapman, M. (2021). Developing a near real-time road surface anomaly detection approach for road surface monitoring. Measurement 185, 109990. doi:10.1016/j.measurement.2021.109990
Sayers, M. W., Gillespie, T. D., and Queiroz, C. A. V. (1986). “Guidelines for the conduct and calibration of road roughness measurements,” in Tech. Rep., WTP - 46. Washington D.C., U.S.A: World Bank.
Setiawan, E. B., and Nurdin, H. (2019). Road quality assessment using international roughness index method and accelerometer on android. LONTAR KOMPUT. 10, 62–73. doi:10.24843/LKJITI.2019.v10.i02.p01
Varona, B., Monteserin, A., and Teyseyre, A. (2020). A deep learning approach to automatic road surface monitoring and pothole detection. Personal Ubiquitous Comput. 24, 519–534. doi:10.1007/s00779-019-01234-z
Virin, A., Khongsomchit, L., and Kaewunruen, S. (2025). Deep learning application to roughness classification of road surface conditions through an e-scooter’s ride quality. Front. Built Environ. 11, 1497331. doi:10.3389/fbuil.2025.1497331
Wang, P., Hu, Y., Dai, Y., and Tian, M. (2017). Asphalt pavement pothole detection and segmentation based on wavelet energy field. Math. Problems Eng. 2017, 1604130. doi:10.1155/2017/1604130
Wu, Y., Zhang, Q., Wang, Y., and Zhu, X. (2025). Advanced hybrid cnn-gru model for iri prediction in flexible asphalt pavements. J. Transp. Eng. Part B Pavements 151, 04025003. doi:10.1061/JPEODX.PVENG-1570
Xiaoyan, D., Guihong, G., Bori, C., Zheng, C., and Longting, D. (2023). Analysis of the correlation between the pavement structure combinations and pavement performance using experimental sections. Front. Energy Res. 11, 1295404. doi:10.3389/fenrg.2023.1295404
Yu, J., Chou, E. Y. J., and Yau, J.-T. (2006). Development of speed-related ride quality thresholds using international roughness index. Transp. Res. Rec. J. Transp. Res. Board 1974, 47–53. doi:10.1177/0361198106197400106
Keywords: low-cost monitoring, road surface quality, hilbert transform, vibrations, crowdsensing
Citation: Russotto S, Migliore M, Orlando S and Pirrotta A (2025) A low-cost system for the assessment of the road surface quality. Front. Built Environ. 11:1656913. doi: 10.3389/fbuil.2025.1656913
Received: 02 July 2025; Accepted: 26 August 2025;
Published: 10 September 2025.
Edited by:
Sakdirat Kaewunruen, University of Birmingham, United KingdomReviewed by:
David Llopis-Castelló, Universitat Politècnica de València, SpainHadyan Hafizh, Sunway University, Malaysia
Copyright © 2025 Russotto, Migliore, Orlando and Pirrotta. This is an open-access article distributed under the terms of the Creative Commons Attribution License (CC BY). The use, distribution or reproduction in other forums is permitted, provided the original author(s) and the copyright owner(s) are credited and that the original publication in this journal is cited, in accordance with accepted academic practice. No use, distribution or reproduction is permitted which does not comply with these terms.
*Correspondence: Salvatore Russotto , c2FsdmF0b3JlLnJ1c3NvdHRvMDFAdW5pcGEuaXQ=