 Eriko Dewangga
 Alfrendo Satyanaga
 Rezat Abishev
 Anar Arinova
 Aiym Muratova
 Yongmin Kim
 Jong Kim
- 1Department of Civil and Environmental Engineering, School of Engineering and Digital Sciences, Nazarbayev University, Astana, Kazakhstan
- 2James Watt School of Engineering, University of Glasgow, Glasgow, United Kingdom
In the context of climate change and urban expansion, understanding unsaturated soil behavior is critical for designing resilient infrastructure. Soil moisture retention influences stormwater management, structural performance, and the effectiveness of green infrastructure. This study focuses on the influence of soil density and water content on soil-water characteristic curve (SWCC) and soil pore-size distribution. Engineered soil from Astana, Kazakhstan, was tested under varying compaction conditions: at optimum water content (OWC), wet of optimum, and dry of optimum. SWCCs were measured using Tempe cell (0–100 kPa) and WP4C (100–300 MPa). Pore-size distributions (PSD) were derived using the Fredlund and Xing equation and analyzed with scanning electron microscopy (SEM), while mineral content was determined via X-ray diffraction (XRD). Results showed that soil compacted at OWC and dry of optimum exhibited bimodal SWCCs, while wet-compacted soil showed unimodal behavior. Increased dry density resulted in reduced air entry value (AEV) and water content, while lower density led to larger dominant pore sizes and higher matric suction. These findings offer practical insights into sustainable urban living. Understanding SWCC behavior supports the design of climate-adaptive infrastructure, such as bioretention systems, permeable pavements, and vegetated swales. Optimizing soil compaction can enhance water retention and reduce flood risk, particularly in semi-arid, climate-sensitive regions like Astana. Integrating these soil mechanics principles into urban planning contributes to long-term resilience and more sustainable city development.
1 Introduction
To build climate-resilient cities, it is essential to understand how urban soils respond to extreme weather events, such as intense rainfall and prolonged droughts. Adaptation strategies like slope stabilization, rainwater harvesting, and nature-based solutions rely on accurate predictions of soil-water interactions. Incorporating unsaturated soil behaviour into urban planning can improve flood mitigation, erosion control, and green infrastructure, especially as climate extremes become more frequent (Li et al., 2024; Zhai et al., 2024).
Unsaturated soils—found above the water table—exhibit negative pore-water pressure (matric suction), which plays a key role in maintaining slope stability (Amantay et al., 2023). During dry periods, suction increases soil strength, but this stabilizing effect decreases during rainfall, raising the risk of slope failure (Jeong et al., 2015). This is particularly concerning in tropical and semi-arid regions where rainfall-induced slope failures are common.
A key tool in evaluating unsaturated soil behaviour is the soil-water characteristic curve (SWCC), which defines the relationship between water content and matric suction. The SWCC informs critical parameters such as shear strength, permeability, and volume change, vital for climate-resilient geotechnical design (Zhai et al., 2023). Raghuram et al. (2020) experimentally investigated the influence of fines content on the hysteretic behavior of SWCCs of reconstituted soils, developed regression models to predict SWCC fitting parameters, and proposed a formulation to quantify hysteresis, with validation against independent soil data. Raghuram et al. (2024) examined how sample size and dry unit weight affect the SWCCs and slope stability of expansive soils, showing that higher dry unit weight significantly increases matric suction and the factor of safety of unsaturated finite slopes, thereby underscoring the critical role of compaction in geotechnical design and slope management. Raghuram et al. (2023) investigated the influence of anisotropy and remolding on SWCCs of soils with varying plasticity, showing that combining HYPROP and WP4C data yields more accurate SWCCs, with remolding and compaction conditions significantly affecting fitting parameters and finite slope stability, while anisotropy has minimal impact.
Soil density significantly influences the SWCC: higher dry density leads to smaller and tightly packed pores, while lower density results in faster desaturation due to larger pore spaces. Peng et al. (2020) developed a finite element model that integrates unsaturated soil mechanics and compaction effects to simulate flexible pavement performance under varying humidity and stress conditions. Results showed that moisture distribution significantly alters the resilient modulus of subgrade soils, leading to notable changes in pavement deflection, tensile stress, and compressive strain, which directly influence long-term road performance. Yao et al. (2021) investigated how stress and compaction influence the soil water retention curve of granite residual soil and their effects on pavement subgrade performance. Results showed that stress-dependent water retention and lower compaction levels amplify suction changes during rainfall and evaporation, leading to greater ground heave and settlement, which are critical for reliable pavement design.
Despite its importance, the effect of compaction state (dry of optimum, optimum, and wet of optimum) on SWCC shape and hysteresis is not well-documented. Laboratory testing of SWCC, particularly in fine-grained soils, can be time-consuming and produce limited data, which increases the likelihood of interpolation errors.
Closely related to SWCC is pore-size distribution (PSD), which quantifies soil porosity and controls water movement. PSD categorizes pores as micropores (<0.2 µm), small pores (0.2–2 µm), mesopores (2–50 µm), and macropores (>50 µm) (Chua et al., 2022). Micropores retain water, mesopores facilitate capillary action, and macropores drain quickly. Soil density alters PSD by reducing macropore volume and shifting the distribution toward smaller pores, impacting both permeability and water retention (Li et al., 2023).
Previous studies often examined SWCC and PSD independently and lacked integration of pore-scale observations (e.g., SEM) with hydraulic behaviour. This study addresses that gap by exploring how soil density and initial water content jointly influence both SWCC and PSD, aiming to enhance predictive models for sustainable, climate-adaptive urban geotechnical design.
2 Applicable theories
Various mathematical models have been presented to best match or forecast SWCC, which is crucial for the development of unsaturated soils. In this study, Satyanaga et al. (2013) (Equation 1) was used to model bimodal SWCC while Satyanaga et al. (2017) (Equation 2) was used to model unimodal SWCC since the parameters of their models are able to adequately represents the variables in the SWCC.
Where:
The pore-size distribution (PSD) of the soil mixtures can be estimated from SWCC proposed by Fredlund and Xing (1994). The water loss resulting from matric suction is described by the SWCC’s slope. To put it another way, the fitted SWCC equation might be differentiated to determine the water volume variation in the two corresponding matric suctions. To derive the PSDs of the soil mixtures, the equations suited to the SWCCs should be differentiated as shown in Equation 3. The pore radius at a particular matric suction may be estimated to be applying the equation of Kelvin (Fredlund et al., 2012), which is illustrated in Equation 4, presuming that soil pores are identical to cylindrical flow channels.
Where:
Where:
3 Methodology
This study investigated engineered soil samples collected near Nazarbayev University on Turan Avenue in Astana, Kazakhstan. Three specific compaction states were selected for analysis: soil compacted dry of optimum moisture content (AS1), at optimum moisture content (AS2), and wet of optimum (AS3). These samples were used to assess physical, mechanical, and hydraulic behavior under varying moisture conditions. The findings are directly applicable to road and pavement engineering in this area, as they provide insight into how local soils respond to compaction and moisture fluctuations, which is essential for predicting pavement performance, preventing excessive settlement, and improving long-term durability under Kazakhstan’s harsh freeze–thaw and rainfall conditions.
The grain-size distribution of Astana soil and sand-kaolin mixtures was determined following ASTM D6913M-17 (2009) standards. This test helped define whether the soil was coarse- or fine-grained and allowed classification according to ASTM D2487-17 (2017). A sieve analysis was conducted and presented in Figure 4 to categorize the soil. Additionally, Atterberg limits, including plastic and liquid limits, were obtained using ASTM D4318–17 (2017) to evaluate the plasticity characteristics of the soil. The Standard Proctor test (ASTM D698–12, 2012) was performed to determine each soil’s optimum moisture content and maximum dry density. The three compaction conditions (dry of optimum, optimum, and wet of optimum) were selected to investigate both unimodal and bimodal behaviors of the compacted soils. Soil samples were conditioned to OMC, 2%–3% dry of optimum, and 2%–3% wet of optimum, sealed, and equilibrated for 24 h. They were compacted in cylindrical molds (100 mm × 127 mm) in 3 layers for Standard Proctor (600 kN·m/m3) or 5 layers for Modified Proctor (2,700 kN·m/m3), then trimmed to the required specimen sizes. After compaction, specimens were wrapped to prevent moisture loss and cured for 7 days before testing.
To examine the Soil-Water Characteristic Curve (SWCC), two experimental approaches were applied: the Tempe cell method for matric suctions under 100 kPa, and the WP4C dewpoint potentiometer for a broader suction range. The Tempe cell setup utilized a one-bar ceramic disc, O-ring seals, a top and base cap, and wing nut clamps. Before testing, the ceramic disc was fully saturated in distilled water using a vacuum pyrometer to ensure accuracy. The soil sample was saturated by submerging the cell in purified water until the moisture content reached at least 95%, at which point the sample was considered saturated (Satyanaga et al., 2022). After saturation, the saturated soil and cell were weighed. An air pressure pump was then connected to the inlet tube, and pressure was applied gradually using a low vacuum manifold system to induce matric suctions of 0.5, 1, 3, 5, 10, 10, 20, 30, 40, 50, 70, 90, and 100 kPa. To maintain saturation of the ceramic disc during the test, the Tempe cell’s base was placed in a water reservoir. This prevented air intrusion, provided the pressure remained below the air-entry value of the disc. In previous studies on soil–water characteristic curve (SWCC) testing, it was found that allowing sufficient time for the soil specimen to equilibrate after each applied suction step was critical for obtaining reliable measurements. When a 2-day interval between pressure increments was used, specimens—particularly fine-grained soils with low hydraulic conductivity—achieved more complete equilibrium, which reduced errors from incomplete drainage or wetting. Soil is considered to achieve equilibrium condition if the water volume change is constant. As a result, the SWCC data were more consistent and reproducible, with each suction value more accurately reflecting the true moisture retention behavior of the soil. The same procedure was applied in the SWCC testing in this study.
For higher suction values, the WP4C dewpoint potentiometer was used. This device uses a chilled mirror to measure water potential based on relative humidity. The measurement range extends from 0 to 300 MPa with a precision of ±0.05 MPa for 0–5 MPa and 1% for 5–300 MPa. The device includes a sealed chamber with a mirror, fan, and sensors. A laser beam detects the dew point temperature by identifying the first point of condensation, enabling fast and accurate suction readings. All tests were conducted at a controlled temperature of 25 °C for consistency. Prior to testing, the WP4C was calibrated using standard salt solutions of known osmotic potential (e.g., LiCl), as recommended by Bello et al. (2025). This calibration procedure ensures that the sensor response aligns with reference values, minimizing systematic errors. The calibration was repeated regularly during the experimental program to account for potential drift in sensor performance. All tests were conducted at a controlled temperature of 25 °C for consistency.
Finally, Scanning Electron Microscopy (SEM) was conducted using a ZEISS Crossbeam 540 to observe the microstructure of the samples. SEM provides high-resolution imaging up to ×300,000 magnification. To prepare samples, a 10 nm thick gold coating was applied to ensure conductivity and prevent surface charging, enabling consistent imaging quality.
4 Results
Table 1 represents the index properties of three Astana soil samples. Astana soil was classified as “clayey sand” (SC) according to the Unified Soil Classification System (USCS). The percentage of gravel, sand and fines can be seen in Figure 1. Soil plasticity index was 20.25%, with a plastic limit of 19.33% and a liquid limit of 39.58%. The intersection of plasticity index and liquid limit on the plasticity chart showed that the fines were classified as “low plasticity clay” (CL). The maximum dry density of soil was 1.9 g/m3. The specific gravity of Astana soil was 2.5.
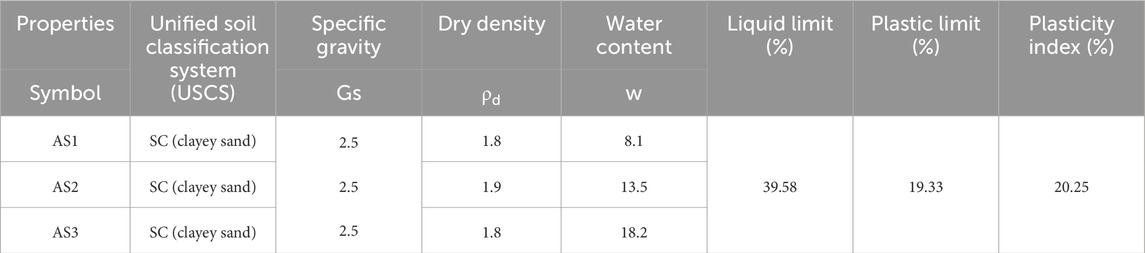
Table 1. Index properties of Astana soil (AS1, AS2 and AS3).
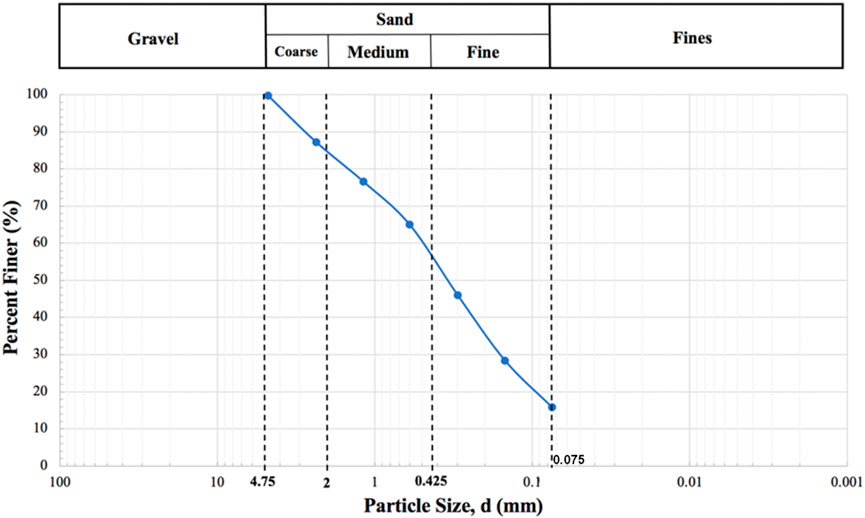
Figure 1. GSD of Astana soil.
The compaction curve indicating the five compaction tests on Astana soil with 4, 8, 10, 15 and 20 percent of water content were carried out to define the maximum dry density (MDD) and optimum water content (OWC). The optimum moisture content and maximum dry density were determined as 13.5% with 1.9 g/m3 as illustrated in Figure 2. Moreover, ninety-five percent of MDD on dry of optimum and wet of optimum was defined as 1.8 g/m3 with water contents of 8.1% and 18.2%, respectively. Thus, three cases with three different dry densities and moisture contents were considered in further laboratory experiments.
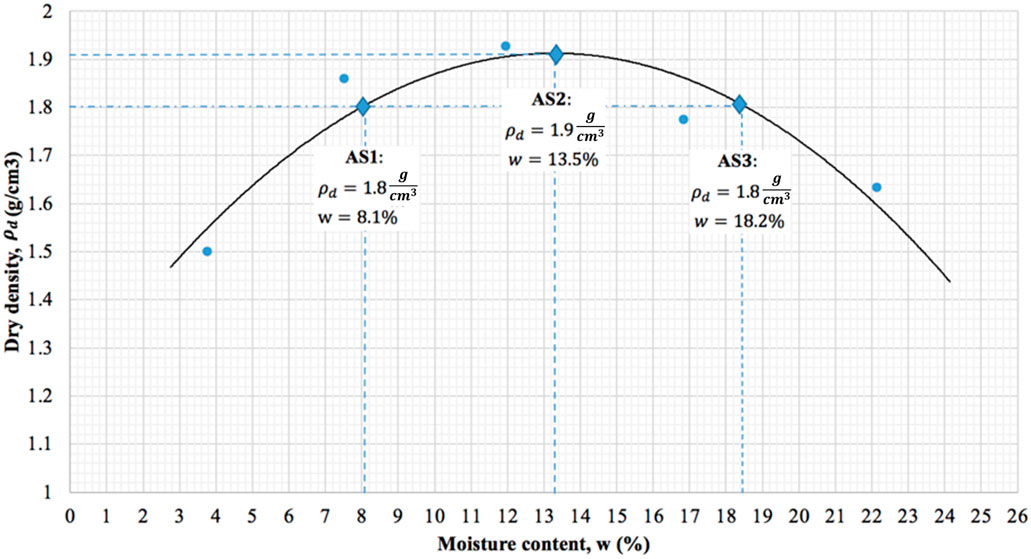
Figure 2. Compaction curve of Astana soil samples.
From the laboratory experiments using Tempe cell and WP4C, the SWCCs of Astana soil and sand-kaolin mixtures were created. To generate the SWCC of AS1 (soil sample at dry of optimum) the same laboratory test was conducted. AS1 had an initial dry density of 1.8 g/m3 in accordance with 95% of MDD on the dry of optimum with 8.1% of water content. The SWCC of AS1 is illustrated in Figure 3. The SWCC occurred to be bimodal, thus Equation 1 was applied to best fit the data. Thus, soil sample AS1 displays bimodal SWCC features, with first and second saturated volumetric water content (VWC) (θ_s1and θ_s2), 1st and 2nd air-entry value (AEV, Ψa1 and Ψa2) and two inflection points (Ψm1 and Ψm2). Table 2 shows the Satyanaga et al. (2013) parameters used to best fit the curve. The best fitting parameters such as Ψa1, Ψa2, Ψm1, Ψm2, s_1 and s_2 were 5 kPa, 6,500 kPa, 15 kPa, 25,000 kPa, 2 and 2, respectively.
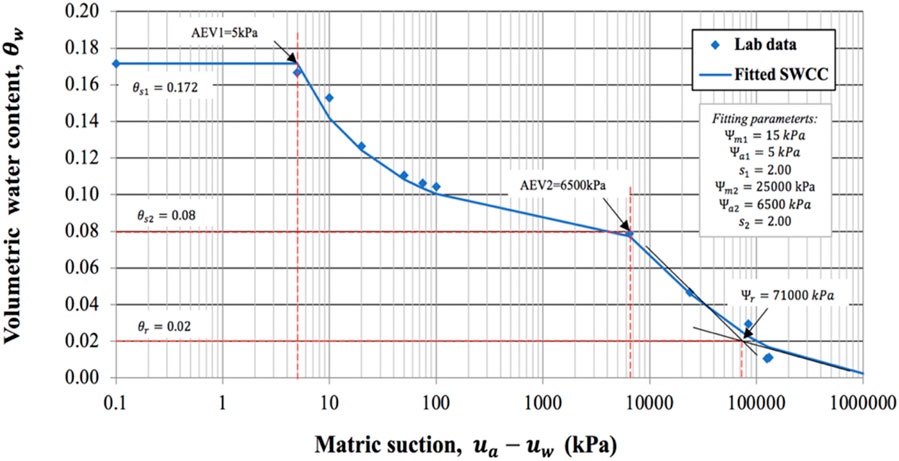
Figure 3. SWCC of AS1.
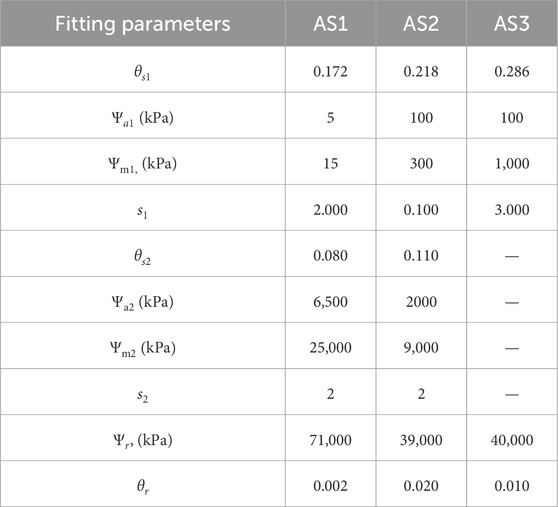
Table 2. Satyanaga et al. (2013) best fitting parameters of AS1, AS2 and AS3.
The relationship between matric suction and volumetric moisture content of soil sample with MDD 1.9 g/m3 and optimum moisture content 13.5% is illustrated in Figure 4. The laboratory data of SWCC of AS2 were best fitted using Equation 1 for bimodal curves as SWCC of the soil sample AS2 was bimodal. Table 2 presents the best fitting parameters used in Equation 2. To apply the Equation 2 for generating SWCC, each parameter requires an appropriate initial value (Satyanaga et al., 2017). All the parameters were determined using non-linear regression with the iterations method that is available in the Microsoft Excel software in order to best fit Equation 1 to the data from the lab of the SWCC (Suhaizan et al., 2025).
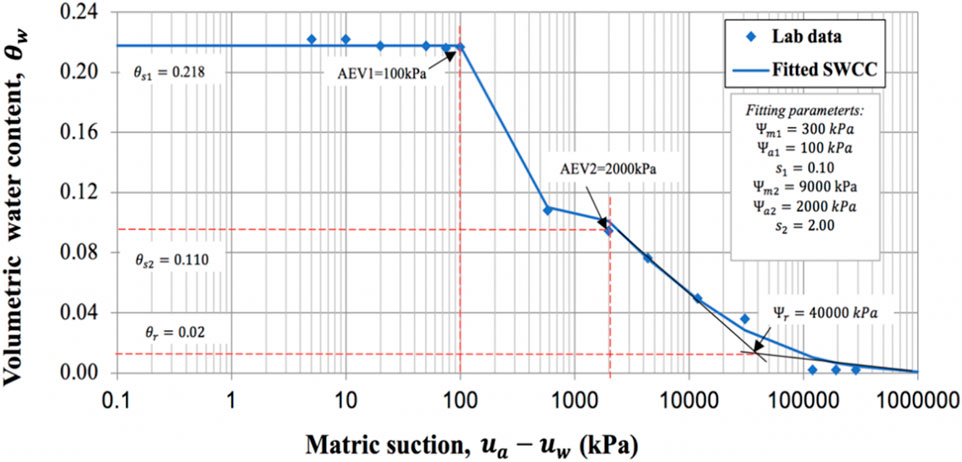
Figure 4. SWCC of AS2.
As can be seen from the figures, SWCCs of AS1 and AS2 appeared to be bimodal and similar in shape. The first and second saturated VWC (θ_s1, θ_s2) of AS2 was 0.218 and 0.110, whereas the saturated VWC of AS1 showed lower value of 0.172 and 0.095, respectively. Additionally, the first AEV (Ψa1) of AS2 was 100 kPa, which was higher than first AEV of AS1, which was 7 kPa. However, the second AEV (Ψa2) of AS1 showed higher value than the second AEV of AS2. First and second matric suction (Ψm1, Ψm2) of AS1 and AS2 at inflection points were determined as 300 and 9,000 kPa, 15 and 25,000 kPa, respectively.
As illustrated in Figure 5, the SWCC of soil sample AS3 was found to be unimodal. AS3 had an initial dry density of 1.8 g/m3 in accordance with 95% of MDD on the wet of optimum with 18.2% of water content. For this case, Equation 2 for modelling unimodal curve was applied to the best fit. Table 2 shows the Satyanaga et al. (2017) best fitting parameters used in Equation 2. The saturated VWC (θ_s) of soil at wet of optimum was equal to 0.286, while the residual water content (θ_r) was equal to 0.010. Moreover, the AEV (Ψ_a) and suction at inflection point (Ψ_m) were determined as 100 kPa and 1,000 kPa, respectively.
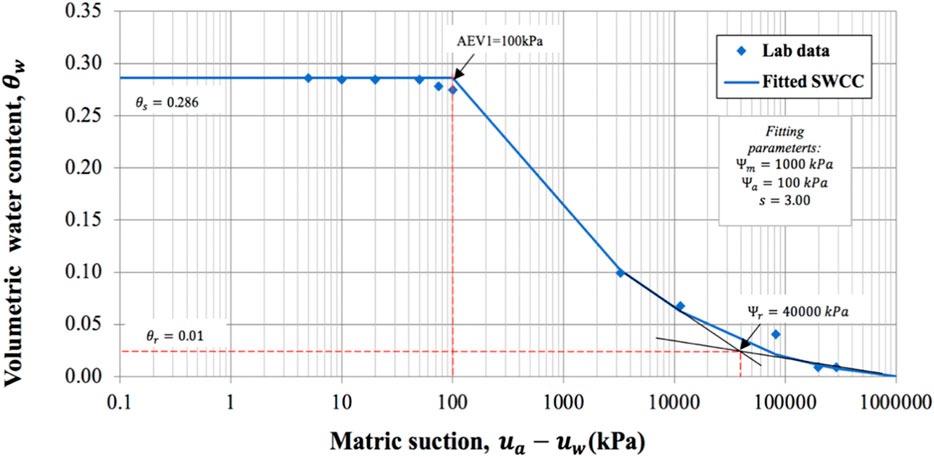
Figure 5. SWCC of AS3.
As expected, pore-size distribution (PSD) graphs were also generated as bimodal for samples compacted dry of optimum (AS1) and optimum moisture content (AS2). While pore-size distribution graph for sample compacted wet of optimum (AS3) occurred as unimodal. The differentiated equation of Satyanaga et al. (2022) was used to construct PSD for bimodal case, while the differentiated equation of Satyanaga et al. (2025) was used for unimodal one. The peak values of PSD of AS1 appeared at 0.000035 mm and 0.02 mm (Figure 6). The peaks of PSD of AS2 appeared at 0.0006 mm and 0.004 mm (Figure 7). Whereas for AS3 case, the peak occurred at 0.00045 mm (Figure 8).
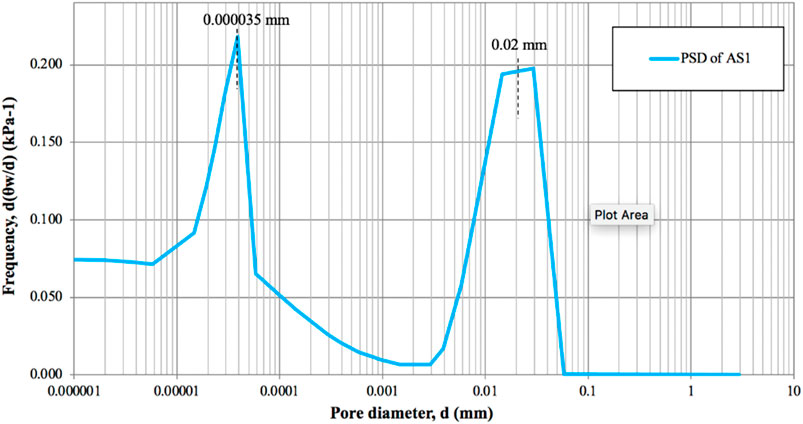
Figure 6. PSD of AS1.
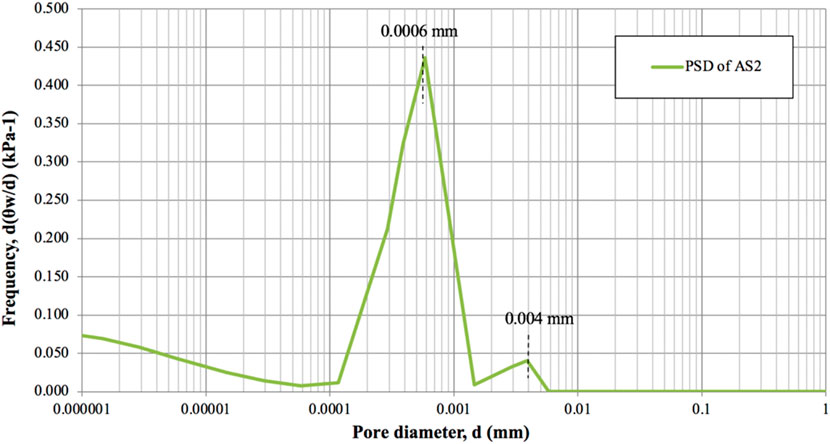
Figure 7. PSD of AS2.
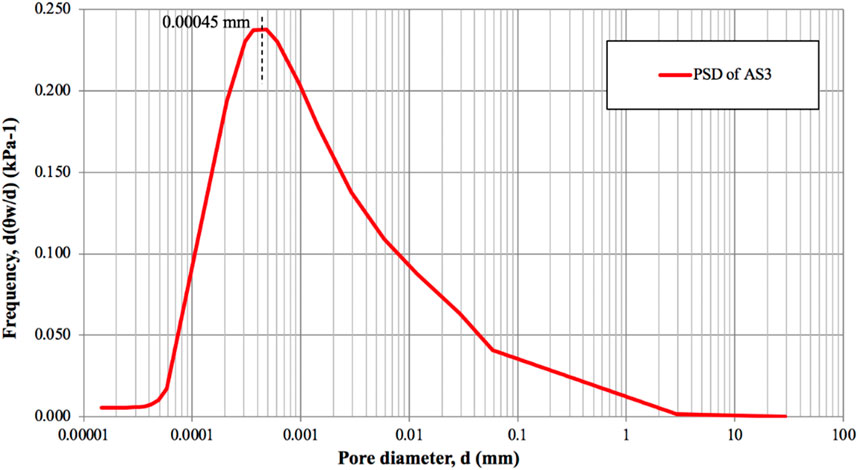
Figure 8. PSD of AS3.
To see the microstructure of the Astana soil samples scanning-electron microscopy was conducted for before drying, after drying and wetting stages. The 5K magnification pictures are illustrated in Figures 9–11, respectively. SEM analysis of Astana soil samples proved that compacted samples contain bimodal pore characteristics. The figures demonstrate that intergranular pores are ten to twenty times larger than intragranular pore spaces. The intergranular pore diameters of the sample compacted wet of optimum were bigger than samples at OMC and samples compacted dry of optimum. Likewise, the sample compacted at wet OMC had higher intergranular pore size than the sample compacted at OMC.

Figure 9. SEM pictures of sample AS1: (a) before drying (b) after drying (c) wetting.
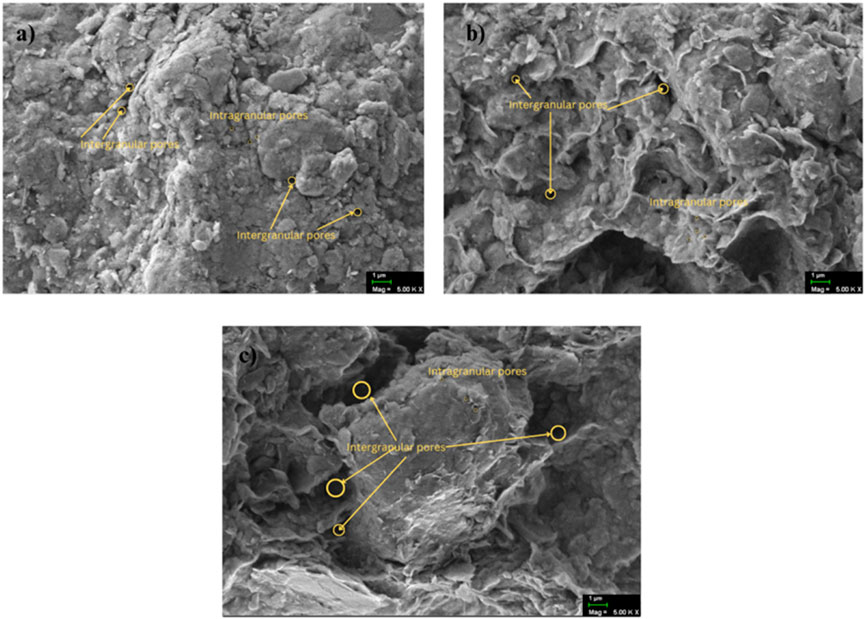
Figure 10. SEM pictures of sample AS2: (a) before drying (b) after drying (c) wetting.
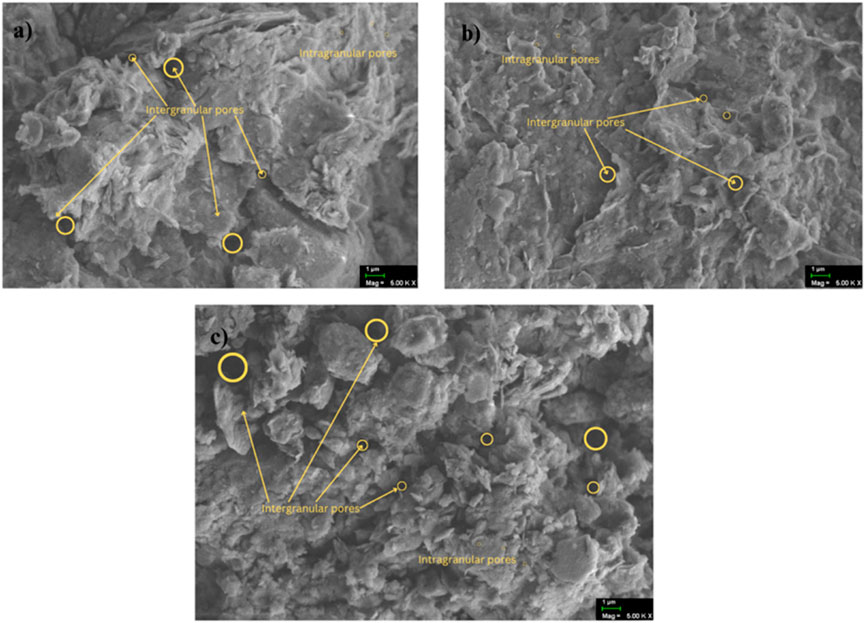
Figure 11. SEM pictures of sample AS3: (a) before drying (b) after drying (c) wetting.
5 Discussion
Statistically examination of different kinds of pore volume is able to calculate different pore volumes for specimens of varying densities. Pore size was analyzed quantitatively using four categories: micropores (d < 0.00002 mm), small pores (0.00002 mm < d < 0.00018 mm), mesopores (0.00018 mm < d < 0.00078 mm), and macropores (d > 0.00078 mm) (Brewer, 1964; McNaught and Wilkinson, 2006). The percentage of each pore is illustrated in Figure 12. Moreover, the percentage of micropore, small pore, mesopore and macropore were computed. In sample AS1 with 8% of water content, the percentage of micropore, small pore, mesopore and macropore were 33%, 19%, 15% and 33%. In sample AS2 with water content of 13.5%, the percentage of micropore, small pore, mesopore and macropore were 26%, 11%, 11% and 52%. In sample AS3 with a water content of 18.2%, the percentage of micropore, small pore, mesopore and macropore were 22%, 26%, 19% and 33%, respectively. The micropore percentage of sample AS2 with water content of 13.5% gradually decreased in comparison with the sample with water content of 8%; the percentage of sample with water content of 18.2% did not change significantly, meaning that after micropores attain a specific limit, compacting does not form micropores (Zhang et al., 2019). The pore diameters with maximum frequency of Astana soil samples are presented in Table 3. The maximum frequency of samples AS1, AS2 and AS3 decreased as the matric suction of samples increased.
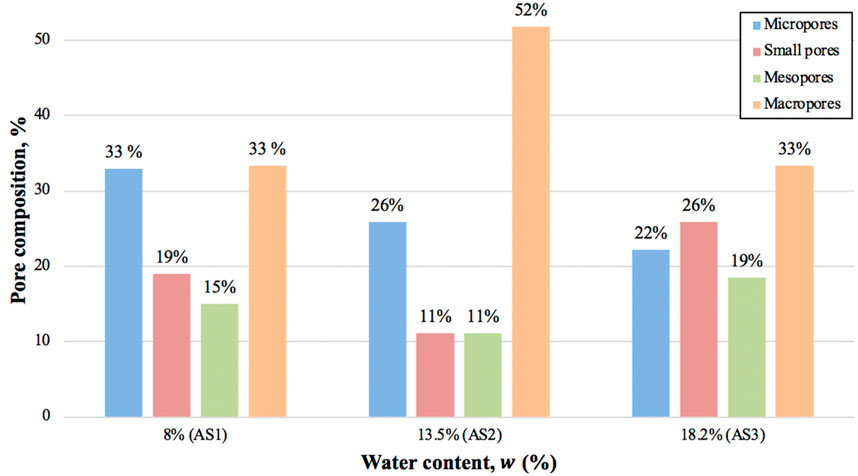
Figure 12. Pore structure composition.
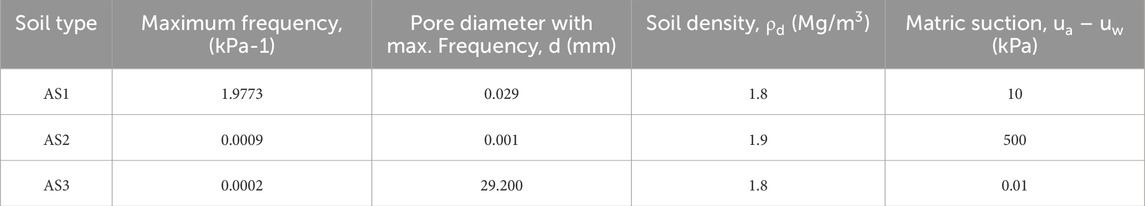
Table 3. Pores with maximum frequency of Astana soil samples.
In road engineering applications, these findings are important because pore structure directly affects hydraulic conductivity, moisture retention, and deformation behavior of subgrade soils. For example, higher macropore content, as observed in AS2, facilitates rapid drainage but may reduce strength under wet conditions, whereas a greater proportion of micropores improves water retention but can lead to swelling and reduced stiffness. Understanding these pore-size distributions helps predict subgrade performance under rainfall and traffic loading, guiding compaction specifications and moisture control strategies to improve pavement durability and reduce settlement risks.
6 Conclusion
Astana soil was classified as “clayey sand” (SC). Three cases of samples compacted at optimum moisture content (OMC), dry of optimum and wet of optimum with three different water contents were considered. The sample had a maximum dry density of 1.9 g/m3 and OMC of 13.5%. Whereas the moisture content of dry of optimum and wet of optimum were found to be 8.15% and 18.2% from 95 percent of maximum dry density 1.8 g/m3. The plastic limit was 19.33%, the liquid limit was 39.58% and plastic index was 20.25%. The residual suction, air-entry value, saturated volumetric water content of soil sample at OMC were as following: ψr = 40,000 kPa, ψa1 = 100 kPa, ψa2 = 2000 kPa, θs1 = 0.218, θs2 = 0.110. For the case of sample at dry of optimum: ψr = 71,000 kPa, ψa1 = 5 kPa, ψa2 = 6,500 kPa, θs1 = 0.172, θs2 = 0.08. The parameters of sample at wet of optimum were determined as ψr = 40,000 kPa, ψa = 100 kPa and θs1 = 0.286. Moreover, 33% of macropore, 15% of mesopore, 19% of small pore and 33% of micropore were obtained for the water content of 8.1%. In the instance of 13.5% of water content pore percentages were as follows: 52% of macropore, 11% of mesopore, 11% of small pore and 26% of micropore. While for the 18.2% water content, the percentage of mesopore was 19%, macropore was 33%, small pore was 26% and micropore was 22%. From the Scanning electron microscope images, the intergranular pores of sample at wet optimum were larger than those at the OMC and dry optimum. In the same way, the sample compacted at wet of optimum had a greater intergranular pore diameter than the sample compacted at OMC. From the testing results, it was observed that density has a significant influence on SWCC and PSD. The AEV declined as the dry density of the soil increased. This can happen since compaction may rearrange aggregates and create larger, interconnected macropores that control air entry. This structural change, especially when soils are compacted at dry of optimum moisture content, may lowers the AEV despite the overall reduction in void ratio. The findings also show that when dry density increases, the water content decreases. The pore size with maximum frequency decreases as the dry density of combinations of soils rises.
Data availability statement
The original contributions presented in the study are included in the article/supplementary material, further inquiries can be directed to the corresponding author.
Author contributions
ED: Conceptualization, Data curation, Investigation, Writing – original draft, Formal Analysis. AS: Conceptualization, Writing – original draft, Project administration, Methodology, Supervision, Funding acquisition. RA: Writing – original draft, Investigation, Data curation, Conceptualization. AA: Formal Analysis, Data curation, Writing – original draft. AM: Writing – review and editing, Data curation, Validation. YK: Investigation, Validation, Writing – review and editing, Formal Analysis. JK: Project administration, Supervision, Writing – review and editing.
Funding
The author(s) declare that financial support was received for the research and/or publication of this article. This research was supported by the research project AP23486953 from the Ministry of Higher Education and Science of the Republic of Kazakhstan. The authors are grateful for this support. Any opinions, findings, and conclusions or recommendations expressed in this material are those of the author(s) and do not necessarily reflect the views of Nazarbayev University.
Conflict of interest
The authors declare that the research was conducted in the absence of any commercial or financial relationships that could be construed as a potential conflict of interest.
Generative AI statement
The author(s) declare that no Generative AI was used in the creation of this manuscript.
Any alternative text (alt text) provided alongside figures in this article has been generated by Frontiers with the support of artificial intelligence and reasonable efforts have been made to ensure accuracy, including review by the authors wherever possible. If you identify any issues, please contact us.
Publisher’s note
All claims expressed in this article are solely those of the authors and do not necessarily represent those of their affiliated organizations, or those of the publisher, the editors and the reviewers. Any product that may be evaluated in this article, or claim that may be made by its manufacturer, is not guaranteed or endorsed by the publisher.
References
Amantay, A. N., Satyanaga, A., Moon, S.-W., and Kim, J. (2023). “Moisture sensing technology for assessment of rainfall-induced slope failure,” in Proceedings of the 17th Asian regional conference on soil mechanics and geotechnical engineering (17th ARC), Astana, Kazakhstan (August: CRC Press), 14–18. doi:10.1201/9781003299127-312
ASTM D4318-17 (2017). Standard test methods for liquid limit, plastic limit, and plasticity index of soils. West Conshohocken: ASTM International.
ASTM D698-12 (2012). Standard test methods for laboratory compaction characteristics of soil using standard effort. West Conshohocken: ASTM International.
ASTM-D2487-17 (2017). Standard practice for classification of soils for engineering purposes (unified soil classification system) 1. West Conshohocken: ASTM international.
ASTM-D6913M-17 (2009). Standard test methods for particle-size distribution (gradation) of soils using sieve analysis: ASTM international.
Bello, N., Satyanaga, A., Gofar, N., and Kim, J. (2025). Estimation of bimodal soil-water characteristics curve under wetting process. PLoS ONE 20 (6), e0325646. doi:10.1371/journal.pone.0325646
Chua, Y. S., Rahardjo, H., and Satyanaga, A. (2022). Structured soil mixture for solving deformation issue in GeoBarrier system. Transp. Geotech. 33, 100727. doi:10.1016/j.trgeo.2022.100727
Fredlund, D. G., and Xing, A. (1994). Equations for the soil–water characteristic curve. Can. Geotech. J. 31 (3), 521–532. doi:10.1139/t94-061
Fredlund, D. G., Rahardjo, H., and Fredlund, M. D. (2012). Unsaturated soil mechanics in engineering practice. New York: Wiley.
Jeong, S., Kim, Y., Lee, J. K., and Kim, J. (2015). The 27 July 2011 debris flows at Umyeonsan, Seoul, Korea. Landslides. 12 (04), 799–813.
Li, X., Shen, T., Xiang, K., Zhai, Q., Rahardjo, H., Satyanaga, A., et al. (2023). Effect of the wetting hydraulic property of soil on 1-D water infiltration. Sustainability 15 (3), 1822. doi:10.3390/su15031822
Li, C., Chen, Y., Xiang, K., Dai, G., Gong, W., Yang, S., et al. (2024). Estimation of the wetting induced settlement of loess soils from the wetting soil-water characteristic curve. Sci. Rep. 14, 31533. doi:10.1038/s41598-024-83258-x
A. D. McNaught, and A. Wilkinson (2006). “International union of pure and applied chemistry (IUPAC),” Compendium of chemical terminology. 2nd ed. (Oxford: Blackwell Scientific Publications). doi:10.1351/goldbook.M03906
Peng, J., Zhang, J., Li, J., Yao, Y., and Zhang, A. (2020). Modeling humidity and stress-dependent subgrade soils in flexible pavements. Comput. Geotechnics 120, 103413. doi:10.1016/j.compgeo.2019.103413
Raghuram, A. S. S., Basha, B. M., and Moghal, A. A. B. (2020). Effect of fines content on the hysteretic behavior of water-retention characteristic curves of reconstituted soils. J. Mater. Civ. Eng. 32 (4), 04020057. doi:10.1061/(ASCE)MT.1943-5533.0003114
Raghuram, A. S. S., Mounika, N., Basha, B. M., and Moghal, A. A. B. (2023). Soil water characteristic curves of soils exhibiting different plasticity. Int. J. Geosynth. Ground Eng. 9, 25. doi:10.1007/s40891-023-00444-z
Raghuram, A. S. S., Negi, P. S., Basha, B. M., and Moghal, A. A. B. (2024). Effect of sample size, dry unit weight, and hysteresis of expansive soil on SWCC and finite slope stability. Int. J. Geosynth. Ground Eng. 10, 18. doi:10.1007/s40891-024-00531-9
Satyanaga, A., Rahardjo, H., Leong, E.-C., and Wang, J.-Y. (2013). Water characteristic curve of soil with bimodal grain-size distribution. Comput. geotechnics 48, 51–61. doi:10.1016/j.compgeo.2012.09.008
Satyanaga, A., Rahardjo, H., and Zhai, Q. (2017). Estimation of unimodal water characteristic curve for gap-graded soil. Soils Found. 57 (5), 789–801. doi:10.1016/j.sandf.2017.08.009
Satyanaga, A., Ibrahimi, A. B., Mohammad, A. S., Hamdany, A. H., Wijaya, M., Moon, S. W., et al. (2022). Water characteristic curve for soils in Kazakhstan. Geotechnical Eng. J. SEAGS & AGSSEA 53 (4), 1–8. Available online at: http://seags.ait.asia/seags-agssea-journal-2020-2022-issues/watercharacteristic-curve-for-soils-in-kazakhstan/.
Satyanaga, A., Fournier-Carrrie, A., and Rahardjo, H. (2025). Moisture sensing technology as preventive measures against Rainfall-induced slope Failures – A review. Bull Eng. Geol. Environ. 84, 431. doi:10.1007/s10064-025-04463-0
Suhaizan, F. S., Taib, A. M., Taha, M. R., Zulaika, D., Hasbollah, A., Ibrahim, A., et al. (2025). Fitting of soil-water characteristic curves (SWCC) of bukit mewah, Malaysia soil using field monitoring dataset. PLoS ONE 20 (1), e0316488. doi:10.1371/journal.pone.0316488
Yao, Y., Ni, J., and Li, J. (2021). Stress-dependent water retention of granite residual soil and its implications for ground settlement. Comput. Geotechnics 129, 103835. doi:10.1016/j.compgeo.2020.103835
Zhai, Q., Xiang, K., Rahardjo, H., Satyanaga, A., Dai, G., Gong, W., et al. (2023). A new domain model for estimating water distribution in soil pores during the drying and wetting processes. Eng. Geol. 322, 107180. doi:10.1016/j.enggeo.2023.107180
Zhai, Q., Zhang, R., Rahardjo, H., Satyanaga, A., Dai, G., Gong, W., et al. (2024). A new mathematical model for the estimation of shear modulus for unsaturated compacted soils. Can. Geotechnical J. 61, 2124–2137. doi:10.1139/cgj-2023-0409
Keywords: geotechnical engineering, landslide, unsaturated soil mechanics, soil moisture, soil suction
Citation: Dewangga E, Satyanaga A, Abishev R, Arinova A, Muratova A, Kim Y and Kim J (2025) Soil density impact on soil-water characteristic curve and pore-size distribution. Front. Built Environ. 11:1661375. doi: 10.3389/fbuil.2025.1661375
Received: 23 July 2025; Accepted: 18 September 2025;
Published: 01 October 2025.
Edited by:
Wei Guo, Tianjin University, ChinaReviewed by:
Jue Li, Chongqing Jiaotong University, ChinaRaghuram Ammavajjala, Birla Institute of Technology and Science, India
Copyright © 2025 Dewangga, Satyanaga, Abishev, Arinova, Muratova, Kim and Kim. This is an open-access article distributed under the terms of the Creative Commons Attribution License (CC BY). The use, distribution or reproduction in other forums is permitted, provided the original author(s) and the copyright owner(s) are credited and that the original publication in this journal is cited, in accordance with accepted academic practice. No use, distribution or reproduction is permitted which does not comply with these terms.
*Correspondence: Alfrendo Satyanaga, YWxmcmVuZG8uc2F0eWFuYWdhQG51LmVkdS5reg==