 Daqiao Xia1
 Cheng Pei2*†
- 1School of Civil Engineering, Southwest Jiaotong University, Chengdu, China
- 2College of Airport, Civil Aviation Flight University of China, Guanghan, China
For steel-constructed TV towers, complex aerodynamic profiles and low damping are typical characteristics—two attributes that render wind-induced response and wind load critical considerations in their design. Additionally, their wide distribution across diverse terrains exposes these structures to varied wind conditions, further complicating wind-resistant design efforts. To explore how wind field parameters affect wind load and wind-induced response, this study took a 240-m-high TV tower as the engineering background, simulated different turbulent wind fields in a wind tunnel, conducted force measurement tests using a high-frequency dynamic balance (with the model segmented into seven sections to improve accuracy), calculated via the equivalent static wind load (ESWL) method (considering the first three modes), and verified with the complete quadratic combination (CQC) method. Results within the tested range show that mean wind force decreases with increasing turbulence intensity, while the root mean square (RMS) of wind force increases correspondingly; conversely, the RMS of the tower’s wind-induced response decreases as turbulence intensity rises. These findings highlight the need to comprehensively consider mean and fluctuating wind effects and their impact on structural response in the wind-resistant design of steel TV towers.
1 Introduction
Advances in building materials have facilitated the widespread use of lightweight, high-strength components in the construction of high-rise buildings and television (TV) towers (Yang et al., 2016). These structures are typically slender and feature complex geometries with hollow systems, resulting in low inherent damping and high sensitivity to wind-induced vibrations. A seminal example is the Eiffel Tower (1889), one of the earliest high-quality steel structures (Haan, 1998), whose design principles have profoundly influenced modern TV tower design. Concurrent progress in structural design, wind engineering, and construction techniques has enabled a continual increase in building heights, exemplified by the 634-m Tokyo Skytree. Furthermore, the function of TV towers has expanded from solely transmitting signals to multifunctional complexes supporting communication, tourism, and commercial activities. This evolution presents significant aerodynamic challenges.
Due to their height, flexibility, and complex shapes, TV towers are susceptible to wind-induced disasters, as demonstrated by the collapse of a 386-m steel TV mast in the United Kingdom. Consequently, analyzing their wind-induced response remains a critical focus in wind engineering (Célio et al., 2003; Zhou et al., 2010; Ke et al., 2017; Ch et al., 2021). Standard investigative methods include wind tunnel testing, numerical simulation, and field measurements (Tetsuya et al., 1997). For instance, Zhou et al. (2010) analyzed vibration control for the Hefei TV Tower, finding its response to be dominated by wind-induced vibrations. Xie and Gu (2004) compared time-domain analysis methods, noting that while the linear filtering method is computationally efficient, the harmonic synthesis method offers superior accuracy at the cost of greater computational demand. Zhang and Aiqun (2001) reported that code-based calculations can be more conservative than time-history analysis for communication towers. Wind tunnel studies often employ force balance or surface pressure tests. Liang et al. (1997) used a rocking model to investigate vortex-induced vibrations, while Zhang et al. (2006) applied a lightweight model to validate a building block theory for the Nanjing TV Tower. Kitagawa et al. (1997) addressed limitations of quasi-steady theory with the HAPB method, and Chen et al. (2021a) studied a conical model using forced vibration tests. Although field measurements provide valuable data, their high cost renders them relatively scarce; examples include Chen et al.'s work on steel frame towers (Chen et al., 2021b) and long-term GPS monitoring of the Stuttgart TV tower (Chen Zeng et al., 2021). Computational Fluid Dynamics (CFD) is widely used for its parametric flexibility. For example, Yi et al. (2013) found that Eurocode can underestimate wind responses in certain cases, and Breuer et al. (2008) validated Large Eddy Simulation (LES) techniques for TV tower analysis against wind tunnel data. While these studies effectively characterize aerodynamic properties, the influence of incoming flow characteristics on wind load and response has received less attention.
Some research has begun to address this gap. Belloli et al. (2014) investigated turbulence effects on lattice towers using spires and roughness elements. Carril et al. (2003) analyzed the 610-m Guangzhou New TV Tower using a sectioned model with a high-frequency force balance to represent different turbulence intensities. Xia and Peng (2022) studied a tower on a mountainous site, emphasizing three-dimensional stability. However, these studies are primarily project-specific, and systematic research on how wind field characteristics affect TV tower performance remains limited. To address this, our study examines the influence of turbulent wind fields on the wind resistance of a 240-m TV tower. We generated distinct turbulent conditions in a wind tunnel using spires, grids, and roughness elements to simulate a boundary layer wind profile varying with height. A high-frequency base balance measured the forces on the tower model. Based on these wind loads, we calculated the wind-induced response using the Complete Quadratic Combination (CQC) method. The results summarize the effect of turbulence on the tower’s performance, providing a valuable reference for the wind-resistant design of TV towers.
2 Wind tunnel test
2.1 Introduction to the tower and the model
This study utilizes an existing TV tower as the engineering background. The tower is 240 m high, with a 71.3-m antenna atop the structure. The TV tower features a complex external structure, with its main facade comprising a steel mesh system. The tower serves not only communication functions but also accommodates sightseeing, tourism, and catering facilities, making it an important local landmark. Consequently, the design requirements for its wind-induced response are stringent a 1:200 scale model was developed to simulate the actual TV tower, and 3D printing technology was employed to fabricate a lightweight, high-strength model, as shown in Figure 1.
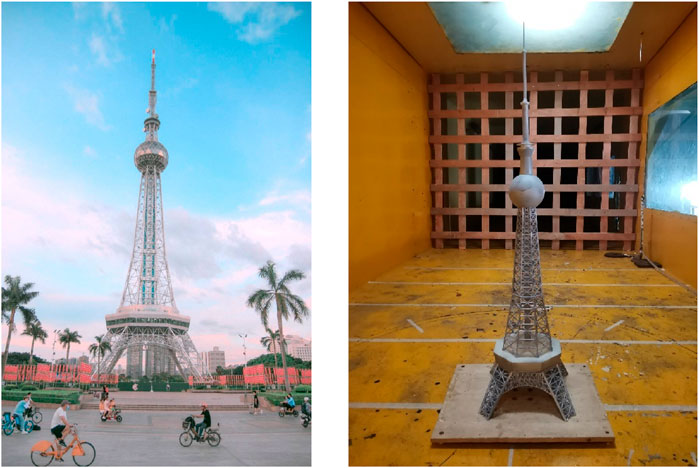
Figure 1. TV towers and models.
2.2 Introduction to the wind tunnel tests
TV towers are situated in various terrain conditions, leading to their exposure to diverse wind parameters. To investigate the effects of different wind parameters on the wind load and wind-induced response of TV towers, this study established different turbulent flow fields in wind tunnel tests to examine the influence laws of these parameters. The wind field tests were conducted in the XNJD-3 and XNJD-1 wind tunnels at Southwest Jiaotong University, as shown in Figure 2. The XNJD-3 wind tunnel laboratory is one of the world’s largest civil boundary layer wind tunnels, with a test section size of 22.5 m (width) × 4.5 m (height) × 36 m (length) and a wind speed range of 1.0–16.5 m/s. The XNJD-1 wind tunnel is a tandem single-return type, with a test section size of 2.4 m × 2.0 m × 16.0 m and a wind speed range of 1.0–45.0 m/s.
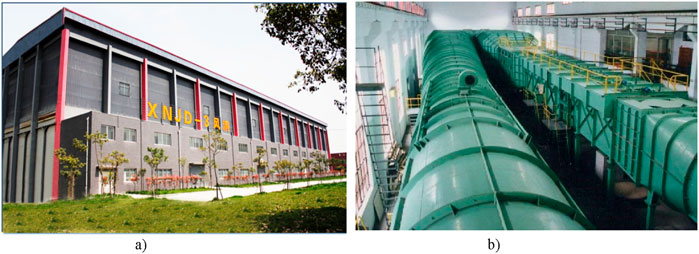
Figure 2. Wind tunnel laboratory. (a) XNJD-3. (b) XNJD-1.
To simulate varied turbulent wind fields, grids and spires with different ventilation rates were employed in the XNJD-1 wind tunnel, while spires and roughness elements were employed in the XNJD-3 wind tunnel. The wind field measurements were conducted using a TFI Cobra three-dimensional pulsating anemometer (Cobra Probe) manufactured in Australia. Each TFI anemometer is equipped with four probes, enabling accurate measurement of three-dimensional wind speed and static pressure. The TFI anemometer has a maximum measurement frequency of 2 kHz and can measure wind direction angles within a range of ±45°, as shown in Figure 3. To investigate the impact of turbulence on the wind load of the television tower, this study aimed to establish as many different turbulent wind fields as possible. By configuring different grids and spires, five distinct wind fields were generated in the laboratory, as shown in Figure 4. To prevent the model from interfering with the turbulence field measurements, the wind field data were collected prior to model installation. As a segmented model was used in this study and the height of each segment was relatively low, the variation of the wind field along the height within each segment was neglected. The characteristics of the wind fields are summarized in Table 1. Turbulence intensity is a key parameter for characterizing turbulence and has a significant influence on the buffeting and vortex-induced vibrations of the tower. Table 2 shows the natural frequencies of the first vibration mode of the TV tower prototype. Wind speed fluctuations can be characterized by turbulence intensity, which is defined as the ratio of the root mean square (RMS) of the fluctuating wind component to the mean wind speed. The turbulence intensity can be calculated according to Equations 1–3:
Where
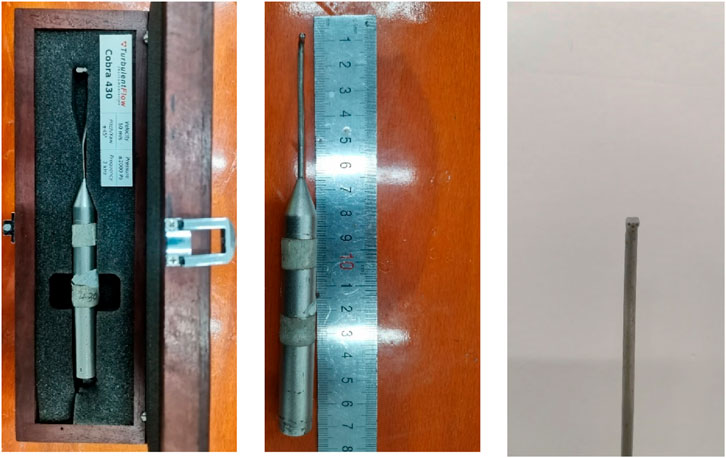
Figure 3. TFI Cobra three-dimensional pulsating anemometer (Cobra Probe).
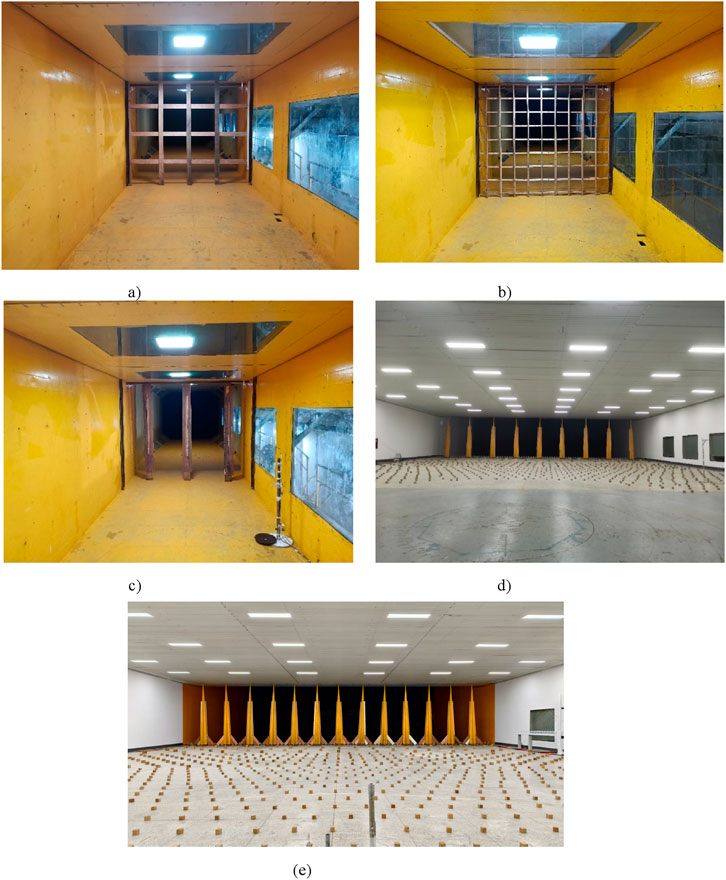
Figure 4. Different wind field simulations. (a) Wind field A. (b) Wind field B. (c) Wind field C. (d) Wind field D. (e) Wind field E.
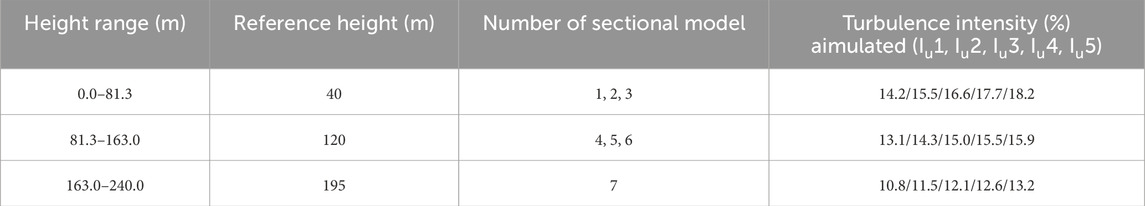
Table 1. Wind field measurement results.
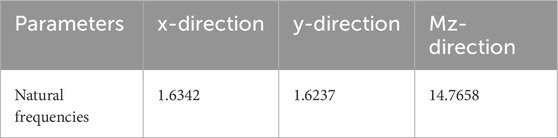
Table 2. Natural frequencies of the first vibration modal shapes of the TV tower prototype (Hz).
The wind spectrum plays a central role in wind field simulation. This Figure 5 shows the comparison between the wind spectrum simulated in several laboratories and the recommended value (von Kármán spectrum) of the specification. The results show that the wind spectrum and the recommended value of the specification are in good agreement. von Kármán spectrum is as follows:
Where
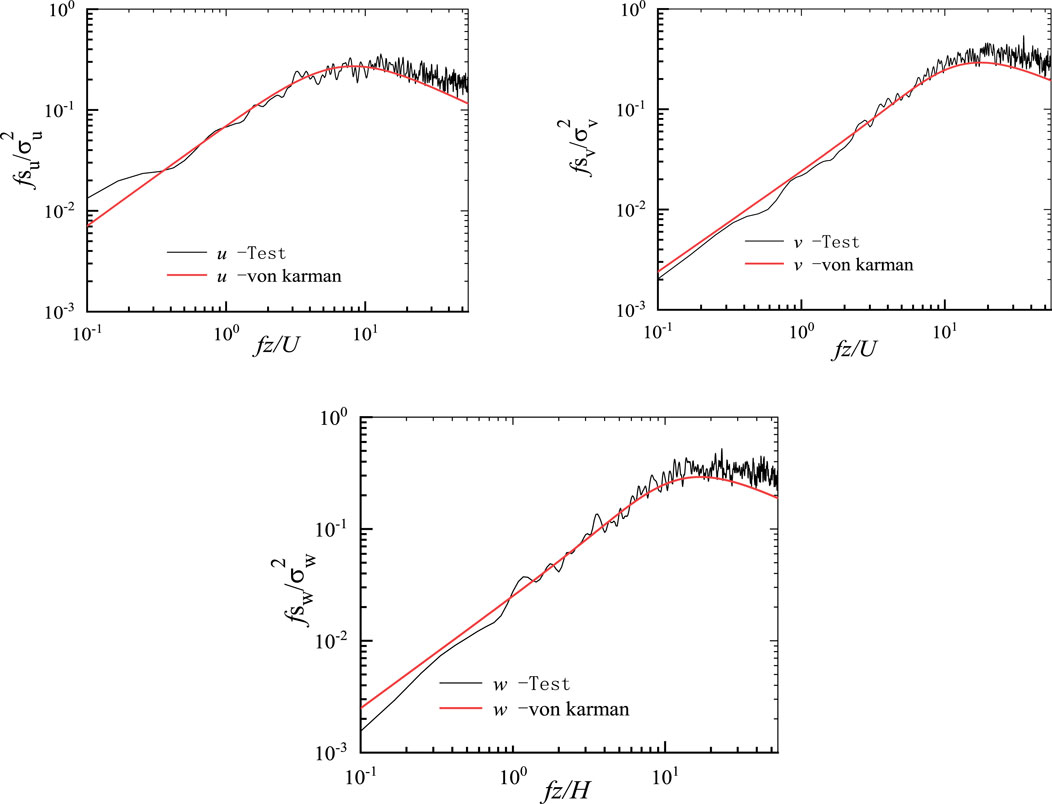
Figure 5. Different wind field simulations.
2.3 Force measurement in wind tunnel
To accurately measure the wind load and wind-induced response of the TV tower, a segmented model was employed for force measurement tests. To perform synchronous force measurements on different sections, two Nano17 multi-axis force sensors from ATI Industrial Automation (United States) were selected. The balance has a diameter of 17 mm and a thickness of 15 mm. This sensor delivers high-precision, stable data and offers a sampling frequency range of 10 Hz–7,200 Hz. As the sensor cannot be directly connected to the model and support rods, a custom connecting plate was fabricated. The sensor and connecting plate are shown in Figure 6. The complete sensor system includes the sensors, signal converters, and a data acquisition unit. Using a dynamic balance for force measurement requires the model to be lightweight and high-strength, as described in previous article (Zhou et al., 2010). To meet these requirements, the model was fabricated using 3D printing technology.
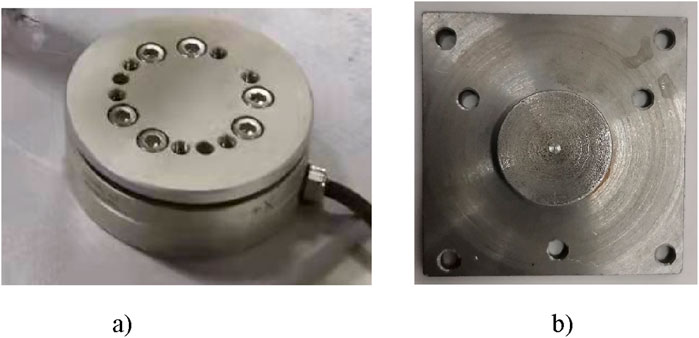
Figure 6. High frequency dynamic balance and connecting plate. (a) High frequency dynamic balance. (b) Connecting plate.
The force tests were conducted in the wind tunnel laboratories of Southwest Jiaotong University (XNJD-1 and XNJD-3), as shown in Figure 7. A sampling frequency of 1,000 Hz was used, with a sampling duration of 60 s, which is several orders of magnitude higher than the natural frequency of the actual structure. In both wind tunnels, the models were mounted on a rotating turntable to vary the wind incidence angle. The experimental model depicting the coordinate system and wind direction is shown in Figure 8. The Reynolds number effect (4.62 × 10⁴ < Re < 7.94 × 10⁴) was considered negligible in this experiment. This is justified firstly by the sharp-edged profile of the model, which minimizes Reynolds number sensitivity, and secondly by the high turbulence conditions, which further reduce Reynolds number effects.
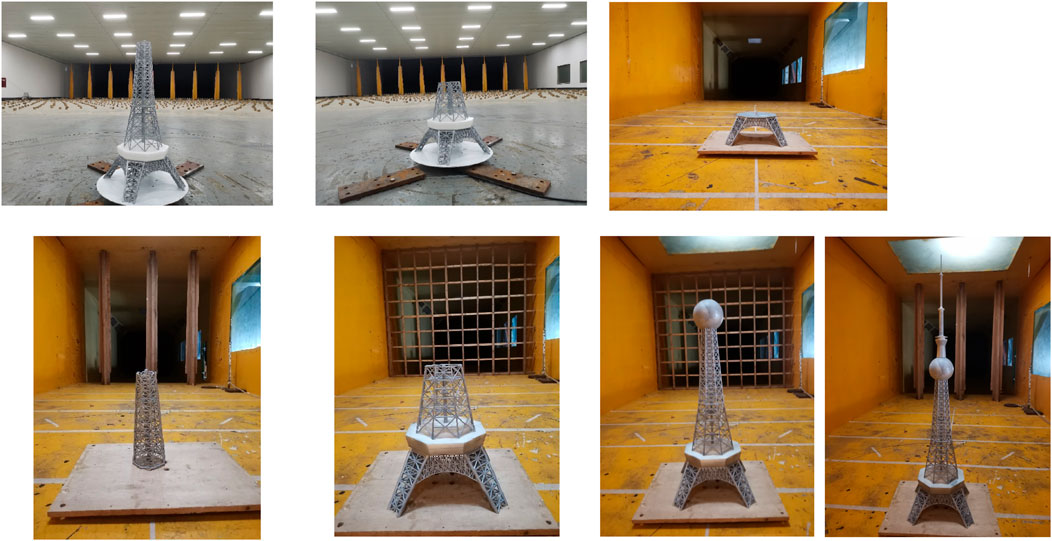
Figure 7. Images of sectional tower model in wind tunnel.
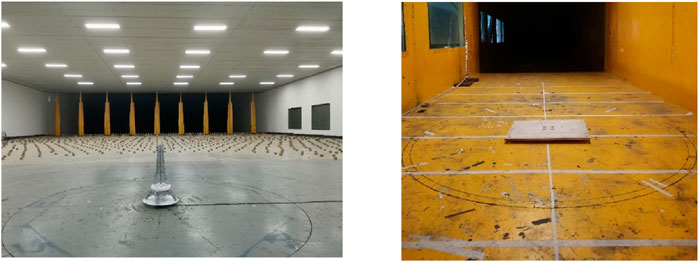
Figure 8. Experimental model with coordinate system and wind direction depicted.
2.4 Wind tunnel test results
2.4.1 Test data processing
Force is measured using a high frequency dynamic balance to obtain its historical values. In order to facilitate subsequent calculations, the authors usually perform dimensionless processing on the time history of the force. Commonly used processing methods such as Equations 4, 5:
where
In this study, a uniform test wind speed was used for all the segment moduli, but in fact the wind speed varies with the height in the actual building.
In this paper, borrowing the research of Ke et al. (2017) and others, a reduced time scale
where
2.4.2 Wind force and wind force coefficient
Following data processing, the force coefficients for each test condition were obtained. To facilitate a clearer comparison, this study presents only the mean force coefficient values for each condition, with the wind direction angle also considered. The calculated force coefficients for Sections 1, 4, and 7 under various conditions are presented in Figure 9. The results clearly demonstrate that turbulence intensity significantly affects the force coefficient, with higher turbulence levels resulting in reduced force coefficients.
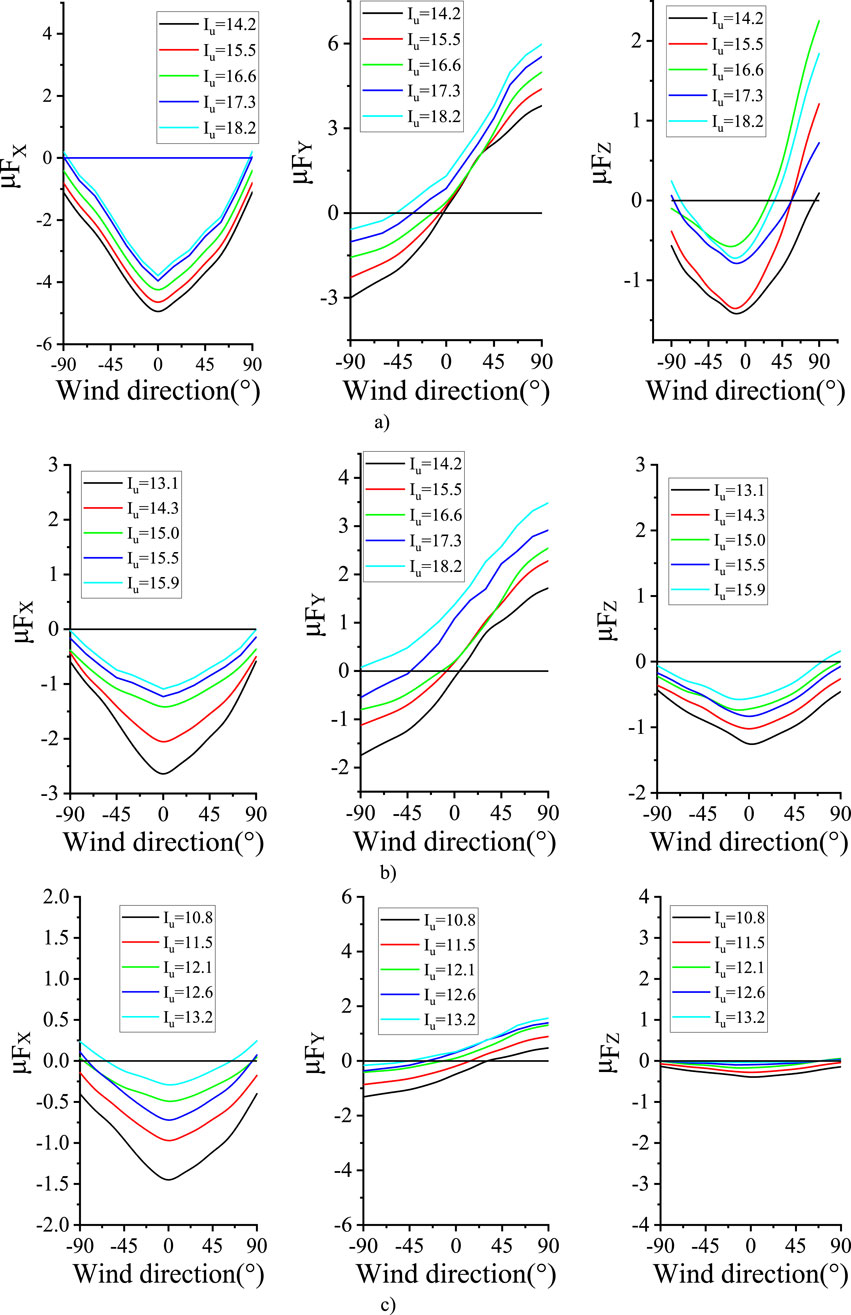
Figure 9. Variations of mean, maximum, and minimum wind force coefficients with wind direction for the different sections. (a) Section 1. (b) Section 4. (c) Section 7.
Figure 9 presents the mean wind force coefficients, showing that these coefficients decrease with increasing turbulence intensity. To further investigate the influence of turbulent flow on wind forces, the root mean square (RMS) values of wind forces were calculated for each segment. The RMS values under each turbulent flow condition were analyzed, with the results for the T1 flow field (corresponding to a wind speed of 32.2 m/s with a 100-year return period) shown in Figure 10. The figure demonstrates that the RMS values vary with wind direction. At a wind direction angle of 0°, the absolute mean wind force in the Mz direction reaches its maximum value. As the wind direction angle increases to −90°, the mean wind force gradually approaches zero. Similarly, at a wind direction angle of −90°, the absolute mean wind force in the X-direction is approximately zero, while at 0°, the mean wind force in the X-direction increases significantly. Notably, the wind force results are not perfectly symmetrical about different wind angles, which can be attributed to the combined effects of turbulence and the structural geometry.
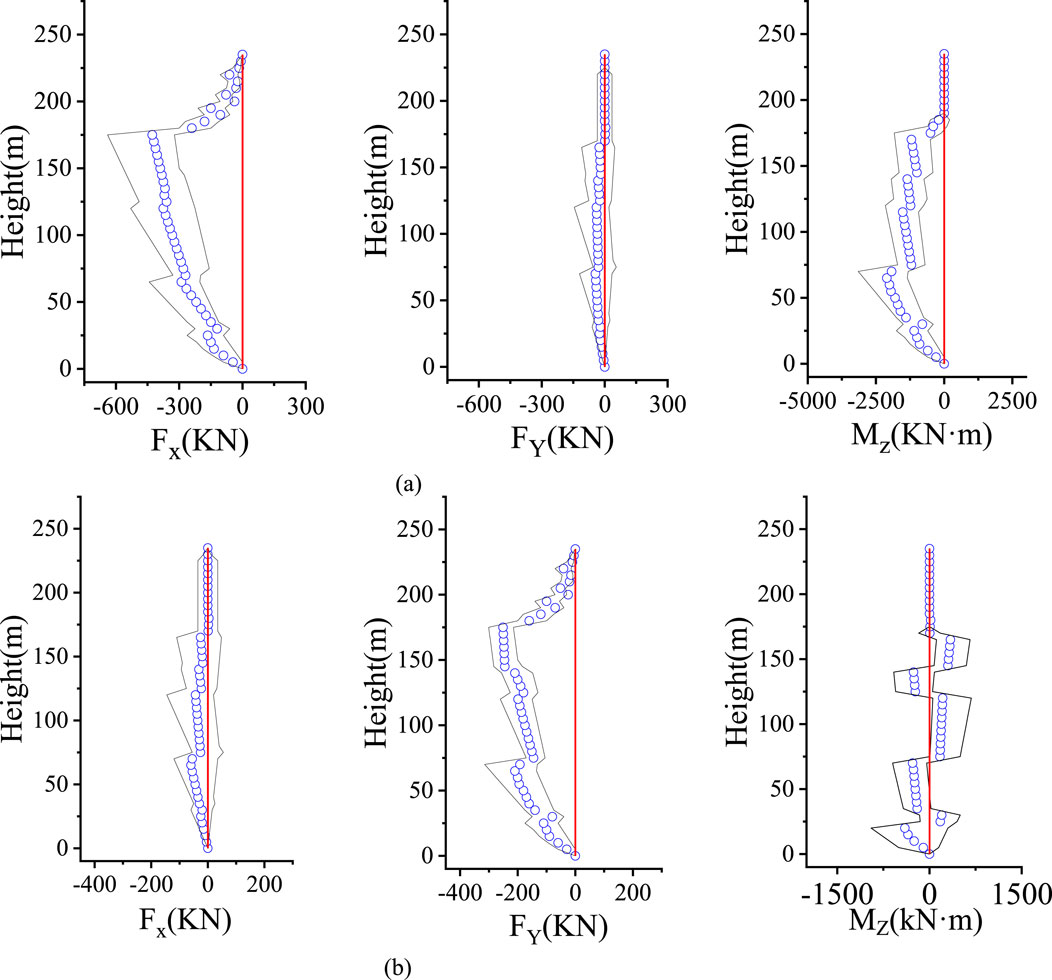
Figure 10. Distributions of mean, maximum, and minimum wind forces along the tower (T1). (a) 0 degree wind direction. (b) −90-degree wind direction.
To compare the wind force RMS values across different turbulence intensities, the RMS values were analyzed as a function of height, as shown in Figure 11. The analysis reveals that the wind force RMS values vary significantly with height, consequently influencing the mean wind force coefficients. This finding, combined with previous results, demonstrates that while increased turbulence intensity reduces the mean wind force, it simultaneously increases the RMS value of the wind force.
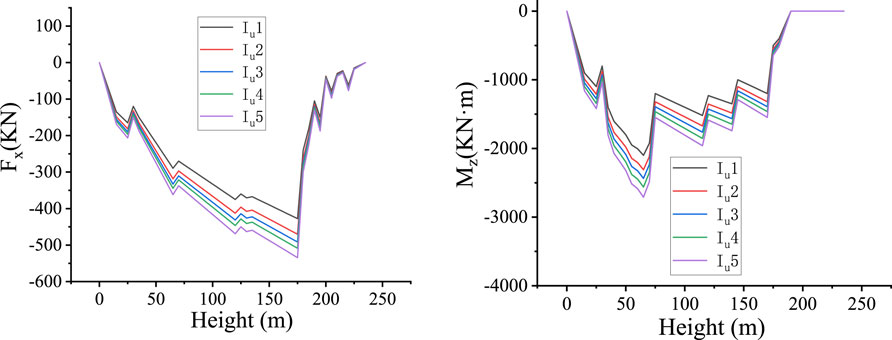
Figure 11. The wind force of TV tower under various turbulence intensity.
3 Wind-induced responses
For high-rise structures like TV towers, designers must account for both the mean wind-induced structural response and the extreme responses arising from turbulent fluctuations. Accurate calculation of the root mean square (RMS) value of the dynamic response is particularly important for comfort criteria, since the upper floors of TV towers typically accommodate observation decks and restaurants. Given the complex geometry of many towers, the response calculation often requires appropriate simplifications. For tall buildings, especially slender structures, wind-induced response analysis typically treats these structures as linear systems with lumped mass distributions. A common multi-degree-of-freedom mechanical model for such structures is shown in Figure 12. Finite element simulations are generally employed to extract the dynamic characteristics of these structural systems.
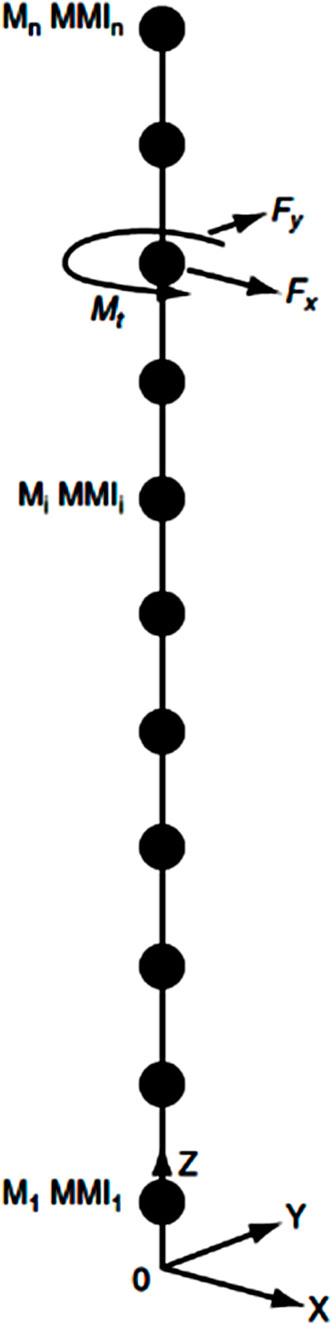
Figure 12. A multiple-degree-of-freedom system with lumped masses in series.
3.1 CQC method
The equation of motion can be expressed as Equation 8:
where
By evaluating the response power spectral density matrix using the CQC method, the following Equation 10 is obtained:
where
For buildings with non-coupled vibration modes, only one term was included in the generalized force, and the other two terms were zero.
In order to calculate the various data of the model, a finite element model was established in ANSYS to calculate the dynamic characteristics of the model, the vibration modes of the high-rise structure, and only one-dimensional vibration mode forms were considered in each principal axis direction. The specific parameters and steps in the finite element are as follows:
1. Apply forces in the same direction to each particle on the first node layer of the three-dimensional finite element model, and make the sum of all forces 1. Torque is applied at two points symmetrical about the center (1/L).
2. Determine the K-direction displacement of each node in the j-th node layer to obtain the different flexibility coefficients, and then form a flexibility matrix with the flexibility coefficients.
3. Invert the flexibility matrix to obtain the stiffness matrix.
3.2 Results of wind-induced responses and equivalent static wind loads
The wind load calculation method in this paper follows the equivalent static wind load (ESWL) procedure developed by Ke et al. (2017). Figures 13, 14 present the RMS values of the wind-induced response and internal forces of the TV tower structure under various test conditions. The results demonstrate that the RMS response of the TV tower increases with rising turbulence intensity. Figure 14 demonstrates the underlying mechanism—the RMS structural response is directly proportional to the RMS internal force within the structure.
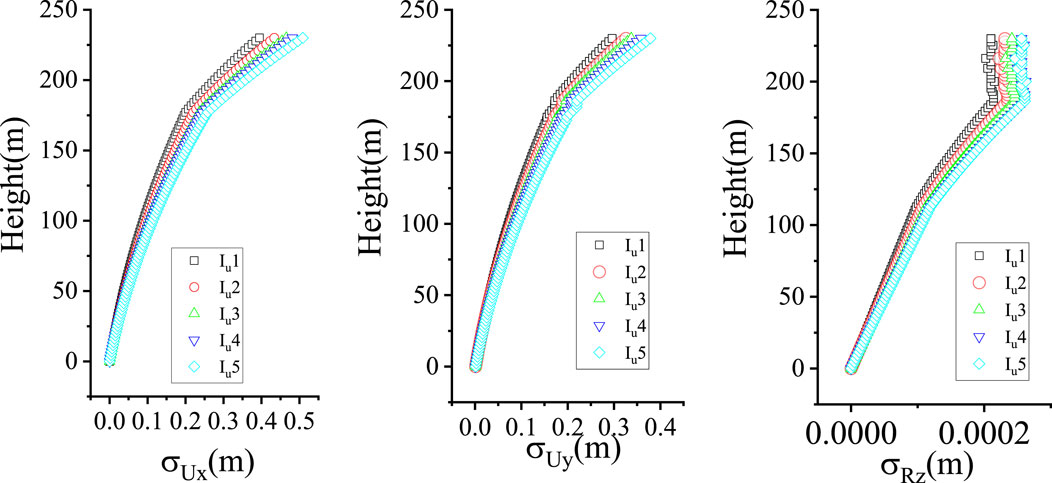
Figure 13. RMS displacement of structure (90° wind direction, 100 years return period).
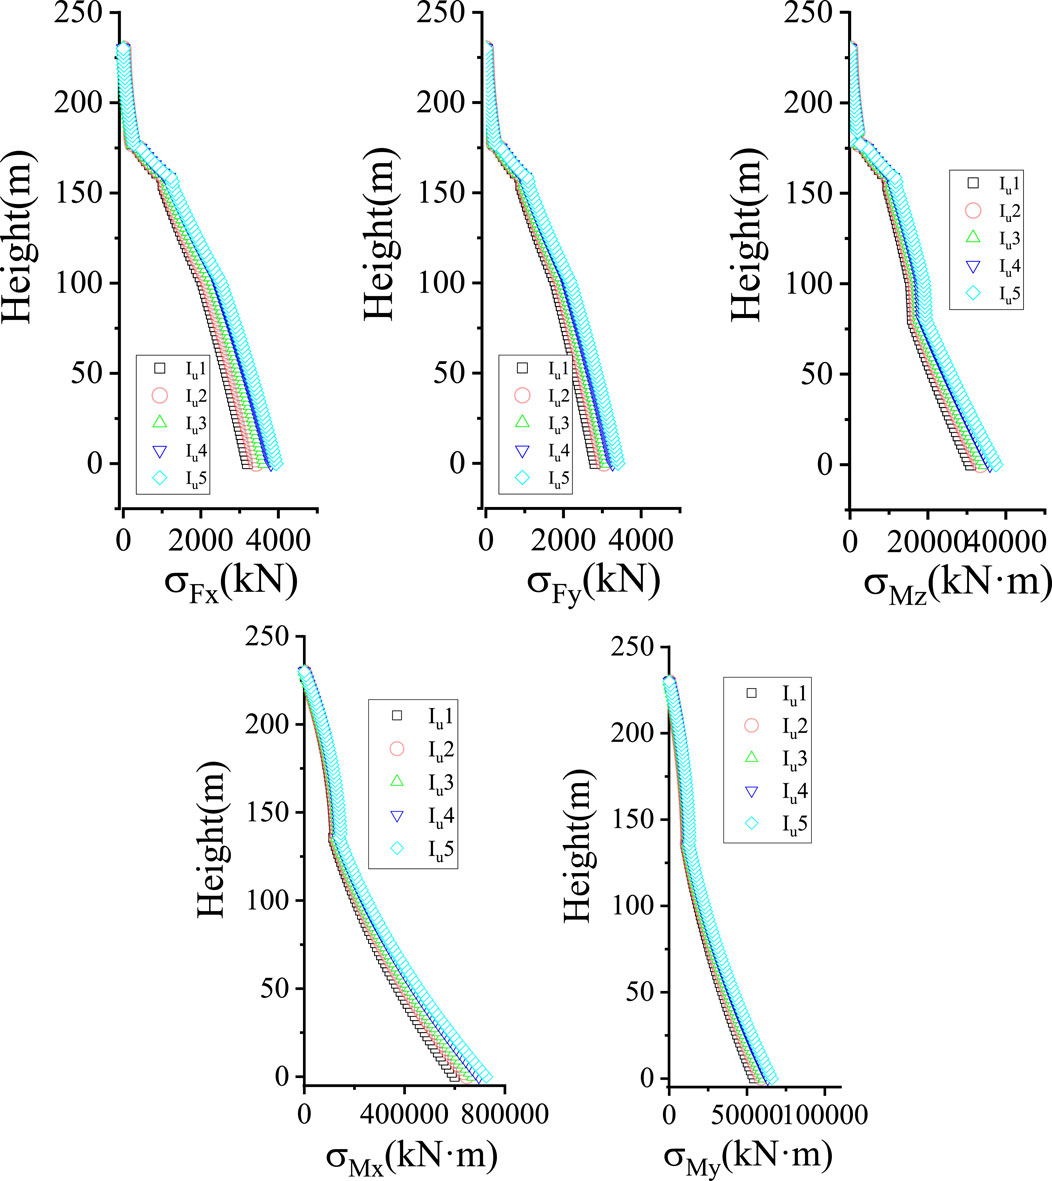
Figure 14. RMS internal force of structure (90° wind direction, 100 years return period).
This paper adopts two methods, CQC and ESWL, which are currently widely used. Therefore, the interaction between the two methods is used for verification. From Figure 15, it can be seen that the results of the two methods coincide well, indicating that the calculation results of this paper are reliable.
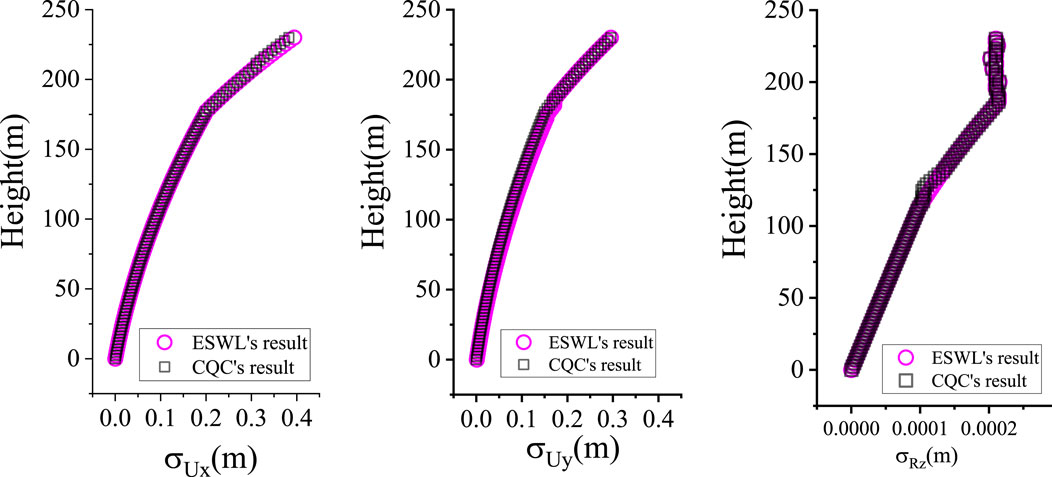
Figure 15. RMS displacement of structure (90° wind direction, 100 years return period).
4 Conclusion
TV towers typically serve broadcasting functions and often include facilities such as observation decks and restaurants at elevated levels, including the tower top. Owing to their slender structure, TV towers are highly susceptible to wind effects, and excessive responses may compromise tourist comfort. Therefore, the research on the wind response of the TV tower in turbulent flow has strong practical value. Based on a comprehensive series of wind tunnel tests and analytical calculations, the following conclusions are drawn:
1. Wind tunnel test results, obtained using a high-frequency dynamic balance, demonstrate that the wind direction angle exerts a periodic influence on wind forces. However, this periodicity is not absolute due to the effects of structural shape. The downwind force reaches its maximum at a wind direction angle of 0°. Additionally, the results indicate that wind forces measured in a closed test section exceed those measured in an open section.
2. The results obtained from the Complete Quadratic Combination (CQC) and Equivalent Static Wind Load (ESWL) methods show mutual verification, confirming the high reliability of the findings presented in this study. The experimental results further demonstrate that increased turbulence intensity reduces the mean wind force while simultaneously increasing the root mean square (RMS) value of wind forces.
3. Analytical results indicate that higher turbulence levels increase the RMS value of the wind-induced response of TV towers. This finding underscores the importance of considering turbulence intensity effects on structural response in the design of high-rise buildings located in high-turbulence regions.
4. Due to the use of passive wind field simulation technology in this article, precise control of turbulence intensity and other parameters cannot be achieved, and the underlying mechanisms and mathematical relationships cannot be studied. In the future, it is hoped that research can be conducted in active control wind tunnels to clarify the mechanisms and mathematical relationships.
Data availability statement
The original contributions presented in the study are included in the article/supplementary material, further inquiries can be directed to the corresponding author.
Author contributions
DX: Methodology, Software, Visualization, Writing – original draft, Conceptualization, Data curation. CP: Funding acquisition, Investigation, Writing – review and editing, Formal Analysis, Supervision.
Funding
The author(s) declare that financial support was received for the research and/or publication of this article. This work is supported by the National Natural Science Foundation of China under the grant number 52068020.
Acknowledgments
Thanks for the test equipment provided by the Laboratory for Wind Engineering of Southwest Jiaotong University.
Conflict of interest
The authors declare that the research was conducted in the absence of any commercial or financial relationships that could be construed as a potential conflict of interest.
Generative AI statement
The author(s) declare that no Generative AI was used in the creation of this manuscript.
Any alternative text (alt text) provided alongside figures in this article has been generated by Frontiers with the support of artificial intelligence and reasonable efforts have been made to ensure accuracy, including review by the authors wherever possible. If you identify any issues, please contact us.
Publisher’s note
All claims expressed in this article are solely those of the authors and do not necessarily represent those of their affiliated organizations, or those of the publisher, the editors and the reviewers. Any product that may be evaluated in this article, or claim that may be made by its manufacturer, is not guaranteed or endorsed by the publisher.
References
Belloli, M., Rosa, L., and Zasso, A. (2014). Wind loads on a high slender tower: numerical and experimental comparison. Eng. Struct. 68, 24–32. doi:10.1016/j.engstruct.2014.02.030
Breuer, P., Chmielewski, T., Górski, P., Konopka, E., and Tarczyński, L. (2008). The Stuttgart TV Tower — displacement of the top caused by the effects of sun and wind. Eng. Struct. 30, 2771–2781. doi:10.1016/j.engstruct.2008.03.008
Carril, C. F., Isyumov, N., and Brasil, R. M. (2003). Experimental study of the wind forces on rectangular latticed communication towers with antennas. J. Wind Eng. Industrial Aerodynamics 91 (8), 1007–1022. doi:10.1016/S0167-6105(03)00049-7
Chen, Z., Tse, K. T., Kwok, K., Kareem, A., and Kim, B. (2021). Measurement of unsteady aerodynamic force on a galloping prism in a.
Chen, Z., Fu, X., Xu, Y., Li, C. Y., Kim, B., and Tse, K. T. (2021a). A perspective on the aerodynamics and aeroelasticity of tapering: partial reattachment. J. Wind Eng. Industrial Aerodynamics 212, 104590. doi:10.1016/j.jweia.2021.104590
Chen, Z., Tse, K. T., Kwok, K. C. S., Kareem, A., and Kim, B. (2021b). Measurement of unsteady aerodynamic force on a galloping prism in a turbulent flow: a hybrid aeroelastic-pressure balance. J. Fluids Struct. 102, 103232. doi:10.1016/j.jfluidstructs.2021.103232
Chen, Z., Huang, H., Xu, Y., Tse, K. T., Kim, B., and Wang, Y. (2021c). Unsteady aerodynamics on a tapered prism under forced excitation. Eng. Struct. 240, 112387. doi:10.1016/j.engstruct.2021.112387
Haan, K. F. L. (1998). Aerodynamics of nanjing tower: a case study. J. Wind Eng. Industrial Aerodynamics. doi:10.1016/S0167-6105(98)00187-1
Ke, S., Wang, H., Ge, Y., Zhao, L., and Cao, S. (2017). Equivalent static wind loads analysis of tall television towers considering terrain factors of hilltops based on force measurement experiment. Struct. Eng. Mech. An Int. J. 63. doi:10.12989/sem.2017.63.4.509
Kitagawa, T., Wakahara, T., Fujino, Y., and Kimura, K. (1997). An experimental study on vortex-induced vibration of a circular cylinder tower at a high wind speed. J. Wind Eng. Industrial Aerodynamics 69–71, 731–744. doi:10.1016/S0167-6105(97)00201-8
Liang, B., Tamura, Y., and Suganuma, S. (1997). Simulation of wind-induced lateral-torsional motion of tall buildings. Comput. and Struct. 63 (3), 601–606. doi:10.1016/S0045-7949(96)00356-2
Tetsuya, K., Toshihiro, W., Fujino, Y., and Kimura, K. (1997). An experimental study on vortex-induced vibration of a circular cylinder tower at a high wind speed. J. Wind Eng. and Industrial Aerodynamics 69–71, 731–744. doi:10.1016/s0167-6105(97)00201-8
Xia, D., and Peng, K. (2022). Wind load and wind vibration response of a TV tower based on force measurement test in a wind tunnel. Adv. Civ. Eng. 2022, 7629438. doi:10.1155/2022/7629438
Xie, Z. N., and Gu, M. (2004). Mean interference effects among tall buildings. Eng. Struct. 26 (9), 1173–1183. doi:10.1016/j.engstruct.2004.03.007
Yang, F., Dang, H., Niu, H., Zhang, H., and Zhu, B. (2016). Wind tunnel tests on wind loads acting on an angled steel triangular transmission tower. J. Wind Eng. and Industrial Aerodynamics 156, 93–103. doi:10.1016/j.jweia.2016.07.016
Yi, J., Zhang, J. W., and Li, Q. S. (2013). Dynamic characteristics and wind-induced responses of a super-tall building during typhoons. J. Wind Eng. Industrial Aerodynamics 121, 116–130. doi:10.1016/j.jweia.2013.08.006
Zhang, Z., and Aiqun, L. (2001). Simulation calculation of artificial pulsating wind load of Hefei TV Tower. J. Southeast Univ. 01, 69–73. doi:10.3969/j.issn.1001-0505.2001.01.015
Zhang, L. L., Wu, Y. F., and Yu, Y. (2006). HFFB Experimental technology on dynamic wind loads on a tall building. J. Chongqing Univ. 29 (2), 99–102. doi:10.11835/j.issn.1000-582X.2006.02.027
Keywords: TV tower, wind tunnel test, wind-induced response, turbulence intensity, high-frequency force balance
Citation: Xia D and Pei C (2025) Wind tunnel testing to study turbulent wind field effect on wind load and wind-induced response of TV tower. Front. Built Environ. 11:1661712. doi: 10.3389/fbuil.2025.1661712
Received: 08 July 2025; Accepted: 12 September 2025;
Published: 02 October 2025.
Edited by:
Carlos Humberto Martins, State University of Maringá, BrazilReviewed by:
Haron C. A. Tavares, State University of Maringá, BrazilJosé Osvaldo Ferreira Filho, State University of Maringa, Brazil
Copyright © 2025 Xia and Pei. This is an open-access article distributed under the terms of the Creative Commons Attribution License (CC BY). The use, distribution or reproduction in other forums is permitted, provided the original author(s) and the copyright owner(s) are credited and that the original publication in this journal is cited, in accordance with accepted academic practice. No use, distribution or reproduction is permitted which does not comply with these terms.
*Correspondence: Cheng Pei, UGVpY2hlbmdfeG5qdEAxNjMuY29t
†ORCID: Cheng Pei, orcid.org/0000-0003-1404-8868