 Zhang Pei
 Ji Chunyu1
- 1School of Energy, Xi’an University of Science and Technology, Xi’an, Shaanxi, China
- 2Key Laboratory of Western Mine Exploitation and Hazard Prevention of the Ministry of Education, Xi’an, Shaanxi, China
This study examines the stability of the surrounding rock in the 3–1 coal mining roadway of Hejiata Coal Mine, focusing on shallow coal seams with thin bedrock through laboratory tests, similar material simulations, and numerical modeling. It first analyzes the mechanical behavior of roof and floor rocks, then proposes an optimized roadway support system based on the analysis results. Results indicate the weathered rock and floor mudstone exhibit unstable characteristics, while the immediate roof composed of medium-grained sandstone and main roof of fine-grained sandstone demonstrate overall instability with localized medium stability. Water immersion tests reveal weathered rock develops initial bedding cracks followed by annular fractures before stabilizing, whereas mudstone experiences continuous argillization leading to progressive surface cracking. The immediate roof shows initial caving at 18 m, with the main roof’s first weighting occurring at 36 m, followed by periodic fractures every 8–16 m. At 78 m advancement, overlying strata collapse in a distinctive arc rock pillar formation. Stress analysis shows that mining induces stress redistribution in surrounding rock, creating localized stress concentration zones and forming an arch-shaped stress relief area in the roof and floor strata. Abutment pressure evolution reveals increasing peak values and influence ranges below 140 m advancement, transitioning to intensified stress concentration upon roof-floor contact beyond this threshold. Deformation monitoring shows progressive increases in roof displacement and floor heave, with maximum values occurring near the goaf center. The optimized support design specifies bolts with 2.1 m length, 20 mm diameter, 0.8 m spacing, and 25 kN pre-tightening force, complemented by anchor cables measuring 5 m in length, 15.24 mm in diameter, spaced at 2.4 m intervals, with 70 kN pre-tightening force and 180 kN anchoring capacity.
1 Introduction
Coal mine tunnels are located within strata containing coal, rendering them less safe and stable compared to tunnels in non-coal mines. This instability arises from the well-developed rock structural planes and the inherent weakness of the surrounding rock formations (Zhang L. et al., 2025). Current research suggests that thin-bedrock shallow-buried coal seams (TBSCS) often exhibit pronounced mining pressure (Jialin et al., 2014; Jialin et al., 2009). This differs from shallow-buried seams with thick bedrock, which typically show milder pressure effects due to low supporting pressure. Furthermore, the deformation of the surrounding rock is exacerbated when the tunnel’s cross-sectional dimensions are excessive, particularly in conjunction with the increasing use of large-scale mining equipment. Coal seams that are thinly bedded and shallowly buried within bedrock are likely to encounter more pronounced manifestations of mining pressure, posing significant challenges for tunnels to adhere to safety mining regulations. To mitigate the deformation of the surrounding rock and ensure the safe operation of mining activities, it is imperative to conduct comprehensive stability analyses of the rock strata adjacent to the tunnel and to optimize the support systems accordingly (Zhang et al., 2026).
To address the issue of tunnel surrounding rock stability analysis and control, scholars have made a series of significant research contributions. Kang Hongpu and his team employed numerical simulation methods to investigate the stress, deformation, and failure distribution characteristics of surrounding rock at the mining face, analyzing the main factors influencing the stability of the surrounding rock (Hongwen et al., 2021; Hongpu, 2021). Zhang Jingmin and his team, using the 1,014 working face of Yushuquan Coal Mine as the engineering context, utilized UDEC numerical simulation software to study the key controlling factors of surrounding rock stability in tunneling through thick coal seams along the empty space (Zhang and Meng, 2022). The results indicated that the factors influencing surrounding rock stability, in descending order of significance, are as follows: the integrity of the coal body, the tunnel burial depth, the width of the coal pillar along the empty space, the length of the lateral rock cantilever beam, and the distance from the basic roof fracture to the solid coal side. Xie Yingliang and his team, using the transportation tunnels of the 31,321 and 31,325 working faces at Shidonggou Coal Mine as the engineering context, found through on-site measurements that tunnel excavation altered the original rock stress field (Yingliang et al., 2022). The supporting pressure generated by mining activities reduced the surrounding rock grade, and they concluded that the surrounding rock deformation could be divided into three stages. Wang Zhiqiang and his team proposed that through the theory of complex functions, a relatively accurate calculation formula can be obtained for the extent of the plastic zone in straight-walled semi-circular arch tunnels (Zhiqiang et al., 2022). They found that the factors affecting the development of the plastic zone in such tunnels include the tunnel cross-sectional size, vertical stress, lateral pressure coefficient, cohesion, and the magnitude of the internal friction angle. Li Yao and his team, using the 30,108 fully-mechanized caving working face of Shiquan Coal Industry as the engineering context, calculated the minimum coal pillar width through theoretical analysis (Yao and Gang, 2020). They also employed UDEC numerical simulation software to model the distribution of elastic-plastic zones and vertical stress in different areas, analyzing the stability of the surrounding rock and the bearing capacity of the coal pillar under various conditions. Hou Zhaojiong and his team, addressing common issues such as surrounding rock strength degradation, stress environment deterioration, and large deformations due to structural instability in deep tunnels, systematically explored the mechanisms of surrounding rock strength enhancement, stress improvement, and surrounding rock reinforcement and modification (Chaojiong et al., 2021). In terms of active control technology for tunnel surrounding rock, support methods are typically employed to mitigate and reduce the movement of the surrounding rock. Cai Meifeng proposed the basic principles and methods for stability and strata control in underground mining, emphasizing that the fundamental purpose of support is to protect, enhance, and reinforce the strength of the rock mass (Meifeng, 2020). It is essential to fully leverage the inherent strength of the surrounding rock to achieve stability in mining engineering. Ji Hongguang and his team analyzed the dynamic development of the caving and fracture zones, as well as the large deformation patterns of tunnel surrounding rock (Hongguang et al., 2023). They established a support-surrounding rock interaction model and proposed a double-shell reinforcement technology for tunnel surrounding rock. Jiao Jiankang and his team, based on on-site measurements of surrounding rock strength, structure, and in-situ stress, conducted a quantitative evaluation of tunnel surrounding rock stability (Jiankang et al., 2022). They proposed a graded support form and parameters based on pre-stressed anchor rod support. Wang Junliang, considering the softening effect of mudstone and siltstone when soaked in water, used FLAC3D for numerical simulations to analyze the stress, deformation, and failure characteristics when passing through faults (Junliang, 2020). He proposed a combined support technology of “advanced deep-hole curtain grouting for water blocking + local advanced small pipe grouting + anchor belt mesh beam.” Wang Qi and his team, using the transportation lane of the comprehensive mining face at Huangling Mine No. Two shaft as the engineering background, proposed the concept of zonal parallel anchoring based on on-site investigations of tunnel excavation techniques (Wang et al., 2025). Zhang Wenjie and his team, using the 120,313 working face of Xiangshui Coal Mine as the engineering context, determined the parameters for tunnel active support and temporary support (Wenjie et al., 2025). They proposed a surrounding rock stability control technology that includes “constant resistance large deformation anchor cables, bidirectional directional pre-splitting blasting for the tunnel top plate, rib reinforcement support, telescopic U-shaped steel props, and single hydraulic prop temporary support.” Huang Wanpeng and his team, with the 11,502 working face of Zhai Zhen Coal Mine as the engineering context, established a coal pillar-top plate structural mechanics model based on the theory of overlying rock combination structure (Wanpeng et al., 2023). They studied the distribution and magnitude of supporting pressure above the coal pillar and developed a small coal pillar reinforcement support design method for dual-lane tunneling. Geng Jiye and his team, using Chengjiao Mine as the engineering background, observed the evolution of tunnel surrounding rock fractures through various means (Jiye et al., 2019). They explored the influence characteristics of different ground stresses and lateral pressure coefficients on tunnel stability, and proposed a micro-trapezoidal section tunnel support design plan (Zhang S. et al., 2025).
Rock layer control technology is essential for the safe and efficient extraction of coal resources. The aforementioned studies have made significant contributions to the field of tunnel surrounding rock stability analysis and control, greatly advancing the development of rock layer control theory and providing extensive theoretical support for practical engineering applications (Hongpu et al., 2019). However, these studies have predominantly focused on the stability analysis and control of tunnel surrounding rock under deep tunnel confinement pressures and complex geological conditions. In contrast, research on the stability analysis and control of tunnel surrounding rock under the conditions of thin bedrock and shallow-buried coal seams remains relatively limited. The mining pressure in thin bedrock shallow-buried coal seams is even more pronounced, significantly hindering the safe and efficient mining of coal. To address this issue, the present study takes the 3–1 coal mining operation at Hejiata Coal Mine as the engineering context to analyze and examine the stability of tunnel surrounding rock and the design of optimized support schemes for thin bedrock shallow-buried coal seams. The objective is to provide a theoretical foundation for the safe and efficient extraction of coal from thin bedrock shallow-buried seams.
The 3-1 coal seam roadway of Hejiata Mine was selected as the research object due to its representativeness and criticality: (1) Representative of TBSCS geological conditions: It has thin bedrock (average 40 m), shallow burial depth, and a water-sensitive mudstone floor—consistent with the main geological challenges of TBSCS in western China. (2) Critical engineering value: As the key transport and ventilation roadway for the 30,104 fully-mechanized mining face (annual output 1.2 Mt), its surrounding rock stability directly affects mining efficiency. (3) Urgent support optimization needs: Field observations show that the original support (bolt length 1.8m, pre-tightening force 20 kN) cannot control roof delamination (maximum loosening zone 3.08 m, Section 5.2) and floor heave (peak at goaf center, Section 3.4), leading to frequent maintenance and safety risks. Thus, researching this roadway can provide a typical case for TBSCS support optimization (Dai et al., 2025).
2 Project overview
Hejiata Coal Mine is located approximately 47 km north of Shenmu City, Shaanxi Province, with a north-south length of about 8 km and an east-west width ranging from 4 to 8 km, covering an area of approximately 41.7246 square kilometers. The mine features a simple geological structure, with only two faults identified, each with a displacement of less than 10 m. No magmatic rock intrusions are present, and the area is unaffected by magmatic rocks. The strata generally exhibit a wavy undulation, but the amplitude is small, with trends towards the NNE and NEE directions and a dip angle of less than 1°. Currently, Hejiata Coal Mine has three minable coal seams: the 3–1, 4–2 upper, and 5–2 seams. Among them, the 3–1 coal seam is located at the top of the third section of the Yan’an Formation. It has a relatively shallow burial depth, thin bedrock, and visible outcrops in the valley. The seam is highly prone to spontaneous combustion, with thickness ranging from 2.20 to 3.60 m, averaging 2.95 m. The structure of the coal seam is simple, containing a single layer of intercalated rock, with relatively minor thickness variations. Except for the spontaneous combustion area, the coal seam is minable throughout the entire mining field, making it a locally minable and stable coal seam.
Notably, field investigations of the 3-1 coal seam roadways (auxiliary transport and conveyor transport roadways) reveal critical engineering issues: (1) Broken surrounding rock: The weathered rock zone (0–4 m depth) has RQD <70% in local areas, and the immediate roof medium-grained sandstone develops bedding cracks, leading to frequent roof spalling. (2) Complex rock layers: The roof consists of alternating siltstone and mudstone, with obvious delamination tendency, while the floor mudstone softens significantly when encountering water (saturated compressive strength 6.38MPa, 0.38 times of dry state, Table 1), causing serious floor heave (up to 0.5 m in local sections). (3) Unreasonable original support: The original bolt length (1.8 m) is shorter than the roof loosening zone (2.97–3.08 m, Section 5.2), and the lack of waterproof measures accelerates mudstone softening—resulting in monthly roadway maintenance workload exceeding 50 man-days. These issues highlight the urgency of studying the roadway’s surrounding rock stability and support optimization.
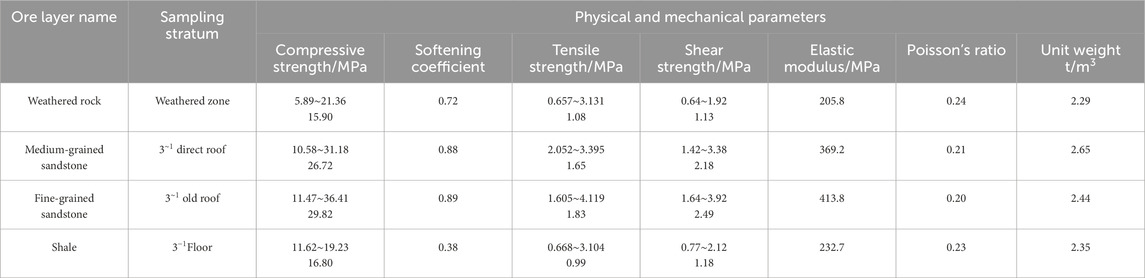
Table 1. 3–1 coal roof and floor rock physical and mechanical parameters.
3 Physical and mechanical properties of coal seam roof and floor
The roof of the 3–1 coal seam is primarily composed of siltstone, with mudstone as a secondary component, and small amounts of fine-grained sandstone and sandy mudstone present (Wu et al., 2025). The floor consists mainly of siltstone, with sporadic occurrences of mudstone. To understand the physical and mechanical properties of the 3–1 coal seam roof and floor, rock cores are first obtained through on-site drilling (Figure 1). These cores are then processed and polished, followed by indoor rock mechanics tests to obtain relevant test parameters, which also lay the foundation for subsequent research.

Figure 1. Drilling core.
3.1 Rock sample processing
3.1.1 Rock sample collection
Rock samples of the 3-1 coal seam roof and floor were collected from the drilling hole (drill hole number: ZK30104-1; coordinates: X = 41,256.32m, Y = 125,689.45m; drilling depth: 80 m) in the transport roadway of the 30,104 working face of Hejiata Coal Mine. The sampling followed the “Code for Investigation of Coal Mine Geology” (GB/T 34,964–2017) and the following specific criteria.
3.1.1.1 Sampling location
Weathered rock samples: Collected from the bedrock weathering zone at a drilling depth of 0–4 m (consistent with the actual distribution of the weathering zone in the mine area).
Medium-grained sandstone (immediate roof): Collected from 15 to 18 m depth, which is the main lithology of the immediate roof of the 3-1 coal seam verified by geological exploration.
Fine-grained sandstone (main roof): Collected from 25 to 28 m depth, corresponding to the stable main roof stratum above the 3-1 coal seam.
Mudstone (floor): Collected from 31 to 34 m depth (1–4 m below the 3-1 coal seam floor), avoiding the influence of coal seam intercalations.
3.1.1.2 Sampling quantity
For each rock type, the total length of collected cores was ≥1.5 m to ensure the number of standard specimens (φ50 mm × 100 mm) after processing met the test requirements:
5 parallel specimens for uniaxial compressive strength and shear strength tests;
3 standby specimens (to replace damaged ones during processing);
2 thin-section specimens for mineral composition analysis (SEM and XRD tests).
3.1.1.3 Screening criteria
Core integrity: Rejected cores with obvious fractures, (intercalations), or uneven weathering; the Rock Quality Designation (RQD) of selected cores was ≥85%.
Dimensional consistency: The diameter fluctuation of collected cores was ≤2 mm to avoid errors in subsequent specimen processing.
Lithology purity: Ensured no mixed lithology in the core segment (e.g., no sandstone-mudstone interbedding in the mudstone sample), verified by on-site geological logging.
3.1.2 Rock sample processing procedures
The rock sample processing equipment includes a rock cutter, core drill, radial drilling machine, grinding machine, and lapping machine. The specific steps for processing rock samples are as follows.
1. Secure the rock core samples retrieved from the field on the core drill platform, and use a diamond drill bit to extract samples with a diameter of 50 mm. Then, following national standards, use the cutter to further process the samples into standard cylindrical specimens with a diameter of 50 mm and a height of 100 mm, with a permissible deviation of ±0.03 mm.
2. Place the 50 mm × 100 mm standard cylindrical specimens on the grinding machine to grind the ends flat. After grinding, the flatness of the ends should not exceed 0.03mm, and the axial deviation should not be greater than 0.25° to meet the testing requirements.
The rock sample processing and some of the processed rock samples are shown in Figure 2.
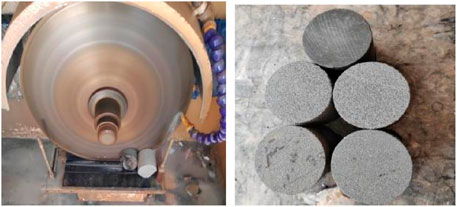
Figure 2. Standard rock sample after processing.
3.2 Uniaxial compressive strength test study of rock samples
Unconfined compressive strength and shear tests were performed on processed standard rock samples from various sources: weathered rock from the bedrock weathering zone, medium-grained sandstone from the immediate roof of the 3–1 coal seam, fine-grained sandstone from the old roof of the 3–1 coal seam, and mudstone from the floor of the 3–1 coal seam. The procedures for the compressive and shear tests are shown in Figures 3a,b, and the resulting physical and mechanical parameters of the 3–1 coal seam roof and floor rocks are presented in Table 1.

Figure 3. Compression test. (a) compressive strength (b) shear strength.
From the experimental data in Table 1, it can be observed that among the four types of rocks from the coal seam roof and floor, the fine-grained sandstone from the old roof of the 3–1 coal seam has the highest compressive, tensile, and shear strengths, followed by the medium-grained sandstone from the immediate roof of the 3–1 coal seam. The weathered rock from the bedrock weathering zone and the mudstone from the floor of the 3–1 coal seam exhibit relatively lower compressive, tensile, and shear strengths, and the variation in the elastic modulus of these rocks follows this pattern. Regarding the Poisson’s ratio, both the weathered rock and the mudstone show relatively higher values, indicating that these materials are more susceptible to lateral deformation. Additionally, based on the softening coefficient of the mudstone, the compressive strength of saturated mudstone is only 0.38 times that of dry mudstone, indicating a significant reduction in rock strength when the mudstone is water-saturated. Therefore, in practical engineering, it is crucial to address this issue by implementing timely waterproofing and water-cutting measures to prevent safety risks associated with the strength degradation of mudstone.
To further clarify the geological conditions of the 3–1 coal seam roof and floor, this study classifies the roof and floor rocks based on the toughness coefficient f (unconfined compressive strength/100). The calculated toughness coefficient values are shown in Figure 4. As seen in Figure 4, the toughness coefficients of both the weathered rock and mudstone are less than 3, classifying them as weak rocks. The maximum toughness coefficients of the medium-grained and fine-grained sandstones are greater than 3, while their average values are less than 3, indicating that the medium-grained and fine-grained sandstones in the roof of the 3–1 coal seam are generally weak rocks, with some localized areas being moderately firm rocks.

Figure 4. Comparison of rock firmness coefficient.
3.3 Hydraulic properties analysis of rock samples
Disintegration is a typical characteristic of sedimentary rocks, referring to the phenomenon where rocks containing clay minerals disintegrate when immersed in water (Jia et al., 2024). To clarify the disintegration law and mechanical response of weathered rock and mudstone in the 3-1 coal seam, systematic water immersion tests were conducted, with details as follows.
3.3.1 Water immersion test parameters
The test objects were standard specimens (φ50 mm × 100 mm) of weathered rock and floor mudstone, designed in accordance with the “Standard for Test Methods of Engineering Rock Mass” (GB/T 50,266–99) (The National Standard Compilation Group of the People’s Republic of China, 1999). Specific parameters: (1) Water type: Simulated on-site groundwater of Hejiata Coal Mine (pH = 7.2, mineralization degree = 1.2 g/L, main ions: Na+ = 350 mg/L, Ca2+ = 120 mg/L, Cl− = 420 mg/L) to avoid interfering with natural disintegration. (2) Environmental conditions: Controlled by a constant temperature chamber (25 ± 1)°C, humidity controller (60 ± 5)%, static immersion (water level 50 mm above specimens), no direct sunlight. (3) Monitoring indicators and frequency: Qualitative observation (4K camera at 0min, 15min, 30min, 2h, 4h, 6 h); quantitative measurement (mass loss rate via electronic balance (0.001 g accuracy), volume expansion rate via vernier caliper (0.01 mm accuracy), fracture width via digital crack gauge (0.01 mm accuracy)). With morphological changes in Figures 5, 6.

Figure 5. The disintegration state of weathered rock after soaking in water. (a) before immersion. (b) immersed for 15min. (c) immersed for 30min. (d) immersed for 2 h. (e) immersed for 4 h. (f) immersed for 6 h.
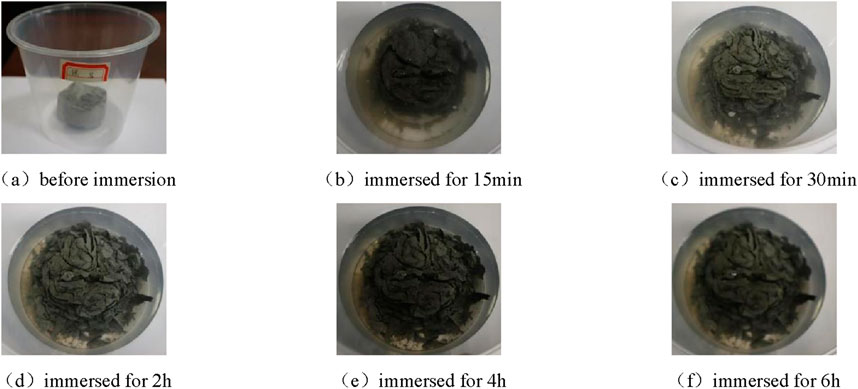
Figure 6. The disintegration state of mudstone after soaking in water. (a) before immersion. (b) immersed for 15min. (c) immersed for 30min (d) immersed for 2 h. (e) immersed for 4 h. (f) immersed for 6 h.
3.3.2 Analysis of disintegration mechanism
1. Weathered Rock: Contains a small amount of illite (XRD result). Water molecules infiltrate initial micro-cracks, weakening mineral particle cementation—cleavage cracks expand at 15min, annular cracks form at 30 min. However, high quartz content (≥60%) maintains structural strength, so mass loss and volume expansion stabilize after 2 h.
2. Mudstone: Rich in water-sensitive minerals (montmorillonite: 4% in NY-1; andalusite: 9%–21%). Montmorillonite swells to destroy internal structure; andalusite/illite soften, accelerating mudification—mass loss rate reaches 8.1% at 6h, and volume expansion rate reaches 11.5%, volume expansion rate 11.5%, consistent with saturated mudstone’s low softening coefficient (0.38).
3.4 Mineral composition testing and analysis of rock samples
Through unconfined compression tests and water immersion tests, it was observed that the mudstone from the 3–1 coal seam floor exhibited significant strength degradation under saturated conditions and was prone to mudification reactions and disintegration phenomena. To further explore the microscopic characteristics of the mudstone from the 3–1 coal seam floor, SEM scanning and XRD diffraction analysis were conducted on two sets of selected mudstone thin sections. The SEM scanning results are shown in Figure 7, and the XRD diffraction mineral composition analysis results are presented in Table 2.

Figure 7. SEM scanning of rock. (a) NY-1 (b) NY-2. Q-quartz; Dm-dolomite; Feo-iron (II) oxide; Tur-tourmaline; Hyd-hydromica; Ser-sericite.

Table 2. XRD-diffraction mineral composition analysis results.
Based on the results of SEM scanning and XRD diffraction analysis, it has been determined that the mineral composition of the mudstone in the 3–1 coal seam floor includes andalusite, illite, and quartz. Among these minerals, andalusite and illite exhibit water absorption, softening, and plasticity properties. Additionally, montmorillonite was detected in sample NY-1, which has a strong tendency to swell and soften upon contact with water. Therefore, in mining areas and for tunnel support, it is essential to prevent water from coming into contact with the surrounding rock. Spraying concrete to seal the surrounding rock is necessary to isolate the rock from the softening effects of water and prevent expansion due to water absorption.
4 The development of mining-induced fractures and the manifestation rules of mining pressure
Based on the geological data of the Hejiata coal mine, the typical overburden composition types have been identified. The average thickness of the 3–1 coal seam is 2.95 m, with an average bedrock thickness of 40 m and an average loose layer thickness of 30 m. The laterite layer is 8 m thick, and the sand layer is 22 m thick. Therefore, a base load ratio of 4:3 is chosen for the physical similarity simulation experiment (Xu et al., 2022).
4.1 Prototype simulation and similarity ratio
The similar material testing is based on a simulation test platform, utilizing readily available materials and the physical and mechanical parameters of the rock and coal strata in the study area. The model is constructed according to similarity theory to analyze the deformation and failure patterns of the rock strata during the excavation process. This study takes the typical stratum of the 3–1 coal seam mining operation at the Hejiata coal mine as the prototype to establish a similar material model. The model is designed with a height of 0.73 m, a length of 3 m, and a width of 0.20 m, and the full-face caving method along the strike is adopted for mining. It is important to note that to ensure the accuracy and feasibility of the experiment, the following similarity conditions must be met between the model and the prototype when designing the test model:
Geometric Similarity Conditions:
Gravity Similarity Conditions:
Gravitational Acceleration Similarity Conditions:
Temporal Similarity Conditions:
Velocity Similarity Conditions:
Displacement Similarity Conditions:
Strength, Elastic Modulus, and Cohesion Similarity Conditions:
Angle of Internal Friction Similarity Conditions:
Force Similarity Conditions:
Based on the aforementioned similarity conditions,the similarity ratios are determined as shown in Table 3.

Table 3. Ratio of similar materials.
4.2 Analysis of similar material test results
According to the advancing distance of the working face, the roof collapse and strata pressure manifestation laws of the 3-1 coal seam can be divided into the following stages:
Immediate roof initial collapse stage (advancement 0–18 m):When the working face advances to 18m, the immediate roof strata within 3 m above the coal seam undergo bending and fracturing. Cracks in the goaf divide the immediate roof into two fractured rock masses with uneven lengths that interlock with each other, and the non-free ends of the fractured masses form a hinged structure with the original rock mass (Figure 8a). At this time, the hinged end cracks are distributed in an open manner above the central axis of the fractured strata and closed below the central axis, leading to the initial collapse of the immediate roof.

Figure 8. The immediate roof and main roof collapse. (a) Immediate Roof Initial Collapse (b) Immediate Roof Continuous Spalling (c) Main Roof Initial Collapse.
Immediate roof continuous delamination collapse stage (advancement 18–36 m):When the working face advances from 18 m to 24m, the immediate roof delaminates horizontally and vertically under the load of the overlying strata. The lower fractured strata gradually expand to form a cantilever beam structure, with a delamination height of 6 m and a delamination angle of 55° (Figure 8b). Before advancing to 36m, the immediate roof continues to delaminate and collapse, accumulating deformation for the initial weighting of the main roof.
Main roof initial weighting stage (advancement 36 m):When the working face advances to 36m, the damage of the roof strata extends to 12 m above the coal seam, and the overlying strata undergo large-scale deformation and damage, resulting in the initial weighting of the main roof (initial weighting step distance of 36 m). The collapse pattern is arch-shaped, with a maximum gap of 0.7 m between the roof strata and the collapsed body, a top horizontal span of 17 m for the collapsed body, a front arch angle of approximately 45°, and a rear arch angle of approximately 60°. Interlayer horizontal cracks extend to 17 m above the coal seam (Figure 8c). The initial collapse of the main roof is characterized by lagging behind the working face and strong suddenness. After the collapse, a distinct delamination zone is formed between the fracture zone and the overlying strata; the strata above the delamination zone only undergo bending deformation, while the strata below are penetrated by vertical cracks.
Main roof periodic weighting stage (advancement 36–106 m):
Advancement to 42 m (first periodic weighting): The collapse step distance is 6m, the damage extends to 20 m above the coal seam, and interlayer horizontal cracks extend to 24 m. The layer gaps below 16 m from the top of the coal seam are compressed and closed (Figure 9a).

Figure 9. Periodic collapse of main roof. (a) First Periodic Spalling (b) Second Periodic Spalling (c) Third Periodic Spalling. (d) Fourth Periodic Spalling (e) Fifth Periodic Spalling (f) Sixth Periodic Spalling.
Advancement to 50 m (second periodic weighting): The collapse step distance is 8m, the damage extends to 24 m above the coal seam, and interlayer cracks extend to 27 m (Figure 9b).
Advancement to 66 m (third periodic weighting): The collapse step distance is 16m, the damage extends to 30 m above the coal seam, and interlayer cracks extend to 35 m (Figure 9c).
Advancement to 78 m (fourth periodic weighting): The collapse step distance is 12m, and the overlying strata collapse in an “arc-shaped rock pillar” pattern for the first time (rock pillar width of 14 m). The damage extends to 42 m above the coal seam, and interlayer cracks extend to 50 m (Figure 9d).
Advancement to 94 m (fifth periodic weighting): The collapse step distance is 16m, the width of the arc-shaped rock pillar is 13m, the damage extends to 42 m above the coal seam, and interlayer cracks extend to 55 m (Figure 9e).
Advancement to 106 m (sixth periodic weighting): The collapse step distance is 12m, the width of the arc-shaped rock pillar is 14m, vertical cracks appear in the middle of the arch top of the laterite overburden (extending 10 m upward), delamination occurs between the laterite and the sand layer, the damage extends to 42 m above the coal seam, and interlayer cracks extend to 64 m (Figure 9f).
Surface crack development stage (advancement 106–140 m): When advancing to 120m, sufficient mining-induced movement occurs on the surface, the laterite layer collapses, the cracks connect, and delamination occurs at 8 m from the surface (Figure 10a); when advancing to 130m, “goose-shaped” downward cracks appear in the sand layer (Figure 10b); when advancing to 140m, vertical cracks appear in the sand layer, and the cracks directly affect the surface without “step-like subsidence” (Figure 10c).

Figure 10. Development law of fully mining-induced fractures. (a) Full Mining Subsidence at the Surface (b) Gooseneck Fractures (c) Vertical Surface Fractures.
In summary, the overlying strata of the 3-1 coal seam only have a caving zone and a fracture zone, which is consistent with the typical collapse characteristics of shallow-buried coal seams. The roof collapse of the goaf forms two types of intersecting cracks: horizontal delamination cracks caused by lithological differences and vertical fracture cracks caused by strata breaking, which are likely to form water-conducting channels.
4.3 Numerical model establishment
Under the condition of a 4:3 base load ratio, the numerical simulation calculation model is generated using the Generate command in FLAC3D. The model dimensions are length × width × height = 300 m × 300 m × 80m, with the working face advancing direction along the Y-axis. The Mohr-Coulomb constitutive model, which is widely applied in coal rock mass stability simulation (Chang et al., 2018), is used to simulate the strength of the coal and rock strata. The working face is designed to advance 200 m, with 50 m boundary coal pillars left in front of, behind, to the left of, and to the right of the working face. The model uses brick elements to simulate the coal and rock strata, with a fixed numerical model on the front, back, left, right, and bottom surfaces. The model has 78,141 nodes and 64,800 elements, and the constructed numerical model is shown in Figure 11.

Figure 11. Base-load ratio 4:3 numerical model.
4.4 Numerical simulation result analysis
4.4.1 Vertical stress distribution characteristics
During the advancement of the working face, the distribution of vertical stress is shown in Figure 12. From Figure 12a, it can be seen that when the working face advances to 20m, the stress on the roof above the working face is transmitted towards the coal wall of the working face and the rear of the goaf. A certain range of stress release areas appears in the roof and floor, while a stress concentration phenomenon occurs within a certain range in front of the coal wall of the working face. Along the strike of the working face, the vertical stress release area of the roof approximates a “symmetrical arch,” with the arch feet located in front of the coal wall of the working face and behind the working face coal wall, and the arch crown located within a certain range of the roof and floor rocks above the goaf. The isochrones of the vertical stress on the roof show a clear symmetrical characteristic. In addition, the range of stress release areas and stress concentration areas in the roof and floor after mining is significantly larger than before mining. The maximum vertical concentrated stress in the stress concentration area is 3.8MPa, and the minimum vertical stress in the stress release area is 0.19 MPa.

Figure 12. Working face vertical stress distribution characteristics. (a) advanced by 20 m. (b) advanced by 60 m. (c) advanced by 100 m. (d) advanced by 140 m. (e) advanced by 200 m.
From Figure 12b, it can be seen that when the working face advances to 60m, the range of stress release areas in the roof and floor rocks and the stress concentration area in front of the working face coal wall has significantly increased. The vertical stress values on the roof have changed noticeably, with the “symmetrical arch” of the stress release area becoming taller and wider. The range of the stress concentration area in front of the working face coal wall is larger than that at the rear of the goaf. As the working face advances further, the range of the advanced support pressure, the peak value of the support pressure, and the stress release area continue to increase. During this process, the maximum vertical concentrated stress in the stress concentration area is 5.43MPa, and the minimum vertical stress in the stress release area is 0.21 MPa.
From Figure 12c, it can be seen that when the working face advances to 100m, the vertical stress values in the stress release areas of the roof and floor decrease, the range of the stress concentration area in front of the working face coal wall significantly increases, the arch height and span of the “symmetrical arch” of the working face roof gradually decrease, and the “symmetrical arch” tends to “reduce,” while the range of the stress release area of the floor further increases. The maximum vertical concentrated stress in the stress concentration area is 5.45MPa, and the minimum vertical stress in the stress release area is 0.41 MPa.
From Figure 12d, it can be seen that when the working face advances to 140m, the range of stress release and concentration areas in the roof and floor significantly increases, mainly manifested as a decrease in vertical stress within the stress release “arch,” with further reduction in arch height and span, and a decrease in vertical stress within the “symmetrical arch” of the floor as well. The maximum vertical concentrated stress in the stress concentration area is 5.81MPa, and the minimum vertical stress in the stress release area is 0.48 MPa.
From Figure 12e, it can be seen that when the working face advances to 200m, at this point, due to the advancement of the working face, the roof of the working face sinks and contacts the floor, resulting in a phenomenon of re-compaction, with minimal changes in vertical stress values on the roof. The range of stress re-compaction is located in the middle and rear area of the goaf strike, with the maximum vertical concentrated stress in the stress concentration area being 7.69MPa, and the minimum vertical stress in the stress release area being 0.71 MPa.
Figure 12 indicates that during the mining process of the 3–1 coal seam, a “secondary distribution” of stress in the surrounding rock of the working face is caused, leading to local areas of increased or decreased stress. An approximate “arch” type stress release range appears within a certain range of the roof and floor above the goaf, and stress concentration areas appear in front of the working face coal wall and behind the goaf coal wall. As the advance distance continues to increase, the arch height and span of the stress release “arch” in the roof and floor above the goaf continuously increase, and the peak value of the supporting pressure and the range of the stress concentration area behind the goaf coal wall and in front of the working face coal wall continuously increase. When the advance distance is large, the roof sinks and contacts the floor, and the goaf experiences a phenomenon of re-compaction, with the roof of the goaf showing a stress concentration phenomenon. To further analyze the trend of supporting pressure changes during the advancement of the working face, a measuring line is arranged on the upper surface of the 3–1 coal seam in the middle of the numerical calculation model along the strike of the working face to monitor the trend of supporting pressure changes. The monitoring results are shown in Figure 13 and Table 4.
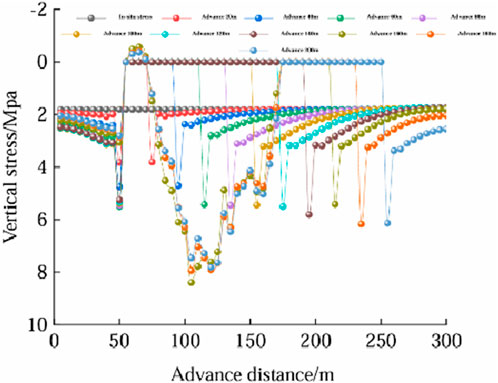
Figure 13. Evolution process of bearing pressure.
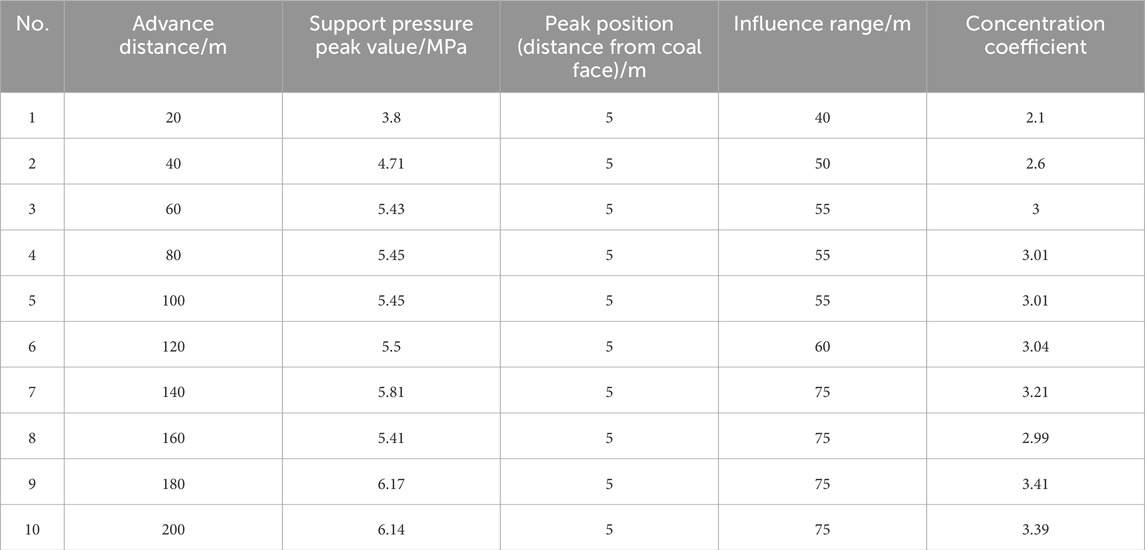
Table 4. Advance abutment pressure distribution characteristics.
As can be seen from Figure 13 and Table 4, during the advancement of the working face from 0 to 140m, the peak value of the advanced support pressure increases from 3.8 MPa to 5.81MPa, an increase of 52%. The concentration coefficient of the support pressure increases from 2.1 to 3.21, and the influence range of the support pressure increases from 40 m to 75m, an increase of 87.5%. It can be observed that when the advance distance of the working face is less than 140m, the peak value of the support pressure in front of the working face, the concentration coefficient, the peak position, and the influence range of the support pressure all show a continuously increasing trend. When the advance distance of the working face is greater than 140m, the roof of the goaf sinks and comes into contact with the floor, and due to the effect of re-compaction, the stress concentration phenomenon on the roof within the goaf becomes apparent. The peak stress at the ends of the working face correspondingly decreases, while the influence range remains almost unchanged.
4.4.2 Displacement distribution characteristics
During the advancement of the working face, the vertical displacement cloud diagram of the working face is shown in Figure 14. As can be seen from Figure 14, when the working face advances to 20m, the maximum vertical displacement of the roof is located at the central position of the working face strike, reaching 0.004m; when the working face advances to 60m, the maximum vertical displacement of the roof increases to 0.014m, with the peak position at the center of the goaf strike; when the working face advances to 100m, the maximum vertical displacement of the roof is 0.17m, with the peak position at the center of the goaf roof, and the distribution pattern of the roof vertical displacement begins to dissipate from an arch shape; when the working face advances to 140m, the maximum vertical displacement of the roof is located at the immediate roof above the working face, with a peak value of 2.17m, and the peak position is at the center of the goaf strike; when the working face advances to 200m, the maximum vertical displacement of the roof is 2.97 m (the reason for the 3.06 m in the cloud diagram is the 0.1 m thickness of the contact surface), and the displacement peak position is in the middle and rear area of the goaf strike (the rear area between the center of the goaf strike and the goaf coal wall).

Figure 14. Working face vertical displacement distribution characteristics. (a) advanced by 20 m. (b) advanced by 60 m. (c) advanced by 100 m. (d) advanced by 140 m. (e) advanced by 200 m
The trend of changes in the displacement cloud diagram from the numerical calculation results shows that as the working face continuously advances forward, the overhanging length of the roof increases, the vertical displacement of the roof increases, while the displacement at the end of the working face is minimal, and the degree of deformation, damage, and movement of the overlying rock strata above the working face continuously increases. Along the strike of the working face, the peak value of the roof’s vertical displacement continues to increase, and the peak position will change with different advance distances. The vertical heave of the floor continuously increases, with the heave peak position roughly located at the center of the goaf, but its numerical change is much smaller compared to the change in the vertical displacement of the roof.
5 Engineering analogy analysis
Mining practice indicates that there is no absolute correlation between coal seam burial depth and mining pressure; the roof fracturing movement and manifestation of mining pressure in shallow-buried coal seams exhibit particular characteristics. This paper will validate the reliability of the similar material simulation results of the Hejiata coal mine based on the mining pressure characteristics of four different types of shallow-buried coal seam working faces that have been mined. Table 5 presents a summary of mining pressure manifestation characteristics in shallow-buried coal seam working faces.

Table 5. List of strata behavior characteristics of shallow coal seam working face.
By comparing and analyzing the mining pressure observation results of the existing C202 conventional mining face, 1,203 fully-mechanized mining face, 20,601 fully-mechanized mining face, and 20,604 fully-mechanized mining face, it was found that in addition to the characteristics given in Table 5, they also have the following basic patterns: (1) The roof bedrock shears off along the full thickness, with a large fracturing angle, and the fracturing directly affects the surface; (2) During the pressure period, there is a noticeable step-down of the roof and dynamic load phenomena; (3) There is no “three-zone” in the overburden above the working face, basically consisting of the caving zone and the fracture zone; (4) It is not easy for the old roof rock blocks to form a stable arch structure; (5) When the bedrock thickness is large, two key strata groups will appear, forming a pattern of large and small periodic pressures; (6) When the base load ratio is less than 0.8, step-down of the roof occurs at the working face, and when the base load ratio is greater than 0.8, no step-down of the roof is observed.
Based on the aforementioned characteristics and combined with the results of the similar material experiments, it is known that the mining pressure manifestation patterns of the Hejiata coal mine also have the above basic patterns. Therefore, the similar material experimental results of the Hejiata coal mine working face are included in Table 5. Based on the aforementioned characteristics and combined with the results of the similar material experiments, it is known that the mining pressure manifestation patterns of the Hejiata coal mine also have the above basic patterns (e.g., overlying strata consisting of caving zone + fracture zone, no surface step-like subsidence). Combined with the quantitative analysis in Table 5, the Hejiata 30,104 working face has the highest similarity with the 20,601 fully-mechanized mining face (average similarity coefficient 0.92), and its main roof initial weighting step (36.0 m) and periodic weighting step range (8–16 m) are basically consistent with the results of the similar material simulation (initial weighting step 36m, periodic weighting step 8–16 m). This further verifies that the similar material simulation results of this study have high reliability and can provide a basis for the subsequent support optimization design.
6 Tunnel support optimization design
The upper coal seam of the Hejiata coal mine is divided into five panels, namely, the 3–1 coal is divided into 301 and 302 panels, and the 4–2 upper coal is divided into 401, 402, and 403 panels. The first mining face of the 301 panel, the 30,103 fully-mechanized mining face, was completely mined back on 4 December 2021. The 30,104 working face is the subsequent working face and will be mined back in 2022–2023. This paper will take the 30,104 working face as an example to conduct an optimized design of tunnel support. The mining plan for the upper coal seam of the Hejiata coal mine is shown in Figure 15.

Figure 15. Hejiata coal mine on the group of coal mining plan.
6.1 Principles of support optimization design
For the specific geological and production conditions of the Hejiata coal mine, to fully utilize the role of bolt support, the following design principles are proposed: (1) The principle of primary support; (2) The principle of high pretension and stress diffusion; (3) The “three highs and one low” principle; (4) The principle of critical support strength and stiffness; (5) The principle of mutual matching; (6) The principle of operability; (7) The principle of economic rationality.
6.2 Calculation of the loosening range of tunnel surrounding rock
The classification of the loosening circle of tunnel surrounding rock is a core content in establishing the evaluation method for the stability of surrounding rock (Hongwen et al., 2020). It aims to correctly evaluate the difficulty of surrounding rock support, determine the main support objects, and optimize support parameters. The development heading gateway of the Hejiata coal mine adopts a rectangular cross-section. After the rectangular tunnel is excavated, the calculation of the ultimate depth of the tunnel slice help in the unsupported state is shown in Equation 1. When this degree is reached, the roof’s self-stabilizing hidden arch will also be maximized, which is called the ultimate self-stabilizing hidden arch, and its calculation formula is shown in Equation 2.
In the formulas, hw represents the height of the tunnel side, in meters; W0 represents the width of the tunnel, in meters; P0 represents the vertical ground stress, in MPa; and σ2 represents the tensile strength, in MPa. Specifically, for the 30,104 working face auxiliary transport tunnel, the height of the tunnel side is 3.05m, and the tunnel width is 5.20m; for the 30,104 working face conveyor transport tunnel, the height of the tunnel side is 3.00m, and the tunnel width is 5.40m; the vertical ground stress is 1.51 MPa. Based on the mechanical test results of the roof and floor rock of the coal seam (Table 1), the tensile strength test result of the immediate roof medium-grained sandstone is taken as 1.65 MPa.
In summary, by calculating with Equations 1–4, the maximum loosening zone (hidden arch) depth of the roof for the 30,104 working face auxiliary transport tunnel is found to be 2.97m, and the maximum spalling depth of the coal side of the tunnel is 1.08m; for the 30,104 working face conveyor transport tunnel, the maximum loosening zone (hidden arch) depth of the roof is 3.08m, and the maximum spalling depth of the coal side of the tunnel is 1.06 m.
6.3 Optimization of bolt support parameters
6.3.1 Bolt length and spacing
Based on the hanging theory, the calculation of the bolt length (lb) in the coal side of the 30,104 working face auxiliary transport tunnel and the bolt length (L) in the roof rock layer of the transport tunnel is as follows:
In the formulas, lw is the length of the bolt exposed outside the rock mass, in meters, taken as 0.1m; lm is the anchoring length, in meters, taken as 0.25m; b is the depth of the loosening zone of the tunnel coal side, in meters; and ymax is the maximum depth of the roof loosening zone.
Based on the calculations from the previous context, the depth of the loosening zone (maximum spalling depth) of the coal side for the 30,104 working face auxiliary transport tunnel and the conveyor transport tunnel are 1.08 m and 1.06m, respectively. The maximum depth of the roof loosening zone for the 30,104 working face auxiliary transport tunnel and the conveyor transport tunnel are 2.97 m and 3.08m, respectively. By substituting the above parameters into Equations 5, 6, the bolt lengths in the coal side of the 30,104 working face auxiliary transport tunnel and the conveyor transport tunnel are calculated to be 1.43 m and 1.41m, respectively. The bolt lengths in the roof rock layer of the 30,104 working face auxiliary transport tunnel and the conveyor transport tunnel are calculated to be 3.32 m and 3.43m, respectively. It can be seen that the bolt lengths of 3.32m and 3.34 m in the roof rock layer exceed the general range of bolt lengths, indicating that the roof of the 30,104 working face auxiliary transport tunnel and the conveyor transport tunnel need to be reinforced with cable bolts.
When the depth of the tunnel roof loosening zone is greater than 1.5m, the design should further be carried out according to the theory of the combined arch formed by the bolt net. Based on the combined arch theory proposed by Cai and verified by Jiao et al., the calculation of the bolt length (L) in the roof rock layer of the 30,104 working face auxiliary transport tunnel and the conveyor transport tunnel is as follows:
In the formula,
The span of the roof in the auxiliary transport tunnel and the conveyor transport tunnel of the 30,104 working face are 5.2 m and 5.4m, respectively, hence the designed thickness of the composite arch formed by the bolt support is 1.2 m for both; furthermore, according to domestic and international engineering experience, the bolt spacing is taken as 0.8m, and the exposed length of the bolt tail is taken as 0.1 m. In summary, based on Equation 7, the bolt length in the roof rock layer of the auxiliary transport tunnel and the conveyor transport tunnel of the 30,104 working face is calculated to be 2.1m, with a bolt spacing of 0.8 m.
The diameter of the bolt is generally determined according to the strength principles of the rod’s load-bearing capacity and anchoring force, and the calculation formula is Equation 8:
In the formula, d is the bolt diameter, in millimeters; Q is the anchoring force, in kN, taken as 50 kN; σt is the tensile strength of the bolt material, in MPa, taken as 158 MPa.
Based on the aforementioned parameters, the bolt diameter is calculated to be 20 mm. Further, based on the bolt diameter, the bolt hole diameter is determined to be 28 mm. Additionally, the pretightening force of the bolt is key to achieving active support. For composite roofs, only with a reasonable pretightening force can the delamination of the roof be most effectively controlled, achieving the purpose of reinforcing the surrounding rock. According to field research, a pretightening force of at least 20 kN is required to reinforce the surrounding rock. Therefore, the pretightening force of the bolt in this design is 25 kN. The pretightening force is applied using a torque wrench. To achieve a pretightening force of 25 kN for an M16 thread, a torque of 80 N m must be applied. Considering construction factors and the initial loss of anchoring force, the pretightening torque of the bolt is determined to be 100 N· m.
6.3.2 Roof bolt support parameters
The span of the roof in the auxiliary transport tunnel and the conveyor transport tunnel of the 30,104 working face are 5.2 m and 5.4m, respectively, and the roof rock layer is a composite roof, with a potential delamination zone of more than 3 m. A certain number of roof bolts must be set in the roof to ensure safety. According to the current specifications of roof bolts in coal mine tunnels, the ultimate tensile strength of the roof bolt is 230 kN. The working resistance is designed at 80% of the ultimate strength of the roof bolt, and the anchoring force of the roof bolt is finally determined to be 180 kN. Based on the anchoring force of the roof bolt and the range that needs to be supported, the support density is selected at 0.5 times the height of the ultimate hidden arch. Considering that the bolt spacing is 0.8m, the bolt density can be taken as three times the bolt spacing, that is, the designed bolt spacing is 2.4 m.
According to the above parameters, the model of the roof bolt is selected as 1,524, which means the diameter of the roof bolt is 15.24 mm. Based on the size of the roof bolt diameter, the bolt hole can be the same as the bolt hole, with a hole diameter of 28 mm. According to the ultimate load of the roof bolt of 230kN, the anchoring length of the roof bolt is 0.77 m. The length of the roof bolt (lms) is determined by the maximum height of the roof delamination, the anchoring length of the roof bolt, and the exposed length, and the calculation formula is as follows:
In the formula, hlid is the maximum height of the roof delamination, in meters, taken as 3.43m; ljx is the anchoring length of the bolt, taken as 0.77m; c is the exposed length, taken as 0.3 m. The calculated length of the bolt from Equation 9 is 4.5 m. Considering a certain safety factor, the final determined length of the bolt is 5 m. In addition, the pretightening force of the bolt is designed at 40% of the working resistance (180 kN), and the pretightening force of the bolt is 70 kN.
7 Conclusion
7.1 Core research conclusions
This paper takes the Hejiata coal mine as the research background and, through methods such as indoor experiments, similar materials, and numerical simulations, deeply analyzes the stability of the surrounding rock during the mining of the 3–1 coal seam at the Hejiata coal mine. At the same time, based on the mining pressure characteristics of different types of shallow-buried coal seam working faces that have been mined, the reliability of the similar material simulation results in this paper is demonstrated. Finally, combined with the self-stabilizing hidden arch support theory and the application of the composite arch theory, an optimized design of the tunnel support is carried out. The following conclusions are drawn:
1. The weathered rock in the weathering zone and the mudstone in the coal seam floor are all unstable rocks. The medium-grained sandstone in the immediate roof and the fine-grained sandstone in the main roof are unstable rocks as a whole, and the local part is medium-solid rock. The uniaxial compressive strength of the mudstone after saturation is only 0.38 times that of its dry state, indicating a very significant reduction in rock strength. The mineral composition of the mudstone includes andalusite, illite, and quartz, and montmorillonite was also detected in sample NY-1. Montmorillonite has a strong tendency to swell and soften upon contact with water. In practical engineering, it is necessary to take timely water prevention and isolation measures to eliminate the softening effect of water on the rock and to prevent rock expansion due to water absorption. This is also important to avoid the impact of the strength reduction of mudstone on construction safety.
2. After water immersion, the weathered rock shows an expansion of the cleavage cracks after 15 min, and circumferential cracks form around the rock after 30 min. Subsequently, as the duration of water immersion increases, the rock’s shape remains almost unchanged. The mudstone, after being immersed in water, produces a small amount of bubbles and undergoes continuous mudification reactions. After 15 min of water immersion, the surface begins to crumble into several small pieces. After 30 min, the area of disintegration increases and the disintegration appears as flocculated and powdered material. After 2 h, the disintegrated material consists of granular and flaky fragments.
3. After coal seam mining, the roof of the goaf will collapse and form two types of intersecting fractures: one is the inter-layer horizontal detachment cracks, and the other is the vertical breaking cracks. At the Hejiata coal mine, the immediate roof’s initial collapse step distance is 18m, and the old roof’s initial pressure step distance is 36m, with periodic fractures occurring every 8–16 m of face advancement. When the working face advances to 78m, the overlying rock layers begin to collapse in an “arc-shaped rock column” pattern; when the face advances to 106m, vertical cracks appear in the laterite overburden, and fractures develop upward, causing detachment between the laterite and the sand layer; when the face advances to 130m, the fractures further develop, and the sand layer experiences goose-shaped downward fractures; when the face advances to 140m, the damage fractures directly extend to the surface without any “step-like subsidence.” Finally, based on the mining pressure characteristics of four different types of shallow-buried coal seam working faces that have been mined, the reliability of the similar material simulation results in this paper is demonstrated.
4. During the mining process of the 3–1 coal seam, a “secondary distribution” of the surrounding rock stress is induced, leading to localized increases or decreases in stress. Within a certain range of the goaf roof and floor, an approximate “arch” type stress release area is formed. When the advance distance of the working face is less than 140m, the peak value of the supporting pressure in front of the working face, the concentration coefficient, the peak position, and the influence range of the supporting pressure all show a continuous increasing trend. When the advance distance is greater than 140m, the roof of the goaf sinks and comes into contact with the floor, and the stress concentration phenomenon on the roof within the goaf becomes apparent. The peak stress at the ends of the working face correspondingly decreases, while the influence range remains almost unchanged.
5. As the working face continuously advances, the overhanging length of the roof increases, the vertical displacement of the roof continues to grow, while the displacement at the end of the working face is minimal. The deformation, damage, and movement of the overburden rocks above the working face progressively intensify. Along the strike direction of the working face, the peak value of the vertical displacement of the roof rocks keeps increasing, and the position of the peak value changes with different advance distances. The vertical heave of the floor continuously increases, with the heave peak value location roughly at the center of the goaf, but its numerical change is much smaller compared to the changes in the vertical displacement of the roof.
According to the self-stabilizing hidden arch support theory, the maximum loosening zone depth of the roof in the auxiliary transport tunnel and the conveyor tunnel of the 30,104 working face is determined to be 2.97 m and 3.08m, respectively, and the maximum slabbing depth of the coal side is determined to be 1.08 m and 1.06m, respectively. Applying the composite arch theory, the anchor rod length is determined to be 2.1m, the anchor rod diameter is 20mm, the anchor rod spacing is 0.8m, the anchor hole diameter is 28mm, and the designed pretightening force for the anchor rods is 25kN, with a pretightening torque of 100 N·m. The anchor cable anchorage force is 180kN, the spacing between anchor cables is 2.4m, the anchor cable diameter is 15.24mm; the anchor cable hole diameter is 28mm, the length of the anchor cable is 5m, and the pretightening force for the anchor cable is 70 kN.
7.2 Research limitations and future prospects
7.2.1 Research limitations
Anisotropy of rock mass not considered: In this study, both laboratory tests and numerical simulations assume that the rock mass is isotropic. However, in reality, the sandstone roof of the 3-1 coal seam has well-developed bedding, and the floor mudstone has horizontal cracks. The mechanical parameters of the rock mass (such as compressive strength and elastic modulus) differ between the bedding direction and the vertical direction, which may lead to a deviation of approximately 5%–10% between the simulated stress distribution and the actual situation (Denghong and Xinzhu, 2017).
Simplification of dynamic mining process: Both the similar material simulation and numerical simulation adopt the assumption of “uniform speed advancement”, which does not consider the impact of shutdown maintenance and fluctuations in advancement speed on roof deformation during actual mining, nor does it simulate the stress redistribution during the compaction process of goaf gangue.
Simplification of hydro-mechanical coupling effect: The water immersion test only analyzes the impact of static water on the rock mass, without considering the dynamic weakening of rock mass strength by groundwater seepage (such as changes in pore water pressure) during mining, nor does it involve the time-dependent deformation of the rock mass under long-term water erosion.
7.2.2 Future research directions
Multi-field coupling research: Carry out water-mechanical-chemical (WMC) coupling research, establish a coupling model by combining FLAC3D and COMSOL Multiphysics, analyze the dynamic impact of groundwater seepage and chemical erosion (such as montmorillonite swelling when encountering water) on the mechanical parameters of the rock mass (Zhang et al., 2023), and quantify the strength attenuation rate of the floor mudstone under hydro-chemical action.
Anisotropic rock mass simulation: Obtain the anisotropic parameters of the rock mass based on the bedding direction mechanical tests of on-site drilling cores (Yanchun et al., 2023), modify the Mohr-Coulomb model to an anisotropic constitutive model, and improve the accuracy of stress and displacement simulation.
Optimization of dynamic mining process: Introduce the “non-uniform speed advancement” and “gangue compaction delay” modules, simulate the roof weighting law under different advancement speeds (such as 3 m/d and 5 m/d), and provide a basis for adjusting the actual mining speed.
Field monitoring verification: Arrange an optical fiber sensing monitoring system in the 30,104 working face to monitor the vertical displacement and stress changes of the roof in real time, compare the simulation results with the field data, and further modify the support parameters.
Data availability statement
The original contributions presented in the study are included in the article/supplementary material, further inquiries can be directed to the corresponding author.
Author contributions
ZP: Conceptualization, Funding acquisition, Project administration, Resources, Supervision, Writing – original draft, Writing – review and editing. JC: Formal Analysis, Investigation, Methodology, Visualization, Writing – original draft, Writing – review and editing. GS: Data curation, Software, Writing – original draft, Writing – review and editing, Conceptualization. FJ: Data curation, Resources, Software, Writing – original draft, Writing – review and editing. WC: Project administration, Validation, Writing – original draft, Writing – review and editing, Formal Analysis.
Funding
The authors declare that no financial support was received for the research and/or publication of this article.
Conflict of interest
The authors declare that the research was conducted in the absence of any commercial or financial relationships that could be construed as a potential conflict of interest.
Generative AI statement
The authors declare that no Generative AI was used in the creation of this manuscript.
Any alternative text (alt text) provided alongside figures in this article has been generated by Frontiers with the support of artificial intelligence and reasonable efforts have been made to ensure accuracy, including review by the authors wherever possible. If you identify any issues, please contact us.
Publisher’s note
All claims expressed in this article are solely those of the authors and do not necessarily represent those of their affiliated organizations, or those of the publisher, the editors and the reviewers. Any product that may be evaluated in this article, or claim that may be made by its manufacturer, is not guaranteed or endorsed by the publisher.
References
Chang, L., Yuxing, L., and Qin, M. (2018). Study on drift stability optimization based on 3D geo-stress measuremen. Chin. J. Undergr. Space Eng. 14 (5), 1372–1380. doi:10.20174/j.juse.2018.05.029
Chaojiong, H., Xiangyu, W., Jianbiao, B., Ningkang, M., and Wenda, W. (2021). Basic theory and technology study of stability control for surrounding rock in deep roadway. Jiangsu, China: Journal of China University of Mining and Technology, 50, 1–12. doi:10.13247/j.cnki.jcumt.001242
Dai, L., Zhao, X., Pan, Y., Luo, H., Gao, Y., Wang, A., et al. (2025). Microseismic criterion for dynamic risk assessment and warning of roadway rockburst induced by coal mine seismicity. Eng. Geol. 357, 108324. doi:10.1016/j.enggeo.2025.108324
Denghong, C., and Xinzhu, H. (2017). The deformation law of the sur-rounding rock in deep mining roadways under the influence of multi-factors and the control counter measures. J. Mining and Safety Eng. 34 (4), 760–768. doi:10.13545/j.cnki.jmse.2017.04.022
Hongpu, K., Pengfei, J., Fuqiang, G., Ziyue, W., Chang, L., Jianwei, Y., et al. (2021). Analysis on stability of rock surrounding heading faces and technical approaches for rapid heading. J. China Coal Soc. 46 (07), 2023–2045. doi:10.13225/j.cnki.jccs.JJ21.0946
Hongguang, J., Lihui, S., Zhaoyang, S., Yuezheng, Z., Jiuhong, W., Zhiqiang, M., et al. (2023). Research progress on stability control of surrounding rock in weakly cemented strata engineering in Western China mining area. Coal Sci. Technol. 51 (01), 117–127. doi:10.13199/j.cnki.cst.2022-1784
Hongpu, K. (2021). Seventy years development and prospects of stra-ta control technologies for coal mine roadways in China. Chin. J. Rock Mech. Eng. 40 (1), 1–30. doi:10.13722/j.cnki.jrme.2020.0072
Hongpu, K., Gang, X., Biaomou, W., Yongzheng, W., Pengfei, J., Junfeng, P., et al. (2019). Forty years development and prospects of underground coal mining and strata control technologies in China. J. Min. Strata Control Eng. 1 (02), 7–39. doi:10.13532/j.jmsce.cn10-1638/td.2019.02.002
Hongwen, J., Qingbin, M., Junfu, Z., Bo, M., and Liyuan, W. (2020). Theoretical and technical progress of stability control of broken rock zone of deep roadway surrounding rock. J. Min. and Saf. Eng. 37 (03), 429–442. doi:10.13545/j.cnki.jmse.2020.03.001
Jia, C., Lai, X., Cui, F., Xu, H., Zhang, H., Li, Y., et al. (2024). Mining Pressure Distribution Law and Disaster Prevention of Isolated Island Working Face Under the Condition of Hard “Umbrella Arch”. Rock Mech. Rock Eng. 57 (10), 8323–8341. doi:10.1007/s00603-024-03961-z
Jialin, X., Weibing, Z., Xiaozhen, W., and Maosen, Y. (2009). Classification of key strata structure of overlying strata in shallow coal seam. J. China Coal Soc. 34 (7), 865–870. doi:10.13225/j.cnki.jccs.2009.07.003
Jialin, X., Weibing, Z., and Jinfeng, J. (2014). Supports crushing types in the longwall mining of shallow seams. J. China Coal Soc. 39 (08), 1625–1634. doi:10.13225/j.cnki.jccs.2014.9006
Jiankang, J., Zhen, Z., Lixin, Y., Yiqun, Z., Jianbo, L., Qianli, C., et al. (2022). Stability quantitative evaluation and grading support technology of roadway surrounding rock in small and medium coal mine. J. Min. and Saf. Eng. 39 (03), 598–606. doi:10.13545/j.cnki.jmse.2021.0377
Jiye, G., Fangtian, W., Yang, Z., Jianguang, B., and Gang, L. (2019). Research on key control technology of surrounding rock in high stress roadway. Coal Sci. Technol. 47 (09), 189–196. doi:10.13199/j.cnki.cst.2019.09.023
Junliang, W. (2020). Surrounding rock stability control technology of soft rock roadway passing water conductive fault. Saf. Coal Mines 51 (12), 85–92. doi:10.13347/j.cnki.mkaq.2020.12.016
Meifeng, C. (2020). Key theories and technonogies for surrounding rock stability and ground control in deep mining. J. Min. Strata Control Eng. 2 (03), 5–13. doi:10.13532/j.jmsce.cn10-1638/td.20200506.001
Peisen, Z., Daqiang, X., Wei, Y., Xin, H., Xiaole, Z., Yuhang, D., et al. (2023). Study on the influence of cyclic confining pressure on rock deterioration and seepage characteristics under different initial damage degrees. Chin. J. Rock Mech. Eng. 42(09), 2109–2124. doi:10.13722/j.cnki.jrme.2022.1013
Qi, W., Hongpu, K., Bukang, W., Fuqiang, G., Zhiyuan, S., and Shuai, W. (2025). Research on surrounding rock partitioned parallel anchoring technology in rapid heading faces[J/OL]. Chin. J. Rock Mech. Eng., 1–14. doi:10.13722/j.cnki.jrme.2022.1315
The National Standard Compilation Group of the People's Republic of China (1999). GB/T50266-99 standard for test methods of engineering rock mass[S]. Beijing: China Plan Publishing House.
Wanpeng, H., Tongyang, Z., Donghai, J., Xiaosheng, G., Yongsheng, Z., Xuewen, W., et al. (2023). Arrangement of double entry driving with a narrow coal pillar in the middle and stability control technology of surrounding rock. Chin. J. Rock Mech. Eng. 42 (03), 617–629. doi:10.13722/j.cnki.jrme.2022.0302
Wenjie, Z., Manchao, H., Wang, J., and Manjiang, C. (2025). Extra thick high roof cutting roof self-formed roadway surrounding rock control technology[J/OL]. J. Min. and Saf. Eng., 1–13. doi:10.13545/j.cnki.jmse.2023.0019
Wu, X., Cai, M., Wu, X., Li, P., Zhang, S., and Sun, J. (2025). Experimental study on nonlinear failure criterion of HDR under cyclic water-induced thermal shock. Bull. Eng. Geol. Environ. 84 (5), 255. doi:10.1007/s10064-025-04313-z
Xu, H., Lai, X., Shan, P., Yang, Y., Zhang, S., Yan, B.-X., et al. (2022). Energy dissimilation characteristics and shock mechanism of coal-rock mass induced in steeply-inclined mining: comparison based on physical simulation and numerical calculation. Acta Geotech. 18, 843–864. doi:10.1007/s11440-022-01617-2
Yanchun, X., Zimin, M., Xiaoer, L., Wei, M., Ermeng, Z., Wenhao, J., et al. (2023). Research on the influence of the nature of the weathered bedrock zone on the roof water bursting and sand bursting: taking zhaogu no. 1 Mine as an example. Coal Sci. Technol. 51 (07), 64–71. doi:10.13199/j.cnki.cst.2021-1268
Yao, D., and Gang, L. (2020). Reasonable width of narrow coal pillars in roadway driving with gas drainage hole. J. Min. Strata Control Eng. 2 (01), 75–83. doi:10.13532/j.jmsce.cn10-1638/td.2020.01.008
Yingliang, X., Ping, S., Yongdong, J., Yong, Z., Qijun, J., Xiao, S., et al. (2022). Stability analysis of roadway surrounding rock in mining area of large inclination and medium thick coal seam. Coal Technol. 41 (05), 53–57. doi:10.13301/j.cnki.ct.2022.05.014
Zhang, J.-M., and Meng, F.-L. (2022). Main controlling factors of surrounding rock stability structure for gob-side entry driving in thick coal seam. Coal Eng. 54 (10), 43–48. doi:10.11799/ce202210009
Zhang, L., Wang, M., Zhang, B., Xi, X., Zhang, Y., Cai, M., et al. (2025). Damage mechanism of coal samples under the coupling effect of sulfate erosion and wet-dry cycles: experiments, constitutive models, and numerical simulations. Phys. Fluids 37 (7). doi:10.1063/5.0281708
Zhang, S., Sun, Y., Cao, J., Lai, X. P., and Wu, L. Q. (2025). Research and optimization on the strength recovery mechanism of post peak fragmentation grouting reinforcement in mining rock mass. Front. Mater. 12. doi:10.3389/fmats.2025.1612050
Zhang, S., Lai, X., Cao, J., Xu, H., Zhang, Y., Yan, B., et al. (2026). Theoretical analyses of surrounding rock stress of a non-circular tunnel considering the horizontal inclination of initial principal stress field. Tunnelling Underground Space Technol. 167, 106994. doi:10.1016/j.tust.2025.106994
Keywords: mining engineering, shallow coal seam, mechanical properties, stability of surrounding rock, support optimization
Citation: Pei Z, Chunyu J, Shuchao G, Jiayao F and Chenghong W (2025) Stability analysis and support scheme optimization design of roadway surrounding rock in shallow coal seam with thin bedrock. Front. Built Environ. 11:1666542. doi: 10.3389/fbuil.2025.1666542
Received: 10 August 2025; Accepted: 22 September 2025;
Published: 03 December 2025.
Edited by:
Asa Barber, City University of London, United KingdomReviewed by:
Wang Qun, Taiyuan University of Technology, ChinaJiliang Pan, University of Science and Technology Beijing, China
Copyright © 2025 Pei, Chunyu, Shuchao, Jiayao and Chenghong. This is an open-access article distributed under the terms of the Creative Commons Attribution License (CC BY). The use, distribution or reproduction in other forums is permitted, provided the original author(s) and the copyright owner(s) are credited and that the original publication in this journal is cited, in accordance with accepted academic practice. No use, distribution or reproduction is permitted which does not comply with these terms.
*Correspondence: Zhang Pei, MTUzNzMwMjg3NTJAMTYzLmNvbQ==