 Ruiqi Sheng
 Wenzheng Liu
 Haobo Wei1
 Heng Zhang
 Bowei Sun
- 1School of Transportation Science and Engineering, Civil Aviation University of China, Tianjin, China
- 2College of Civil Engineering, Shaanxi Polytechnic University, Xianyang, China
Water damage caused by rainwater permeation significantly affect the durability of asphalt pavements. However, previous research lacked investigation of the permeability of dense-graded asphalt concrete (DGAC) from the view of meso-structure. This study systematically investigates the effects of nominal maximum aggregate size (NMAS) and compaction effort on the meso-scale pore structure of DGAC, further quantitatively analyzing the correlation between pore characteristics and permeability. In addition, an innovative “transparent dense-graded asphalt concrete” (TDGAC) method is applied to realize the visualization of the permeation process is asphalt mixtures. The results show that increasing compaction effort significantly reduces total air void contents and maintains the longitudinal “bathtub-shaped” distribution pattern. Besides, larger NMAS leads to more interconnected medium-large pores and a larger equivalent diameter of voids, which in turn results in higher permeability. Additionally, 5% and 7% air void contents are identified as critical permeability thresholds for AC-13 and AC-20, respectively. The correlation analysis indicates that permeability is primarily controlled by the pores with a volume larger than 5 mm3. The TDGAC visualization results directly confirm that the interfaces of coarse aggregates are the main pathways for water migration. The study explains the influence of compacting factors on meso-structures of DGAC, and establishes the relationship between pore characteristics and permeability, providing a theoretical basis to understand the mechanism of water-related pavement distress.
1 Introduction
Asphalt concrete is a commonly three-phase porous material, comprised of coarse aggregates, fine asphalt mortar, and air voids. Due to the convenient workability and favorable pavement performance, DGAC is commonly used as a highway pavement structure worldwide (Cox et al., 2017). During the service period, asphalt pavements are inevitably subject to the erosion of rainwater, and the infiltration of rainwater into asphalt pavements could significantly weaken the adhesion of asphalt binder and aggregates, further generating cracking, potholes, loosening, and rutting diseases (Neupane and Wu, 2025). Moisture-related diseases are regarded as the most serious and harmful type in the early damage to asphalt pavements. To maintain the pavements’ performance, local government has to devote amounts of unnecessary financial and human labor resources to this regard.
In fact, the movement of rainwater in pore structures is the main cause that induces the moisture-related pavement distress. According to previous research (Neupane and Wu, 2025; Pang and Hao, 2017; Guo et al., 2020), the migration modes include capillarity, water vapor diffusion, and permeation. Among them, water permeation is believed as the main source that enters the pavement and affects the structural performance of asphalt mixtures (Zou et al., 2023; Maurya and Singh, 2024). Normally, the coefficient of permeability (k) is used to characterize the liquid water features of infiltrating asphalt mixtures. Permeability is defined as the ability of porous materials to transmit moisture through their inner structure, usually described by the coefficient of permeability (Xu et al., 2019). Researchers claim that higher permeability represents more easily suffering moisture damage (Wang et al., 2019; Xu and Bian, 2024). In order to quantitatively characterize the coefficient of permeability, constant water head permeation meter and variable head permeation meter are currently two commonly used devices for testing the permeability coefficient of asphalt mixtures. Comparing with the open-graded asphalt concrete (OGAC), the DGAC is considered more sensitive to moisture-related distress, since the moisture is hard to discharge through the complicated pore channel and increases the retaining time within the inner structure (Zhang et al., 2024). Therefore, understanding the permeability characteristics of DGAC is essential to improving the durability of highway pavements.
When the moisture has entered the asphalt pavements, the inner structures of the asphalt mixtures determine the characteristics of moisture migration. Generally, the air void content is considered to be the decisive factor that controls the permeability. Reference (Che et al., 2021) has claimed that the permeability of asphalt mixture can be divided into three types: impermeable, permeable but hard to discharge, and discharge, corresponding to air void content of 0–5%, 5%–20% and over 20%, respectively. For the DGAC, the air void content usually exists at 2–10%, including impermeable and permeable types. With the development of advanced digital image processing techniques, researchers have recognized that the air void content is not the single factor determining the characteristics of internal moisture migration. X-ray CT supplies a powerful method to capture the features of pore structure. Most researchers devote efforts to finding the effects of pore structure on the permeability on the meso-scale. Yang et al. (2017) concluded that the pore number, area, and equivalent diameter have a strong correlation with permeability. Ren et al. (2023) classed the pore structure into connected pores, open pores, and closed pores, and found that only the interconnected pores and open pores contribute to the permeability. Chen et al. (2023) and Xu et al. (2018) found that over 80% of the interconnected pores contribute to the permeability, and these pores were more meaningful than the total air voids in describing the permeability. Although the meso-scale pore structure significantly affects the permeability of asphalt mixtures, few studies focus on the influence of preparation parameters on the pore morphology characteristics of DGAC. Asphalt mixtures are composed of black asphalt binder and opaque aggregates, and it is difficult to observe the migration state of moisture. The application of transparent soil provides a novel approach for the visualization of moisture migration (Kong et al., 2017; Ding et al., 2018; Li et al., 2021). The theoretical basis is the selection of aggregates with the same refractive index and binder to achieve the effect of internal transparency under the irradiation of light. Thus, applying the improvements to asphalt mixtures could help investigate the moisture migration in DGAC. However, due to the complexity of the internal structure, there are limited studies of the factors that affect the permeability characteristics of DGAC. Thus, conducting work on the characteristics of internal structure and corresponding influencing factors of DGAC, further investigating the correlation of pore structure and permeability characteristics is beneficial to understanding the mechanism of moisture-related issues in asphalt pavements.
In this paper, the effects of fabricating parameters (nominal maximum size of aggregate and compaction efforts) on pore structures are carefully examined through X-ray CT. Then, the relationship of meso-structure and permeability is established to determine the influence characteristics. At last, the TDGAC is designed and fabricated according to the basic theory of transparent soil, and the TDGAC is used to explain the permeability characteristics of DGAC.
2 Materials and experiments
2.1 Preparation of specimens
This study employed SBS-modified asphalt binder and limestone aggregates to prepare the DGAC specimens. As aforementioned, both nominal maximum size of aggregate (NMSA) and compaction efforts are considered in this study. Thus, two common aggregate gradations (AC-13 and AC-20, see Figure 1) and three kinds of compaction cycles (50, 75, and 100) are designed to obtain distinctive specimens. The gyratory compaction method is used to prepare the cylinder specimens with a 100 mm diameter and 150 mm height. In order to ensure the relative uniform distribution of pore structures, both ends part within 15 mm height are removed. Besides, considering the inhomogeneous distribution features of pore structures, the testing specimens with different heights are fabricated by a cutting machine, a specific process, as shown in Figure 2.
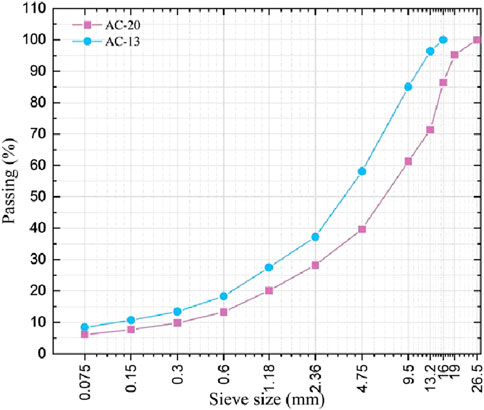
Figure 1. The different gradation design.
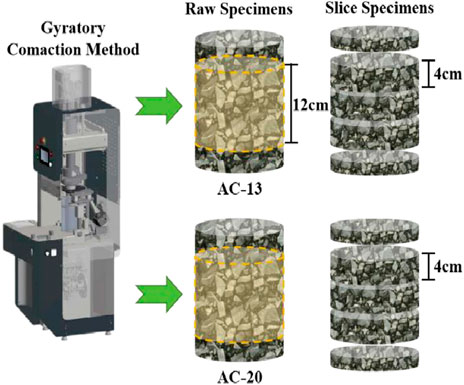
Figure 2. The preparation of testing specimens.
2.2 CT scanning and image processing
Considering the non-transparent feature of asphalt concrete, the meso-scale pore characteristics were examined through nondestructive CT scanning coupled with advanced image processing. To ensure the quality of the obtained pictures, the asphalt mixture specimens are scanned by the industrial YXLON FF35−ΔΔCT, which could output a 16-bit grayscale image with 65,536 levels of intensity that correspond to different densities of the component (aggregate, asphalt mortar and voids) within the asphalt mixtures. The parameters incorporated into a scanning are the current intensity and voltage of 1 mA and 225 kV, respectively. For the output 2D slices, Avizo software is employed to conduct image data visualization and quantitative analysis, which provides various operation module to separate and analyze the different material phases (air voids, asphalt mortar, aggregates).
2.3 Permeability test
This study employed a developed variable head permeability apparatus, referring to our previous research (Li et al., 2024). Comparing with traditional variable head permeability apparatus, the developed apparatus is benefit to measure permeability of asphalt specimens with varying heights. Moreover, in order to ensure the water transportation along the vertical direction, the silicone rubber binder, silicone sealing film, and O-ring were utilized to prevent the water from flowing out to the sides. More detailed information in reference (Li et al., 2024). The fundamental components of the apparatus are illustrated in Figure 3. The specific testing process is described as follows.
1. Applying silicone rubber binder on the surface of the testing specimens, and wrapping the specimen with a rubber membrane, ensure the water migration through the vertical direction.
2. Using a rubber O-ring to hoop the equipment and test specimens, further ensuring the connectivity between them.
3. Pouring sufficient water into the upper surface of the specimen, and recording the Initial water level height as H1 and the corresponding time as t1. Then, start the testing process until reaching the targeted water level (H2) and recording the end time as t2. The average permeability is expressed as Equation 1:
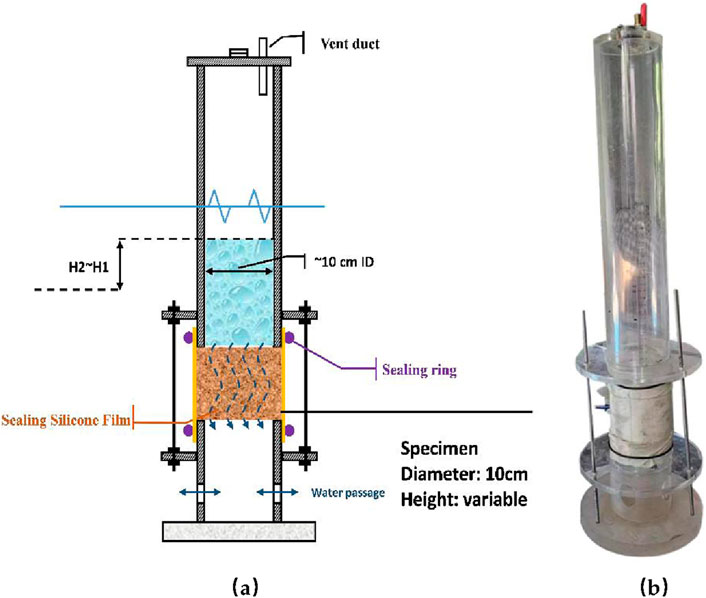
Figure 3. The schematic and actual object of the permeability test apparatus. (a) Schematic Diagram of the Apparatus (b) Physical Photograph of the Apparatus.
Where
The formula for calculating the permeability of the medium in the permeability coefficient experiment is expressed as Equation 2:
Where K represents the permeability of the asphalt mixture in units of square meters (m2); Q denotes the permeation water volume through the specimen in units of cubic meters per second (m3/s); μ indicates the viscosity of pure water, which is a constant value of in this study;
2.4 Preparation and penetration visualization of TDGAC
The polished crystal crushed stone is a kind of aggregate particle with excellent transparency, which has similar physical properties to mineral aggregates (density is 2.6 g/cm3, see Figure 4). The refractive index of the selected crystal in this study is 1.558, which is measured by an Abbe refractometer. Considering the cohesive force of binder materials, epoxy glue is selected to replace asphalt binder, which shows a similar refractive index (1.542) to crushed crystal stone. For the preparing of TDGAC, identical aggregate graduation was adopted to ensure the TDGAC has similar internal structural characteristics with the DGAC (see Figure 1). It should be mentioned that considering the shape characteristics and convenience of the TDGAC specimens, we used the wheel rolling method instead of the gyratory compaction method. Both compaction methods are followed by the Chinese specification “Standard Test Methods of Asphalt and Asphalt Mixture for Highway Engineering”, ensuring that the specimens prepared by the two methods have similar structural characteristics. Besides, in order to prevent the problem of difficult demolding for TDGAC, a layer of silicone film is laid around to avoid the epoxy glue from adhering to the iron mold.
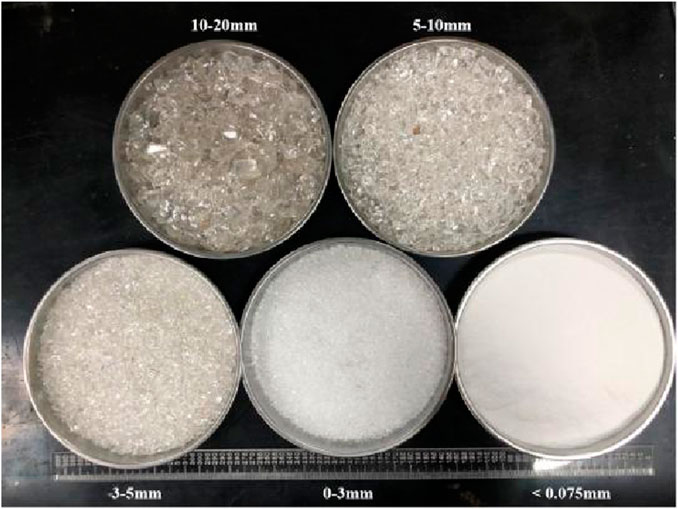
Figure 4. The polished crystal stone.
Due to the similar transparency of water and crushed stone, it is difficult to observe the moisture migration process in the internal structure of TDGAC. Therefore, the mixture of blue ink (moisture content above 90%) and medical Iodophor solution (effective iodine content of 4.5–5.5 g/L) was selected as the permeable liquid, and its main component was still water, which only affected the migration rate of the solution without changing the direction of migration. For visualization of the permeation process, using light transmission method was developed to enhance visualization of permeation results, see Figure 5.
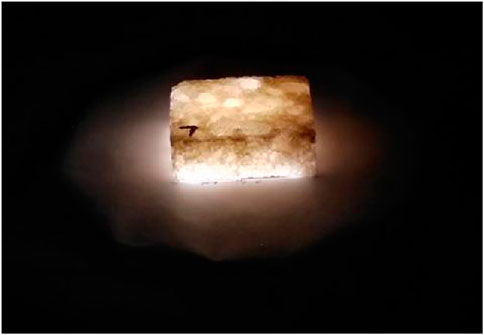
Figure 5. The visualization of the permeation test.
3 Results and discussion
3.1 The effects of NMAS on pore characteristics
3.1.1 Air void contents distribution
Figure 6a illustrates the air void distribution patterns of AC-13 and AC-20. It can be drawn that two kinds of mixtures present a “bathtub” feature, which shows both end parts (top/bottom 2 cm) have more air voids, while the middle part has limited amounts. Specifically, the AC-20 displayed 2%–6% higher void content than AC-13 within the terminal parts, while the middle part maintained a narrower differential below 2%. These results imply that the structure at the end positions is relatively more difficult to compact for the asphalt mixtures with NMAS. These findings are similar to Kutay’s investigation (Wen et al., 2011). As shown in Figure 6b, the results confirm that mixtures with larger NMAS tend to develop higher void concentrations under identical compaction conditions, especially for the terminal parts. Although the NMAS affects the total air void contents of DGAC with identical compaction efforts, it shows similar void contents distribution characteristics. It can be seen that the research conducted in this study on the void ratios of DGAC has a general regularity.
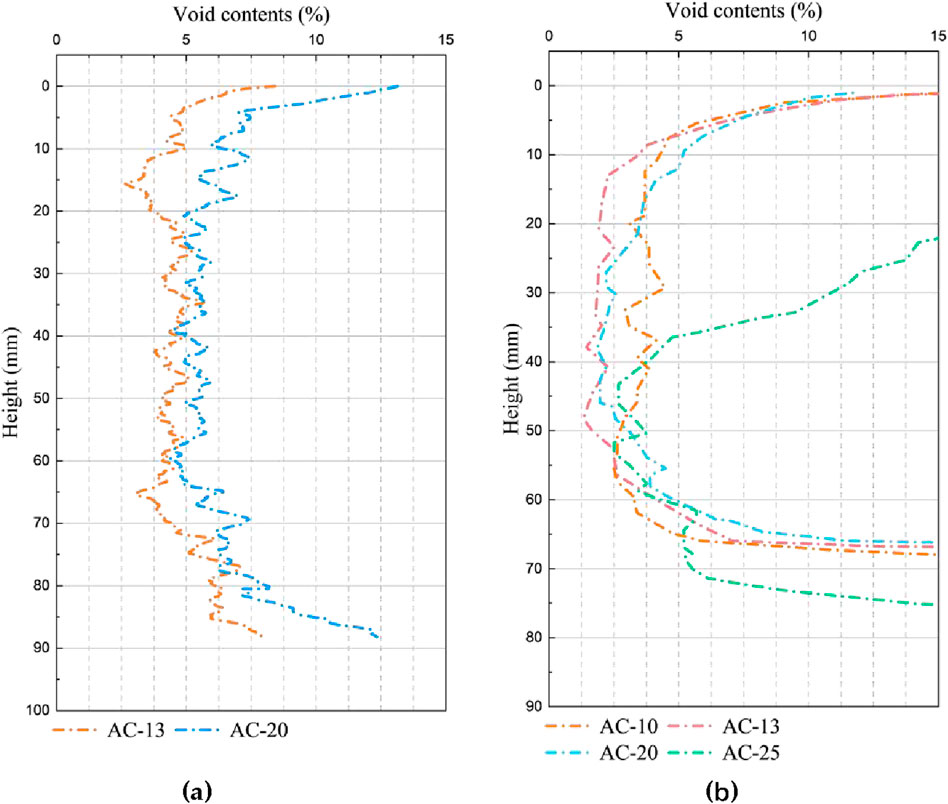
Figure 6. The distribution of air void contents in various gradations: (a) AC-13 and AC-20; (b) the results in reference (Wen et al., 2011).
The average air void contents are an essential parameter for asphalt mixtures. CT scanning analysis revealed that the air void contents are 5.19% and 6.36% for AC-13 and AC-20 specimens with identical compaction efforts (75 gyratory cycles), respectively. This result exhibits slightly higher values than water intrusion porosimetry (laboratory standard testing method), where the measured air void contents are 4.89% and 6.01%, respectively. This discrepancy primarily stems from the inherent limitation of conventional measurement techniques in detecting isolated internal voids. The comparative analysis between measured and computed void contents confirms the superior accuracy of the CT-based methodology in capturing comprehensive void characteristics.
3.1.2 Air void volume characteristics
Pore volume is a critical factor governing moisture transport behavior within asphalt mixtures. Voids of different scales dominate distinct moisture transport mechanisms: minute voids primarily adsorb and transport moisture via capillary action; medium-sized voids are influenced by both capillary forces and gravity; while large voids predominantly facilitate drainage under gravity and can form rapid pathways for moisture movement. Consequently, accurately distinguishing and quantifying voids based on their volume scale is essential for a deeper understanding of internal moisture migration pathways, evaluating the mixture’s resistance to moisture damage, and predicting its long-term durability. However, despite the void volume classification method being widely employed for categorizing void scales, a unified standard for classifying void volume scales remains lacking. In order to facilitate the statistics of void volume information, this study developed a classification criteria for void volume scale based on a relevant literature (Gong, 2017). Specifically, the voids are categorized as small voids (1–5 mm3), medium voids (5–20 mm3), and large voids (larger than 20 mm3). And the voids with volume small than 1 mm3 are regard as ineffective for water transportation. Besides, to analyze the heterogeneity of voids in spatial distribution, the specimens were longitudinally divided into three equal segments for stratified analysis. Figure 7 presents the volumetric distribution and percentage composition of voids in AC-13 and AC-20 mixtures. As depicted in Figure 7a, the middle parts of both mixtures exhibited fewer voids across all size categories compared to the upper and lower parts. Furthermore, at identical observation locations, the AC-20 specimen exhibited a significantly greater number of pores, particularly medium-sized and large pores, compared to the AC-13 specimen, with nearly twice as many.
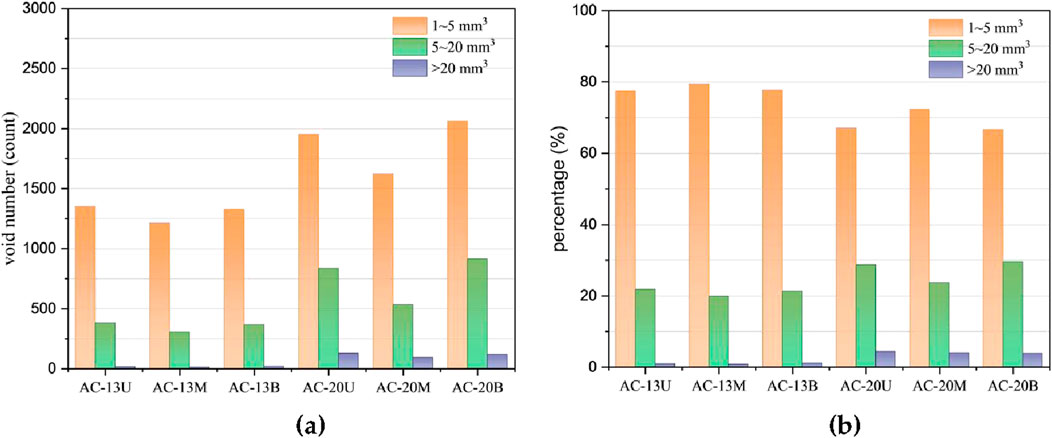
Figure 7. The void volume characteristics with different NMAS: (a) void particle counts; (b) percentage of void particles.
The void counts indicate the absolute value of the distribution characteristic at different positions. Analyzing the proportion of different void volume scales can clearly define the composition characteristics of the voids in asphalt mixtures at different positions. Figure 7b reveals distinct spatial patterns in void size distribution. Small voids dominated the central regions, constituting approximately 80% of total voids, while their proportion decreased to 60%–70% in the terminal sections. Conversely, medium and large voids exhibited an inverse trend, accounting for 20%–30% of voids at the top and bottom regions but less than 20% centrally. This phenomenon arises from the denser compaction in the middle regions, which fragments larger voids into amounts of smaller void particles. The comparative analysis highlights gradation-dependent characteristics. For AC-13, small voids comprised 70%–80% of total voids, whereas AC-20 exhibited a lower proportion (60%–70%), accompanied by a 10%–15% increase in medium/large voids. These findings confirm that mixtures with larger NMAS, such as AC-20, inherently develop more interconnected medium-to-large voids under equivalent compaction energy, directly contributing to their elevated overall void contents.
3.1.3 Equivalent diameter of the air void
The analysis of void volume distribution demonstrates that the NMAS governs both the volumetric scale and equivalent diameter characteristics of internal voids in asphalt mixtures. The equivalent diameter of the air void is a metric used to quantify the size of irregular void particles in asphalt mixtures, which is an important parameter that determines the ease of flow characteristics of NMAS. By converting geometrically complex voids into an equivalent spherical diameter. To investigate the gradation-dependent variations in equivalent diameter of voids, the equivalent void diameters of AC-13 and AC-20 specimens were calculated using the equivalent diameter methodology (Sun et al., 2023), which is expressed as Equation 3:
Where V denotes the volume of the particle and Deq represents the equivalent diameter.
Figure 8 presents the stratified analysis results for three longitudinal segments, with gradient blue tones (light to dark) representing the upper, middle, and lower sections of AC-13, while gradient orange tones correspond to AC-20. The results reveal apparent differences in void diameter distributions between these two gradations. For AC-13, the equivalent diameter values measured 2.1 mm (upper), 2.0 mm (middle), and 2.1 mm (lower), and the AC-20 exhibited larger diameters of 2.7 mm (upper), 2.5 mm (middle), and 2.7 mm (lower). Although minimal intra-specimen variations (≤0.2 mm) were observed across the vertical direction, the middle part consistently showed slightly reduced equivalent diameter values compared to the terminal parts. This pattern confirms that mixtures with larger NMAS (AC-20) develop voids with greater equivalent diameters under equivalent compaction energy, and the magnitude of increase (0.6–0.7 mm) may benefit to significantly alter water permeability through interconnected void networks.
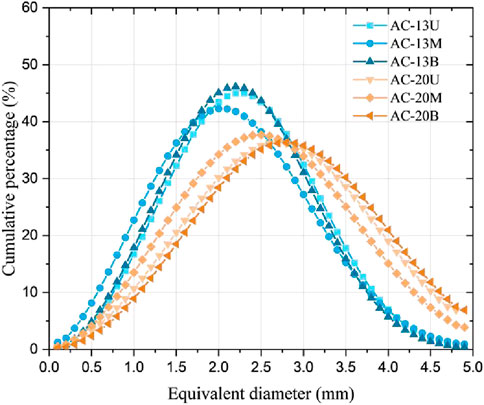
Figure 8. The equivalent diameter of voids with different NMAS.
Further analysis of cumulative diameter distributions highlights distinct gradation effects. AC-13 exhibited sharper peaks in cumulative percentage curves, indicating a more concentrated diameter distribution. In contrast, AC-20 demonstrated broader peaks with lower intensity, reflecting greater heterogeneity in void sizes. This divergence arises from aggregate packing mechanisms: Larger NMAS reduces particle interlock efficiency during compaction, creating irregular void geometries across a wider size spectrum. These findings underscore the critical role of NMAS in tailoring void architecture, providing essential insights for optimizing asphalt mixture designs to balance hydraulic performance and structural durability.
3.2 The effects of compaction efforts on pore characteristics
3.2.1 Air void contents distribution
Compaction effort, alongside maximum nominal aggregate size, constitutes a key factor influencing the void microstructure of asphalt mixtures. During actual construction, limitations imposed by compaction equipment inevitably lead to non-uniform compaction, resulting in variations in the internal pore structure of the pavement. Normally, on-site observations indicate that the pavement surface usually has obvious open holes. To investigate the impact of compaction effort on void structure, this study conducted three discriminating gyratory compaction cycles to simulate the effects of varying degrees of under-compaction on the internal void structure of the asphalt mixture. The corresponding specimens are labeled as SGC-1 (100 cycles), SGC-2 (70 cycles), and SGC-3 (40 cycles). Based on the image analysis method, the calculated void contents for the three specimens were 4.64%, 7.38%, and 10.38%, respectively. These values slightly exceeded the measured void ratios obtained via the saturated surface-dry (SSD) method (4.23%, 6.56%, and 9.50%, respectively). The discrepancy between the results from the two methods was less than 1% in all cases, further validating the accuracy of the void ratio calculation method.
Figure 9 presents the variation curves of void contents along the height direction under different compaction efforts. The analysis indicates that compaction effort has a significant impact on the areal void ratio (void ratio at specific height layers), particularly in the end parts of the specimens. In these end regions, the void contents decreased sharply with increasing number of compaction cycles. The void contents distribution in the middle part was relatively uniform, but also gradually decreased with increasing compaction cycles. Consequently, increasing the number of compaction cycles primarily reduced the magnitude of the void contents but did not markedly alter the longitudinal distribution characteristics along the height of the specimens.
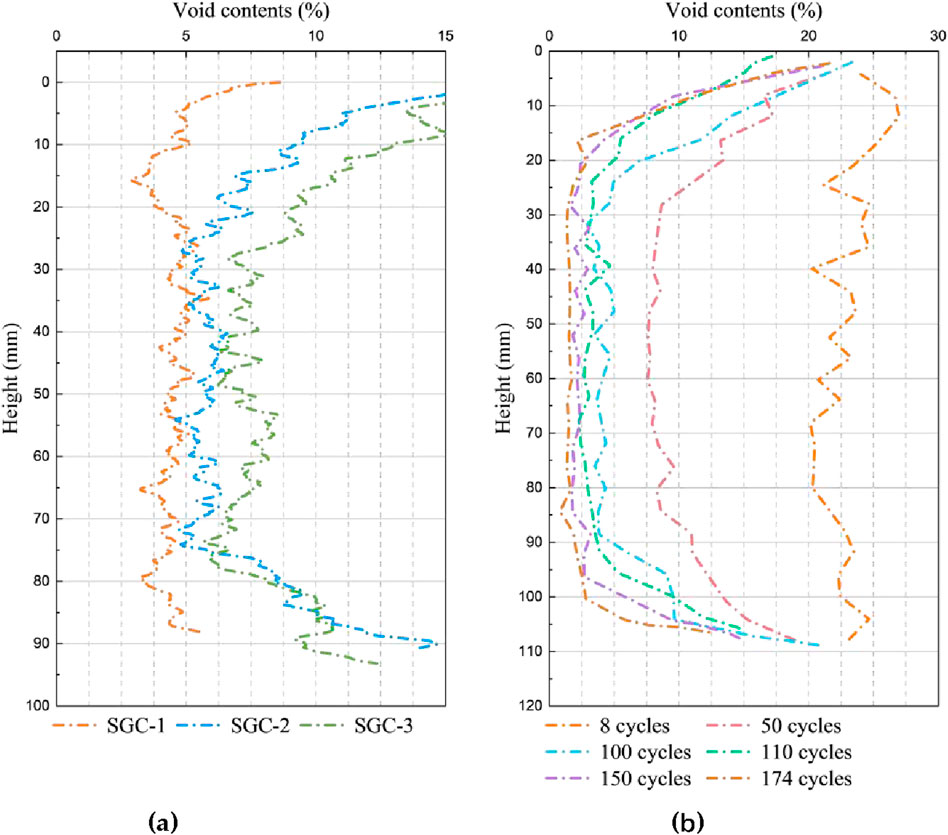
Figure 9. The distribution of air void contents in various compaction cycles: (a) the SGC specimens of AC-13; (b) the results in reference (Masad, 2004).
Figure 6b presents the findings of Masad’s (Masad, 2004) study on the relationship between gyratory compaction cycles and void distribution trends. Overall, the studies identify a critical threshold (8–40 cycles) beyond which void contents stabilize into a characteristic “bathtub” profile along the vertical direction, with uniform central regions. As compaction energy increases, the uniformity of void distribution expands, eventually reaching a saturation point (150 passes in the cited reference) where further compaction yields negligible changes. Although the absolute number of passes required to achieve equivalent void content differs between studies—attributed to variations in material properties, specimen geometry, gradation, and compaction parameters—the fundamental trend remains consistent. This underscores the dominant role of compaction energy in governing void structure evolution, irrespective of specific experimental conditions. The combined evidence highlights the necessity of optimizing compaction protocols to balance structural integrity and material efficiency in asphalt pavement construction.
3.2.2 Air void volume characteristics
Figures 10a,b present the pore volume distribution and corresponding pore density along the vertical direction at different volume scales. It should be noted that the analysis in this section is based solely on specimens SGC-1 and SGC-2. Analysis of Figure 10a reveals two consistent patterns: 1) a significant negative correlation exists between the number of pores and pore volume; 2) the pore density at both ends of the specimens is markedly higher than in their central regions. Specifically, the total number of pores in specimen SGC-1 is approximately 2000, compared to about 3,200 in SGC-2, indicating that SGC-2 exhibited 37% more total pores than SGC-1. Crucially, for large-volume pores (or medium-to-large pores), the number present in SGC-2 is nearly twice that in SGC-1. This result indicates that increasing the compaction effort effectively reduces the spacing between aggregate particles, thereby forming a denser microstructure.
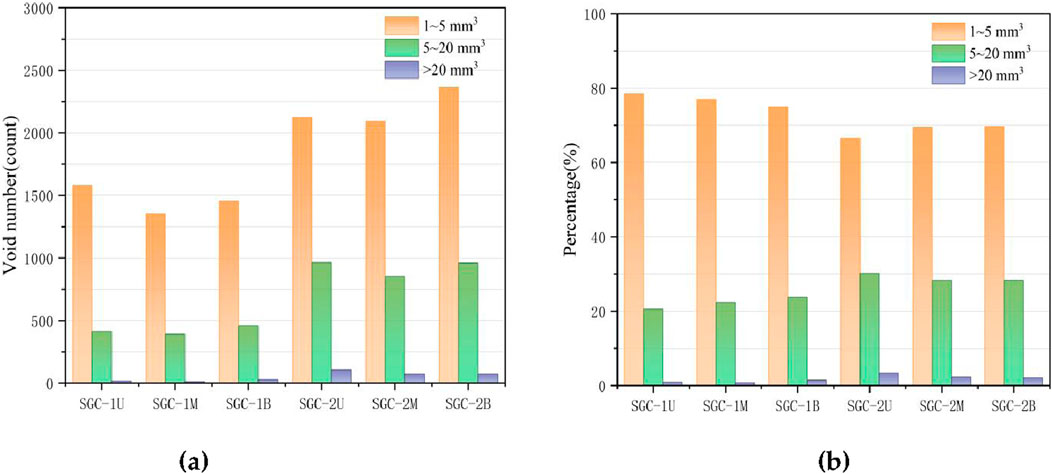
Figure 10. The void volume characteristics with different compaction efforts: (a) void particle counts; (b) percentage of void particles.
Void size distribution analysis (Figure 10b) demonstrates significant compaction effects; it can be drawn that the small voids increase from 60% to 70% in SGC-2 to 75%–80% in SGC-1, meanwhile, medium and larger voids decrease from 25 to 30% to 20–25%. Therefore, larger compaction effects could further compact the volume of medium and larger voids, and divide the originally connected air voids into small isolated voids. In addition, it was found that for the same specimen, although the total number of voids in the middle part was less than that at both ends, the proportion of voids of different volume scales in the upper, middle, and lower parts did not differ much and presented uniform distribution characteristics.
3.2.3 Equivalent diameter of void
Figure 11 presents the probability distribution curves of equivalent pore diameters for specimens SGC-1 and SGC-2. Note: Light-to-dark blue curves represent the upper, middle, and lower sections of SGC-1, respectively, while orange curves denote the corresponding sections of SGC-2.
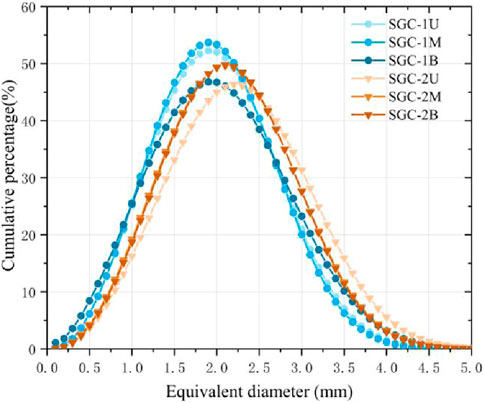
Figure 11. Fitting curve of the probability density distribution of void equivalent diameters.
Results indicate that the most probable pore diameter is consistently 1.9 mm across all sections of SGC-1, whereas for SGC-2, it measures 2.2 mm (upper), 2.1 mm (middle), and 2.1 mm (lower). Although pore quantities vary spatially within each specimen, the peak pore diameter remains highly consistent across sections. This confirms that increased compaction effort reduces the dominant pore size. Distribution analysis reveals that blue curves (SGC-1) exhibit sharper peaks with narrower distributions, whereas orange curves (SGC-2) show broader distributions shifted toward larger diameters, indicating relatively larger pores. Critically, under the applied compaction cycles, no significant shift in equivalent pore diameter is observed, demonstrating that beyond a threshold compaction effort, further energy input minimally alters pore-scale characteristics.
3.3 The relationship between pore characteristics and permeability
As a kind of porous medium material, the permeability characteristics of asphalt mixtures mainly depend on the morphological characteristics and distribution of their internal void structures. Figure 12 illustrates the relationship between permeability coefficient and air void contents for AC-20 (denoted in purple) and AC-13 (denoted in grey) asphalt mixture specimens. To distinguish completely impermeable specimens from the cores, their permeability coefficients were uniformly set to −0.02 mm/s (light green zone). This value serves as an identifier and holds no actual physical significance. Within this range of higher air void content, the permeability coefficient of the asphalt mixtures increases significantly (>0.03 mm/s), indicating susceptibility to rapid water infiltration under a hydraulic gradient. Notably, comparing with previous researches (Ren et al., 2023; Chen et al., 2023), the gradation-dependent permeability pattern was found, the air void content of 5% and 7% represent critical threshold for permeability behavior in AC-13 and AC-20 graduation asphalt mixtures, respectively. Once the void ratio excess this threshold, the permeability coefficient increases exponentially with void ratio. However, this value is not an absolute boundary. Experimental data (e.g., two core specimens of AC-20 with air voids ≈4% exhibited infiltration, and one specimen of AC-13 did so) demonstrate that infiltration exhibits a random nature within the low air void range (e.g., 3%–5%). Comparing these two gradation types, AC-20 specimens exhibited higher permeability coefficients and entered their rapid permeability zone (Purple Zone I) at lower air void content levels. In contrast, AC-13 specimens required higher air void content to reach their corresponding rapid permeability zone (Grey Zone II).
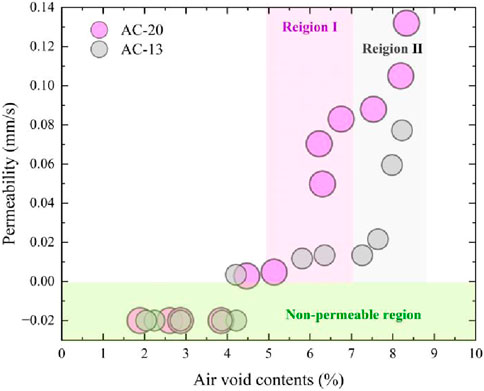
Figure 12. Relationship between void content and permeability coefficient in laboratory specimens.
Based on the correlation heatmaps between pore morphology parameters and permeability for AC-20 and AC-13 gradation specimens (Figures 13a,b), this study systematically elucidates the influence of meso-structure on permeability. For AC-20 specimens, the Pearson’s correlation coefficient between permeability coefficient and total void contents reaches 0.950, significantly higher than the value of 0.750 for AC-13. This indicates that the influence of air void contents on permeability intensifies with a larger maximum nominal aggregate size. This finding aligns with the conclusion in Section 3.1.3: the equivalent diameter of AC-20 is approximately 0.6–0.7 mm larger than that of AC-13 (Figure 8), facilitating the formation of connected pore networks. Further analysis of pore scale reveals that in AC-13, large pores (>20 mm) exhibit the strongest correlation with permeability (0.900), while small pores (1–5 mm) show a negative correlation (−0.660). In contrast, for AC-20, medium-sized pores (5–20 mm) demonstrate the most significant correlation with permeability (0.880). This difference can be attributed to gradation characteristics: as described in Section 3.1.2, AC-20 possesses nearly twice the number of medium and large pores compared to AC-13, and their spatial distribution is more conducive to forming continuous flow paths. Notably, although equivalent diameter exhibits a strong correlation with permeability for both gradations (AC-13: 0.870; AC-20: 0.820), compaction significantly weakens this relationship. Section 3.2.3 demonstrates that as the number of gyratory compaction cycles increases from 70 to 100, equivalent diameter decreases from 2.2 mm to 1.9 mm, accompanied by a sharp decline in permeability. In summary, permeability is not solely governed by total air void contents but is predominantly controlled by pore size distribution and connectivity. When air void contents exceeds 5%, the proportion of connected pores larger than 5 mm becomes the critical factor influencing permeability. The maximum nominal aggregate size and compaction energy ultimately determine permeability by altering the morphology and quantity of such pores.
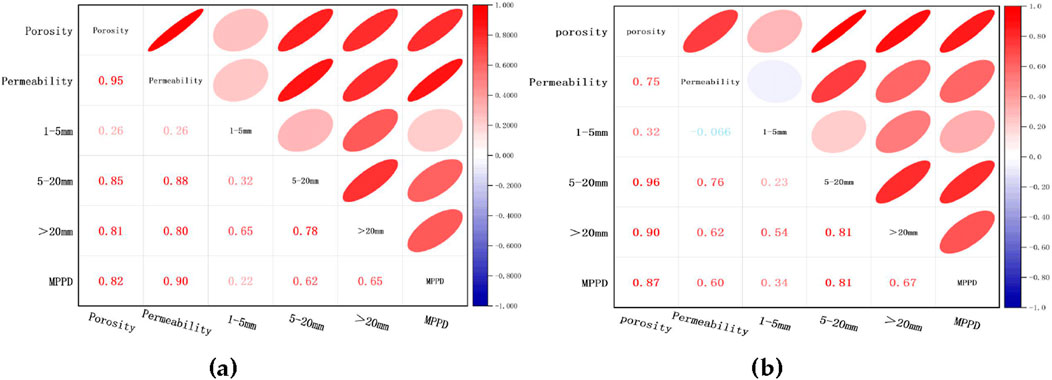
Figure 13. Correlation heatmap between permeability and pore-scale parameters (a) AC-20; (b) AC-13.
3.4 The visualization of the permeation test of TDGAC
Figures 14, 15 present the visual permeability test results of a transparent specimen. It can be seen that the polished crystal appears light yellow, and the infiltration areas appear different shades of blue under the transmission of the light source. The depth of the blue represents the degree of penetration. For the AC-13 transparent specimens with relatively larger air void contents (see Figures 14a,b), the specimens exhibit extensive dark blue zones and points, indicating higher solution penetration and lots of interconnected percolation paths exist in the inner structure. Besides, the positions with a high degree of penetration are mainly concentrated in the intervals between coarse aggregates (as shown in the red circle). It can be deduced that larger connected pores are more likely to form at the intervals of coarse aggregates. For the specimens with air voids between 5.0 and 6.0% (see Figures 14c,d), the areas where penetration occurs have become more limited, and the permeable areas mainly occur in the position between small aggregates. With the increase in compaction efforts, the specimens hardly exhibit water penetration behavior. These results have proved that the increase in compaction efforts mainly compresses the large volumes of pores between coarse aggregates into small volumes of isolated voids until the structure becomes sufficiently densification.
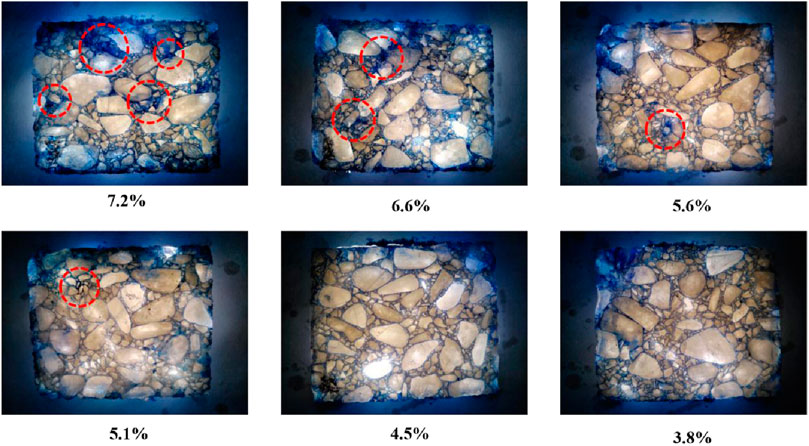
Figure 14. Light permeation in Transparent AC-13 specimens with different void contents.
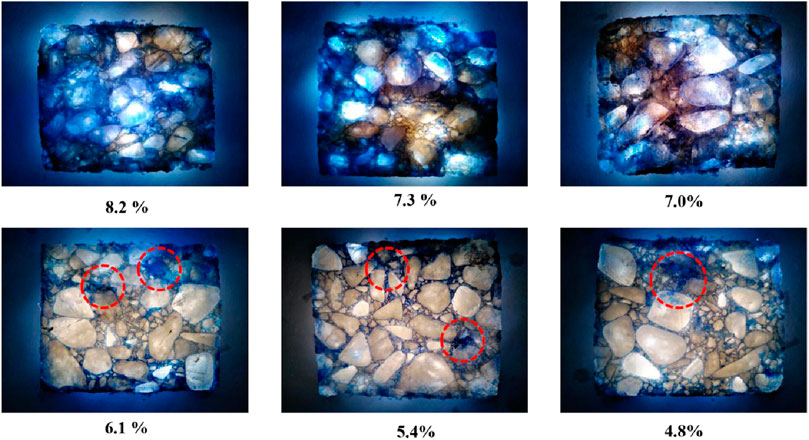
Figure 15. Light permeation in transparent AC-20 specimens with different void contents.
Figure 15 presents the results of the transparent AC-20 specimens. For the air void contents larger than 7%, Large blue areas visible under light transmission indicate the presence of extensive permeable zones within this range of void ratios, demonstrating excellent water permeability. For the air void contents between 5 and 7%, the number of permeable areas has decreased and mainly exists between the coarse aggregates. At void contents of 4.8% or lower, specimens exhibit predominantly yellow coloration with only occasional penetration points, signifying significantly reduced permeable areas. Comparative analysis with AC-13 specimens further reveals that at similar void ratios, AC-20 consistently demonstrates greater permeation depth and wider affected areas, attributable to its larger maximum nominal particle size, facilitating the formation of more substantial void structures that enable deeper and broader penetration.
4 Conclusion
This study elucidated the water permeation mechanism in densely-graded asphalt concrete through a meso-structural characterization system. By combining X-ray computed tomography (CT) scanning, permeability testing, and an innovative transparent specimen technique, the effects of NMAS and compaction effort on pore structure were quantitatively analyzed. Furthermore, the relationship between the permeability coefficient and internal pore structure was established, and the influences of compaction cycles and nominal aggregate size on this coefficient were elucidated.
1. This study observed that increased compaction cycles significantly reduced medium-large interconnected pores (>5 mm3), specifically decreasing total air void content from 10.38% at 40 cycles to 4.64% at 100 cycles. However, the longitudinal “bathtub-shaped” distribution pattern remained consistent. This aligns with conclusions from prior research proposing that “void distribution stabilizes after 40 compaction cycles.” Distinct from prior studies, this work reveals the differential impact of compaction cycles on pore-scale restructuring rather than merely total void volume.
2. Larger nominal maximum aggregate size (AC-20 versus AC-13) generated nearly double the quantity of medium/large interconnected voids and increased the equivalent diameter by 0.6–0.7 mm. AC-20 mixtures exhibited higher void distribution heterogeneity with 2%–6% greater terminal-zone void content, which directly facilitated enhanced permeability pathways through improved pore connectivity.
3. An void ratio of 5% and 7% represent critical threshold for permeability behavior in AC-13 and AC-20 graduation asphalt mixtures, respectively. Beyond this threshold, the permeability coefficient increased exponentially with void ratio. While prior research primarily emphasized that “over 80% of interconnected pores contribute to permeability,” it overlooked quantifying critical pore scales. Building upon existing studies, this work demonstrates through correlation heatmaps that pore-scale dominance is dictated by gradation type: in AC-13, voids >20 mm3 govern permeability (R = 0.900), whereas in AC-20, voids of 5–20 mm3 dominate (R = 0.880). Ultimately, permeability behavior was determined by the spatial configuration of connected voids exceeding 5 mm in size.
4. Increased compaction effort significantly reduced permeability coefficients by diminishing pore connectivity and equivalent diameter. NMAS regulated permeability thresholds, enabling AC-20 to enter rapid-permeability zones (smaller than 7% void content) at lower void contents than AC-13. TDGAC visualization conclusively verified inter-aggregate voids among coarse particles as primary permeation pathways.
Data availability statement
The datasets presented in this article are not readily available because The datasets generated and/or analyzed during the current study are available from the corresponding author on reasonable request. Requests to access the datasets should be directed to Bowei Sun, YndzdW5AY2F1Yy5lZHUuY24=.
Author contributions
RS: Investigation, Writing – original draft, Writing – review and editing. WL: Conceptualization, Data curation, Investigation, Methodology, Software, Visualization, Writing – original draft, Writing – review and editing. HW: Formal Analysis, Investigation, Supervision, Validation, Writing – review and editing. XH: Conceptualization, Investigation, Methodology, Writing – review and editing. HZ: Formal Analysis, Investigation, Methodology, Writing – review and editing. ZL: Investigation, Methodology, Resources, Writing – review and editing. BS: Conceptualization, Data curation, Formal Analysis, Funding acquisition, Project administration, Resources, Supervision, Validation, Visualization, Writing – original draft, Writing – review and editing. JL: Data curation, Funding acquisition, Project administration, Resources, Visualization, Writing – review and editing.
Funding
The author(s) declare that financial support was received for the research and/or publication of this article. This research is supported by the Tianjin Education Commission Research Program Project (No.2024KJ104), Undergraduate Training Program for Innovation and Entrepreneurship (No.202410059114), and Scientific Research Project of Shaanxi Polytechnic Institute (No.2024YKYB-022).
Acknowledgments
The author would like to express their sincere appreciation to the aforementioned organization.
Conflict of interest
The authors declare that the research was conducted in the absence of any commercial or financial relationships that could be construed as a potential conflict of interest.
Generative AI statement
The author(s) declare that no Generative AI was used in the creation of this manuscript.
Any alternative text (alt text) provided alongside figures in this article has been generated by Frontiers with the support of artificial intelligence and reasonable efforts have been made to ensure accuracy, including review by the authors wherever possible. If you identify any issues, please contact us.
Publisher’s note
All claims expressed in this article are solely those of the authors and do not necessarily represent those of their affiliated organizations, or those of the publisher, the editors and the reviewers. Any product that may be evaluated in this article, or claim that may be made by its manufacturer, is not guaranteed or endorsed by the publisher.
References
Che, T. K., Pan, B. F., Sha, D., Zhang, Y. T., and You, Z. P. (2021). Relationship between air voids and permeability: effect on water scouring resistance in HMA. J. Mater. Civ. Eng. 33 (4), 04021022. doi:10.1061/(asce)mt.1943-5533.0003642
Chen, X., Ren, D. Y., Xu, J., Tian, G. S., Jiang, S. Q., Huang, M. X., et al. (2023). Investigation on mesoscopic pore characteristics in asphalt mixtures under the coupling effects of segregation-dynamic pore water-salt corrosion based on CT scanning technology. Constr. Build. Mater. 404, 133041. doi:10.1016/j.conbuildmat.2023.133041
Cox, B. C., Smith, B. T., Howard, I. L., and James, R. S. (2017). State of knowledge for cantabro testing of dense graded asphalt, J. Mater. Civ. Eng. 29, 04017174, doi:10.1061/(asce)mt.1943-5533.0002020(10)
Ding, X. H., Zhou, W., Lu, X., and Gao, Y. (2018). Physical simulation test of soil-rock mixture from synthetic transparent soil. J. Central South Univ. 25 (12), 3085–3097. doi:10.1007/s11771-018-3976-4
Gong, X. B. (2017). Mechanical behavior and unified model of asphalt pavement materials in multi-scale domains. Harbin: Harbin Institute of Technology.
Guo, Q. L., Liu, Q., Zhang, P., Gao, Y., Jiao, Y. B., Yang, H. C., et al. (2020). Temperature and pressure dependent behaviors of moisture diffusion in dense asphalt mixture. Constr. Build. Mater. 246, 118500. doi:10.1016/j.conbuildmat.2020.118500
Kong, G. Q., Li, H., Hu, Y. X., Yu, Y. X., and Xu, W. B. (2017). New suitable pore fluid to manufacture transparent soil. Geotechnical Test. J. 40 (4), 658–672. doi:10.1520/gtj20160163
Li, Y. Z., Zhou, H., Liu, H. L., Ding, X. M., and Zhang, W. G. (2021). Geotechnical properties of 3D-printed transparent granular soil. Acta Geotech. 16 (6), 1789–1800. doi:10.1007/s11440-020-01111-7
Li, N. B., Hao, P. W., Fan, Y. H., Duan, D. J., and Zhang, B. (2024). The research on the meso-structure distribution mechanization and pavement performances of superpave mixtures at different SGC gyrations. Constr. Build. Mater. 438, 137178. doi:10.1016/j.conbuildmat.2024.137178
Masad, E. (2004). X-ray computed tomography of aggregates and asphalt mixes. Mater. Eval. 62 (7), 775–783.
Maurya, A. K., and Singh, D. (2024). Novel approach to characterize moisture damage in asphalt mixtures based on critical permeability. J. Mater. Civ. Eng. 36 (5), 04024093. doi:10.1061/jmcee7.mteng-16824
Neupane, P., and Wu, S. H. (2025). A comprehensive review of moisture damage in asphalt mixtures: mechanisms, evaluation methods, and mitigation strategies. Constr. Build. Mater. 471, 140740. doi:10.1016/j.conbuildmat.2025.140740
Pang, Y., and Hao, P. W. (2017). A review of water transport in dense-graded asphalt mixtures. Constr. Build. Mater. 156, 1005–1018. doi:10.1016/j.conbuildmat.2017.08.092
Ren, D. Y., Xu, J., Su, S. A., Tian, G. S., Chen, X., Zhang, A. L., et al. (2023). Characterization of internal pore size distribution and interconnectivity for asphalt concrete with various porosity using 3D CT scanning images. Constr. Build. Mater. 400, 132751. doi:10.1016/j.conbuildmat.2023.132751
Sun, B. W., Xu, T. L., Zhang, H. W., Li, Y., Huang, X., Qi, L., et al. (2023). Analysis of alkali leaching mechanism on as-built cement concrete bridge deck pavement: view from the perspective of mesostructure characteristics. Constr. Build. Mater. 409, 134054. doi:10.1016/j.conbuildmat.2023.134054
Wang, W. T., Wang, L. B., Xiong, H. C., and Luo, R. (2019). A review and perspective for research on moisture damage in asphalt pavement induced by dynamic pore water pressure. Constr. Build. Mater. 204, 631–642. doi:10.1016/j.conbuildmat.2019.01.167
Wen, H. F., Kutay, M. E., and Shen, S. S. (2011). Evaluation of the effects of asphalt binder on the properties of hot mix asphalt at intermediate temperatures. J. Test. Eval. 39 (3), 321–326. doi:10.1520/jte102878
Xu, H. N., and Bian, X. X. (2024). Saturation evolution induced by suction effect in asphalt mixtures during air-water two-phase seepage. Constr. Build. Mater. 456, 139302. doi:10.1016/j.conbuildmat.2024.139302
Xu, H. N., Chen, F. C., Yao, X. G., and Tan, Y. Q. (2018). Micro-scale moisture distribution and hydrologically active pores in partially saturated asphalt mixtures by X-ray computed tomography. Constr. Build. Mater. 160, 653–667. doi:10.1016/j.conbuildmat.2017.11.107
Xu, H. N., Yao, X. G., Wang, D. W., and Tan, Y. Q. (2019). Investigation of anisotropic flow in asphalt mixtures using the X-ray image technique: pore structure effect. Road Mater. Pavement Des. 20 (3), 491–508. doi:10.1080/14680629.2017.1397047
Yang, R. C., Zhan, C., Yang, J., Wu, S. Y., and Bai, J. N. (2017). Microscopic pore structure of asphalt mixture incorporating with MFL. J. Wuhan Univ. Technology-Materials Sci. Ed. 32 (5), 1232–1238. doi:10.1007/s11595-017-1736-1
Zhang, K., Lu, H. F., Zhu, R. Z., Weng, L., Zhou, X. L., Kong, X. X., et al. (2024). Study on pore structure evolution and water damage of asphalt mixture under cyclic loading. Constr. Build. Mater. 440, 137461. doi:10.1016/j.conbuildmat.2024.137461
Keywords: dense-graded asphalt concrete, meso-structure, permeability, compacting factors, correlation analysis
Citation: Sheng R, Liu W, Wei H, Huang X, Zhang H, Lin Z, Sun B and Liu J (2025) Study on permeability characteristics of dense-graded asphalt concrete based on the meso-structure. Front. Built Environ. 11:1672243. doi: 10.3389/fbuil.2025.1672243
Received: 24 July 2025; Accepted: 08 September 2025;
Published: 01 October 2025.
Edited by:
Dongdong Yuan, Chang’an University, ChinaReviewed by:
Wentong Wang, Shandong University of Science and Technology, ChinaYongdan Wang, Northwest A & F University Hospital, China
Haiwei Zhang, Zhengzhou University of Aeronautics, China
Copyright © 2025 Sheng, Liu, Wei, Huang, Zhang, Lin, Sun and Liu. This is an open-access article distributed under the terms of the Creative Commons Attribution License (CC BY). The use, distribution or reproduction in other forums is permitted, provided the original author(s) and the copyright owner(s) are credited and that the original publication in this journal is cited, in accordance with accepted academic practice. No use, distribution or reproduction is permitted which does not comply with these terms.
*Correspondence: Bowei Sun, YndzdW5AY2F1Yy5lZHUuY24=