 Zhen Liu1
 Rongxuan Zhao
- 1China Fire and Rescue Institute, Beijing, China
- 2Aisika (Shanghai) Security Technology Co., Ltd, Shanghai, China
Introduction: As urbanization accelerates, highway tunnels are proliferating across China. Owing to their semi-enclosed geometry, the primary objectives in a tunnel fire are immediate smoke extraction and toxic-gas dilution to rescue trapped occupants. Yet current research struggles to capture long-range smoke spread in full-scale tunnels and often overlooks how the relative position between fans and the fire source affects flow patterns.
Methods: Therefore, this study investigates highway-tunnel fire smoke and occupant evacuation using full-scale experiments, theoretical analysis and FDS simulations.
Results: Under low-intensity fire conditions, the critical longitudinal wind speed ranges between 1 and 3 m/s. Ventilation velocity shows a positive correlation with smoke-layer thickness near the fire source, while back-layering length is negatively correlated with fan speed. Fan location significantly influences temperature, visibility and CO volume fraction. The closer the fan is to the fire, the lower the temperature, the higher the visibility and the smaller the CO volume fraction, all of which favor evacuation. At constant walking speed, shortening the fan-to-fire distance reduces both the required and available safe egress times, thereby accelerating evacuation.
Discussion: By linking back-layering length, temperature, visibility and CO volume fraction to evacuation time, this work provides both theoretical foundations and real-time data for tunnel emergency response, enabling rapid intervention and safeguarding lives and property.
1 Introduction
As vital components of modern transportation infrastructure, highway tunnels enhance connectivity across challenging terrains and alleviate urban traffic congestion. Global urbanization has consequently driven unprecedented growth in their construction (Canitez et al., 2020; Liang et al., 2021; Peters et al., 2025). By the end of 2021, China had constructed 23,268 road tunnels with a total length of 24,698.9 km, representing an annual increase of 1,952 tunnels and 2,699.6 km. Among these, 1,599 are extra-long tunnels spanning 7,170.8 km, and 6,211 are long tunnels extending 10,844.3 km. Similar trends are observed globally, with countries investing heavily in tunnel infrastructure to support economic development and transportation efficiency (Baek et al., 2017; Gavresi et al., 2025; Rocha et al., 2023). While tunnels significantly improve transportation efficiency and reduce travel distances (An et al., 2022; Leong et al., 2025; Uchida et al., 1992), their semi-enclosed nature creates unique fire safety challenges that differ substantially from open-road environments (Zhang D et al., 2025). In the event of a fire, high-temperature toxic smoke can spread rapidly through the confined space (Caliendo et al., 2022), creating conditions that often lead to severe casualties and substantial property damage (Hsu et al., 2017). With the rapid proliferation of electric vehicles in urban environments, fire risks persist in both open and semi-enclosed conditions (Hodges et al., 2024; Kang et al., 2023; Sturm et al., 2023; Zhang L et al., 2025). Historical incidents highlight the devastating consequences of tunnel fires: the 2014 rear-end collision and fire in a Shanxi tunnel resulted in dozens of fatalities and injuries; the Mont Blanc Tunnel fire in 1999 claimed 39 lives; the Tauern Tunnel fire in 1999 caused 12 fatalities; and the Daegu subway fire in 2003 resulted in 192 deaths. These tragedies underscore the critical importance of effective tunnel fire safety management (Peng et al., 2021).
The engineering challenges in tunnel fire safety are particularly complex due to several factors: limited evacuation routes, difficult access for emergency responders, rapid smoke propagation, and the potential for rapid temperature escalation that can compromise structural integrity. Preventing and controlling tunnel fires has therefore become a paramount concern in highway engineering and safety management worldwide (Guo et al., 2020; Se et al., 2012; Zhang et al., 2019). The confined nature of tunnel environments makes smoke extraction particularly challenging, often rendering traditional ventilation methods inadequate. Tunnel fires can rapidly produce extreme conditions, including temperatures exceeding 1000 °C, lethal concentrations of toxic gases, and near-zero visibility (Guo et al., 2021; Ji et al., 2012). These conditions leave occupants with severely limited time for evacuation—typically just minutes—before conditions become unsurvivable (Jiang et al., 2020; Kinateder et al., 2014). Current engineering practice relies heavily on fixed ventilation systems, but these systems have demonstrated limitations in actual fire emergencies. Studies indicate that inadequate smoke control and delayed evacuation are primary factors contributing to high casualty rates during tunnel fires (Nguyen et al., 2013). In response to these challenges, researchers worldwide have focused on developing improved ventilation strategies (Fridolf et al., 2013; Zhang et al., 2022), better understanding heat release rates of various fire scenarios (Kayili et al., 2011; Yan et al., 2017), determining critical ventilation velocities, and characterizing smoke stratification patterns (Wang et al., 2023). For instance, Jia et al. utilized full-scale vehicle thermal runaway experiments to assess propagation pathways and fire risks, subsequently proposing predictive and control methods for thermal runaway in electric vehicle battery systems (Jia et al., 2025). Zhang et al. investigated the fire behavior induced by thermal runaway of electric vehicles in both open spaces and enclosed tunnels (Zhang Y et al., 2025). Tang et al. developed a predictive model for critical wind speed under combined longitudinal and ceiling-exhaust ventilation (Tang et al., 2018). Król used FDS to simulate full-scale tunnel fires and identified fire size, heat release rate, and traffic congestion as key factors influencing the number of people at risk (Król and Król, 2020). Seike et al. proposed a quantitative fire safety assessment method based on CFD evacuation simulations, analyzing the longitudinal spread of hot smoke and its effects on temperature, visibility, and CO concentration (Seike et al., 2017). Caliendo et al. used CFD to evaluate temperature changes, radiative heat flux decay, visibility, and CO levels along escape routes, providing recommendations for emergency exit placement in bidirectional highway tunnels (Caliendo et al., 2018).
Despite these advances, significant gaps remain between research findings and practical engineering applications. Existing research has predominantly focused on fixed jet fan or ceiling exhaust systems, which represent only part of the ventilation solutions available to tunnel operators. There remains a critical lack of systematic investigation into how mobile ventilation equipment—increasingly deployed in actual tunnel emergency responses—affects smoke control and evacuation efficiency. This gap is particularly important because mobile fans offer flexibility that fixed systems cannot provide, allowing responders to adapt ventilation strategies to specific fire scenarios. Major research deficiencies include: (1) most experimental studies use small-scale or short-length models that cannot accurately capture long-range smoke spread in real tunnel environments; (2) numerical simulations often overlook the nonlinear coupling effects caused by varying distances between mobile fans and the fire source, leading to inaccuracies in predicting critical wind speed and back-layering length; (3) few studies provide practical guidance on optimal placement of mobile ventilation equipment during emergency responses.
To address these practical engineering challenges, this study takes the relative distance between mobile fans and the fire source as a key variable and adopts a combined approach of experimental validation, numerical simulation, and safety criterion development. A full-scale underground tunnel fire test platform (96.2 m long × 2.1 m wide × 2.6 m high) was constructed to simultaneously measure wind speed, smoke layer thickness, and back-layering length, thereby bridging the gap between small-scale experiments and real tunnel applications. The platform was designed to replicate key characteristics of actual highway tunnels while enabling precise measurement of parameters critical for smoke management. A 1:1 refined FDS model was developed and validated against experimental data concerning fire power, critical wind speed, and smoke production, enabling accurate reproduction of the spatiotemporal evolution of temperature, visibility, and CO concentration under varying fan positions. This validation against our own full-scale experimental data provides a strong basis for the model’s accuracy within the context of this study’s parameters. The general applicability of FDS for simulating tunnel fire dynamics is well-supported by previous work (Canitez et al., 2020). Finally, evacuation-oriented safety measures were proposed based on the integrated findings.
The practical engineering value of this research lies in its direct applicability to tunnel safety management and emergency response planning. The main contributions include: (1) quantitatively examining the combined control effect on temperature, visibility, and CO concentration by adjusting the previously underexplored yet critically actionable variable of mobile fan-to-fire distance; (2) developing practical, distance-based guidelines for mobile fan deployment that can be directly implemented by tunnel operators and emergency responders; (3) providing a validated numerical model that can be used to simulate various fire scenarios and ventilation strategies; (4) establishing clear quantitative relationships between ventilation parameters and evacuation safety metrics. Through an integrated experimental-numerical-evacuation approach, this research provides actionable insights and a decision-support framework for the deployment of mobile fans, thereby filling a critical technical gap in rapid smoke extraction and efficient evacuation decision-making for which generalized principles previously lacked specific, operational detail. The outcomes enhance the theoretical understanding of tunnel fire dynamics while offering significant practical value for improving emergency response protocols in highway tunnels, ultimately contributing to enhanced safety for tunnel users and protection of critical transportation infrastructure.
2 Methodology
2.1 Experimental set-up
2.1.1 Experimental site
The full-scale fire experiments were conducted in an underground longitudinal tunnel facility. As illustrated in Figures 1a,b, the test section is a rectangular underground corridor oriented along a north–south axis, with internal dimensions of 96.2 m (length) × 2.1 m (width) × 2.6 m (height). The roof consists of several detachable cast-iron panels that allow flexible access for instrumentation and smoke management. During each test, only the northernmost and southernmost panels were opened to create a controlled ventilation path. The southern opening (1.40 m × 0.99 m) served as the fresh-air inlet, while the northern opening (1.18 m × 0.98 m) functioned as the exhaust outlet.
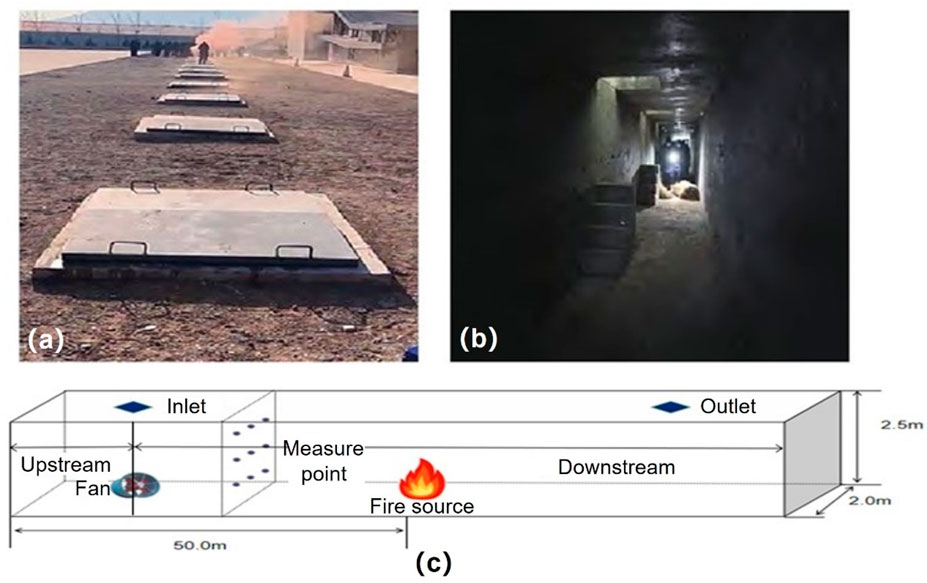
Figure 1. Experimental site. (a) External environment; (b) Internal environment; (c) Layout of experimental site.
A mobile jet fan was positioned vertically beneath the air-inlet plane to generate a steady longitudinal airflow. The fan outlet was angled 20° upward to ensure uniform velocity distribution across the tunnel cross-section. Nine calibrated hot-wire anemometers were mounted on the frame to record time resolved velocities at the centroid of nine equal sub-areas (3 × 3 grid) spanning the entire cross section. The arithmetic mean of these nine readings was taken as the representative bulk velocity for each test scenario. Figure 1c depicts the complete fan and sensor arrangement inside the tunnel.
2.1.2 Fire source and measurement parameters
A rectangular steel tray (0.60 m × 0.50 m × 0.05 m) filled with 15 L of commercially available 92-octane gasoline was used as the steady-state fire source. The fuel layer thickness was maintained at 0.05 m to ensure a repeatable heat-release rate (HRR) of 0.4 MW. A 0.25-m-radius mobile jet fan with an outlet area of 0.19 m2 was positioned 30 m downstream of the fire source and inclined 20° upward to generate a longitudinal airflow that fully spanned the tunnel cross section.
To enhance flow visualization and facilitate accurate measurement of the smoke layer height and thickness, two complementary techniques were employed simultaneously: (1) ignition of the gasoline pool to produce buoyant fire plumes, and (2) continuous seeding of the ambient air with neutrally buoyant smoke generated by commercial smoke cartridges placed 1.0 m upwind of the burner. This dual-source approach ensured adequate optical contrast without altering the thermo-fluid characteristics of the fire plume. All critical parameters—including fuel mass, fan speed, and ambient temperature—are summarized in Table 1.

Table 1. The critical wind speed corresponding to the fire release power.
2.2 Simulation set-up
2.2.1 Geometric model and mesh settings
In this work, a full-scale FDS (Fire Dynamics Simulator) model was constructed to replicate the longitudinal fire scenarios investigated experimentally. The model dimensions directly correspond to the experimental tunnel facility, maintaining a 1:1 scale ratio for accurate representation of the fire dynamics. As shown in Figure 2, the model extends 100 m in the longitudinal (Z) direction, 14 m in the transverse (X) direction, and 7 m in height (Y), yielding a cross-section of 98 m2 that satisfies the Chinese highway-tunnel design code.
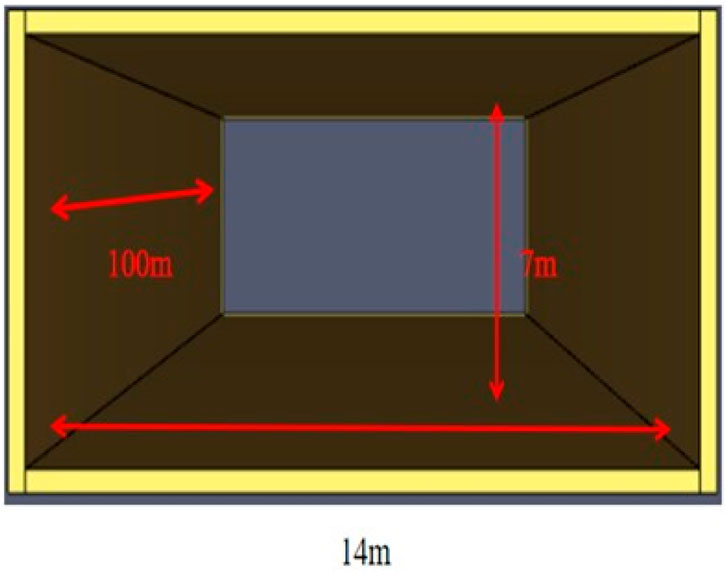
Figure 2. Geometry of simulation model.
The fire is assumed to originate from a self-ignited passenger vehicle measuring 4.0 m (length) × 2.0 m (width) × 1.4 m (height) with a nominal heat-release rate of 4.0 MW. For modelling convenience, the fire source is centered longitudinally at the midpoint of the tunnel. Buoyancy induced by the hot plume is the primary driving force for smoke dispersion, while all other boundary conditions remain consistent with the real tunnel environment.
According to Equation 1, the computational mesh resolution is determined on the basis of the characteristic flame diameter D*, calculated according to Equation 1 specified in the Chinese highway tunnel design code:
where,
These values yield a characteristic flame diameter D* = 1.72 m. The mesh resolution was established following the FDS User’s Guide recommendations, which specify that an appropriate cell size should range between 6.25% and 25% of D*, with 8%–12.5% considered optimal for capturing fire-driven flow phenomena. Our selected mesh size of 0.20 m × 0.20 m × 0.20 m corresponds to 11.6% of D*, placing it well within the recommended range for accurate simulation of fire dynamics. This mesh resolution approach is consistent with established practices in tunnel fire research and ensures that key physical phenomena, including plume dynamics, ceiling jet development, and longitudinal smoke spread, are adequately resolved. It should be noted that a formal mesh convergence study was not conducted; instead, confidence in the mesh resolution is based on its adherence to the FDS guideline and, more critically, the successful validation of the model against full-scale experimental data as presented in the following sections. The computational domain spans 14 m (X) × 7 m (Y) × 100 m (Z), resulting in a total of 70 × 35 × 500 = 1,225,000 grid cells. distribution patterns.
2.2.2 Simulation parameter settings
In this work, we assumed the combustible material to be a passenger vehicle, the fire growth within the road-tunnel section is modelled by the t2 fire growth model. According to FDS fire simulation guidelines, the heat-release rate is computed with Equation 2, and the representative t2 growth coefficients together with their characteristic times are listed in Table 2.
where,
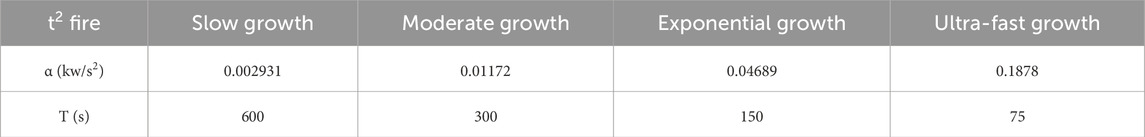
Table 2. The typical t2 growth coefficient and the time elapsed.
Based on the model parameters and the recommended values in the highway tunnel design code (Table 3), the design fire for the simulation is established at 4 MW, corresponding to a fast-growth t2 fire (α = 0.04689 kW/s2) with a representative fire source area of 8 m2.

Table 3. Recommended value for heat release rate of vehicle fires.
In accordance with the experimental environment, the ambient temperature in the model is set to 15 C, while wind direction, relative humidity and atmospheric pressure are left at their FDS, default values. Solving Equations 3–5 gives a critical ventilation velocity of 1.43 m/s, which is therefore prescribed as the model’s critical longitudinal velocity.
where,
Commercial 92-octane gasoline (92% isooctane, 8% n-heptane by volume) is represented by the single surrogate fuel C8H18. Following Fire-scene Smoke Control Technology, the mass flow rate of the fire plume (
where,
Furthermore, the volumetric flow rate of the smoke can be further calculated using Equation 7:
where,
2.3 Case studies
In order to investigate smoke spread and pedestrian evacuation efficiency in highway-tunnel fires, this study first conducted experiments to reveal the fire-spread behavior and to provide benchmark data for the numerical model. As listed in Table 4, two experimental scenarios were designed: one without longitudinal ventilation and one with mechanical longitudinal ventilation, during which parameters such as back-layering length, smoke-layer height and longitudinal velocity were recorded. Table 5 summarizes the numerical case matrix, where the fan position relative to the tunnel inlet is the independent variable—namely, no fan, and distances of 0 m, 20 m and 30 m. By evaluating temperature, CO volume fraction, visibility and required safe egress distance under each scenario, the study ultimately determines the safe evacuation conditions for occupants.
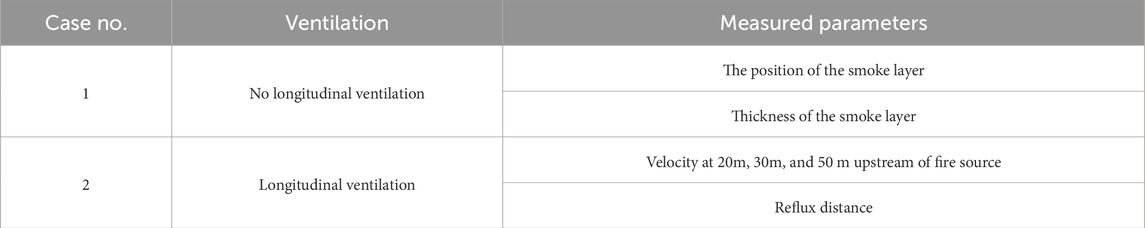
Table 4. Overview of experimental cases.
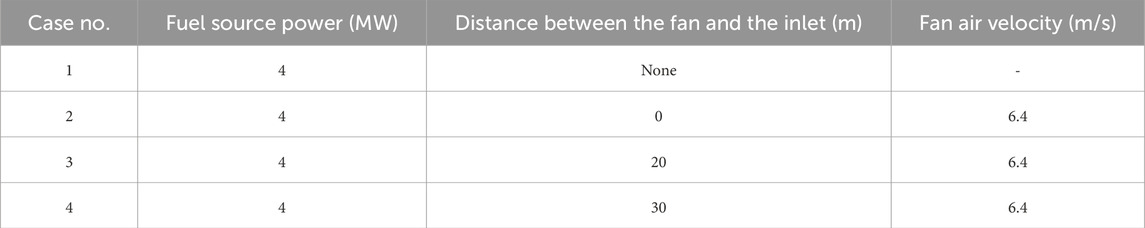
Table 5. Overview of simulation cases.
2.4 Evaluation criteria
Due to the special structure and confined geometry of highway tunnels, incomplete combustion is prone to occur, and high-temperature toxic smoke is difficult to exhaust. Prolonged exposure to such an environment can cause discomfort at best and endanger life at worst. The evacuation conditions vary under different fire environments. The key factors affecting evacuation efficiency are generally considered to be, on the one hand, pedestrian walking speed and evacuation time, and on the other hand, the relationship between available safe egress time (ASET) and the evacuation conditions and distance. The walking speeds are 1.2 m/s for adult males, 1.0 m/s for adult females, 0.8 m/s for children, and 0.6 m/s for the elderly. Taking the most unfavorable value, this study adopts 0.6 m/s as the design walking speed in fire scenarios. The critical tenability limits are set to 60 C for temperature, 10 m for visibility, and 1.5 × 10⁻³ mol/mol (1500 ppm) for CO volume fraction.
3 Results
3.1 Analysis of fire spread patterns
This section explored the fire spread pattern of various scenarios. As shown in Figure 3a, when there is no longitudinal wind on the highway, immediately after ignition, a buoyant plume rises vertically and impinges on the ceiling at approximately 1.5 m above the fuel surface, forming a stable stratified layer. No longitudinal gradient is observed; the smoke layer remains horizontal with a thickness of ∼1.1 m across the entire test section. The absence of forced airflow enables the hot-gas layer to descend gradually due to entrainment of ambient air, resulting in a slow but continuous reduction in clear height (around 0.05 m/min).
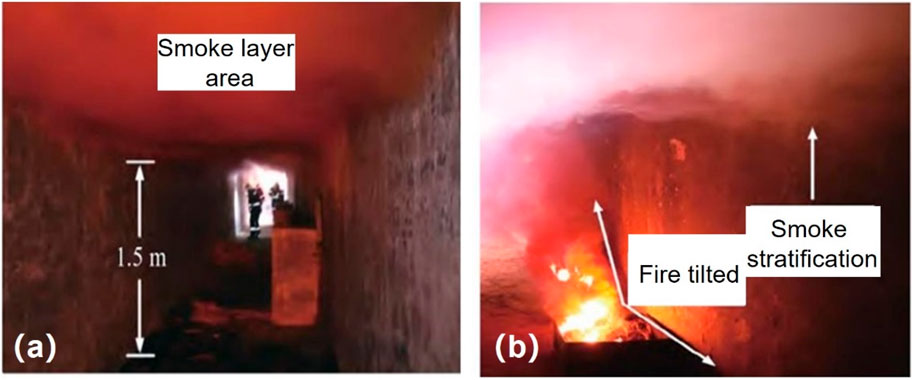
Figure 3. Visualized smoke spread situation. (a) Smoke layer under stable combustion conditions; (b) fire source and smoke stratification under the condition of air supply.
Our experimental results demonstrate significant improvements in smoke control through optimized fan positioning. When the mobile fan was positioned 20 m from the fire source, the back-layering length reduced from 47.4 m (no ventilation) to 11.6 m, representing a 75.5% reduction. Further advancement to 30 m from the fire source achieved an 85.2% reduction, with back-layering length decreasing to 7.0 m. This substantial improvement can be attributed to the enhanced momentum transfer from the jet fan to the fire plume when positioned closer to the combustion source, creating an effective competing interaction between the longitudinal ventilation thrust and the natural buoyancy of the smoke. When the fan is energized, a steady longitudinal velocity of 1.63 m/s (Table 6) is established. The velocity measurements reveal remarkable consistency in airflow distribution across the tunnel cross-section. The average velocity maintained 1.63 m/s throughout the test section, with minimal variation between measurement points (1.6–1.8 m/s). This uniformity confirms that the mobile fan configuration successfully established a stable longitudinal flow field without significant momentum decay, ensuring effective smoke control throughout the tunnel environment. Under this condition, the plume is visibly tilted toward the downstream direction (Figure 3b), and the smoke layer is rapidly disrupted. The smoke front propagates upstream against the fan airflow. The measured back-layering distance is 47.4 m (Table 7), consistent with theoretical predictions for a 0.4 MW fire.

Table 6. Setup of the fan considering different inlet velocity.
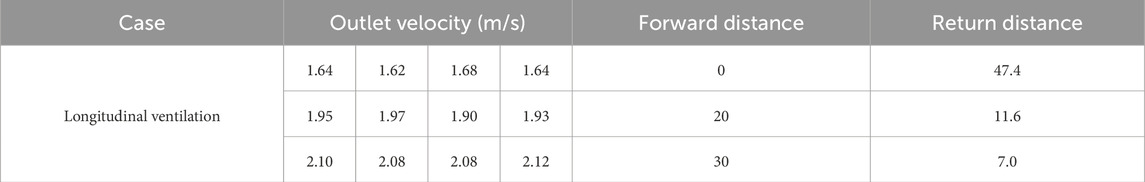
Table 7. Outlet velocity of smoke exhaust fan with forward distance and return distance.
The sectional average drops from 1.8 m/s at the fan exit to 1.6 m/s at 20 m and 1.8 m/s at 30 m (Table 6). This quasi-uniform velocity field confirms that the mobile fan successfully covers the entire cross-section without significant momentum loss over the test length. The fan thrust is therefore sufficient to shorten the back-layering length from 47.4 m (no fan) to 11.6 m when the fan is repositioned 20 m closer to the fire (Table 7). The observed inverse relationship between fan-to-fire distance and back-layering length underpins the numerical case design in the next section.
From Table 8, the fan delivers 9.35 m3 s-1 of fresh air through the 1.25 m2 inlet, whereas the exhaust opening (1.68 m2) discharges 3.05 m3/s. Consequently, the farther the longitudinal fan is advanced from the fire source, the greater the longitudinal exhaust velocity becomes and the shorter the smoke back-layering length.

Table 8. Velocity, area and air volume for inlet and outlet.
3.2 Impact of temperature on personnel evacuation
This section explored the impact of air temperature on personnel evacuation. Figure 4 presents the temperature distribution along the X = 2 m at t = 30 s for the four numerical cases. In the absence of longitudinal ventilation (Case 1), no smoke back-layering occurs. When the fan is placed at the inlet (Case 2), the smoke back-layering length is 48 m. Advancing the fan to a position 20 m from the inlet causes the flame to tilt and reduces the back-layering length to 15 m (Case 3). When the fan is moved to 30 m from the inlet (Case 4), the flame tilts even more markedly, and the back-layering length decreases to 7 m. Thus, the smoke back-layering length is negatively correlated with the longitudinal velocity induced by the fan at the fire source; that is, the greater the airflow across the fire, the shorter the back-layering length. Hence, along the 2 m reference plane, the temperature field remains essentially symmetric and decreases evenly on both sides when either no fan is active or the fan is located far from the fire source. As the fan is moved closer to the fire, the longitudinal airflow distorts this symmetry: the closer the fan is to the fire, the more pronounced the temperature gradient becomes.
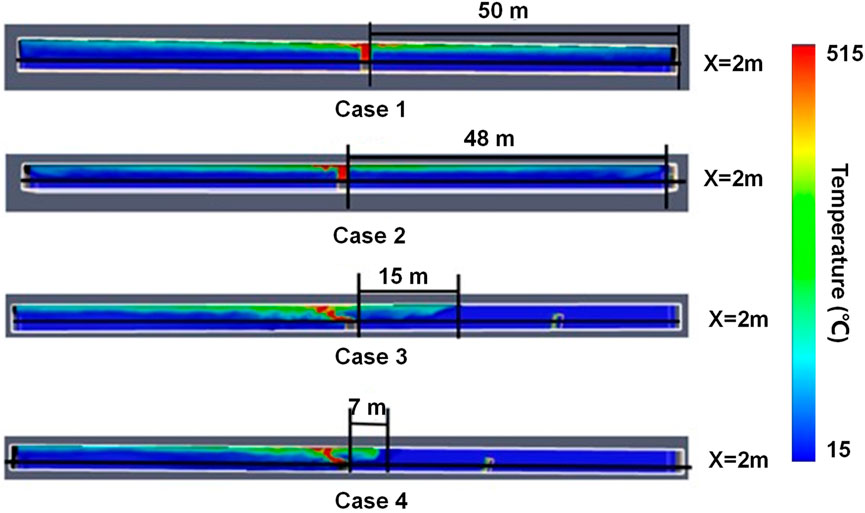
Figure 4. Temperature distributions at different scenarios of fan positions.
As shown in Figure 4, Cases 1 and 2 exhibit similar smoke-spread patterns at the same instant; in both, the plume develops symmetrically about the fire source. To enhance evacuation efficiency, the upstream side of the fan is designated as the safe zone, and the time-averaged temperature evolution between the fire and the fan is extracted. The resulting data are used to compute evacuation times and to assess how fire parameters affect evacuation efficiency. Figure 5 presents the temperature trend at selected measurement points over time. Regardless of whether the fan is placed 20 m or 30 m upstream of the fire, once an effective longitudinal airflow is established, the temperature in its vicinity stabilizes between 15 C and 30 C. For Cases 3 and 4, the temperature near the fire source follows almost identical trends: it peaks at 1150 C within 5 s and then declines to a dynamic equilibrium range of 20 C–330 C.
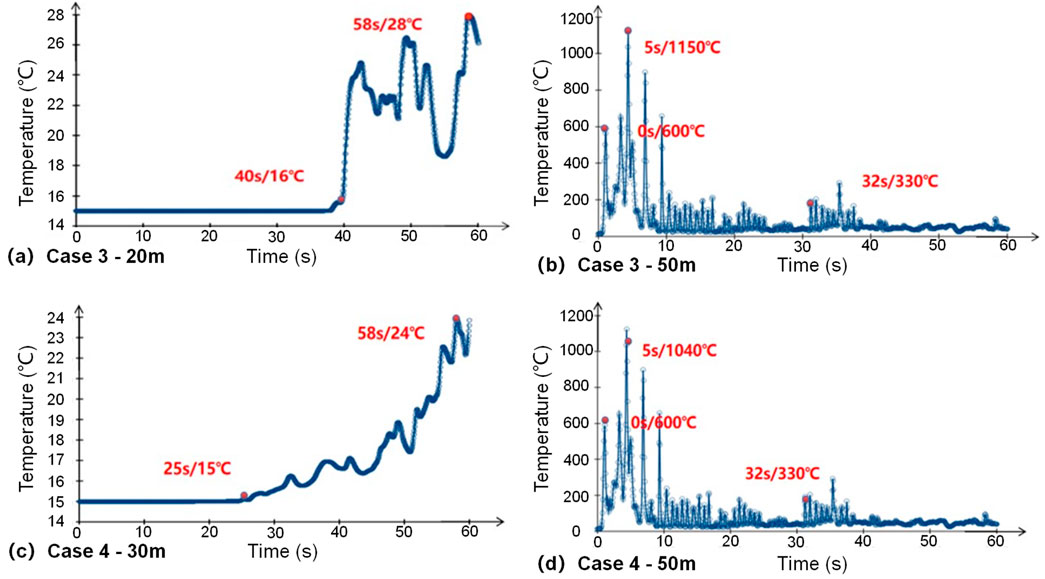
Figure 5. Change trends of temperature at different measurement points over time.
Based on the simulation results, the influence of temperature on evacuation efficiency is evaluated under the assumption of a constant pedestrian walking speed. Using Equations 8, 9, parametric equations are derived for fan-to-fire distances of 20 m and 30 m. These equations yield the distances corresponding to the critical hazardous temperature of 60 C. Combining these distances with the walking-speed relationship, the required safe egress time (RSET) and available safe egress time (ASET) are calculated and compared for the two fan positions. The correlation between temperature and evacuation distance is shown in Figure 6, while the relationship between evacuation distance and evacuation time is presented in Figure 7.
where,
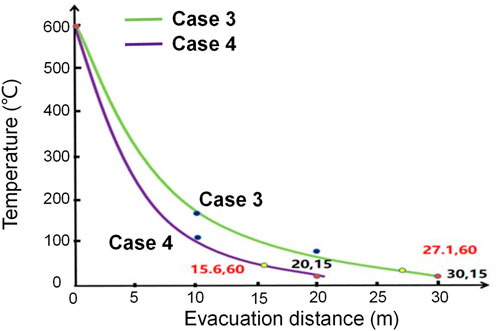
Figure 6. The relationship between temperature and evacuation distance.
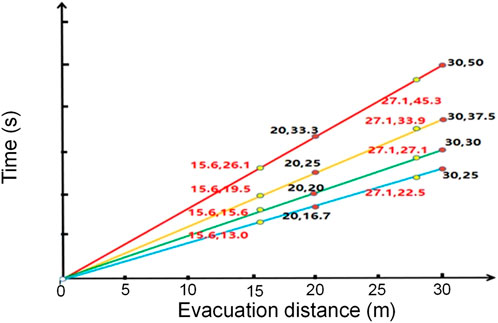
Figure 7. The relationship between evacuation time and evacuation distance.
Figure 6 shows that the shorter the distance between the fan and the fire source, the faster the temperature decreases and the shorter the safe evacuation distance. The relationship follows a parabolic trend, and fitting with the basic conic expression gives
Therefore, reducing the fan-to-fire distance steepens the temperature gradient, shortens the evacuation distance, and consequently decreases the required evacuation time, thereby effectively improving evacuation efficiency.
3.3 Impact of visibility on personnel evacuation
The visibility contours in the tunnel cross-sections (Figure 8) show that without longitudinal ventilation no smoke back-layering is observed; when the jet fan is installed at the portal the back-layering length reaches 48 m. Advancing the fan 20 m into the tunnel (positioned 30 m upstream of the fire) causes the flame to tilt and reduces the back-layering to 15 m, while positioning the fan 30 m from the portal (20 m upstream of the fire) produces an even more pronounced plume inclination and further shortens the back-layering to 7 m. Consequently, the smoke back-layering length decreases monotonically with the longitudinal velocity induced at the fire source, confirming a negative correlation: the larger the airflow across the fire, the shorter the upstream smoke intrusion. Along the 2 m reference plane, the visibility remains almost unchanged and the smoke spreads symmetrically when either no fan is present or the fan is located far from the fire. As the fan-to-fire distance is reduced, the longitudinal jet first induces transient turbulence; once a stable flow is established the back-layering length contracts and the visibility in the upstream region increases markedly.
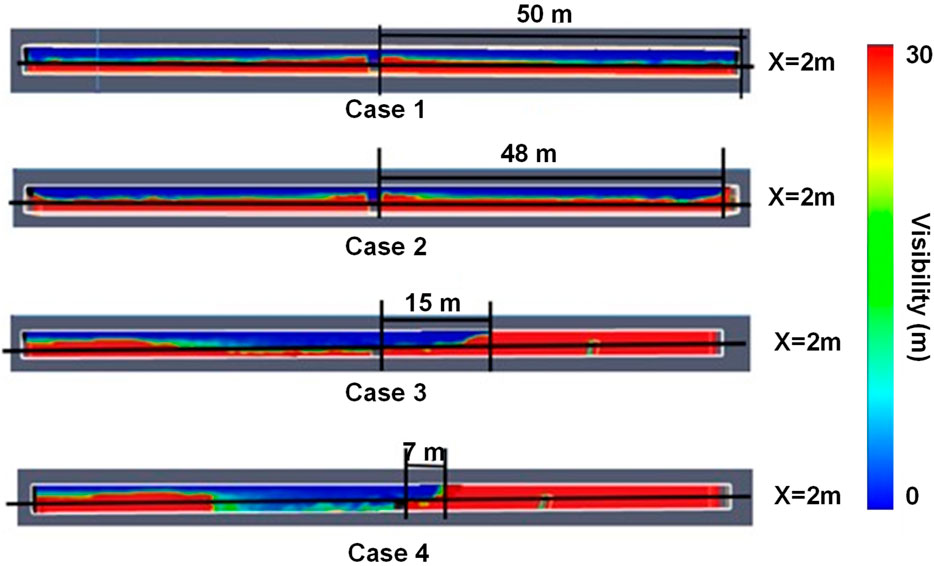
Figure 8. Visibility distributions at different scenarios of fan positions.
The visibility in the upstream region of the fan approaches 30 m. Downstream, the longitudinal ventilation causes the flame to tilt markedly and the plume to entrain air, destroying the fire neutral plane. This produces transient turbulence; once a stable longitudinal flow is established across the tunnel cross-section, visibility fluctuates around a constant value. Figure 9 presents the visibility trend at different measuring points over time. With a fixed fan outlet velocity, shortening the fan-to-fire distance alters the timing of visibility changes downstream. Specifically, the visibility at the 40 m measuring point drops from 30 m after 14 s when the fan is 30 m upstream and after only 12.5 s when it is 20 m upstream. At the fire source, the time required for visibility to fall from 30 m to a dynamic equilibrium is reduced from 26.67 s to 22 s.
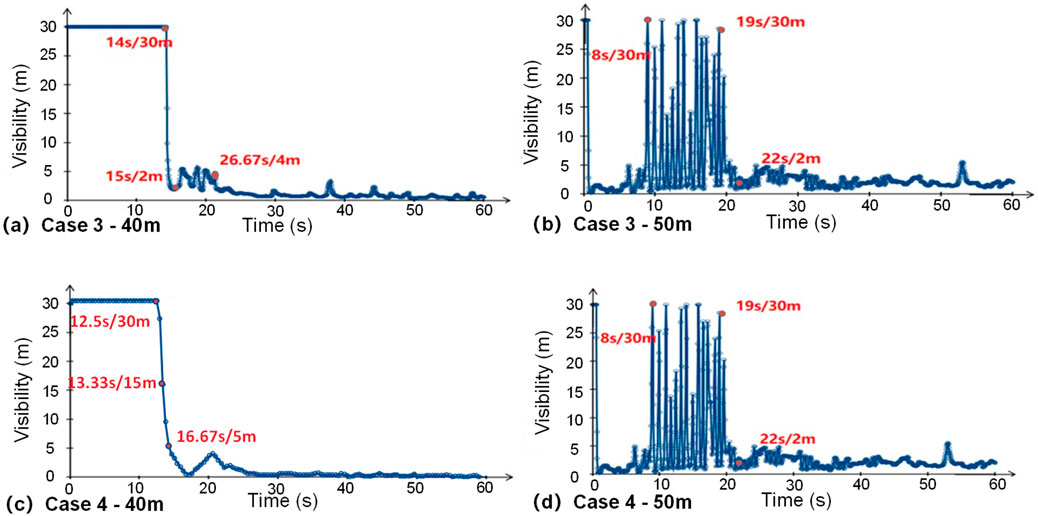
Figure 9. Change trend of visibility at different measurement points over time.
The smoke back-layering length and the safe evacuation distance are numerically identical. To further investigate the effect of visibility on evacuation efficiency, an average visibility decay is assumed, and the relationship between evacuation distance and visibility is derived, as shown in Figure 10. Results indicate that when visibility decreases uniformly, the smaller the distance between the fan and the fire source, the shorter the smoke back-layering length and the smaller the safe evacuation distance. For Case 3, the upstream visibility is expressed as
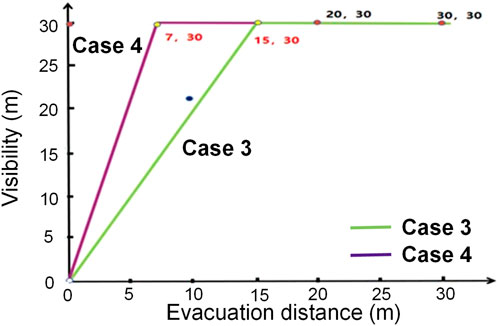
Figure 10. The relationship between visibility and evacuation distance.
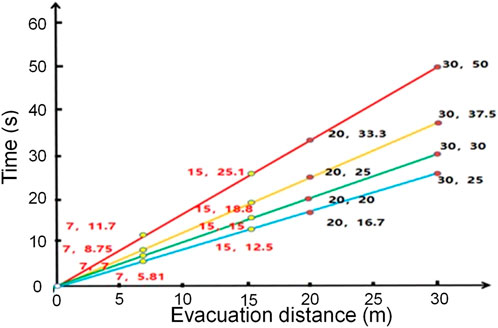
Figure 11. The relationship between evacuation time and evacuation distance.
3.4 Impact of CO volume fraction on personnel evacuation
The CO volume fraction distribution is shown in Figure 12. Along the 2 m reference line, no appreciable variation in CO volume fraction occurs when no fan is active or when the fan is positioned far from the fire source. As the relative distance between the fan and the fire decreases, the longitudinal airflow simultaneously reduces both the back-layering length and the CO volume fraction; the CO volume fraction immediately upstream and downstream of the fan remains within the 10−9 mol/mol range.
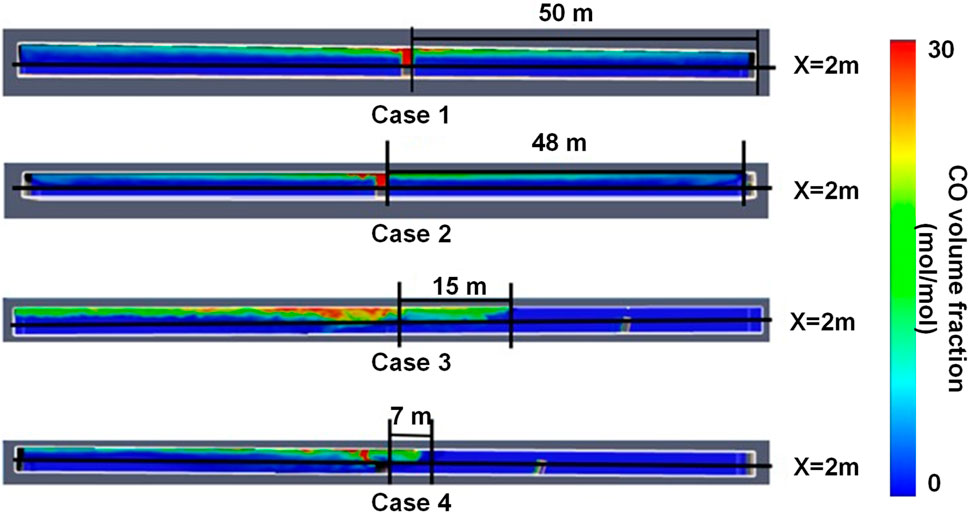
Figure 12. CO volume fraction at different scenarios of fan positions.
Upstream of the fan the CO volume fraction remains on the order of 10−4 mol/mol. Downstream, the longitudinal airflow first produces transient turbulence; once a stable stream is established the CO volume fraction stabilizes around 10−3 mol/mol. Figure 13 illustrates the temporal evolution of CO at the fan and fire locations. With a fixed fan outlet velocity, shortening the fan-to-fire distance causes the CO level at the fan to rise gradually after an initial plateau, while the downstream concentration fluctuates near 5 × 10⁻² mol/mol. After the longitudinal flow stabilizes, the CO value levels off at approximately 6.8 × 10⁻³ mol/mol. Based on these results, the influence of CO volume fraction on evacuation efficiency is assessed by keeping pedestrian walking speed constant and calculating the required safe egress time using Equation 10:
where, P denotes atmospheric pressure (Pa), V is gas volume (m3), N is the amount of substance (mol), T is temperature (K), and R is the universal gas constant (8.314 J mol-1 K−1). Using this relation, parametric equations for fan-to-fire distances of 20 m and 30 m were derived, yielding the distances corresponding to the critical CO volume fraction in the fire environment.
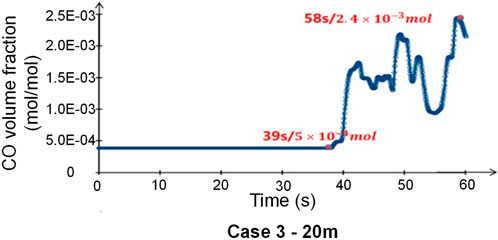
Figure 13. Change trend of CO volume fraction at different measurement points over time.
The relationship between evacuation distance and CO volume fraction is plotted in Figure 14. By combining these distances with the walking-speed relation, the required safe egress time and available safe egress time were calculated and compared. The closer the fan is to the fire, the faster the CO volume fraction decays and the shorter the safe evacuation distance becomes. Fitting gives
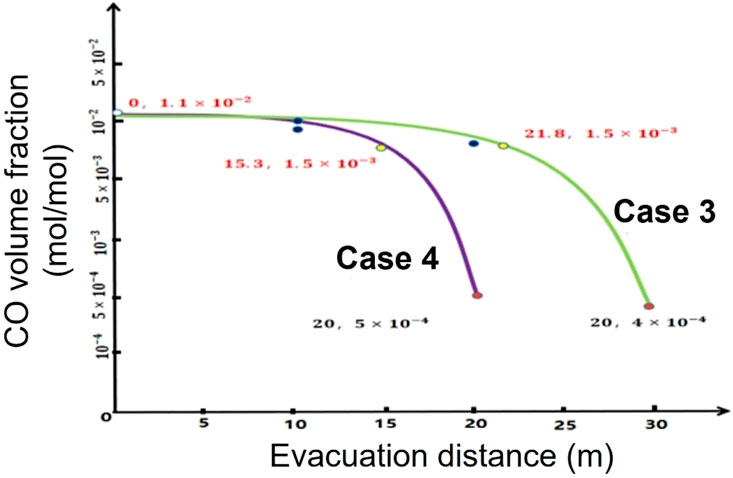
Figure 14. The relationship between CO volume fraction and evacuation distance.
The relation between evacuation distance and time is shown in Figure 15. For a constant walking speed, evacuation distance and time are positively correlated. With the most conservative speed of 0.6 m/s, the linear equation Y = 1.67 X applies. Substituting 30 m and 20 m gives ASET of 50 s and 33.3 s (black symbols), while substituting 21.8 m and 15.3 m gives RSET of 36.4 s and 21.8 s (red symbols). In every case ASET exceeds RSET, confirming that shorter distances lead to shorter evacuation times.
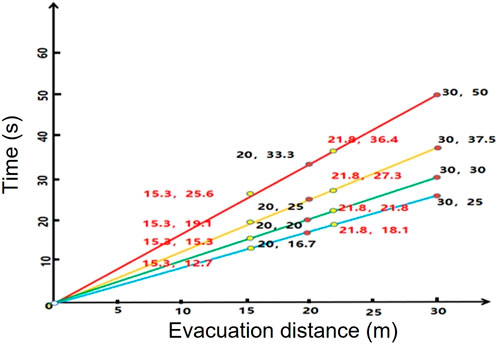
Figure 15. The relationship between evacuation time and evacuation distance.
3.5 Comprehensive impact of different fan positions on evacuation safety
Our integrated analysis reveals that positioning the fan 20 m from the fire source profoundly improves evacuation conditions: the maximum temperature in the evacuation path plunges by 73.9% (from 1150 °C to 300 °C), visibility surges from <1 m to ∼30 m, and CO concentrations fall from lethal levels (>1500 ppm) to a safe 500 ppm.
The temporal evolution of these safety parameters (Figures 5, 9, 13) demonstrates that optimal fan positioning not only improves steady-state conditions but also significantly extends the available safe egress time (ASET). With the fan at 20 m from the fire, the ASET increased from 20 s (no ventilation) to 60 s, providing a 200% extension of the critical evacuation window. This time extension is particularly crucial during the initial stages of fire development when occupant evacuation is most vulnerable.
4 Discussion
Under an integrated experimental–simulation–evacuation framework, this study systematically uncovers the deep-seated influence of “mobile-fan-to-fire distance” on tunnel smoke control and personnel-evacuation efficiency. Compared with previous work, we not only provide quantified physical-field evolution curves but also, for the first time, incorporate “fan deployment”—a variable that can be adjusted on scene—into a holistic safety-assessment system, yielding directly actionable protocols for tunnel-fire rescue.
Experiments and simulations unanimously demonstrate that a mobile fan is far more than a simple “air-supply” device; it acts as a relocatable node that can restructure energy, momentum, and mass transport within the tunnel. When the fan is remote from the fire source, jet momentum decays owing to wall friction and turbulent dissipation, allowing smoke to form a stable stratified layer beneath the ceiling. Under such conditions, buoyancy governs longitudinal spread, and temperature, CO volume fraction, and visibility exhibit a prolonged “plateau.” Once occupants enter this zone, their tenability limits are rapidly exceeded. Conversely, advancing the fan concentrates jet energy at the base of the fire plume. The resulting competing interaction between longitudinal thrust and buoyancy deflects smoke downstream and compresses the back-layering length. Most importantly, this compression is nonlinear: experiments reveal that for every 10 m reduction in fan-to-fire distance, the back-layering length shortens by an average of 12 m, the safe evacuation distance shrinks by 5–8 m, and the required safe egress time (RSET) drops by about 15%. This exponential relationship indicates a critical-distance threshold beyond which the “folding” effect of the fan on smoke becomes marginally diminished and may even induce secondary turbulence due to excessive entrainment. The finding supplements the linear critical-wind-speed model proposed by Tang et al. and offers incident commanders a new insight: “distance takes precedence over wind speed.”
Traditional tunnel-firefighting plans center on “increasing wind speed,” yet this is often impractical on scene because of power or duct constraints. By shifting the focus to fan position, the present study highlights the differing sensitivities of temperature, visibility, and CO to fan displacement. The results advise field commanders to prioritize infrared temperature sensors rather than relying solely on CO or visibility detectors, thereby preventing decision delays caused by “lag alarms.”
Although this study has advanced in scale and coupled methodology, four limitations remain. First, the fire source power is limited to the range of 0.four to four MW, representative of passenger car fires, and does not include high-intensity scenarios such as heavy goods vehicle (HGV) fires (30–100 MW). The generalizability of the specific quantitative results (e.g., the optimal fan-to-fire distance of 15–20 m) to these high-intensity fires requires further validation. Under such conditions, the significantly greater heat release rate would likely lead to smoke layer breakup due to intensified turbulence, enhanced flame radiation altering evacuation path tenability, and a substantially increased critical velocity. These factors may alter the observed smoke control patterns and the efficacy of the fan positioning strategy identified in this work. While the fundamental principle, that optimizing fan position relative to the fire source enhances smoke management, is expected to hold, the specific operational parameters would need to be recalibrated for HGV fires. Second, and crucially, all FDS simulations in this work are based on a set of idealized assumptions. The fire source is modeled as symmetric and centrally located, and the tunnel is straight and horizontal without considering the effects of traffic blockages. Furthermore, the evacuation model employs a simplified representation of human movement. Consequently, the specific quantitative findings regarding optimal fan distance are most directly applicable to scenarios that approximate these baseline conditions. The presence of real-world complexities, such as an asymmetric fire originating from a vehicle near the tunnel wall, which would create a skewed smoke plume; curved tunnel sections that alter airflow and smoke stratification; stalled vehicles that obstruct evacuation routes and disrupt ventilation; or the inclusion of competitive and panic-driven crowd dynamics, could significantly modify the flow fields, hazardous environment distribution, and evacuation efficiency. These factors may thereby alter the optimal ventilation strategy identified in this study and represent a critical frontier for future research. Third, the evacuation model employs a simplified assumption of a constant, conservative walking speed (0.6 m/s) for all occupants and assumes unidirectional flow towards the exit. This approach constitutes a primary limitation, as it does not capture the dynamic and complex nature of real-world emergency egress. Critical factors such as variable demographics (e.g., the presence of the elderly, children, or individuals with disabilities), reductions in walking speed and stop-and-go behavior due to crowd congestion (especially at bottlenecks), competitive or counter-flow movements, and the profound impact of psychological factors like panic, which can lead to irrational route choices, herding, and falling, are not accounted for. Furthermore, the model neglects potential interactions with and obstructions from abandoned vehicles, which can severely block evacuation paths. Consequently, the calculated Required Safe Egress Time (RSET) in this study should be interpreted as a theoretical lower bound under idealized behavioral conditions. In a real tunnel fire, these behavioral and physical factors could significantly increase the actual RSET, thereby narrowing the safety margin (ASET - RSET) and potentially altering the evacuation outcome. Fourth, the operational parameters of the mobile fan were simplified, with its inclination angle fixed at 20°. The impact of varying this angle (e.g., within a range of 0°–30°) on the “Coanda effect” and the efficiency of momentum transfer to disrupt the fire plume remains unexplored. Furthermore, this study focused on the scenario of a single fan. In practice, multiple fans are often deployed in a coordinated manner. The complex, potentially synergistic or interfering, interactions between multiple jets and their collective impact on the global flow field and smoke control represent a critical area for further investigation. Fifth, a recognized limitation of this numerical study is the absence of a formal mesh convergence analysis and a comprehensive quantitative uncertainty analysis. While the mesh size was determined following established FDS guidelines and the model was validated against our full-scale experiments for global parameters (e.g., back-layering length, critical velocity), the sensitivity of key outputs (e.g., precise temperature thresholds, CO concentration gradients) to further grid refinement was not quantitatively assessed. Furthermore, the predictions of evacuation time (RSET) are subject to compounded uncertainties from the fire model, material properties, and particularly the simplified behavioral assumptions in the evacuation model. The absence of a propagated uncertainty range for the final safety margin (ASET - RSET) should be considered when interpreting the results.
Future work will be considered by four aspects. (1) Expand the fire-source database: In collaboration with highway administrations, establish a comprehensive database of heat-release-rate curves ranging from passenger cars to heavy goods vehicles to provide tiered deployment strategies for mobile fans under different fire powers, explicitly addressing the gap identified in this study. (2) Complex geometry coupling: Employ FDS + Pathfinder co-simulation to introduce curved alignments, cross-passages, and the impact of traffic blockages. (3) Refined crowd behavior modeling: To address the critical limitation of simplified evacuation assumptions, future research will employ advanced social force models or agent-based models within platforms like FDS + Pathfinder. This will incorporate demographic distributions, crowd turbulence, competitive behaviors, and panic-induced delays calibrated from real-world surveillance data or experimental studies. The aim is to achieve a realistic, dynamic interaction among fire, smoke, obstructing vehicles, and pedestrians, thereby drastically improving the predictive accuracy of RSET for risk-informed tunnel safety design and management. (4) Development of an intelligent decision support system: This will be a primary focus, building directly upon the findings of this study. We plan to integrate Internet of Things (IoT) sensors (e.g., for temperature, CO, and visibility) with a central control platform. Using optimization algorithms, this system will automate the decision-making process for emergency responders, providing real-time recommendations for the optimal positioning and operational parameters (velocity, inclination) of mobile fans. The ultimate goal is to simulate and develop protocols for the dynamic repositioning of fans based on live fire and evacuation feedback, moving tunnel fire rescue from an experience-driven operation to a proactive, data-driven one.
In summary, this study has not only quantified the influence of mobile-fan distance on smoke control and evacuation efficiency in tunnel fires but also proposed directly applicable on-site deployment guidelines, providing both theoretical and technical support for building resilient tunnel safety systems.
5 Conclusion
This study employed combined full-scale experiments and FDS numerical simulations to analyze low-density tunnel fires. Critical wind speed, fire power and smoke production were determined for each scenario, and the temporal evolution of temperature, visibility and CO volume fraction was examined in detail. Coupled with evacuation criteria, these data were used to evaluate pedestrian egress time. The main conclusions are.
1. Under low-density fire conditions the critical longitudinal velocity for tunnel fires lies between 1 and 3 m/s. Ventilation velocity is positively correlated with smoke-layer thickness near the fire source; higher wind speeds yield thicker layers. Conversely, smoke back-layering length is negatively correlated with fan velocity—greater airflow shortens the upstream reach of smoke.
2. Based on longitudinal slices at the 2 m level, fan location strongly influences temperature, visibility and CO volume fraction. Shortening the fan-to-fire distance lowers upstream temperature, raises visibility and reduces CO volume fraction, all of which enhance evacuation safety.
3. At a fixed walking speed, reducing the fan-to-fire distance decreases both the back-layering and evacuation distances, thus shortening the required safe egress time (RSET). The parameters' influence follows the hierarchy of temperature > CO volume fraction > visibility, confirming that overall evacuation efficiency improves as the fan is positioned closer to the fire.
4. Fan positioning within 15–20 m upstream of the fire source achieves simultaneous optimization of all critical safety parameters: reducing temperatures by 73.9%, improving visibility by > 29 m, and lowering CO concentrations by 66.7% compared to no ventilation conditions.
Data availability statement
The original contributions presented in the study are included in the article/supplementary material, further inquiries can be directed to the corresponding author.
Author contributions
ZL: Writing – original draft. RZ: Writing – original draft, Writing – review and editing. JW: Investigation, Validation, Writing – review and editing.
Funding
The author(s) declare that financial support was received for the research and/or publication of this article. Thanks to the support of by the China Fire and Rescue Institute, Aisika (Shanghai) Security Technology Co., Ltd, and the funding of Institution-level Research Project of China Fire and Rescue Institute “Investigation of Smoke-Induced Attenuation of Wireless Communication Signals in Fire Environments” (Project No. XFKYY202505).
Conflict of interest
Author JW was employed by Aisika (Shanghai) Security Technology Co., Ltd.
The remaining authors declare that the research was conducted in the absence of any commercial or financial relationships that could be construed as a potential conflict of interest.
The authors declare that this study received funding from China Fire and Rescue Institute, Aisika (Shanghai) Security Technology Co., Ltd,. The funder had the following involvement in the study: Data collection.
Generative AI statement
The author(s) declare that no Generative AI was used in the creation of this manuscript.
Any alternative text (alt text) provided alongside figures in this article has been generated by Frontiers with the support of artificial intelligence and reasonable efforts have been made to ensure accuracy, including review by the authors wherever possible. If you identify any issues, please contact us.
Publisher’s note
All claims expressed in this article are solely those of the authors and do not necessarily represent those of their affiliated organizations, or those of the publisher, the editors and the reviewers. Any product that may be evaluated in this article, or claim that may be made by its manufacturer, is not guaranteed or endorsed by the publisher.
References
An, R., Wu, Z. H., Tong, Z. M., Qin, S. X., Zhu, Y., and Liu, Y. L. (2022). How the built environment promotes public transportation in wuhan: a multiscale geographically weighted regression analysis. Travel Behav. Soc. 29, 186–199. doi:10.1016/j.tbs.2022.06.011
Baek, D., Sung, K. H., and Ryou, H. S. (2017). Experimental study on the effect of heat release rate and aspect ratio of tunnel on the plug-holing phenomena in shallow underground tunnels. Int. J. Heat. Mass Tran 113, 1135–1141. doi:10.1016/j.ijheatmasstransfer.2017.06.044
Caliendo, C., Ciambelli, P., Guglielmo, M. L. D., Meo, M. G., Russo, P., and Amey, A. (2018). Computational analysis of fire and people evacuation for different positions of burning vehicles in a road tunnel with emergency exits. Cogent Eng. 5, 1530834–12. doi:10.1080/23311916.2018.1530834
Caliendo, C., Russo, I., and Genovese, G. (2022). Resilience assessment of a twin-tube motorway tunnel in the event of a traffic accident or fire in a tube. Appl. Sci. 12 (1), 513. doi:10.3390/app12010513
Canitez, F., Alpkokin, P., and Kiremitci, S. T. (2020). Sustainable urban mobility in istanbul: challenges and prospects. Case Stud. Transp. Pol. 8 (4), 1148–1157. doi:10.1016/j.cstp.2020.07.005
Fridolf, K., Nilsson, D., and Frantzich, H. (2013). Fire evacuation in underground transportation systems: a review of accidents and empirical research. Fire Technol 49 (2), 451–475. doi:10.1007/s10694-011-0217-x
Gavresi, D., Litina, A., and Tsiachtsiras, G. (2025). Motorways and railroads to trust. J. Econ. Behav. Organ 234, 106972. doi:10.1016/j.jebo.2025.106972
Guo, Q. H., Zhu, H. H., Zhang, Y. X., Shen, Y., Zhang, Y. P., and Yan, Z. G. (2020). Smoke flow in full-scale urban road tunnel fires with large cross-sectional vertical shafts. Tunn. Undergr. Sp. Tech. 104, 103536. doi:10.1016/j.tust.2020.103536
Guo, Q. H., Li, Y. Z., Ingason, H., Yan, Z. G., and Zhu, H. H. (2021). Theoretical studies on buoyancy-driven ceiling jets of tunnel fires with natural ventilation. Fire Saf. J. 119, 103228. doi:10.1016/j.firesaf.2020.103228
Hodges, J. L., Salvi, U., and Kapahi, A. (2024). Design fire scenarios for hazard assessment of modern battery electric and internal combustion engine passenger vehicles. Fire Saf. J. 146, 104145. doi:10.1016/j.firesaf.2024.104145
Hsu, W. S., Huang, Y. H., Shen, T. S., Cheng, C. Y., and Chen, T. Y. (2017). Analysis of the hsuehshan tunnel fire in Taiwan. Tunn. Undergr. Sp. Tech. 69, 108–115. doi:10.1016/j.tust.2017.06.011
Ji, J., Fan, C. G., Zhong, W., Shen, X. B., and Sun, J. H. (2012). Experimental investigation on influence of different transverse fire locations on maximum smoke temperature under the tunnel ceiling. Int. J. Heat. Mass Tran 55 (17-18), 4817–4826. doi:10.1016/j.ijheatmasstransfer.2012.04.052
Jia, Z. R., Chen, X. H., Zhao, Z. W., Sun, Z. Y., Zhang, L., Zhang, J. H., et al. (2025). Thermal runaway propagation path and fire risk assessment in electric vehicles based on full-vehicle experiments. Energy 336, 138484. doi:10.1016/j.energy.2025.138484
Jiang, X., Xiao, R., Zhang, M. M., Hu, W., Bai, Y., and Huang, B. S. (2020). A laboratory investigation of steel to fly ash-based geopolymer paste bonding behavior after exposure to elevated temperatures. Constr. Build. Mater 254, 119267. doi:10.1016/j.conbuildmat.2020.119267
Kang, S. W., Kwon, M., Choi, J. Y., and Choi, S. (2023). Full-scale fire testing of battery electric vehicles. Appl. Energy 332, 120497. doi:10.1016/j.apenergy.2022.120497
Kayili, S., Yozgatligil, A., and Eralp, O. C. (2011). An experimental study on the effects of blockage ratio and ventilation velocity on the heat release rate of tunnel fires. J. Fire Sci. 29 (6), 555–575. doi:10.1177/0734904111416336
Kinateder, M., Müller, M., Jost, M., Mühlberger, A., and Pauli, P. (2014). Social influence in a virtual tunnel fire - influence of conflicting information on evacuation behavior. Appl. Ergon. 45 (6), 1649–1659. doi:10.1016/j.apergo.2014.05.014
Król, A., and Król, M. (2020). The factors determining the number of the endangered people in a case of fire in a road tunnel. Fire Saf. J. 111, 102942. doi:10.1016/j.firesaf.2019.102942
Leong, W., Ang, Y., Wong, S., Aw, V., and Tan, C. (2025). Putting Thredbo recommendations into practice: case studies from the Singapore Land transport Authority. Res. Transp. Econ. 112, 101569. doi:10.1016/j.retrec.2025.101569
Liang, Y. T., Zeng, J. Q., Sun, W., Zhou, K. Y., and Zhou, Z. K. (2021). Expansion of construction land along the motorway in rapidly developing areas in Cambodia. Land Use Pol. 109, 105691. doi:10.1016/j.landusepol.2021.105691
Nguyen, M. H., Ho, T. V., and Zucker, J. D. (2013). Integration of Smoke Effect and Blind Evacuation Strategy (SEBES) within fire evacuation simulation. Simul. Model Pract. Th 36, 44–59. doi:10.1016/j.simpat.2013.04.001
Peng, F. L., Qiao, Y. K., Sabri, S., Atazadeh, B., and Rajabifard, A. (2021). A collaborative approach for urban underground space development toward sustainable development goals: critical dimensions and future directions. Front. Struct. Civ. Eng. 15 (1), 20–45. doi:10.1007/s11709-021-0716-x
Peters, N. V., Reisch, L. A., and Consortium, P. (2025). Drivers of and barriers to sustainable Urban Mobility Plan implementation: lessons from Copenhagen. Case Stud. Transp. Pol. 20, 101417. doi:10.1016/j.cstp.2025.101417
Rocha, B. T., Melo, P. C., Afonso, N., and Silva, J. A. E. (2023). The local impacts of building a large motorway network: urban growth, suburbanisation, and agglomeration. Econ. Transp. 34, 100302. doi:10.1016/j.ecotra.2023.100302
Se, C. M. K., Lee, E. W. M., and Lai, A. C. K. (2012). Impact of location of jet fan on airflow structure in tunnel fire. Tunn. Undergr. Sp. Tech. 27 (1), 30–40. doi:10.1016/j.tust.2011.06.005
Seike, M., Kawabata, N., and Hasegawa, M. (2017). Quantitative assessment method for road tunnel fire safety: development of an evacuation simulation method using CFD-derived smoke behavior. Saf Sci 94, 116–127. doi:10.1016/j.ssci.2017.01.005
Sturm, P., Fössleitner, P., Fruhwirt, D., Heindl, S. F., Heger, O., Galler, R., et al. (2023). Dataset of fire tests with lithium-ion battery electric vehicles in road tunnels. Data Brief 46, 108839. doi:10.1016/j.dib.2022.108839
Tang, F., He, Q., Mei, F. Z., Wang, Q., and Zhang, H. (2018). Effect of ceiling centralized mechanical smoke exhaust on the critical velocity that inhibits the reverse flow of thermal plume in a longitudinal ventilated tunnel. Tunn. Undergr. Sp. Tech. 82, 191–198. doi:10.1016/j.tust.2018.08.039
Uchida, K., Wasa, Y., and Kanai, M. (1992). Design of the shield tunnel for the trans-tokyo Bay highway. Tunn. Undergr. Sp. Tech. 7 (3), 251–261. doi:10.1016/0886-7798(92)90006-4
Wang, X., Wang, M. N., Jiang, R. L., Xu, J. N., Li, B. T., Wang, X., et al. (2023). Impact of battery electric vehicles on ventilation design for road tunnels: a review. Tunn. Undergr. Sp. Tech. 134, 105013. doi:10.1016/j.tust.2023.105013
Yan, Z. G., Guo, Q. H., and Zhu, H. H. (2017). Full-scale experiments on fire characteristics of road tunnel at high altitude. Tunn. Undergr. Sp. Tech. 66, 134–146. doi:10.1016/j.tust.2017.04.007
Zhang D, D. M., Zhu, R., Huang, Z. K., and Yu, L. (2025). Probabilistic analysis of fire casualties in an urban traffic tunnel considering the uncertainty of vehicle queue. Tunn. Undergr. Sp. Tech. 162, 106619. doi:10.1016/j.tust.2025.106619
Zhang, Y. X., Yan, Z. G., Zhu, H. H., Shen, Y., Guo, Q. H., and Guo, Q. C. (2019). Experimental investigation of pedestrian evacuation using an extra-long steep-slope evacuation path in a high altitude tunnel fire. Sustain Cities Soc. 46, 101423. doi:10.1016/j.scs.2019.101423
Zhang, Y. X., Li, W., Rui, Y., Wang, S. Y., Zhu, H. H., and Yan, Z. G. (2022). A modified cellular automaton model of pedestrian evacuation in a tunnel fire. Tunn. Undergr. Sp. Tech. 130, 104673. doi:10.1016/j.tust.2022.104673
Zhang L, L., Zhang, D. S., Xie, W. L., Yin, L., Zhao, L. J., Zhou, S. D., et al. (2025). Comparative analysis of full-scale battery electric vehicle fire evolution under open and semi-enclosed conditions. Process Saf. Environ. Prot. 202, 107679. doi:10.1016/j.psep.2025.107679
Keywords: highway tunnel, fire, smoke spread, personnel evacuation, fan positioning
Citation: Liu Z, Zhao R and Wang J (2025) Effects of fan placement on smoke spread and occupant evacuation in highway tunnel fires. Front. Built Environ. 11:1674644. doi: 10.3389/fbuil.2025.1674644
Received: 28 July 2025; Accepted: 23 October 2025;
Published: 12 November 2025.
Edited by:
Yanming Ding, China University of Geosciences Wuhan, ChinaReviewed by:
Fangyi Guo, Xi’an University of Science and Technology, ChinaCigdem Avci-Karatas, Yalova UniversitesiMuhendislik Fakultesi, Türkiye
Copyright © 2025 Liu, Zhao and Wang. This is an open-access article distributed under the terms of the Creative Commons Attribution License (CC BY). The use, distribution or reproduction in other forums is permitted, provided the original author(s) and the copyright owner(s) are credited and that the original publication in this journal is cited, in accordance with accepted academic practice. No use, distribution or reproduction is permitted which does not comply with these terms.
*Correspondence: Rongxuan Zhao, enJvbmd4dWFuQDE2My5jb20=