 Ningbo Li
 Peiwen Hao2*
- 1School of Highway Engineering, Shaanxi College of Communications Technology, Xi’an, China
- 2Key Laboratory of Road Structure and Materials, Ministry of Communication, PRC, Chang’an University, Xi’an, China
- 3College of Management, Xi’an University of Finance and Economics, Xi’an, China
To avoid deviations in volumetric parameters and improve correlation with field performance, a balanced mix design for AC-5 was made in this article. The three initial asphalt contents were determined based on engineering experience. An overlay tester (OT) test was applied to all asphalt contents. The load loss rate, crack resistance index, and critical fracture energy were selected to determine the asphalt content range, combined with the Technique for Order Preference by Similarity to Ideal Solution (TOPSIS) method. The freeze–thaw splitting test was verified. For further mechanical research, the dynamic mechanical analyzer (DMA) dynamic modulus and fatigue tests were carried out. Finally, the hysteresis curve of a single cycle was analyzed. Based on the results, the following conclusions were obtained. Through the balanced mix design and TOPSIS analysis, the optimal asphalt content range was found to be 8.8%–9.1%. The asphalt mixture at 9.0% possessed the lowest load loss rate and crack resistance index. The critical fracture energy decreased with the reduction in the asphalt content. The split tensile strength without freeze–thaw decreased, and the freeze–thaw split tensile strength increased with increasing asphalt content. The AC-5 (9.0%) mixture possessed the highest dynamic modulus and lowest microstrain, illustrating that the mixture had the best strength and anti-reflection cracking performance. In addition, the power exponential function could be applied to predict fatigue life. Finally, the asphalt mixture at 9.0% had sufficient asphalt content, meaning that the mixture had the best bonding strength between aggregates. Higher asphalt content prevented water erosion and improved the bonding area between the asphalt and aggregate. The hysteresis curve varied according to different conditions. The stored energy
1 Background
The Marshall and Superpave design methods are widely applied nationally. Volumetric design methods determine the proportion based on the volumetric parameters. The optimal volumetric parameters do not optimize pavement performance (Li et al., 2023). Therefore, a balanced mix design (BMD) was proposed to determine the proportion based on the pavement performance instead of volumetric parameters. The definition is “asphalt mix design using performance tests on appropriately conditioned specimens that address multiple modes of distress, taking into consideration mix aging, traffic, climate, and location within the pavement structure.” AASHTP PP 105-20 offers a detailed standard including four approaches. Many departments of transportation have explored the BMD. Texas determined the asphalt content through the Hamburg wheel track test (HWTT) and the overlay tester (OT) (Zhou et al., 2014). Oregon determined the asphalt content through the flexibility index (FI) and the HWTT (Sreedhar et al., 2021). The BMD was used in cold recycled asphalt mixture (Ning et al., 2025), warm asphalt mixture (Yousefi et al., 2023), and stone matrix asphalt (SMA) (Lin et al., 2025). In addition, the reclaimed asphalt pavement (RAP) content, asphalt type, and gradation could be balanced through the BMD (Li et al., 2023). The AC-5 mixture is designed as a flexible, stress-absorbing layer with mechanical properties. Cracks should not occur in the stress-absorbing layer due to the effects of loading and temperature. Mechanical strength and deformation resistance are required. Mechanical analysis has been applied to various asphalt mixtures, including recycled asphalt mixtures (Wu et al., 2024), fiber-reinforced asphalt mixtures (Wang et al., 2025), and hot asphalt mixtures (Chen et al., 2023).
This paper first made a balanced mix design for the AC-5 mixture and conducted mechanical analysis. Through the engineering experiences, the optimal asphalt content was found to be between 8.5% and 9.5%. Three initial asphalt contents (8.5%, 9.0%, and 9.5%) were determined. Performance tests with less operation time, higher accuracy, and compliance with laboratory conditions are preferred. A Superpave gyratory compactor (SGC) is considered to be better related to field pavement performance. Therefore, SGC was applied in mixture molding. According to traffic volume, 75 gyrations were selected for the AC-5 asphalt mixture. The OT test was applied. Load loss rate, crack resistance index, and critical fracture energy were selected as the evaluation indices. Then, the TOPSIS analysis method was applied to determine the optimal asphalt content range. The dynamic mechanical analyzer (DMA) was used for mechanical analysis and fatigue analysis. In addition, a hysteresis curve was drawn, and the stored energy
2 Materials
The SBS(I-C) modified asphalt was chosen. Its technological indices are shown in Tables 1–3.
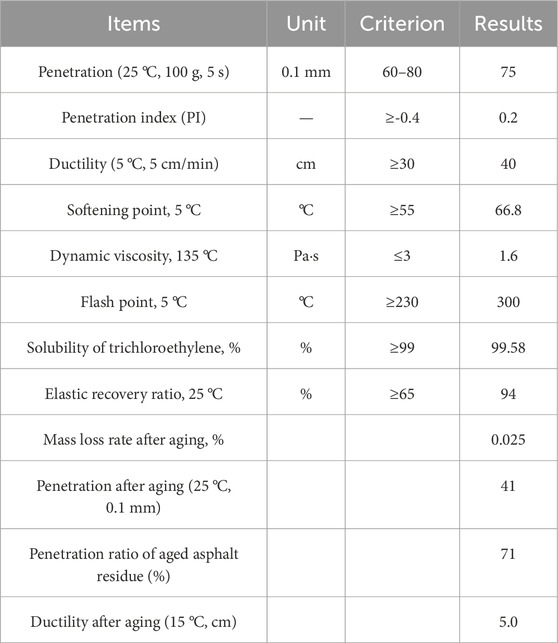
Table 1. Technological indices of SBS (I-C) modified asphalt.
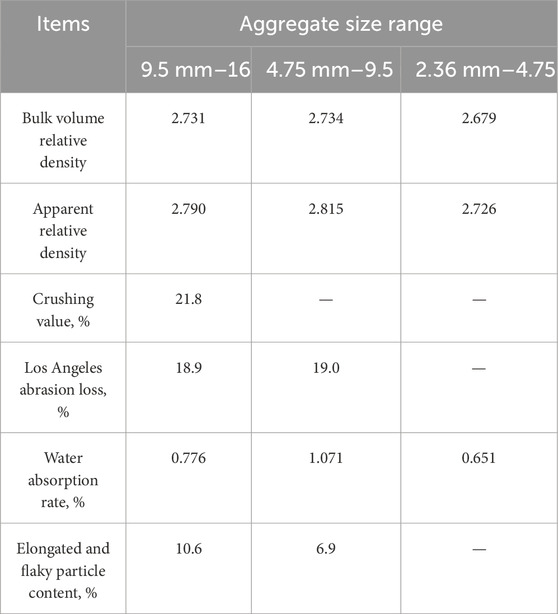
Table 2. Technological indices of coarse aggregates.
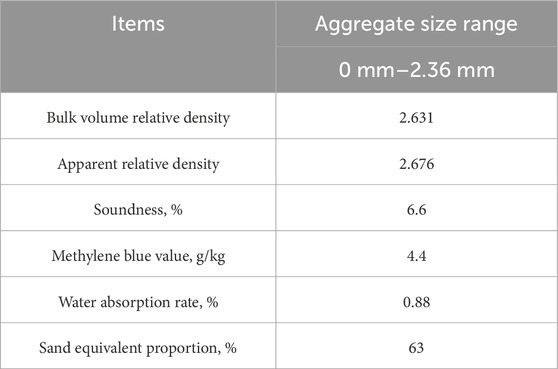
Table 3. Technological indices of fine aggregates.
The technological indices of the applied limestone powder are shown in Table 4.
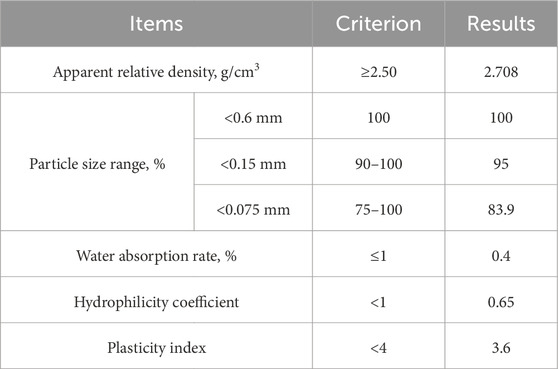
Table 4. Technological indices of limestone powder.
Designed gradation is shown in Figure 1.
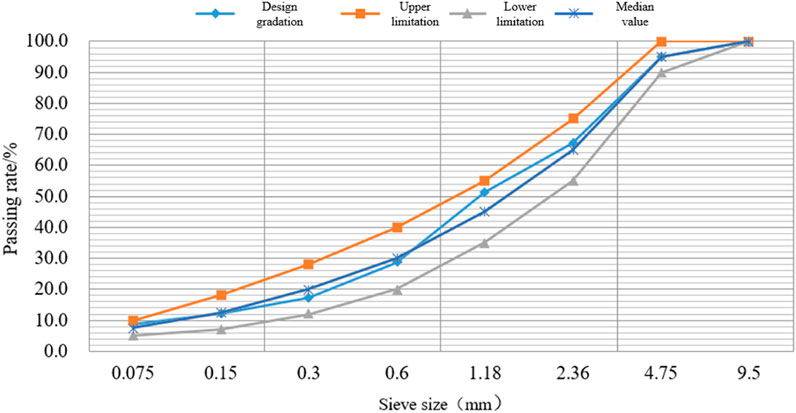
Figure 1. AC-5 gyration.
3 Test methods
3.1 Overlay test
An overlay tester (OT) was applied to evaluate the anti-reflection cracking performance of the stress-absorbing layer through cyclic horizontal loads applied on the specimen’s base (Zhou et al., 2007), as shown in Figure 2a. A Superpave gyratory compactor was used to mold a specimen with a 150 mm diameter. The specimen was cut at a height of 38 mm. The plane size is shown in Figure 2b.
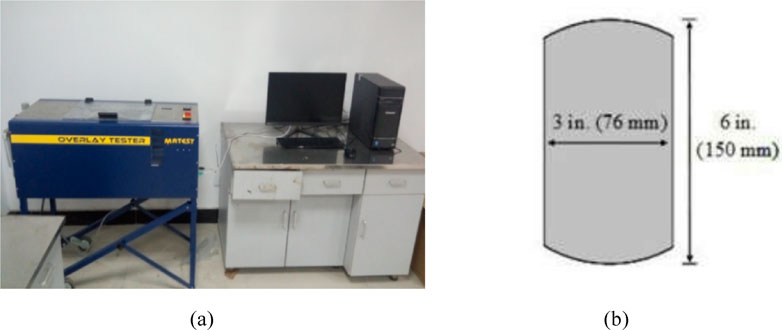
Figure 2. OT equipment and specimen size. (a) OT equipment and (b) specimen plane size.
The OT equipment applied cyclic tensile loading. The loading curve is shown in Figure 3. The slit width between the baseplate was 2 mm, and the temperature was 25 °C. When the loading times reached 1,200 or the load loss rate reached 93%, the test was ended.
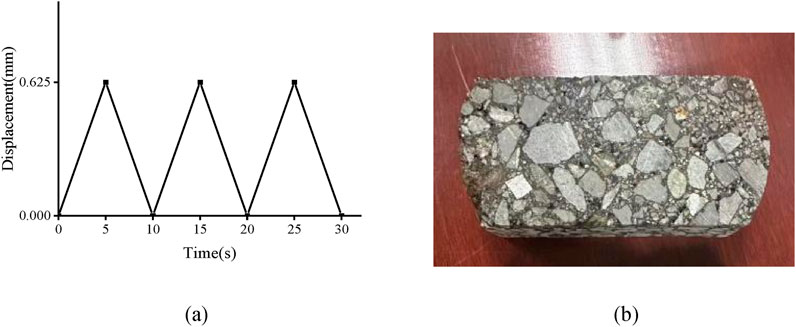
Figure 3. OT test waveform and specimen. (a) Loading wave and (b) specimen.
The test specimen was fixed using epoxy resin, and a weight was placed on the specimen to ensure complete bonding, as shown in Figure 4. The specimen was allowed to equilibrate at room temperature for 12 h. Before the test, the specimen was placed in a 25 °C incubator for 3 h.
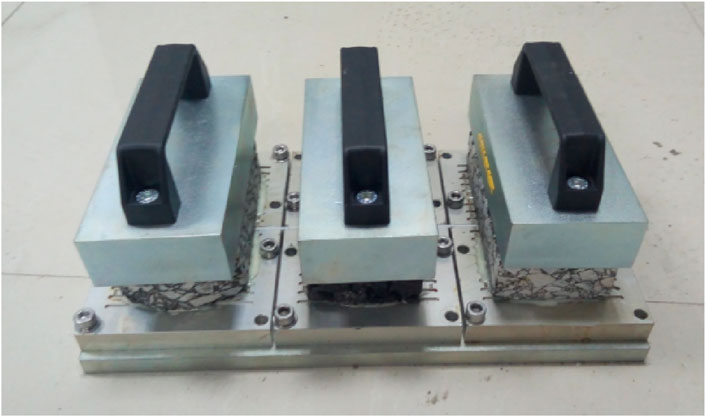
Figure 4. Paste and fix the OT specimen.
The load loss rate after 1,200 cyclic loads and the critical fracture energy in the first cycle were selected as indices. The load loss rate is calculated by comparing the residual load at the end of the cycle to the peak load. The critical fracture energy is calculated through Formula 1.
In Formula 1:
Gc—Critical fracture energy, J·mm−2;
Wc—Fracture work, J;
b—Specimen width, m;
h—Specimen height, m.
The critical fracture energy in the first cycle is shown in Figure 5.
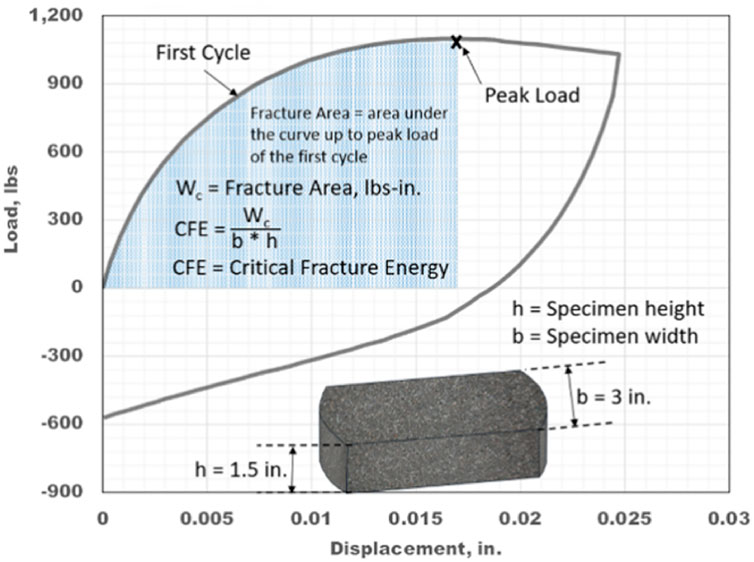
Figure 5. Critical fracture energy.
The crack resistance index was chosen to evaluate the anti-fatigue cracking performance, as shown in Figure 6.
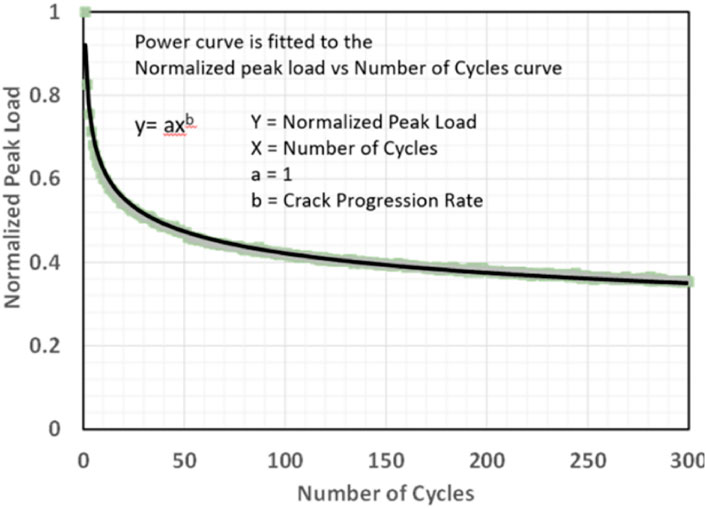
Figure 6. Crack resistance index.
Technique for Order Preference by Similarity to Ideal Solution (TOPSIS) is a common intra-group comprehensive evaluation method that utilizes raw data to react to the differences between schemes and select the optimal solution from multiple options. After determining the scheme, the ideal optimal solution and the ideal worst solution were selected. The ideal optimal solution is a hypothetical solution where each indicator attains the best value among all the criteria evaluated in the system. The ideal worst solution is a hypothetical solution where each indicator takes the worst value among all the criteria evaluated in the system. The comprehensive distances of the ideal optimal solution and the ideal worst solution are selected to evaluate the scheme.
3.2 Dynamic modulus test
The DMA was applied to conduct the middle-temperature dynamic modulus test (Masad et al., 2008), as shown in Figure 7.
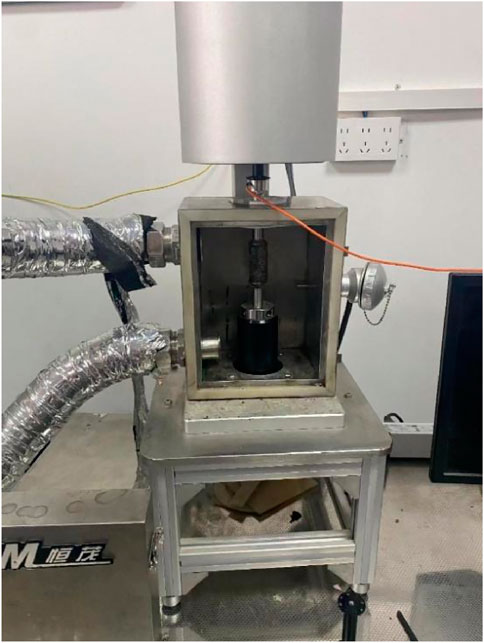
Figure 7. DMA equipment.
In DMA, periodic stress
In Formula 2:
Stress is shown in Formula 3.
In Formula 3:
The DMA parameters are shown in Table 5.
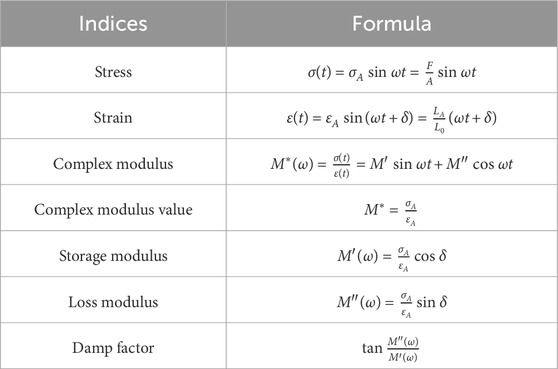
Table 5. DMA parameters.
Cylindrical specimens with 100 mm height and 25 mm diameter were cored from the SGC specimen. The specimens were bonded to the top and the bottom of the mold with epoxy binder, as shown in Figure 8.
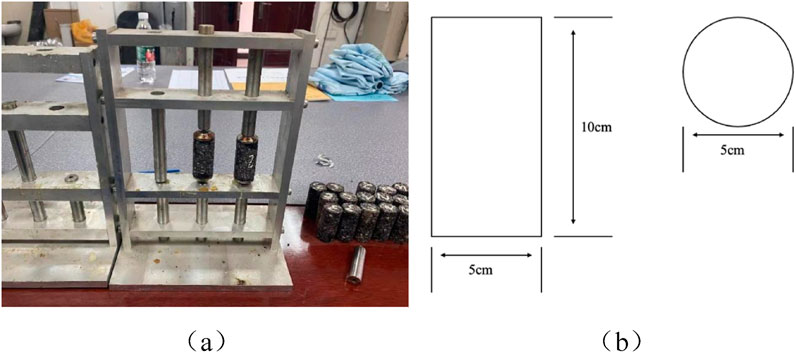
Figure 8. DMA specimens. (a) Specimen and (b) Size.
Cylindrical specimens with 100 mm height and 25 mm diameter were cored from the SGC specimen. The master curves were drawn from the time-temperature superposition shift. The shift factors were obtained through the Williams–Landel–Ferry (WLF) equation, and a sigmoidal model was applied to fit the master curves, as shown in Formula 4.
In Formula 4:
3.3 Fatigue test
DMA direct tensile fatigue test was conducted, as shown in Figure 9. The temperature was 15 °C, the frequency was 15 Hz, the stress was 0.0001 MPa, and the test time was 2 h. When the specimen broke or the test time ended, the test was concluded.
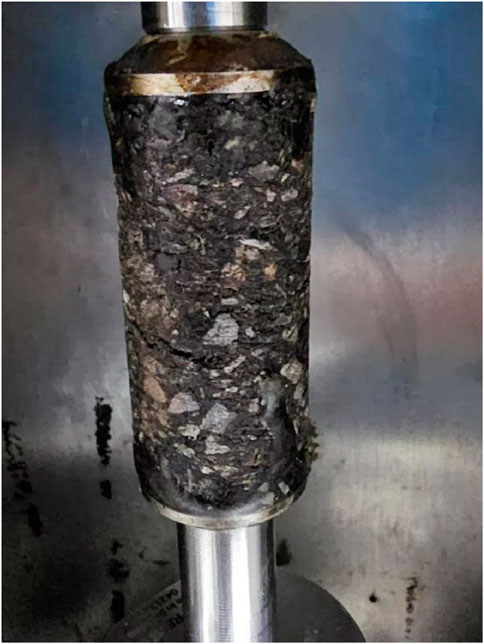
Figure 9. Fatigue test of AC-5 asphalt.
4 Analysis of the OT test and mechanical test
4.1 Overlay test results
The volumetric parameters and Marshall stability test results are shown in Table 6.
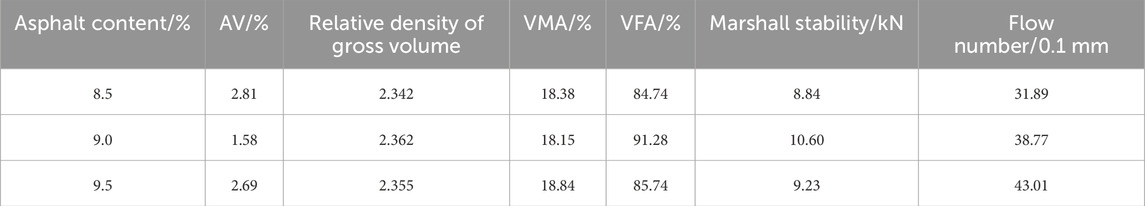
Table 6. Parameters of the Marshall design method.
As seen in Table 6, AC-5 had the lowest air voids (AVs) and the highest Marshall stability. However, the volumetric parameters had a lower correlation with field performance. Marshall stability could not reflect the performance of AC-5 as a stress-absorbing layer. Therefore, the BMD was applied. The performance space diagram obtained from the results is shown in Figure 10.
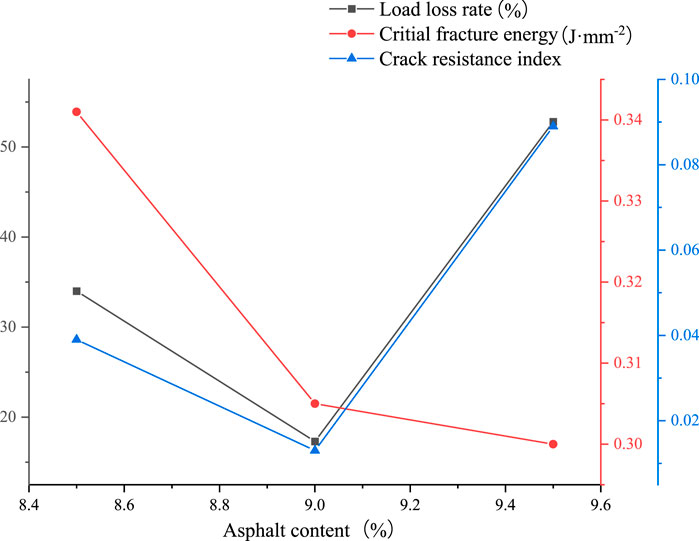
Figure 10. Performance space diagram of the AC-5 mixture.
The results indicated that AC-5 (9.0%) possessed the lowest load loss rate and crack resistance index, which means the mixture had the best anti-fatigue performance. The critical fracture energy decreased with reduced asphalt content, which means that the anti-cracking performance became weaker with the reduced asphalt content. The load loss rate and crack resistance index of AC-5 (9.5%) are higher than those of the 8.5% mixture. AC-5 (9.0) had the best bonding strength between aggregates because of sufficient asphalt. Meanwhile, the aggregate structure was not apparently influenced.
The TOPSIS analysis results of the AC-5 mixture are shown in Table 7.
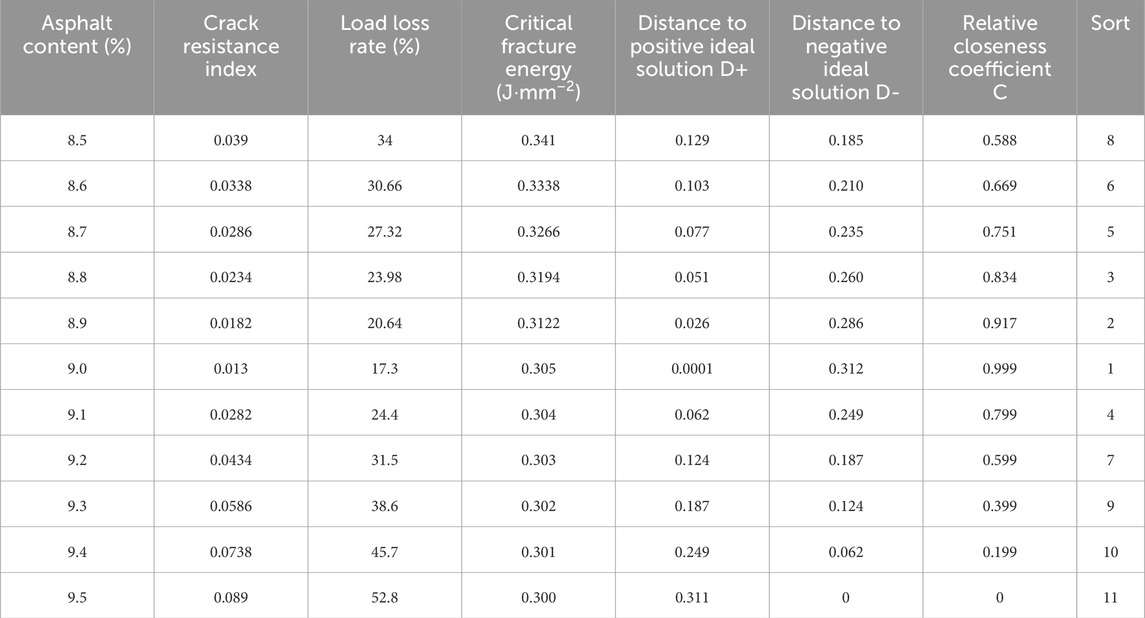
Table 7. TOPSIS results.
The analysis results indicate that the best asphalt content is 9.0%, while the asphalt mixtures between 9.3% and 9.5% are the worst. The top four asphalt contents were sorted, and the optimal asphalt content range was found to be 8.8%–9.1%.
Finally, the freeze–thaw splitting test was applied to verify the moisture resistance. The results are shown in Table 8.
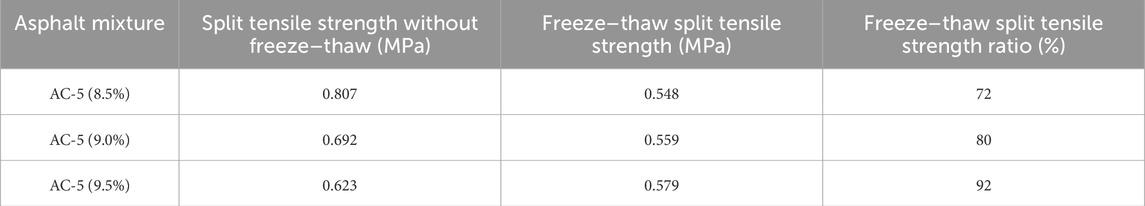
Table 8. The results of the freeze–thaw split tensile strength test.
The split tensile strength without freeze–thaw decreased with increasing asphalt content. The freeze–thaw split tensile strength increased with increasing asphalt content. At 8.5% asphalt content, the mixture had a lower asphalt content, and the interlocking force between the aggregates was the highest. Therefore, the mixture had the highest split tensile strength without freeze–thaw. However, the mixture had insufficient asphalt content, reducing the bonding strength between aggregates. Therefore, the split tensile strength decreased quickly after freeze–thaw. The higher asphalt content prevents water erosion and improves the bonding area between the asphalt and aggregate. Therefore, the moisture performance became better with higher asphalt content.
4.2 Analysis of storage modulus
Many samples were tested, and three mixtures had similar regularity. The typical modulus curves were analyzed to calculate conveniently and observe data more intuitively.
Based on the Formula 4, the storage modulus master curves are shown in Figure 11.
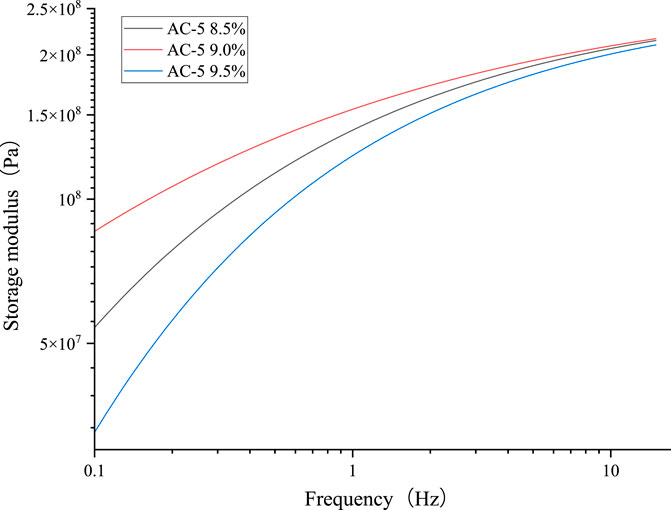
Figure 11. Storage modulus master curves.
Although the storage modulus curves of different asphalt contents had a similar trend, there was a large difference among them. The sort is as follows: AC-5 (9.0%) > AC-5 (8.5%) > AC-5 (9.0%). The storage modulus decreased with increasing frequency. When asphalt mixtures are subjected to repeated dynamic loads, materials with a higher storage modulus can store more elastic energy. After the load is removed, their deformation recovery ability is strong, and the pavement is less likely to develop permanent deformation. The AC-5 (9.0%) had the best deformation recovery ability.
4.3 Loss modulus
The results of AC-5 loss modulus are shown in Figure 12.
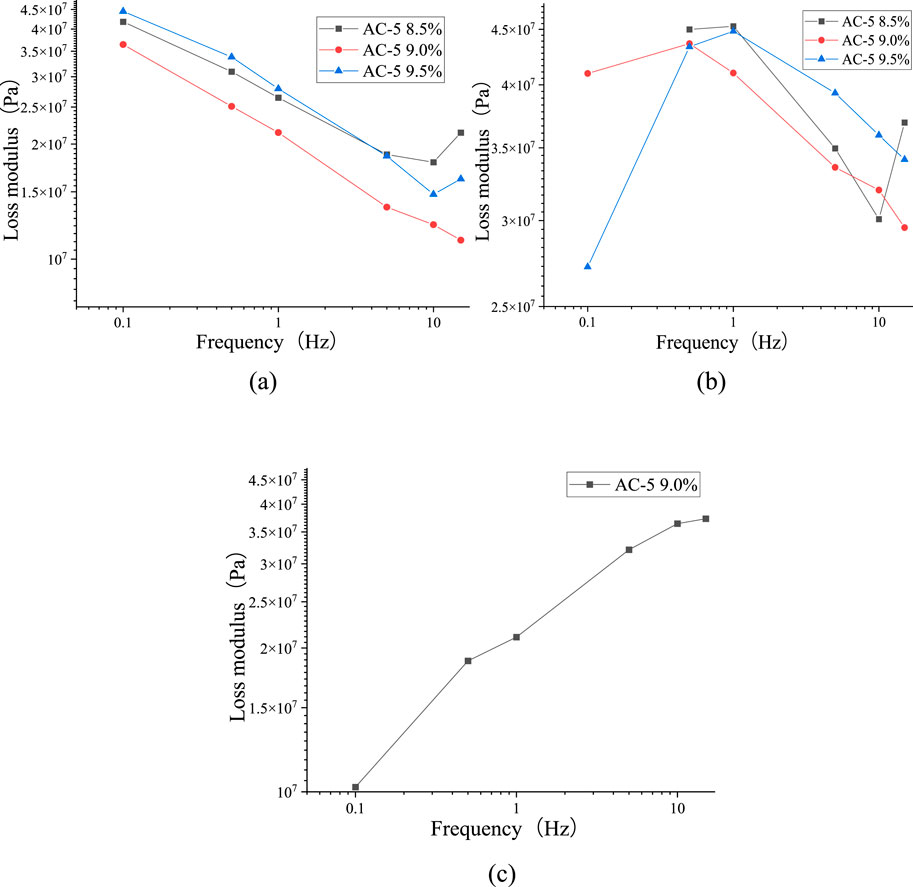
Figure 12. Loss modulus curves. (a) AC-5 mixture at 15 °C. (b) AC-5 mixture at 25 °C. (c) AC-5 mixture at 40 °C.
At 15 °C, the loss modulus of the AC-5 (9.0%) mixture is higher than that of the AC-5 (8.5%) or 9.5%. The loss modulus of the AC-5 (9.0%) mixture decreased with increasing frequency. Meanwhile, the minimum values of the AC-5 (8.5%) and the AC-5 (9.5%) mixtures emerged at 10 Hz. At 25 °C, the curves of AC-5 (9.0%) and AC-5 (9.5%) mixtures had maximum values at 0.5 Hz and 1 Hz, respectively. However, the curve of AC-5 (8.5%) is an “S” type, which had a maximum value at 1 Hz and a minimum value at 10 Hz. At 40 °C, only the AC-5 (9.0%) completed the dynamic modulus test. The loss modulus increased with higher frequency. Loss modulus represents a material’s ability to dissipate energy caused by internal friction under cyclic dynamic loads. Therefore, AC-5 (9.0%) had the best resistance to energy dissipation.
4.4 Phase angle
The phase angle results are shown in Figure 13.
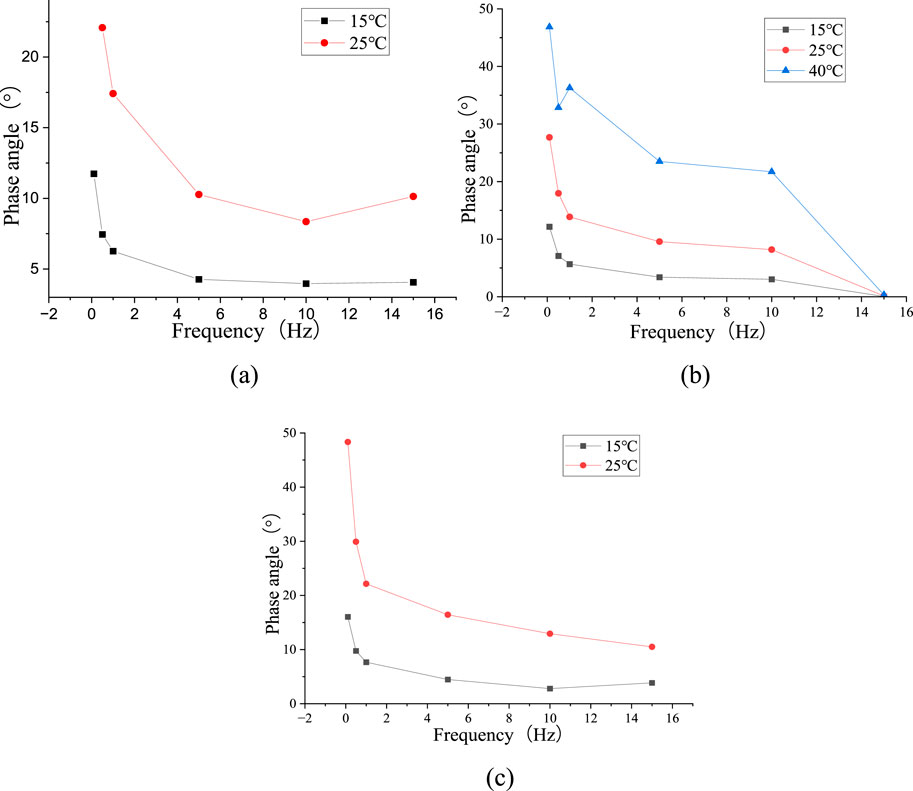
Figure 13. Phase angle curves. (a) AC-5 (8.5%) mixture, (b) AC-5 (9.0%) mixture, and (c) AC-5 (9.5%) mixture.
According to the results, there were minimum values of the 25 °C AC-5 (8.5%) mixture and 15 °C AC-5 (9.5%) mixture curves. The phase angle of the AC-5 (9.0%) mixture at 40 °C decreased first, then increased, and finally decreased with increasing frequency. An inflection point occurs at 0.5 Hz. The phase angle of other mixtures increased with increasing frequency. At 15 °C and 25 °C, the AC-5 mixtures were elastomers. The mixtures at 40 °C were viscoelastic materials, and only the dynamic modulus test of the AC-5 (9.0%) mixture could be performed.
Phase angle represents the time difference between “stress” and “strain.” When the phase is lower, the mixture tends to be “elastic” with a stronger energy storage capacity. Therefore, the AC-5 (9.0%) had better deformation recovery performance and greater resistance to permanent deformation.
4.5 Dynamic modulus test results
The results of the dynamic modulus test are shown in Figure 14.
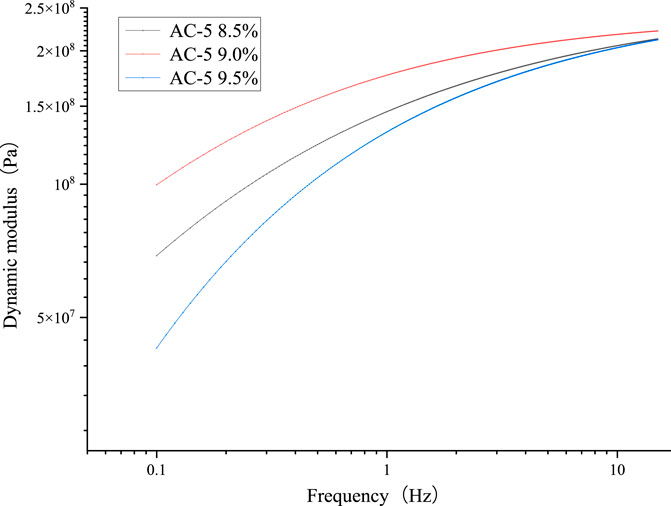
Figure 14. Dynamic modulus curves.
The dynamic modulus reflects the material’s comprehensive ability to resist elastic and viscous deformation. The sort of AC-5 dynamic modulus is AC-5 (9.0%) > AC-5 (8.5%) > AC-5 (9.5%). Therefore, AC-5 (9.0%) had the best mechanical properties. Combined with the OT test results, at 25 °C, the AC-5 (9.0%) mixture possessed the highest dynamic modulus, showing that the mixture possessed the highest ability to resist load deformation. In addition, the mixture possessed the lowest load loss rate and crack resistance index, meaning that the mixture had the best anti-cracking performance. The AC-5 (9.0%) was recommended in the mixture design. The AC-5 (9.5%) mixture possessed the lowest dynamic modulus. Therefore, the mixture had the highest load loss rate and crack resistance index. The critical fracture energy is correlated with peak load. At 8.5% asphalt content, the interlocking structure between aggregates is stronger. Therefore, the mixture possessed the highest peak load and critical fracture energy. With increasing asphalt content, the asphalt lubrication effect between aggregates is enhanced, making aggregate particles slide more readily. Therefore, with increasing asphalt content, the critical fracture energy and dynamic modulus became lower.
4.6 Fatigue test results
According to the results (Figure 15), the AC-5 (8.5%) mixture had the worst anti-fatigue performance, and the specimen broke after 61,406 cycle loads. The fatigue lives of AC-5 (9.0%) and AC-5 (9.5%) are longer than that of the AC-5 (8.5%). The mixtures did not break after 133,383 cycle loads. In addition, AC-5 (9.0%) had lower strain at the same cycle load, meaning the mixture had better anti-fatigue performance. There is insufficient asphalt between aggregates at 8.5% asphalt content, causing insufficient adhesion. A crack developed rapidly and broke at an early stage. At 9.5% content, although the mixture had a longer fatigue life, it had a higher strain. The mixture had the highest asphalt content, and the redundant asphalt made the aggregate slide more easily. The mixture at 9.0% asphalt content had sufficient asphalt to guarantee the mixture was fully bonded.
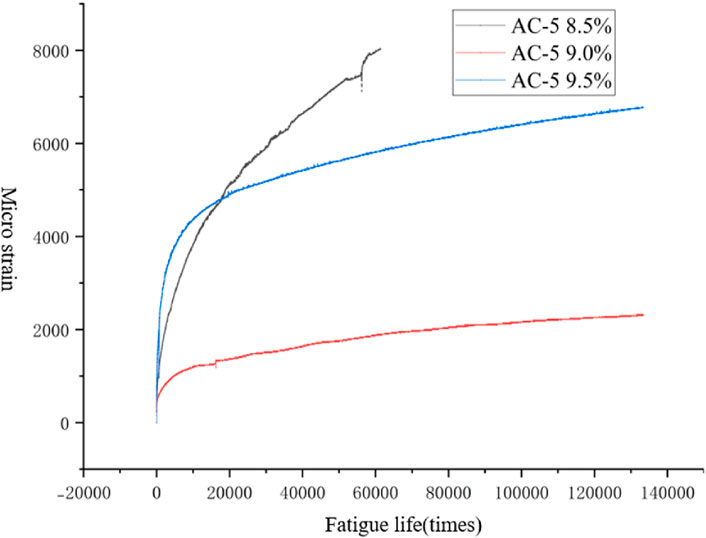
Figure 15. Fatigue curves of the AC-5 mixture.
The final microstrain values of the AC-5 (8.5%), AC-5 (9.0%), and AC-5 (9.5%) mixtures are as follows: 8,040, 2,320, and 6,760. Power exponential function fitting was performed on the fatigue curves:
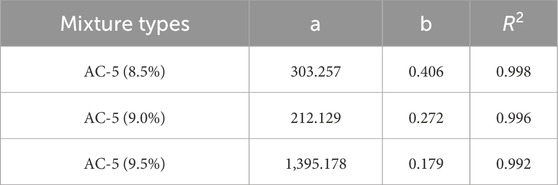
Table 9. Fitting parameters.
According to the results, fatigue life has a high correlation with the power exponential function. The power exponential function could be applied to predict fatigue life. In the low strain condition, the sort of fatigue life is: AC-5 (9.0%) > AC-5 (8.5%) > AC-5 (9.5%). With increasing loading times, the strain curve of the AC-5 (9.5%) mixture gradually slowed, with a rapid decreasing trend. The AC-5 (8.5%) mixture did not slow its decreasing trend and broke at 61,406 loading. Combined with OT test results, AC-5 (9.0%) possessed the lowest load loss rate and crack resistance index, meaning that the mixture had the best anti-fatigue performance.
5 Stress–strain hysteretic curve
5.1 Analysis of hysteretic curves
At alternating stress, the stress–strain curve forms a closed hysteresis loop during cyclic loading and unloading, which is called a hysteretic curve. Internal friction refers to the energy loss in the material during mechanical vibration. Assume that dissipative energy
This article applied another method to calculate the internal friction of stress–strain at cyclic load, as shown in Figure 16. At single periodic loads, the area of the stress–strain hysteretic curve represents the dissipative energy
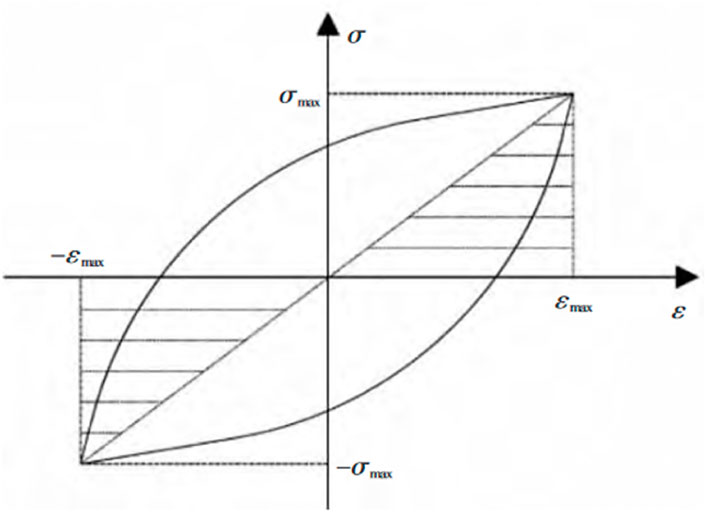
Figure 16. Stress–strain hysteretic curve.
5.2 Hysteretic curves of AC-5 mixtures
The test data of dynamic modulus at 25 °C are shown in Figure 17.
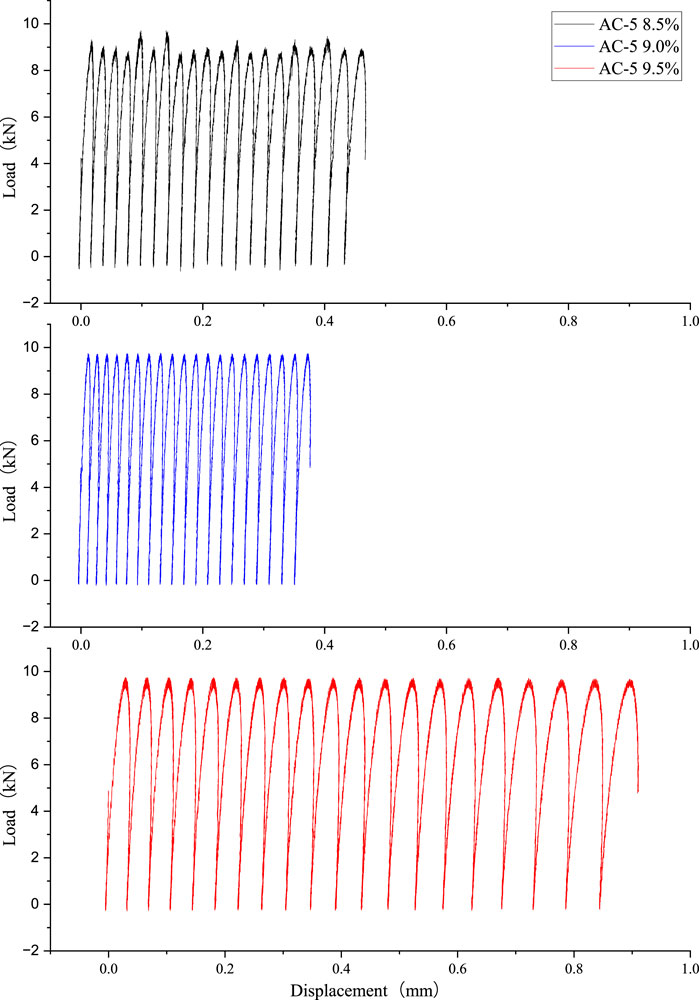
Figure 17. Dynamic modulus data of AC-5.
The hysteretic curves are shown in Figure 18.
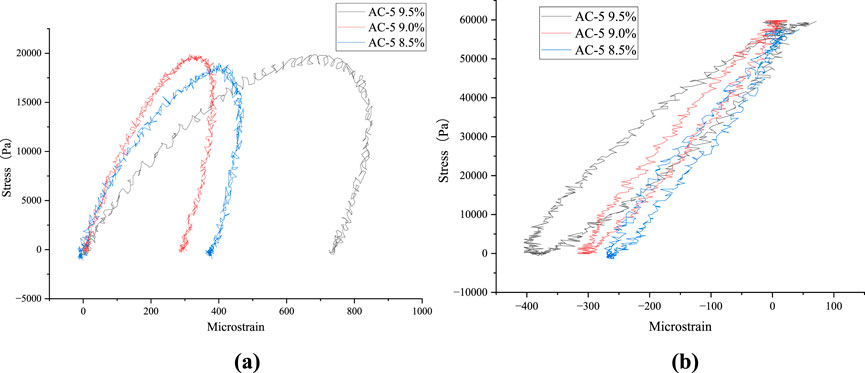
Figure 18. Hysteretic curves of AC-5 mixture. (a) Hysteretic curves at 25 °C and 0.01 MPa and (b) Hysteretic curves at 15 °C and 0.03 MPa.
At 0.01 MPa, there were no complete hysteretic curves, but there were obvious hysteretic curves. With increasing asphalt content, the hysteretic curves tended to be annular. The stored energy
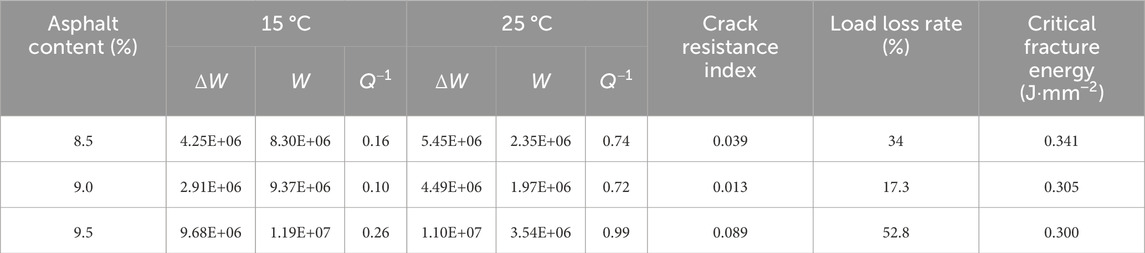
Table 10. Indices of AC-5 hysteretic curves.
A Pearson correlation analysis was conducted between the indices of the hysteretic curve and the OT indices. The results are shown in Figure 19.
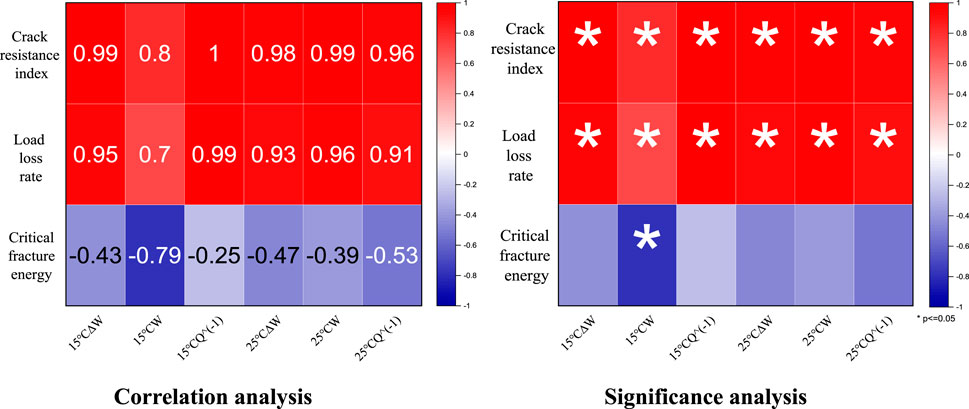
Figure 19. Pearson correlation analysis.
Based on the results, the crack resistance index had the most significant positive correlation with 15 °C
5.3 Hysteretic curves analysis at different stress levels
The AC-5 (9.0%) hysteretic curves of different stresses at 15 °C are drawn in Figure 20.
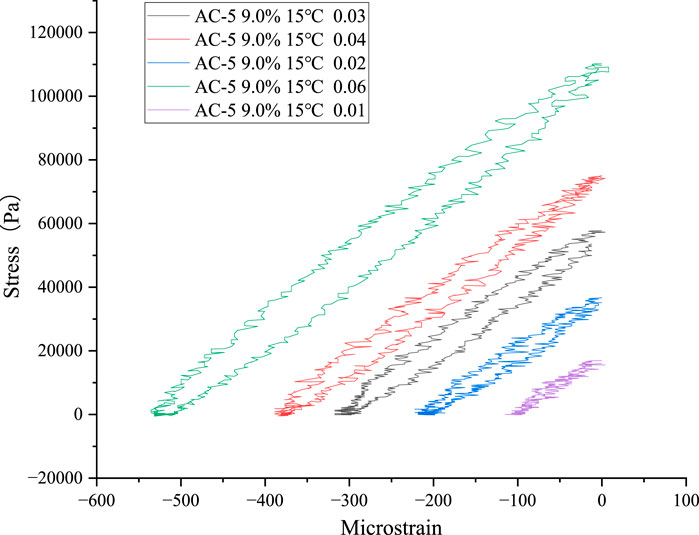
Figure 20. Hysteretic curves at different stress levels.
The indices of hysteretic curves are calculated in Table 11.
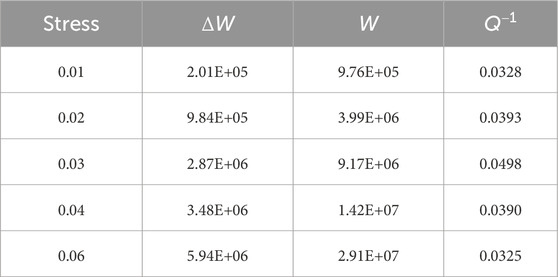
Table 11. Hysteretic curve indices.
The results show that the main curve spindles of different stress were approximately parallel. However, the area of the hysteretic curve became larger with higher stress. At 0.01 MPa, the hysteretic curve was not obvious. The hysteretic curve became more obvious with increasing stress. The
5.4 Hysteretic curve analysis at different temperatures
The hysteretic curves of different temperatures and stresses are drawn in Figure 21, and the indices are calculated in Table 12.
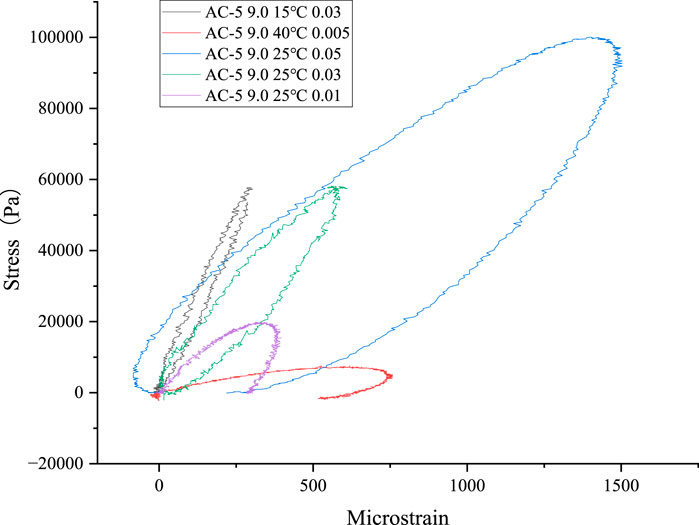
Figure 21. Hysteretic curves at different conditions.
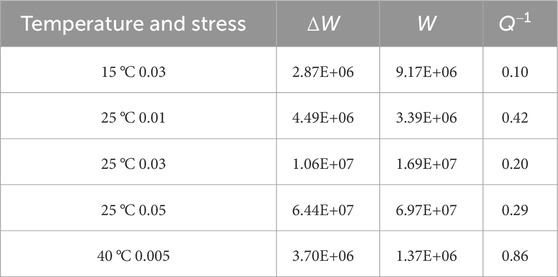
Table 12. Hysteretic curve indices.
At 25 °C and 40 °C, only the strain hysteresis was shown, and the hysteresis curve did not emerge. When the temperature was increased, the
6 Conclusion
Through the balanced mix design and mechanical analysis, the following conclusions are proposed.
1. The article made a balanced mix design for the AC-5 mixture instead of the volumetric design method. The final optimal asphalt content range was determined based on the OT performance results. Through the interpolation method and the TOPSIS analysis of asphalt mixtures, the optimal asphalt content range is 8.8%–9.1%. AC-5 (9.0%) possessed the lowest load loss rate and crack resistance index. The critical fracture energy decreased with a reduction in asphalt content. Higher asphalt prevented water erosion and improved the bonding area between the asphalt and the aggregate.
2. Through the DMA dynamic modulus test and the fatigue test, the AC-5 (9.0%) mixture was found to have the highest storage modulus, the lowest loss modulus, the highest dynamic modulus, and the lowest microstrain, suggesting that the mixture had the best strength, anti-reflection cracking performance, and fatigue performance. In addition, the power exponential function could be applied to predict fatigue life.
3. The hysteresis curves of three AC-5 mixtures were significant at different conditions. The stored energy
Data availability statement
The raw data supporting the conclusions of this article will be made available by the authors, without undue reservation.
Author contributions
NL: Writing – original draft. PH: Writing – review and editing. BP: Conceptualization, Writing – original draft. RH: Methodology, Writing – original draft. JY: Software, Writing – review and editing. YY: Data curation, Writing – review and editing. MZ: Validation, Writing – review and editing.
Funding
The author(s) declare that financial support was received for the research and/or publication of this article. This research is supported by the General Special Scientific Research Plan Project of Shaanxi Provincial Department of Education in 2023(23JK0333), the Fundamental Research Funds for the Central Universities, Chang’an University (Grant No. 300102212517), the Natural Science Foundation of Shaanxi Province of China, grant number 2024JC-YBQN-0429, and the Youth Innovation Team of Shaanxi Universities.
Conflict of interest
The authors declare that the research was conducted in the absence of any commercial or financial relationships that could be construed as a potential conflict of interest.
Generative AI statement
The author(s) declare that no Generative AI was used in the creation of this manuscript.
Any alternative text (alt text) provided alongside figures in this article has been generated by Frontiers with the support of artificial intelligence and reasonable efforts have been made to ensure accuracy, including review by the authors wherever possible. If you identify any issues, please contact us.
Publisher’s note
All claims expressed in this article are solely those of the authors and do not necessarily represent those of their affiliated organizations, or those of the publisher, the editors and the reviewers. Any product that may be evaluated in this article, or claim that may be made by its manufacturer, is not guaranteed or endorsed by the publisher.
References
Chen, H., Saba, R. G., Liu, G., Barbieri, D. M., Zhang, X., and Hoff, I. (2023). Influence of material factors on the determination of dynamic moduli and associated prediction models for different types of asphalt mixtures. Constr. Build. Mater. 365, 130134. doi:10.1016/j.conbuildmat.2022.130134
Li, N., Hao, P., Yao, Y., and Zhang, C. (2023). The implementation of balanced mix design in asphalt materials: a review. Constr. Build. Mater. 402, 132919. doi:10.1016/j.conbuildmat.2023.132919
Lin, B., Wang, Y. D., and Liu, J. (2025). Development of a balanced mix design approach for stone matrix asphalt mixtures. Clean. Mater. 17, 100328. doi:10.1016/j.clema.2025.100328
Masad, E., Branco, V. T. F. C., Little, D. N., and Lytton, R. (2008). A unified method for the analysis of controlled-strain and controlled-stress fatigue testing. Int. J. Pavement Eng. 9 (4), 233–246. doi:10.1080/10298430701551219
Ning, H., Cai, J., Deng, B., Xu, H., Gong, X., Gu, F., et al. (2025). Development of modified balanced mix design method for cold recycled asphalt mixture. Case Stud. Constr. Mater. 22, e04784. doi:10.1016/j.cscm.2025.e04784
Sreedhar, S., Coleri, E., Obaid, I. A., and Kumar, V. (2021). Development of a balanced mix design method in Oregon to improve long-term pavement performance. Transp. Res. Rec. 2675 (12), 1121–1137. doi:10.1177/03611981211032222
Wang, Y., Kang, A.-H., Zhang, Y., Xiao, P., Wu, Z.-G., and Gu, Q.-L. (2025). Study on comprehensive performance evaluation and dynamic modulus model of fiber reinforced asphalt mixture. Constr. Build. Mater. 491, 142694. doi:10.1016/j.conbuildmat.2025.142694
Wu, H., Zhan, Y., Song, W., Xu, S., Chen, X., and Liao, H. (2024). Prediction modelling on dynamic modulus of recycled asphalt mixtures based on meso-mechanical analysis. J. Clean. Prod. 469, 143200. doi:10.1016/j.jclepro.2024.143200
Yousefi, A. A., Haghshenas, H. F., Shane Underwood, B., Harvey, J., and Blankenship, P. (2023). Performance of warm asphalt mixtures containing reclaimed asphalt pavement, an anti-stripping agent, and recycling agents: a study using a balanced mix design approach. Constr. Build. Mater. 363, 129633. doi:10.1016/j.conbuildmat.2022.129633
Zhou, F., Hu, S., Chen, D. H., and Scullion, T. (2007). Overlay tester: simple performance test for fatigue cracking. Transp. Res. Rec. J. Transp. Res. Board 2001 (1), 1–8. doi:10.3141/2001-01
Zhou, F., Scullion, T., Walubita, L., and Wilson, B. (2014). Implementation of a performance-based mix design system in Texas. Transp. Res. Circular.
Keywords: balanced mix design, AC-5 mixture, overlay test, mechanical analysis, hysteretic curve
Citation: Li N, Hao P, Peng B, Huang R, Yang J, Yao Y and Zhang M (2025) Balanced mix design and mechanical analysis of an AC-5 mixture. Front. Built Environ. 11:1675597. doi: 10.3389/fbuil.2025.1675597
Received: 29 July 2025; Accepted: 22 September 2025;
Published: 17 October 2025.
Edited by:
Chongzheng Zhu, Xiangtan University, ChinaReviewed by:
Roberto Alonso González-Lezcano, CEU San Pablo University, SpainShiyu Zhu, Anhui Jianzhu University, China
Copyright © 2025 Li, Hao, Peng, Huang, Yang, Yao and Zhang. This is an open-access article distributed under the terms of the Creative Commons Attribution License (CC BY). The use, distribution or reproduction in other forums is permitted, provided the original author(s) and the copyright owner(s) are credited and that the original publication in this journal is cited, in accordance with accepted academic practice. No use, distribution or reproduction is permitted which does not comply with these terms.
*Correspondence: Peiwen Hao, NDAzMDQ2MjZAcXEuY29t