 Vamsi Sai Kalasapudi
 Krishna Pranay Angara
 Charles Tofferi
 Naga Sai Aditya Varanasi
- 1Department of Construction Management, University of North Florida, Jacksonville, FL, United States
- 2SSS Soft Solutions, Orlando, FL, United States
- 3Petticoat-Schmitt Civil Contractors, Jacksonville, FL, United States
- 4Cognizant Technology Solutions, Jacksonville, FL, United States
Digital timecards are widely used in construction to track labor hours, equipment usage, and productivity, yet they are prone to outliers caused by human error, inconsistent reporting, and interface complexity. These anomalies degrade data reliability, obstruct cost estimation, and limit the strategic use of historical performance records. Traditional outlier detection meth-ods, such as Z-score filtering and standard Isolation Forest, apply global thresholds that often fail to capture the heterogeneous and context-specific nature of construction data. This paper introduces a context-aware optimization approach that dynamically tunes Isolation Forest contamination thresholds by learning from estimating practices. Validation results demonstrate that, compared to Z-score filtering and standard Isolation Forest, the proposed method pro-duces tighter clustering of standard deviations across cost codes, eliminates extreme variance spikes, and better aligns actual productivity distributions with estimator expectations. The model effectively filters unreliable entries while preserving meaningful high-cost cases, thereby improving both interpretability and reliability of historical data. To support scalable use of these refined datasets, the authors developed a production-grade agentic AI workflow integrating es-timating and field management software with Google’s Firebase and an OpenAI GPT-based assistant via OpenAPI specifications. This system allows estimating and project management teams to query their data conversationally, retrieving real-time productivity benchmarks, unit costs, and historical trends across jobs and cost codes. While the model currently functions as a post-correction mechanism rather than preventing errors at the source, it provides a scalable, automated alternative to spreadsheet-based workflows, enabling improved bidding, project planning, and business intelligence.
1 Introduction
Many U.S. builders now use cloud-based software to estimate jobs, bid work, and track progress in real time (Sayed et al., 2023; Acuity International, 2025). These systems store current prices for materials, crew wages, and equipment, allowing estimators to develop reusable cost databases for future projects while giving site teams live insight into daily spending. These days, the same software suites include onsite datalogging tools that let crews record labor hours, equipment use, and completed work via digital timecards, replacing traditional timesheets and punch cards and feeding managers live dashboards of labor productivity and labor/equipment costs (Bonney et al., 2024; Ahmed and Omar, 2021; HCSS, 2018). The cloud sync happens instantly, eliminating the delays of paper reporting and letting estimators, superintendents, and project managers compare today’s numbers with the original estimate and catch problems fast (Spivac, 2025; Hedley, 2014). For example, HCSS Heavyjob, a popular construction management platform for civil contractors, lets crews clock in on a phone or laptop and displays live dashboards of labor and equipment productivity (HCSS, 2018). Digital timecards filled out by site foremen or crew leaders are now central to cost tracking, payroll processing, and productivity analysis (Poage, 2024). Crews tag every hour to the correct job code (the overall project) and cost code (the specific work component) and record that day’s quantities, letting managers view labor productivity, labor hours per unit of work daily and keep budgets on track (HCSS, 2024). Over time, the company builds a rich history of actual costs versus estimates, which they revisit to refine productivity rates and unit cost assumptions for new bids (Hedley, 2014). This feedback loop only works when timecards are accurate and coded correctly, making consistent practice of maintaining a rich cost database essential. Accurate digital records become a source of business intelligence, feeding benchmarks for crew performance and equipment use that sharpen bids in the competitive U.S. market (Hedley, 2014).
Despite these advantages, field-generated timecard data still suffers from pervasive inconsistencies and outliers (hh2 Construction Connected, 2025). Simple human mistakes, such as foremen mistyping hours or selecting the wrong job or cost code while rushing at day’s end remain one of the most common causes of payroll disputes and cost code misallocations (hh2 Construction Connected, 2025; Pravdin, 2023). Connectivity gaps compound the problem: on remote sites with weak signal, crews often jot hours on paper and bulk-upload them later, a practice that invites duplicate or missing entries and leaves some records stranded offline (Pravdin, 2023). Interface complexity and language barriers further degrade accuracy. Many U.S. craft workers are nonnative English speakers, and when an app demands too many clicks or presents long, unclear picklists, they default to generic codes or skip quantity fields altogether (Pravdin, 2023). Long-standing time-theft behaviors such as buddy punching persist as well. Surveys show nearly half of field employees admit to padding their hours at least occasionally, and digital systems are only as secure as the GPS locks, biometrics, or photo checks that a contractor is willing to enforce (hh2 Construction Connected, 2025). Collectively, these factors inject extreme labor hours, duplicate quantities, and inflated equipment time into the dataset, distorting day-to-day cost tracking and, over the long term, eroding the historical record that estimators rely on to refine productivity rates and unit cost assumptions for future bids.
To further examine the impact of inconsistent timecard data on estimating and project controls, the authors of this paper analyzed historical records from a proprietary construction management and estimating software suite used by a civil contractor based in Northeast Florida. This firm maintains a comprehensive internal cost database and mandates the use of digital timecards to collect daily labor and equipment usage data from field crews.
Figures 1a,b present a historical comparison of labor hours estimated by the company’s office-based estimators and the actual labor hours recorded on-site for two representative activities: installation of sanitary sewer manholes (measured in labor hours per each unit installed) and site cut/haul operations (measured in labor hours per cubic yard). These records span more than 6 years of completed projects and provide a focused view into labor productivity across repeated instances of common civil construction tasks. Even after filtering clearly erroneous entries such as zero values or extreme outliers likely introduced by manual entry errors, the actual timecard data exhibit considerable variability. In both activities, the distribution of actual labor hours is right-skewed and displays higher mean values compared to the estimated hours. This discrepancy is visualized in the KDE curves, which reveal clear distributional shifts, multimodal tendencies, and heavy tails. In particular, the site cut/haul activity displays scattered actual labor values, indicating challenges in field-level reporting and the inherently variable nature of excavation-related tasks. These findings underscore the limitations of using raw timecard data for decision-making. Inconsistent entry behavior, delayed reporting, and lack of contextual awareness during data capture diminish the reliability of productivity metrics. As a result, project managers struggle to use this information for real-time cost control, and estimators find it difficult to adjust productivity rates based on historical performance (hh2 Construction Connected, 2025; Pravdin, 2023).
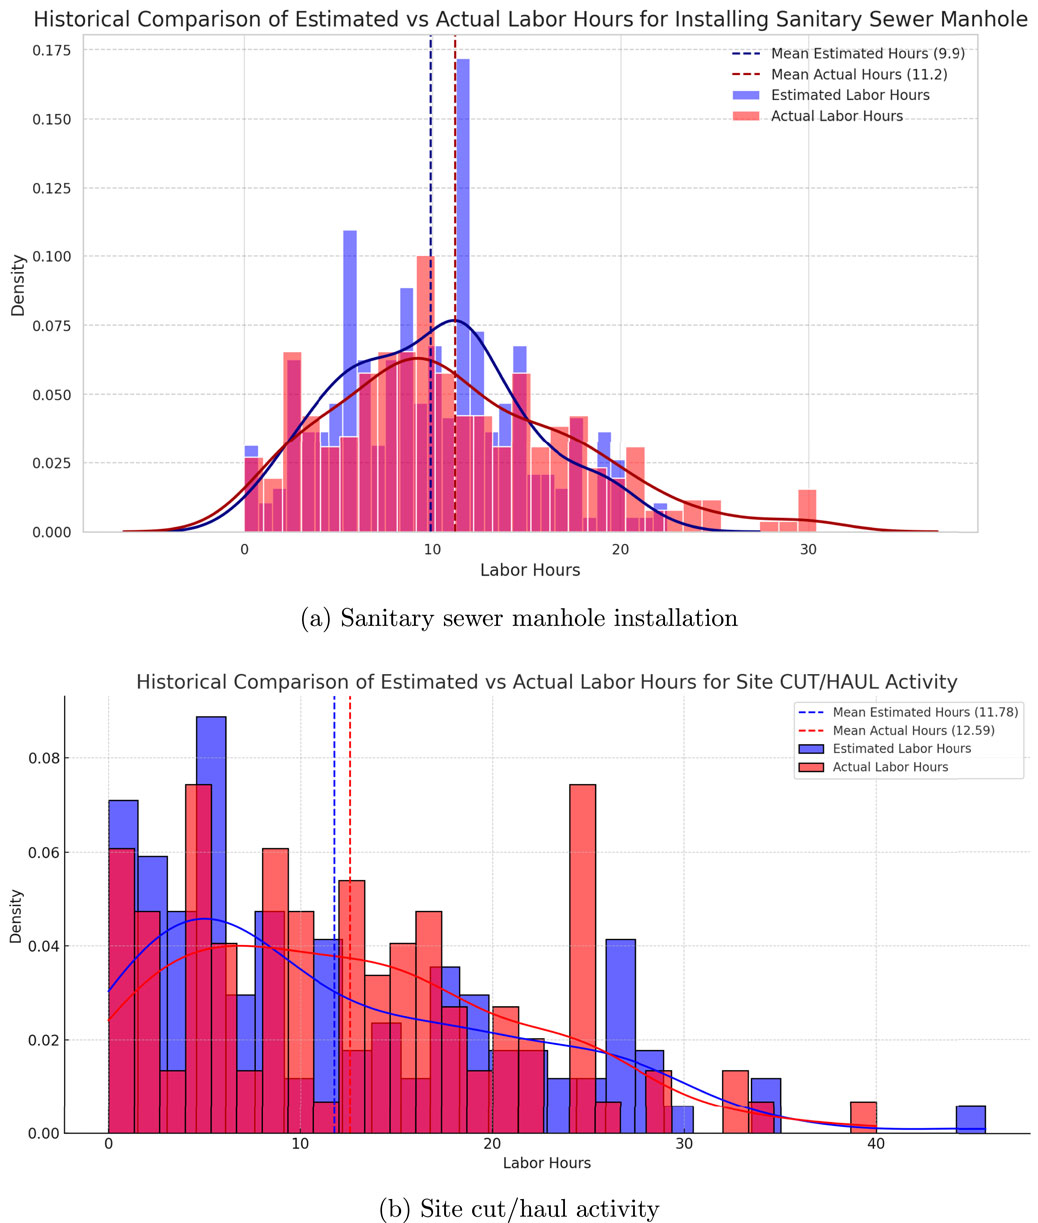
Figure 1. Comparison of estimated vs actual labor hours from digital timecards for (a) sanitary sewer manhole installation and (b) site cut/haul activity.
While traditional outlier detection methods (e.g., z-score filtering, IQR thresholds) may help reduce noise, they operate in a context-agnostic manner and risk discarding high-cost but meaningful data points (Ahmad, 2019; Liang and Parthasarathy, 2016; Geeks for Geeks, 2023). In contrast, the approach proposed in this paper employs a dynamic, context-aware contamination optimization loop, which iteratively calibrates outlier detection thresholds based on the interplay between estimated and actual labor hour distributions. This ensures that legitimate, high-variance cases are retained for their informational value, while distortive anomalies are filtered out. Such an adaptive method enhances the usability of timecard data, supporting both short-term project execution and long-term business intelligence. After the outliers have been systematically identified and removed using the proposed context-aware dynamic optimization framework, the cleaned datasets become significantly more interpretable and reliable for analysis. However, despite this improvement, the visualizations in Figures 1a,b reveal that these datasets remain large and complex, often requiring project team members to invest substantial time and effort to extract meaningful insights. This situation leads to a common challenge in the construction industry: information overload. Prior studies have reported that construction professionals frequently experience cognitive fatigue from the overwhelming volume of information they must process, from interpreting labor and cost data to performing calculations for average productivity, unit costs, or crew efficiency (Tang et al., 2008; Wallin, 2023; Okoh et al., 2024). These manual efforts, often carried out in spreadsheets, demand not only technical skill but also time commitments that project teams may not be able to sustain in fast-paced field environments.
To address this problem, the authors of this paper developed an agentic AI workflow that enables project teams to interact with their cleaned datasets using natural language. Rather than relying on static dashboards or manual spreadsheet operations, this conversational interface allows users to query their data for insights such as mean labor productivity by cost code, equipment usage, and cost trends for a particular job. It can also help identify year-over-year cost fluctuations and the impacts of high-risk periods such as hurricanes, inflation spikes, or supply chain disruptions on work hours. This generative AI-driven, agentic tool supports real-time, interactive data exploration and visualization. It transforms passive historical records into actionable business intelligence, enabling users to automatically generate summary statistics, visual plots, and context-aware insights that inform both operational decisions and long-term strategic planning. The solution is scalable, integrates directly with digital timecard and estimating software, and reduces the need for manual interpretation, thereby reducing the burden of information overload and supporting informed decision-making. It is important to recognize that many timecard errors originate directly at the job site, and preventing such errors at their source is a more sustainable long-term solution than removing anomalies after they have already entered the dataset. Modern construction management platforms now offer in-built checks and safeguards to reduce data-entry mistakes in real time. However, large amounts of historical data accumulated over years of software use, including older entries recorded before these safeguards were available still remain noisy and underutilized. This paper therefore focuses on how to unlock the value of these existing historical datasets by applying context-aware outlier detection and agentic AI workflows. By refining and repurposing legacy data, the developed approach transforms passive records into actionable business intelligence. It reduces human effort in combing through large spreadsheets or datasheets and enables project teams to derive consistent insights from their past performance. For this study, the system was validated using one Northeast Florida contractor’s dataset spanning the last 8 years, consisting of over 100,000 records (more than half a million individual data points across 12 fields). The agentic AI was tested to conversationally retrieve cleaned historical cost data, directly supporting bidding and estimating workflows. The authors anticipate that the demonstrated success of these preliminary tests will, together with this publication, encourage additional industry collaborators to adopt and test the system across diverse project types and regions, thereby evaluating its generalizability at a larger scale.
Combining the two core challenges faced by the construction industry: information overload caused by noisy and inconsistent field data, and the manual burden of interpreting that data for meaningful project insights, the key contributions of this research include:
1. Dynamic Contamination Optimization for Outlier Removal: This research introduces a novel outlier detection methodology using the Isolation Forest algorithm enhanced by a dynamic contamination loop (Liu et al., 2008). The approach is context-aware, leveraging the relationship between estimated and actual labor hours to iteratively adjust thresholds.
2. Agentic Generative AI Workflow for Construction Analytics: The paper presents a scalable, automated, and conversational AI solution that integrates estimating platforms, digital timecard systems, and generative AI models. This replaces spreadsheet-based analysis with accessible, AI-driven business intelligence.
2 Development of agentic AI workflow
To achieve a production-grade agentic AI workflow, the authors of this paper developed an integrated system that connects the contractor’s internal estimating and construction management software with Google’s Firebase and OpenAI’s ChatGPT via APIs (Google, 2024; OpenAI, 2024). This architecture is fully automated and requires no manual intervention once deployed. The system is designed to continuously retrieve, clean, process, and analyze cost and productivity data, enabling both real-time project support and long-term business intelligence. Figure 2 presents a detailed flowchart illustrating the full lifecycle of the system from raw data ingestion to AI-driven insights. The flowchart includes core computational steps such as data preprocessing, metric computation, dynamic outlier removal, and data export, with each functional domain color-coded: green for internal software components, orange for Firebase operations, and blue for the GPT interface. This section outlines the technical methodology underlying this workflow, describing how each component contributes to enabling real-time project cost optimization and high-quality decision-making for both estimators and project managers. The following subsections detail each stage of the system, starting from data ingestion and preprocessing to context-aware generative AI-based user interaction.
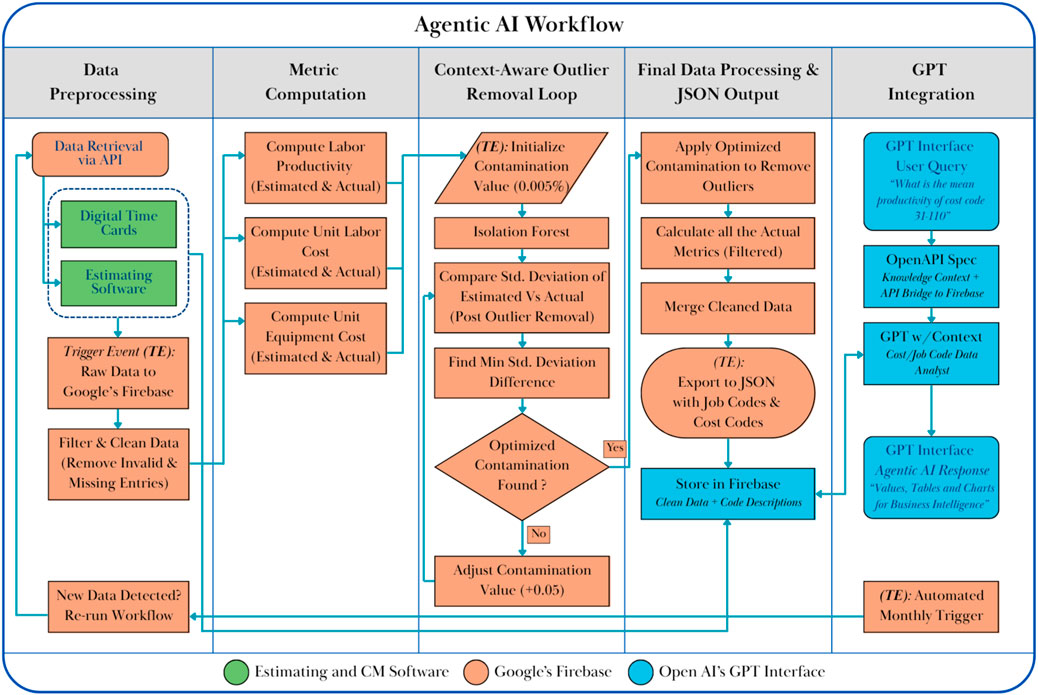
Figure 2. Agentic AI workflow integrating construction data ingestion, context-aware outlier filtering using Isolation Forest, and natural language interaction via GPT through OpenAPI.
2.1 Data ingestion, filtration, and metric computation in the agentic AI workflow
As the first step in the agentic AI architecture, a fully automated data retrieval pipeline was established to extract relevant information directly from the contractor’s integrated estimating and construction management software suite. This extraction is managed via a custom-built Data Retrieval API, which serves as the central point of connection between the software ecosystem and Google’s Firebase cloud database. The retrieved raw data includes detailed cost and productivity records from both pre-construction estimates and field-generated digital timecards. Each record contains fields such as:
Once the API pulls this data, it triggers a real-time upload into Firebase, which initiates the preprocessing stage. This event serves as a trigger for a custom algorithm hosted within the Firebase environment. The algorithm begins by executing a filtration and validation process designed to clean the dataset before analysis. The preprocessing pipeline begins by eliminating invalid or incomplete records that would compromise downstream calculations. The system removes:
This ensures that only analytically viable data enters the agentic workflow. Once the raw dataset is cleansed, the hosted algorithm computes a set of baseline metrics for each valid record. These include:
These calculations are performed across all available data points, regardless of whether a point is eventually flagged as an outlier. Following this computation, a secondary trigger initiates the context-aware outlier detection process, which iteratively cleans the dataset using estimated values as a reference and preserves meaningful high-cost cases.
2.2 Context-aware outlier detection via adaptive isolation forest
To eliminate unreliable records while preserving domain-significant variations, the authors developed a context-aware outlier removal process. This approach avoids static, context-agnostic techniques (e.g., z-score, IQR), which risk discarding high-cost data that may be informative for estimators and project managers. Our method is grounded in the Isolation Forest (IF) algorithm, a robust ensemble-based model that isolates anomalies by recursively partitioning the data. Crucially, IF requires a contamination parameter
Step 1: Label Assignment via Isolation Forest For each tuple
Step 2: Contamination Tuning via Agentic Self-Calibration The goal is to tune
We define the optimization objective as:
This equation captures our assumption that well-aligned actual and estimated data should exhibit similar variance when no extreme anomalies skew the actual distribution.
Step 3: Adaptive Loop for Optimal
1. Search Grid: Define a grid of contamination values
2. For each
3. Loss Aggregation: Sum these deviations across all
4. Select
This loop enables agentic self-calibration by contextually adapting to the data distribution, preserving high-cost, meaningful signals while effectively removing statistical noise.
2.2.1 Rationale and impact
This dynamic contamination detection process aligns statistical filtering with domain knowledge. It leverages the intuition that estimators do not significantly deviate from operational performance in normal scenarios. High deviation between estimated and actual values typically signals data entry errors or exogenous disruptions, precisely the types of records this loop identifies and removes. Once
2.3 Agentic GPT integration
The final component of the agentic AI workflow developed in this research is the integration of a domain-specific GPT interface that enables users to interact with cleaned construction cost and productivity data through natural language. This component transforms static historical records into an interactive business intelligence system designed for project teams. Once the context-aware outlier detection algorithm completes its run and exports the cleaned metrics as a JSON object including job code, cost code, labor productivity, and unit labor and equipment costs, the authors of this paper directed Google’s Firebase to store the processed dataset. At this stage, the Firebase system also retrieves corresponding job and cost code descriptions from the Data Retrieval API, ensuring that the stored data is both human-readable and contextually complete.
To operationalize this enriched dataset, the authors developed a custom GPT using OpenAI’s ChatGPT platform. The developed GPT, titled the Cost Code Data Analyst, was designed with a structured knowledge context so that it could act like a specialized internal analyst. For the version developed within the scope of this paper, the authors directly utilized GPT via API calls, providing constrained instructions on when to access Firebase, how to retrieve the cleaned dataset, and how to present results to the user. This configuration functions as a semi-tailored assistant: it does not have access to the internet or any external knowledge base beyond Google Firebase, and it is limited to natural language interaction with coding and math capabilities to interpret cost data and generate figures for users. The developed GPT context included explicit behavioral and usage rules: the GPT accessed only structured data retrieved via the API and stored in Firebase; it defaulted to actual productivity and cost values unless otherwise specified; it clearly communicated limitations when answers were not found; it rounded numerical responses appropriately and labeled them with precise units (e.g., units per labor hour, dollars per unit); and it avoided unsupported computations, ensuring reliable and interpretable results. This design made the GPT highly reliable in retrieving data and directly interpreting it for the user. To validate this reliability, the authors manually cross-checked GPT outputs against the corresponding JSON records stored in Firebase, confirming that the retrieval and interpretation processes consistently returned accurate results. Importantly, the developed GPT does not generate or extrapolate values beyond what is present in the Firebase storage; instead, it is constrained by the OpenAPI 3.1 specification to return only verified data retrieved from the contractor’s database, ensuring reliability and eliminating the risk of unsupported interpretations.
The GPT was connected to the Firebase backend using an OpenAPI 3.1 specification, which the authors of this paper implemented to define the schema for interacting with Firebase endpoints. This allowed the GPT to autonomously query the backend. For example, when a user asked, “What is the average productivity for hauling dirt?” the GPT, guided by the OpenAPI specification, first identified the relevant cost codes using the estimating software’s descriptions, then queried the Firebase database for those codes and their associated units, and finally returned the requested statistics (e.g., mean, median, or mode) in a user-friendly response.
Through this design, the authors established an agentic control loop in which the GPT autonomously interprets ambiguous user queries, identifies the relevant cost and job codes, retrieves the appropriate data, and delivers accurate and context-aware responses. The developed GPT was also programmed to guide users in refining vague queries, creating a conversational workflow that minimizes the need for manual spreadsheet analysis. To ensure that users always interact with the most recent data, the authors incorporated a monthly automated refresh trigger within Firebase. This task re-executes the entire workflow from data extraction and filtration through outlier detection and metric computation, updating the API and the GPT with the most current dataset. Contractors may also adjust the refresh frequency to daily, weekly, or quarterly, depending on operational needs.
By developing this system, the authors of this paper transformed the GPT from a generic chatbot into a domain-specific business intelligence assistant. The GPT provides scalable, reliable, and real-time access to essential project metrics, supporting both short-term project controls and long-term strategic planning. By embedding domain-specific knowledge, reducing barriers to insight extraction, and enabling conversational interaction with construction data, the developed agentic AI workflow provides a significant advancement in the use of generative AI for construction productivity and cost analysis.
3 Results: evaluating results of context aware outlier removal for estimating and field operations
This section presents the results of the developed context-aware outlier detection algorithm powered by Isolation Forest with dynamic contamination optimization. The goal of the model is to support estimating and construction management (CM) operations by improving the reliability and usability of historical data. To evaluate its performance, the authors analyzed a representative subset of high-volume cost codes, covering a wide range of activities and units commonly used in construction estimation and field reporting. Figure 3 presents two KDE plots showing the distributions of mean values for Labor Productivity (Figure 3a) and Unit Labor Cost (Figure 3b).
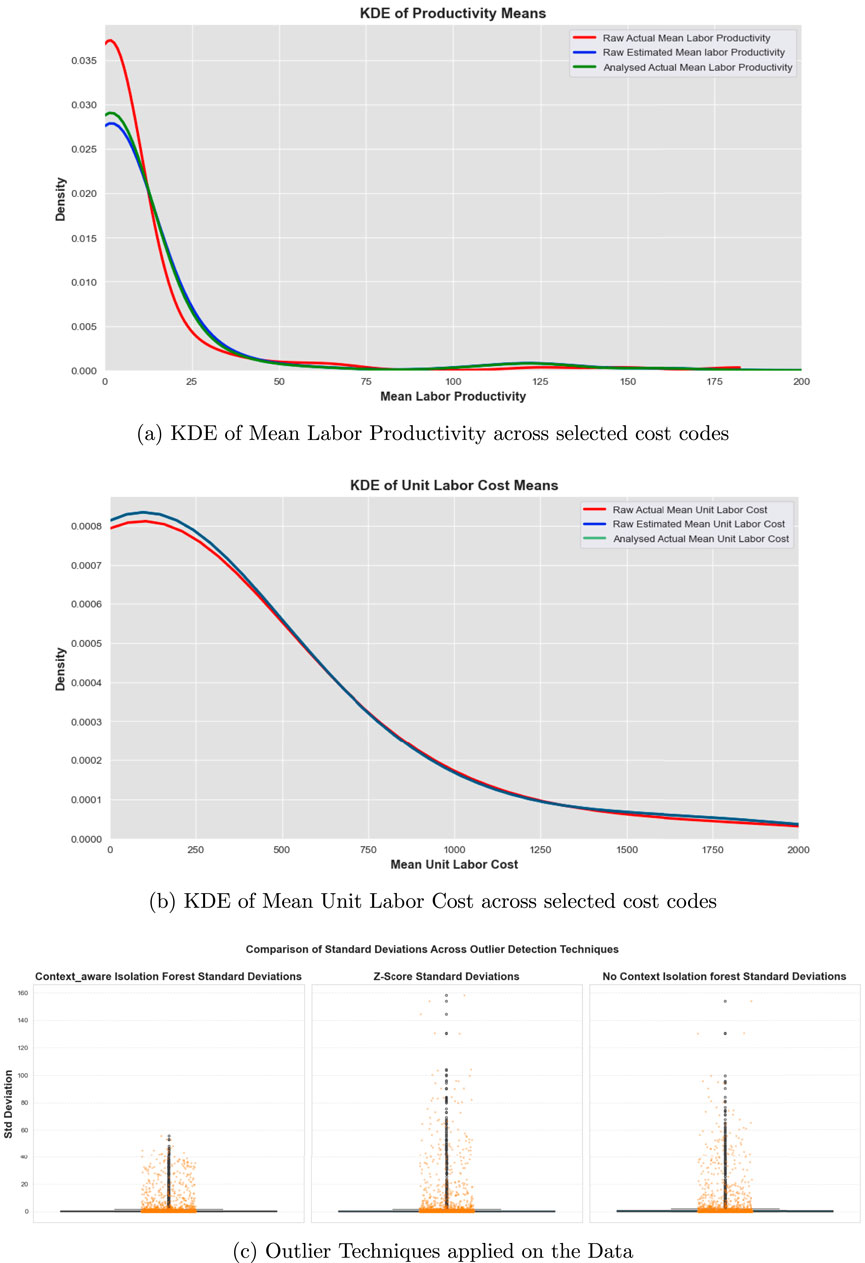
Figure 3. KDE plots showing improved alignment of actuals with estimates after outlier removal for (a) labor productivity and (b) unit labor cost (c) Box Plot Showing Differences of STD in Outlier Detection Techniques.
Each plot compares three distributions:
In both the figures, the green curves (post-outlier removal) consistently shift toward and more closely align with the blue curves, which represent the estimator’s intended performance expectations. Meanwhile, the red curves show significant skewness and long tails, indicating the presence of statistical noise and extreme anomalies in the raw actual data. These visual patterns highlight the effectiveness of the proposed algorithm in filtering unreliable entries without discarding valuable high-cost or high-productivity signals. The cleaned distributions retain variability necessary for field-based risk assessment while suppressing noise that could bias planning decisions.
From a technical standpoint, the system begins with a low contamination value in Isolation Forest and iteratively increases it until the standard deviation of the cleaned actual data best aligns with the spread of the estimated data for each group (e.g., by job code or cost code). This iterative search identifies the optimal contamination value
While the KDE distributions illustrate alignment between cleaned and estimated data, it is also important to benchmark the proposed context-aware Isolation Forest (CA-IF) against conventional outlier detection methods. Figure 3c compares the standard deviations of productivity values across cost codes after applying three approaches: CA-IF, Z-score filtering, and a standard Isolation Forest without contextual tuning. The Z-score method (middle panel) applies a global threshold that assumes normally distributed data across all cost codes. As shown, this approach produces high variability in the resulting standard deviations, with several cost codes exhibiting extreme spikes above 150, reflecting over- or under-filtering. The standard Isolation Forest (right panel) performs moderately better but still lacks contextual sensitivity, leading to inconsistent stabilization and residual variance spikes. In contrast, the CA-IF (left panel) achieves a much tighter clustering of standard deviations and effectively eliminates extreme anomalies while aligning post-filter variability with historical expectations for each cost code. This validates the adaptive contamination tuning mechanism, which iteratively calibrates the anomaly detection threshold until the filtered data’s variability matches the distribution of the estimator’s expected values. These results confirm that CA-IF provides more stable, interpretable, and domain-relevant filtering compared to baseline methods. By dynamically adapting thresholds to cost code and unit-level context, the model not only reduces noise but also preserves meaningful high-cost signals essential for estimating and construction management workflows.
To further evaluate the internal organization and structure of the cleaned dataset, the authors projected the multi-dimensional records comprising labor productivity, unit labor cost, and unit equipment cost onto a two-dimensional principal component space using PCA (Yang et al., 2004). Within this reduced space, three unsupervised clustering quality metrics were computed to assess whether the outlier removal process led to clearer, more usable data groupings. The Silhouette Score was measured at 0.733, indicating strong cohesion within clusters and distinct separation between them. The Davies-Bouldin Index was calculated as 0.458, suggesting low inter-cluster overlap and high compactness. Additionally, the Calinski-Harabasz Score reached 1249.99, reflecting a favorable ratio between inter-cluster dispersion and intra-cluster variance. Together, these scores confirm that the signal-to-noise ratio was substantially improved by the adaptive Isolation Forest algorithm, resulting in a well-structured and interpretable feature space. This structure is critical not just for backend modeling but for enabling intuitive, production-grade analytics. The cleaned dataset now supports efficient clustering, reliable machine learning modeling, and pattern recognition tasks. More importantly, it serves as a robust foundation for enabling GPT-4 to deliver intelligent, context-aware interactions with business users. Through natural language queries, estimating and project management teams can retrieve accurate metrics, compare job performance trends, generate visualizations, and explore their historical data without touching spreadsheets or writing code. By tightly integrating statistical modeling, dynamic anomaly filtering, and generative AI interfaces, the authors’ architecture transforms noisy field records into a continuously improving knowledge system. This pipeline not only supports proactive operational decision-making but also lays the groundwork for scalable, intelligent forecasting and long-term business process optimization.
4 Discussion: enabling business intelligence with agentic AI
A key contribution of this research is the development of an agentic AI architecture that enables project teams to interact with their cleaned historical data through natural language conversations. This integration transforms traditional, spreadsheet-based analytics into a scalable, automated decision-support system for both real-time project management and long-term business intelligence. Using this system, users can retrieve essential metrics such as the mean, median, and mode for labor productivity (measured in units completed per labor hour), as well as unit labor and equipment costs (measured in dollars per unit). The mean provides an up-to-date average that allows teams to compare actual performance against original estimates, supporting more accurate forecasting for future bids. The median serves as a robust central tendency for guiding current field operations, especially when encouraging crews to maintain consistent productivity. The mode, meanwhile, allows for rapid detection of the most frequently observed behaviors, helping teams identify recurring performance trends and evaluate the reliability of their estimating assumptions.
To further enhance analytical precision, the collaborating contractor implemented a 5-digit job coding convention where the first two digits represent the year and the last three digits correspond to the sequential job number (e.g., job code 24112 indicates the 112nd job performed in the year 2024). This system was integrated into the AI pipeline, allowing users to isolate and compare cost and productivity metrics by specific job, project year, or environmental context (e.g., periods impacted by extreme weather events). This level of granularity enables estimators and project managers to draw insights not just from company-wide averages, but also from specific, relevant project conditions.
Figure 4 illustrates how this agentic AI system interacts with users to deliver actionable intelligence. In Figure 4a, a user asks a simple question about hauling productivity. The GPT model linked to the API via OpenAPI specifications first identifies the relevant cost code by interpreting the user’s intent and referencing the estimating software’s cost code descriptions. It then retrieves the corresponding mean productivity from Firebase and responds with the correct value and unit (e.g., CY/hr). In Figure 4b, the user requests a trend analysis of labor costs across three comparable jobs. The GPT agent again leverages the API to identify the appropriate job codes, fetches the mean labor cost for each, determines the most effective chart format, and generates a visual plot in real-time. This dynamic, visual feedback empowers estimators to recognize trends and anomalies without needing to manually sort, filter, or analyze raw data.
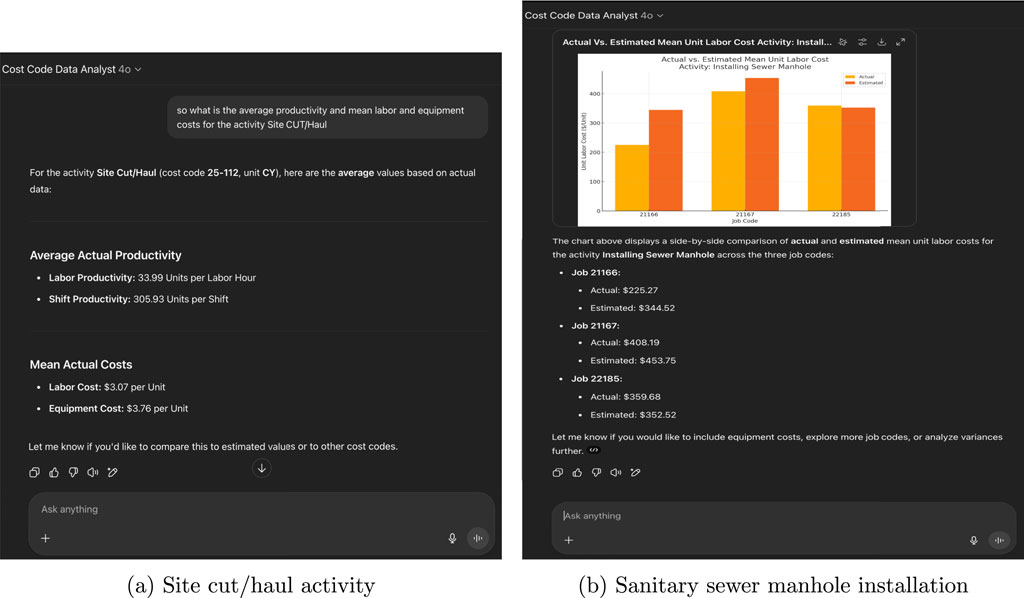
Figure 4. GPT Cost Code Data Analyst interaction and output generation: (a) Response to a user query about hauling productivity, including labor and equipment cost retrieval; (b) Trend visualization of unit labor costs across three comparable job codes.
5 User feedback and conclusion
5.1 Deployment and impact
By making historical performance data conversationally accessible, this system empowers field teams to make data-informed decisions directly on-site and enables estimators to refine cost and productivity assumptions during pre-bid strategy sessions. The tool has already been deployed in a production environment and is actively used by the contractor’s estimating team to support bid preparation. A forthcoming update will introduce standardized cost code conventions across the organization, further improving the consistency and interpretability of field-to-estimate comparisons and reinforcing data-driven strategies for business resilience and growth.
5.2 User feedback
Initial feedback from end-users has been consistently positive, highlighting both the immediate value and future potential of the system. Estimators emphasized that the GPT-based cost code chat interface made it “very easy to access the data” and retrieve historical production rates in seconds. Users noted that this approach is far more efficient than the traditional method of searching project-by-project, which was time-consuming and labor-intensive. Several users specifically praised the context-aware outlier removal, describing it as “critical to include and very helpful in making the information more accurate and useful for our estimators and team”. They reported that the cleaned data provided stronger support for estimate preparation and reduced the risk of relying on misleading anomalies. One estimator stated that the system “drastically reduced the amount of time spent looking up productions and allowed us to spend more time focused on what’s important, creating more value in the estimates”. Feedback also highlighted desired enhancements to improve the system’s utility. Users expressed interest in categorizing production rates by project type (e.g., site development, public works, or water resources) and filtering by job size or scope to make comparisons more relevant. Suggestions also included incorporating seasonal information to capture weather-related performance trends and embedding the GPT interface directly into Microsoft Teams for easier day-to-day access. Overall, these responses confirm the system’s effectiveness in reducing information overload and improving estimator efficiency, while also offering clear direction for future development and broader deployment.
5.3 Limitations and future work
While the results are promising, the approach has several limitations. The model relies heavily on the accuracy of the estimating team’s baseline estimates, which may introduce bias. This reliance is especially important to note since the dataset currently spans only 8 years, a relatively short period compared to broader historical analyses. Future studies should incorporate full project- and budget-level analysis to reduce dependence on estimating data alone and to build context from overall project outcomes. For the present scope, the authors focused on developing a GPT interface connected via API calls to the cleaned Firebase database rather than creating a fully fine-tuned domain-specific model, as the core of the developed agentic system in this paper lies in the context-aware outlier detection algorithm that prepares reliable data for retrieval. The authors plan to explore in future work the development of a custom fine-tuned GPT that learns directly from historical data, project records, bid proposals, contractor documents, project progress reports, and other project-related sources. Incorporating these additional knowledge bases would significantly improve the robustness of the model, strengthen its domain adaptation, and further enhance its ability to provide reliable business intelligence for construction professionals.
Additionally, the industry collaborator is in the process of making a major update to this system by generalizing cost codes and streamlining data entry. These improvements are expected to reduce errors at the source, prevent inconsistent entries, and ultimately improve the quality of outlier detection. Once this update is complete, the authors will be able to conduct larger-scale testing across multiple projects and scenarios. For the scope of this paper, the validation has been preliminary, focusing on representative cost codes and early user feedback. Additionally, the model has so far been developed and validated using the dataset of a single contractor. While this has provided valuable insights and practical deployment experience, the broader applicability of the approach still needs to be tested. Future work should focus on implementing and evaluating the model across multiple industry collaborators with varying project types, organizational practices, and cost-tracking conventions. Such cross-industry testing would provide stronger evidence of generalizability and help refine the agentic AI workflow for diverse construction settings. As a result, it is recommended that estimating teams adopt the tool cautiously at first, continuously updating the context and providing feedback to enhance its long-term reliability and usefulness. Over time, as data quality improves and testing expands, the system has the potential to become a robust, industry-wide solution for productivity benchmarking, cost forecasting, and data-driven project planning.
Data availability statement
The raw data supporting the conclusions of this article will be made available by the authors, without undue reservation.
Author contributions
VK: Supervision, Funding acquisition, Conceptualization, Writing – review and editing, Validation, Methodology, Formal Analysis, Resources, Project administration, Writing – original draft, Data curation. KA: Investigation, Writing – review and editing, Writing – original draft, Validation, Formal Analysis, Visualization, Data curation, Methodology. CT: Writing – original draft, Resources, Validation, Supervision, Project administration, Conceptualization, Writing – review and editing. NA: Writing – review and editing, Writing – original draft, Validation, Software, Data curation.
Funding
The author(s) declare that financial support was received for the research and/or publication of this article. This research was supported through a collaborative initiative between the University of North Florida (UNF) and Petticoat Schmitt Civil Contractors as part of the project titled “AI-Driven Business Intelligence and Operational Automation for Petticoat Schmitt.” The funding enabled the advancement of AI applications for construction process automation and the academic mentoring of graduate research students at UNF.
Conflict of interest
Author CT was employed by the company Petticoat Schmitt Civil Contractors. Author KA was employed by the company SSS Soft Solutions. Author NA was employed by the company Cognizant Technology Solutions.
The remaining author declares that the research was conducted in the absence of any commercial or financial relationships that could be construed as a potential conflict of interest.
The authors declare that this study received funding from Petticoat Schmitt Civil Contractors. The funder had involvement in identifying the research need for outlier removal and in facilitating team access to their historical cost and productivity data. The funder did not influence the analysis, interpretation of results, or the decision to submit this article for publication.
Generative AI statement
The author(s) declare that Generative AI was used in the creation of this manuscript. The authors verify and take full responsibility for the use of generative AI in the preparation of this manuscript. Generative AI was used to assist with grammar correction and conciseness in writing. Additionally, generative AI constitutes a core component of the methodology developed and evaluated in this study.
Any alternative text (alt text) provided alongside figures in this article has been generated by Frontiers with the support of artificial intelligence and reasonable efforts have been made to ensure accuracy, including review by the authors wherever possible. If you identify any issues, please contact us.
Publisher’s note
All claims expressed in this article are solely those of the authors and do not necessarily represent those of their affiliated organizations, or those of the publisher, the editors and the reviewers. Any product that may be evaluated in this article, or claim that may be made by its manufacturer, is not guaranteed or endorsed by the publisher.
References
Acuity International (2025). Cost estimating for construction: accurate bids and budgets. Available online at: https://acuityinternational.com/blog/cost-estimating-for-construction/.
Ahmad, H. (2019). A semantic approach for outlier detection in big data streams. Webology 16 (1), 184–195. doi:10.14704/web/v16i1/a186
Ahmed, M. A. A., and Omar, M. S. (2021). Dynamic labor tracking system in construction project using BIM technology. Int. J. Civ. Struct. Eng. Res. 9 (20). Available online at: https://www.researchgate.net/publication/361402008.
Bonney, S. O., Yankah, J. E., Adjei, K. O., and Tieru, C. K. (2024). Software and mobile apps as a strategy for productivity improvement in the construction industry. J. Build. Constr. Plan. Res. 12 (1), 1–35. doi:10.4236/jbcpr.2024.121001
Geeks for Geeks (2023). Transforming contextual outlier detection to conventional outlier detection in data mining. Available online at: https://www.geeksforgeeks.org/data-science/transforming-contextual-outlier-detection-to-conventional-outlier-detection-in-data-mining.
Google (2024). Firebase | Google’s mobile and web app development platform. Available online at: https://firebase.google.com/.
HCSS (2024). HCSS terminology. Available online at: https://developer.hcssapps.com/getting-started/terminology/.
HCSS (2018). Construction software to collect time cards for your company. Available online at: https://www.hcss.com/news/heavyjob-offers-variety-ways-collect-time-employees-throughout-company/.
Hedley, G. (2014). Does your field time card work for you? For Constr. Pros. Available online at: https://www.forconstructionpros.com/construction-technology/personnel-management/article/11520995/construction-business-coaching-how-to-make-your-construction-field-time-card-help-you-make-more-money.
hh2 Construction Connected (2025). How to prevent buddy punching at Your construction company. Available online at: https://www.hh2.com/construction-human-resources/how-to-prevent-buddy-punching-at-your-construction-company.
Liang, J., and Parthasarathy, S. (2016). “Robust contextual outlier detection: where context Meets Sparsity”, in Proc. 25th ACM Intl. Conf. On information and knowledge management, 2167–2172.
Liu, F. T., Ting, K. M., and Zhou, Z. H. (2008). “Isolation forest”, in Proc. 8th IEEE intl. Conf. on data mining. IEEE, 413–422. Available online at: http://ieeexplore.ieee.org/document/4781136/.
Okoh, O. F., Ukpoju, E. A., Otakwu, A., Ayoola, V. B., and Enyejo, L. A. (2024). Construction management: some issues in the construction project. Eng. Herit. J. 8 (1), 42–50. doi:10.26480/gwk.01.2024.42.50
OpenAI (2024). ChatGPT. Available online at: https://openai.com/chatgpt/overview/.
Poage, B. (2024). Streamlining payroll: how digital timecards help. Strongsville, OH: Foundation Software, LLC. Available online at: https://www.foundationsoft.com/learn/how-digital-timecards-improve-the-payroll-process/.
Pravdin, O. (2023). Construction timesheets and their challenges. Palo Alto, CA: LUMBERFI INC. Available online at: https://www.lumberfi.com/blog/construction-timesheets-and-their-challenges.
Sayed, M., Abdel-Hamid, M., and El-Dash, K. (2023). Improving cost estimation in construction projects. Int. J. Constr. Manag. 23 (1), 135–143. doi:10.1080/15623599.2020.1853657
Spivac, D. (2025). hh2 construction connected. How digital time cards reduce payroll errors in construction. Available online at: https://www.hh2.com/construction-human-resources/how-digital-time-cards-reduce-payroll-errors-in-construction.
Tang, L., Zhao, Y., Austin, S., Darlington, M. J., and Culley, S. J. (2008). Overload of information or lack of high value information: lessons from construction. Proc. Eur. Conf. Knowl. Manag.
Wallin, J. (2023). From data to action: top data visualizations for construction. Autodesk construction cloud. Available online at: https://www.autodesk.com/blogs/construction/top-data-visualizations-for-construction/.
Keywords: outlier detection, isolation forest, agentic AI, construction data analysis, cost estimating, generative AI, labor productivity, historical data analysis
Citation: Kalasapudi VS, Angara KP, Tofferi C and Aditya Varanasi NS (2025) Agentic generative AI for context-aware outlier removal and historical cost optimization in construction. Front. Built Environ. 11:1678156. doi: 10.3389/fbuil.2025.1678156
Received: 01 August 2025; Accepted: 22 September 2025;
Published: 07 October 2025.
Edited by:
Gaang Lee, University of Alberta, CanadaReviewed by:
Ci-Jyun Liang, Stony Brook University, United StatesElyar Pourrahimian, University of Alberta, Canada
Copyright © 2025 Kalasapudi, Angara, Tofferi and Aditya Varanasi. This is an open-access article distributed under the terms of the Creative Commons Attribution License (CC BY). The use, distribution or reproduction in other forums is permitted, provided the original author(s) and the copyright owner(s) are credited and that the original publication in this journal is cited, in accordance with accepted academic practice. No use, distribution or reproduction is permitted which does not comply with these terms.
*Correspondence: Vamsi Sai Kalasapudi, dmFtc2kua2FsYXNhcHVkaUB1bmYuZWR1