 Jiajia Wang
 Zhihan Tao
 Brian Deal
- Department of Landscape Architecture, University of Illinois at Urbana-Champaign, Champaign, IL, United States
While climate change demands urgent global action, emission reduction effectiveness hinges on local implementation. This study develops a landscape planning framework for analyzing street-level transportation emissions using integrated geospatial analysis, transportation analytics, and landscape metrics. Using 2016 NLCD land cover data, 2021 census data, and 2023 IDOT traffic data for Cook County, Illinois, we quantify transportation emissions at a fine scale and identify local mitigation opportunities. Our results indicate that arterial roads generate 52.04% of transportation emissions despite lower per-meter intensity than highways. Shannon’s entropy (land use fragmentation measure) reveals downtown districts (0.586) have lower per capita emissions than fragmented suburban areas (0.951). Married households correlate with higher emissions (r = 0.302, p < 0.001) while renter-occupied areas show lower emissions (r = −0.294, p < 0.001). We also find that strategic green infrastructure implementation along arterial corridors could sequester at least 360,000 tons CO2 annually. This framework provides actionable strategies for translating global climate goals into neighborhood-scale interventions by integrating transportation planning with ecosystem services.
1 Introduction
The transportation sector accounts for 28% of greenhouse gas emissions in the United States, driven primarily by fossil fuel-powered vehicles and car-dependent infrastructure (USEPA, 2025b; Rodrigue, 2020). While this sectoral contribution is well-documented on national and regional scales, the spatial distribution of these emissions at the street level remains poorly understood. This knowledge gap prevents communities from developing targeted transportation based, green-house gas (GHG) mitigation strategies that address specific emission hotspots within their neighborhoods.
Additionally, current top-down climate policies often fail to translate into actionable local interventions, as they lack the spatial granularity needed to identify where emissions concentrate and where green infrastructure could provide the greatest mitigation benefits (Campbell-Arvai and Lindquist, 2021). Understanding street-level emission patterns is therefore critical for bridging the gap between global climate commitments and neighborhood-scale action, particularly as cities seek to operationalize their carbon neutrality pledges through evidence-based local strategies.
Despite growing recognition of this scalar mismatch, current approaches to urban emission assessment lack integration across three critical theoretical dimensions–urban morphology, travel behavior, and socio-technical transitions.
Urban morphology theory demonstrates how physical city configurations—density, connectivity, and land use patterns—fundamentally shape travel behavior and modal choices (Ewing and Cervero, 2010; Marshall and Garrick, 2012), yet existing emission inventories operate at coarse resolutions that obscure these morphological influences on street-level patterns (Gurney et al., 2009; Ou et al., 2016). Travel behavior theory reveals how household characteristics and socioeconomic factors interact with built environments to produce distinct transportation patterns (Handy et al., 2005; Cao et al., 2009), but the fine-scale interactions between household characteristics and neighborhood-level emissions remain unexplored, limiting our understanding of why similar urban forms yield different emission outcomes. Socio-technical transition theory recognizes that shifts to low-carbon transport require co-evolution of technology, infrastructure, and social practices (Geels, 2012), yet current research treats green infrastructure potential (Lai et al., 2024; Zeng et al., 2024) separately from emission hotspot identification, missing opportunities for integrated interventions. These theoretical gaps converge on a critical insight: transportation emissions emerge from complex interactions between landscape structure, human behavior, and systemic transitions—interactions that current methodologies fail to capture at actionable scales.
This study develops a landscape-based approach grounded in the synthesis of urban morphology, travel behavior, and socio-technical transition theories. Building on emissions inventories from the University of Illinois’s LEAM Laboratory (Wang et al., 2025), we examine Cook County, Illinois—a major transportation hub with diverse urban forms (IDOT, 2025; CMAP, 2022). Our research addresses four theoretically grounded questions: 1 How do street-level emission patterns correlate with road network characteristics and landscape fragmentation across varying urban forms?; 2 To what extent do socioeconomic factors and household characteristics influence transportation emission intensities within different neighborhood contexts?; 3 How can green infrastructure deployment create systemic changes in urban carbon cycles through strategic placement along emission corridors?; 4 How can synthesis across these theoretical domains translate into neighborhood-scale strategies? The approach (described in Figure 1) integrates landscape patterns, human behaviors, and infrastructure systems to understand emission production and mitigation.
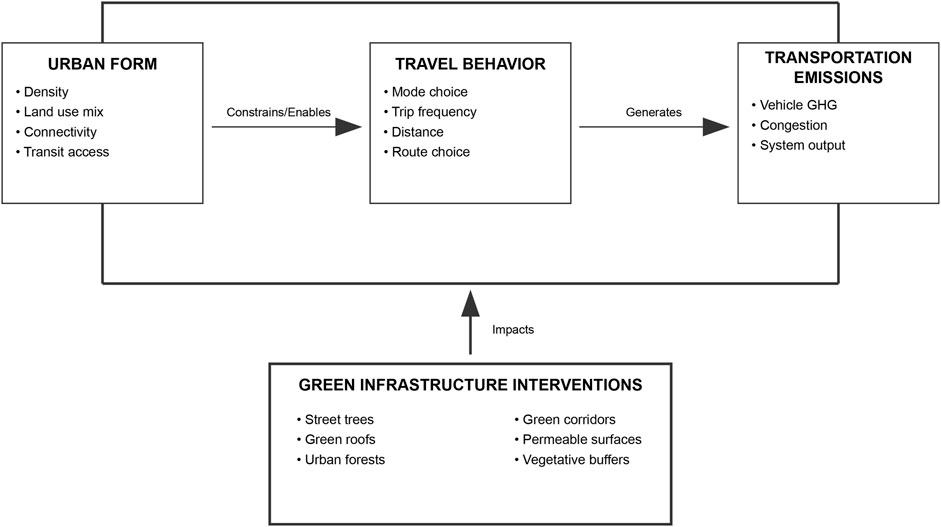
Figure 1. Conceptual framework linking urban form, travel behavior, and transportation emissions with green infrastructure interventions.
Recent studies confirm green infrastructure’s multiple benefits in transportation contexts: carbon sequestration (Biswas et al., 2022), temperature reduction (Sadat et al., 2024), and behavioral influence (Dipeolu et al., 2022) – validating an integrated approach. This research contributes a theoretically grounded methodology for street-level emission assessment, empirically tests how urban form and social patterns co-produce emission landscapes, and demonstrates how green infrastructure can catalyze systemic transitions toward low-carbon mobility. These contributions align with Illinois’s net-zero commitment by 2050 (IEPA, 2024; IDNR, 2023). Following this introduction, Section 2 details the methodology, Section 3 presents results and discussion, and Section 4 concludes.
2 Methodology
Cook County, home to the City of Chicago, serves as the study area for this research. As one of the largest metropolitan regions in the United States and a critical transportation hub, Chicago presents a complex urban environment with diverse emission sources (IDOT, 2025). The region’s emission profile is shaped by its extensive transportation network, industrial activity, and high population density (CMAP, 2022). Both CMAP and the Illinois Environmental Protection Agency have developed climate action plans that emphasize emissions reductions and sustainability (CMAP, 2022; IEPA, 2024). The Illinois Priority Climate Action Plan outlines a comprehensive approach to achieving net-zero greenhouse gas emissions by 2050, incorporating renewable energy expansion, energy efficiency improvements, and sustainable transportation initiatives (IEPA, 2024). Similarly, the Illinois Department of Natural Resources’ Climate Action Plan reinforces these efforts by committing to operational sustainability and increased resilience of state-managed lands to climate change (IDNR, 2023). Cook County’s diverse urban landscape—featuring dense urban cores, suburban developments, and extensive transportation networks, makes it an ideal testing ground for developing widely applicable emissions assessment frameworks that can be adapted to other major metropolitan areas seeking to bridge the gap between regional climate plans and street-level implementation.
2.1 Research framework
This study employs a multi-scale spatial approach with key methodological innovations that distinguish it from previous transportation emission studies:
2.1.1 Street-level emission disaggregation
We allocate tract-level emissions to individual road segments using weighted AADT and road length, enabling identification of specific intervention corridors.
2.1.2 Integrated landscape-emission analysis
We pioneer the integration of 8-directional Shannon entropy metrics with transportation emissions, quantifying how urban fragmentation patterns directly influence emission intensities at the neighborhood scale.
2.1.3 Socioeconomic-emission correlation at tract level
We conduct comprehensive Spearman correlation analysis between transportation emissions and multiple socioeconomic indicators, revealing how household characteristics and lifestyle choices shape emission landscapes beyond simple urban-suburban dichotomies.
The methodology follows three phases (Figure 2): i data acquisition and preprocessing, ii multi-scale spatial analysis including urban form characterization, emission estimation, and socioeconomic correlation analysis, and iii integration of findings for green infrastructure solutions. This framework enables translation of regional emission inventories into actionable, street-level intervention strategies.
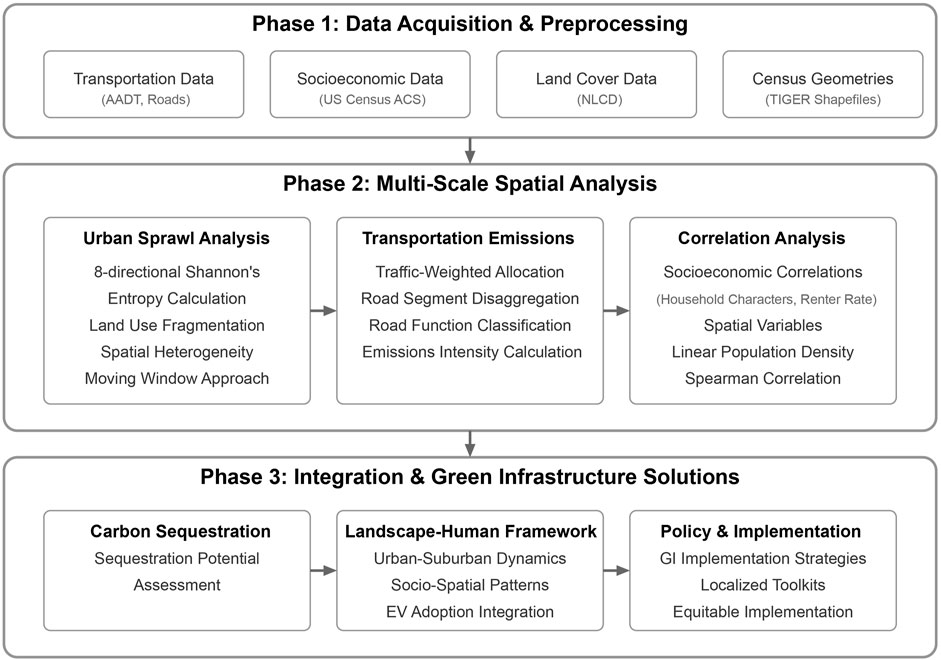
Figure 2. Research Workflow of multi-scale spatial approach.
2.1.4 Data
Table 1 summarizes the primary datasets integrated for this analysis. All spatial analyses were conducted in Python 3.12 and R 4.3, with census tract boundaries from TIGER 2023 serving as the common geographic unit for data integration.
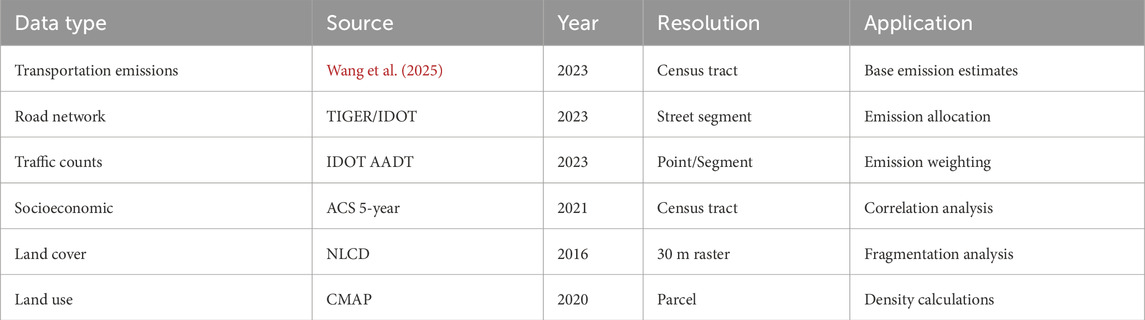
Table 1. Primary data sources.
2.2 Urban form and land use fragmentation analysis
To quantify how urban sprawl influences transportation emissions, we employ 8-directional Shannon entropy analysis following Mohimi and Esmaeily (2024):
where
Using NLCD 2016 data, we calculate entropy for emission at census tract level. Higher entropy values (approaching 1.0) indicate greater fragmentation and sprawl, while lower values (approaching 0) represent homogeneous, compact development. Results are aggregated to census tracts for integration with emission and socioeconomic data. This represents the innovated use of directional entropy to transportation emission analysis, capturing multi-dimensional sprawl patterns that single metrics miss. Unlike traditional density measures, our approach quantifies spatial heterogeneity across all compass directions, revealing how fragmented development patterns correlate with increased vehicle dependence.
2.3 Transportation emissions estimation and allocation
Building on tract-level emissions from Wang et al. (2025), we develop a novel street-segment allocation method:
where
We integrate IDOT AADT data (IDOT, 2024) with TIGER road networks (U.S. Census Bureau, 2023), calculating emissions for 39,713 road segments across four functional classes - Interstate, Arterial, Collector, Local (Federal Highway Administration, 2021). EPA emission factors (USEPA, 2025a) account for vehicle mixes and fuel types. While AADT measurements carry ±10%–15% uncertainty (IDOT, 2004), relative proportions between road classes remain stable, ensuring robust identification of high-emission corridors. This street-level resolution enables targeted intervention planning impossible with traditional tract-level analysis.
2.4 Transportation emission correlation analysis
To understand how household characteristics shape emission patterns, we examine relationships between transportation emissions and socioeconomic indicators using Spearman rank correlation analysis. We analyze transportation modes (drive-alone, carpooling), household characteristics (married households, renter rates), and spatial metrics including population density, employment density, road density, and linear population density, identified as an essential urban metric for emission studies (Marshall, 2007).
Spearman rank correlation is employed due to non-normal distribution of emissions data (Shapiro-Wilk test, p < 0.001) and presence of outliers. This non-parametric method is robust to monotonic non-linear relationships. Analysis uses ACS 2021 5-year estimates (U.S. Census Bureau, 2021) joined with CMAP 2020 land-use inventory (CMAP, 2020) for 1,318 census tracts, revealing which socioeconomic and spatial factors most strongly predict neighborhood emission patterns.
2.5 Statistical assumptions and limitations
The analysis assumes single-year traffic patterns represent typical conditions and vehicles distribute evenly along road segments, though real-world emissions concentrate at intersections. NLCD data assesses current urban form, acknowledging subsequent development. AADT measurements carry ±10%–15% uncertainty that affects emission calculations.
Census tract boundaries impose artificial divisions on continuous travel patterns, while five-year averaged ACS data (2017–2021) may mask post-pandemic shifts. Using 2016 NLCD data for 2023 analysis creates a seven-year gap that may miss recent urban development, particularly in rapidly growing suburbs. However, since major land use patterns evolve over decades, this primarily affects absolute fragmentation values rather than relative patterns across the study area. We acknowledge ecological fallacy—tract-level associations do not imply individual-level causation. Though our street-level approach improves on tract-level studies, we cannot capture micro-scale variations at intersections or buildings, nor model spatial spillovers between neighboring tracts. Despite these constraints common to urban emission studies, our methodology advances beyond previous work by providing street-level resolution for targeted interventions.
3 Results and discussion
Our discussion points are curated by spatial and socio-economic relevance to help systematically understand the relationship between space and emissions from moving transport flows in the urban landscape. Generally, we find emission variations across road class as shown (Figure 3), with the highest emissions concentrated along major highways and Interstates reaching 417.98 metric tons/meter/yr.
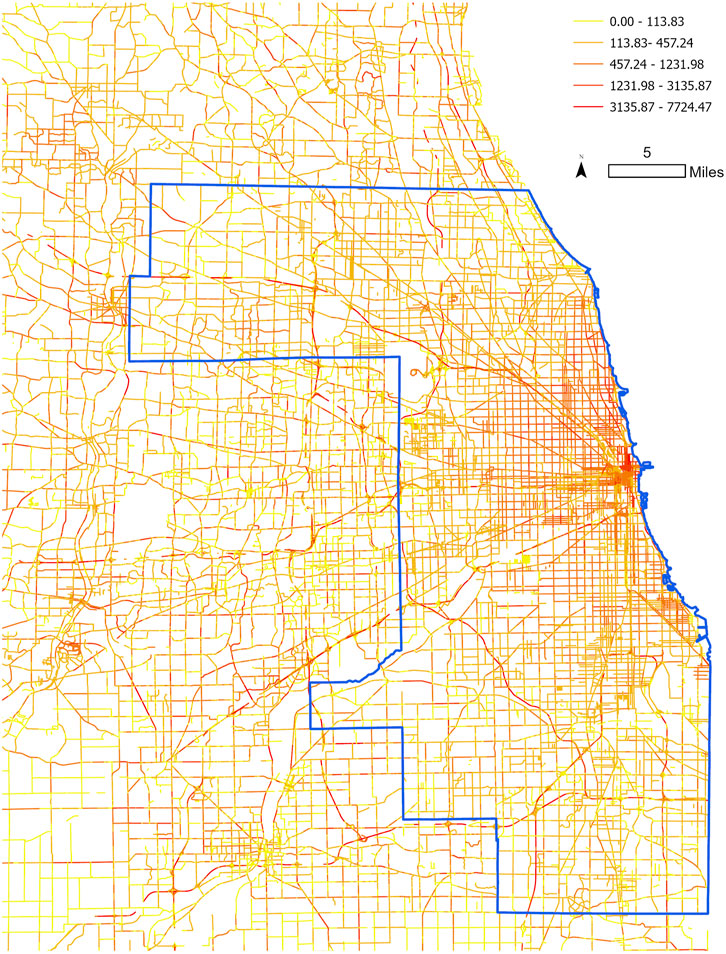
Figure 3. Street-level On-road transportation emissions. Major highways such as I-294, I-90, I-55, and I-57 fall into high categories of emission contributors.
Emissions from individual local streets in high-density urban areas are major emission contributors, with frequent vehicular activity and elevated vehicle density. When combined with LPD to get per capita emissions, suburban and low-density residential areas, particularly in the north and southwestern regions of Chicago, exhibit higher emissions (Figure 4). This echoes with Table 1 showing that moving away from the urban core, the average emission per capita increases from 3.94 to 5.82 metric ton CO2e/person/year respectively, due to greater dependence on single-occupancy vehicle trips (r = 0.703, p < 0.001) and limited public transit accessibility, a well-documented phenomenon in studies on urban form and carbon emissions (Echenique et al., 2012). Our result confirms some findings from Creutzig et al. (2015) global analysis of 274 cities. They found that urban form and transport infrastructure can help explain about 88% of urban transport energy use variation. Our results partially mirror their observations suggesting compact urban areas can reduce energy use by more than 25% compared to sprawling development patterns. Our spatial gradient (see Table 2) is more pronounced than Wang et al. (2017) observed in Chinese megacities, where suburbanization led to only moderate emission increases, generally due to mixed development patterns.
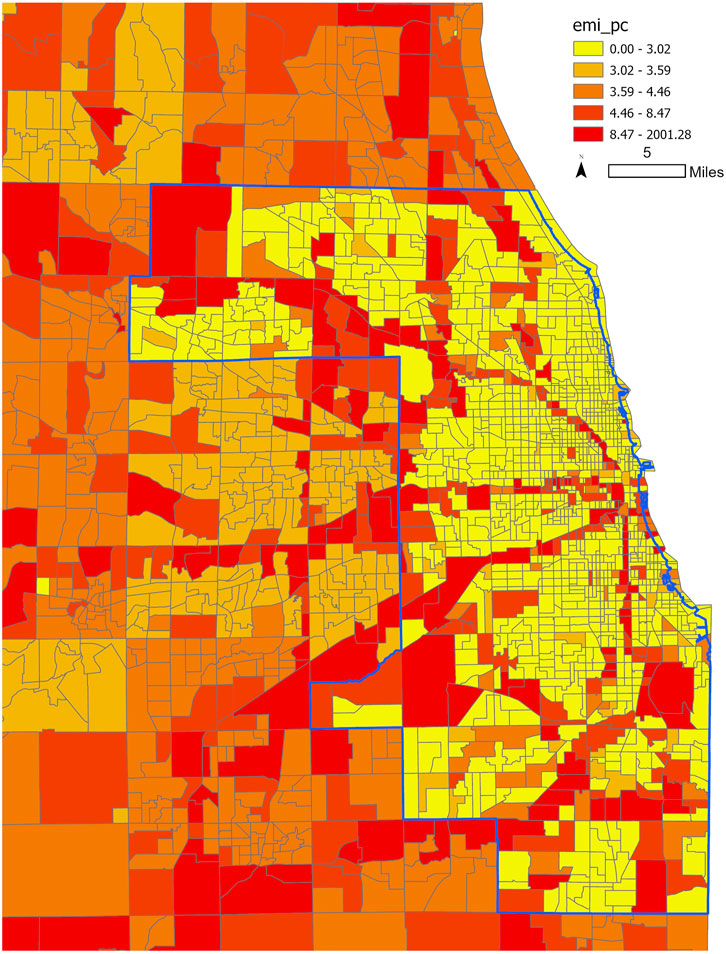
Figure 4. Per capita transportation emissions in Cook County showing higher values in suburban areas compared to urban core.
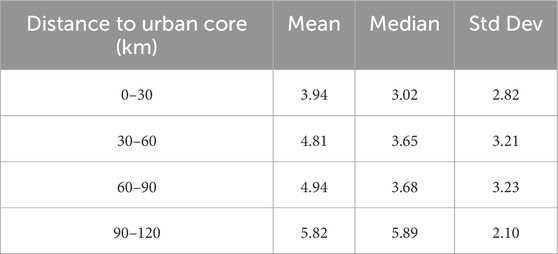
Table 2. Descriptive statistics of emission per capita (MT CO2e/person/year) of Chicago Metropolitan agency for planning (CMAP) by distance from Chicago City center.
Table 2 describes a spatial gradient with lower emission levels near the urban core (0–30 km), increasing steadily across suburban areas (30–90 km), reaching the highest average in the 90–120 km range. Variability in emissions is moderate, with suburban tracts exhibiting slightly greater spread compared to the urban core.
A detailed breakdown of emissions by road classification reveals that while highways contribute a substantial share of total emissions, arterial and collector roads collectively account for a significant portion of localized output. Table 3 quantifies these differences, demonstrating that high emissions intensity is not confined to highways alone but extends into secondary road networks embedded within residential and commercial zones.
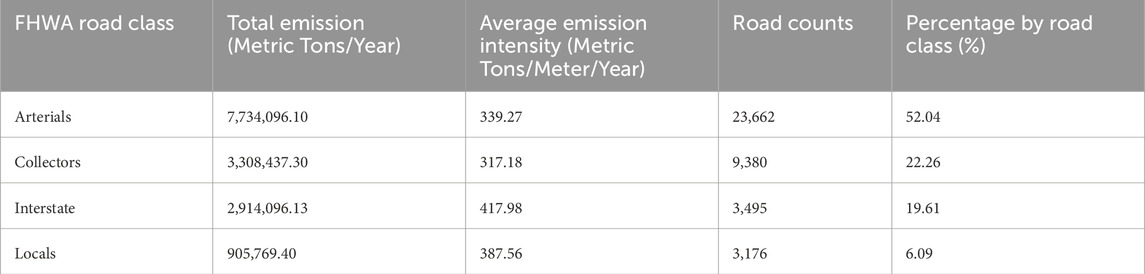
Table 3. Emission summary by federal highway administration road function class.
Although emissions per meter are highest on interstates (417.98 metric tons/meter/yr), the local (387.56 metric tons/meter/yr) and arterial roads (339.27 metric tons/meter/yr) also have high emission intensity. Additionally, the arterials which take large share of the road profiles in road counts (23,662) have the highest emission share (52.04%). This pattern is consistent with findings from emission studies, which indicate that emissions intensity is often greater on secondary roads due to traffic signal delays and increased acceleration-deceleration cycles (Seto et al., 2012). These findings suggest that more effective policy interventions should include the local level.
3.1 Landscape-human dynamics: socio-economic dimensions of transportation emissions
To evaluate how space is used in our urban study area, we calculated Shannon’s entropy index using national land cover data (NLCD). Not unexpectedly, our results indicate a high degree of urban sprawl in Cook County (0.88), with significant variations in this form across geographic regions in the area (Figure 5). The southwestern (0.951) and southern (0.915) sectors exhibit the most fragmented development, characterized by dispersed residential patterns and low-density subdivisions. These areas show a positive correlation with driving alone (r = 0.703, p < 0.001) and correspond with higher per capita transportation emissions, aligning with previous work on sprawl impacts (Seto et al., 2012).
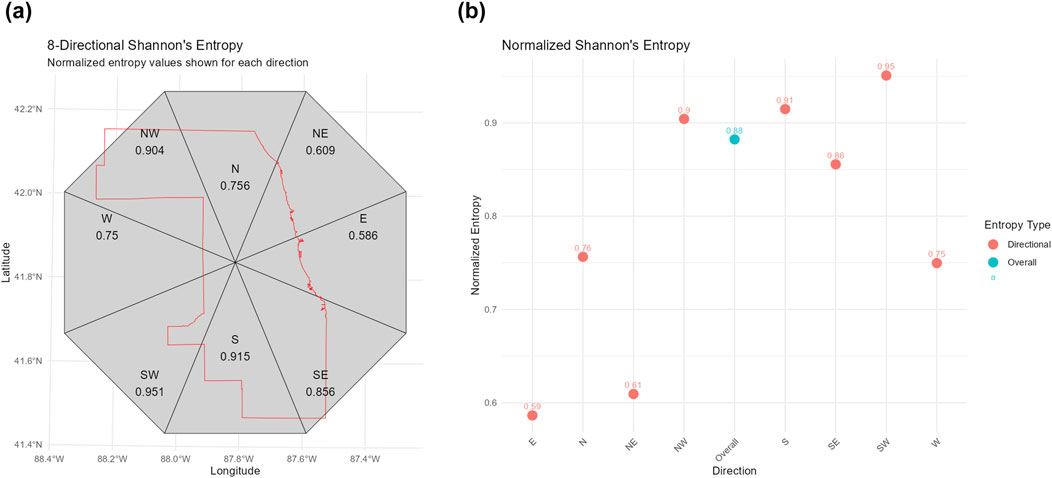
Figure 5. 8-directional Shannon’s Entropy to Evaluate Spatial Distribution of Urban Fragmentation in Cook County. (a) Spatial entropy values by direction. (b) Comparison of directional and overall entropy values.
In contrast, the northeastern (0.609) and eastern (0.586) regions, relatively small areas near the urban core due to Lake Michigan, demonstrate more compact development patterns, aligning with lower transportation emissions. High residential densities in central districts correspond with lower emissions per capita due to increased accessibility to public transit and shorter commute distances. This is supported by the negative correlation between emissions and population density (r = −0.279, p < 0.001). In contrast, sprawling residential developments with single-family housing contribute to disproportionately high emissions, given their reliance on extensive road networks and limited public transit connectivity. This spatial divergence reinforces the need for targeted strategies.
3.1.1 Emission landscapes
The conventional narrative of urban-suburban emissions often presents a simplified polarization between dense urban cores and sprawling peripheries. However, this study’s landscape-based analysis reveals emissions as emergent properties of complex human-landscape interactions that transcend traditional administrative boundaries. Through detailed analysis of socio-economic variables with transportation emissions (Table 4), this section demonstrates how household characteristics, settlement patterns, and mobility behaviors collectively shape emission landscapes that cannot be reduced to simplistic urban-suburban dichotomies.
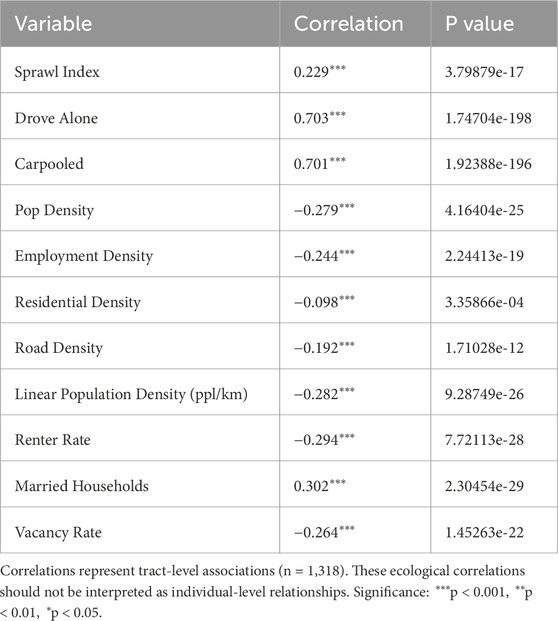
Table 4. Spearman correlation between on-road emissions and social and spatial indicators.
3.1.2 Family structure
Family formation creates specific landscape demands that directly shape emission patterns. The positive correlation between married households and emissions (r = 0.302, p < 0.001) reflects how family life affects spatial arrangements—larger homes, proximity to schools, and yard space—that in the U.S., often situate households in car-dependent landscapes. While Goldstein et al. (2020) found 25% higher carbon footprints for suburban households, our analysis reveals a more complex picture. The correlation between family structure and emissions varies significantly by neighborhood type, suggesting that He et al. (2005) projections of China’s transportation oil demand may underestimate the role of household dynamics in the U.S. Unlike technology-focused scenarios, our findings indicate that household formation patterns could be equally important for long-term emission trajectories. Meanwhile, our results provide empirical support for Zhao and Zhang’s (2018) Beijing study, which found that life-course events like marriage and childbirth are primary drivers of suburban relocation and subsequent car dependency. This relationship suggests that emissions emerge not from arbitrary preference for suburban living but from fundamental social processes embedded in landscape organization.
3.1.3 Occupancy
Complementing this pattern, renter occupancy demonstrates a negative correlation with emissions (r = −0.294, p < 0.05), illustrating how different household types create distinct mobility landscapes. Rental-heavy districts typically feature higher densities, mixed uses, and transit accessibility that reduce car dependency. This aligns with the negative correlation between emissions and population density (r = −0.28, p < 0.001), employment density (r = −0.244, p < 0.001), and linear population density (r = −0.28, p < 0.001). These spatial forms align with reduced VMT, particularly in environments with better destination accessibility and street connectivity (Ewing and Cervero, 2010). Chatman (2013) further finds that lower auto use near transit is more strongly driven by density, housing type, and limited parking than by rail proximity itself. Together, these relationships reveal that renters tend to organize themselves spatially in ways that minimize commuting distances to workplaces, choosing higher-density areas where alternatives to private vehicle use are viable.
3.1.4 Urban form
The sprawl index’s positive correlation with emissions (r = 0.23, p < 0.001), as well as the correlation with drove alone (r = 0.703, p < 0.001) and carpooling (r = 0.701, p < 0.001) shows decentralized, low-density patterns in suburban zones—characterized by separated land uses and limited connectivity—create clusters of car dependency and rising emissions (Ewing and Hamidi, 2015). This corroborates Nakamura and Hayashi’s (2013) argument that a city’s spatial evolution determines which transport strategies can effectively reduce emissions. In contrast, areas with higher road density exhibit a negative correlation with emissions (r = −0.192, p < 0.001), suggesting that denser and more interconnected networks foster mobility options that transcend the automobile. This interdependence between form and flow reveals how the core of the city—densely networked, amenity-rich, and compact—reimagines mobility through more sustainable modes. The built environment, therefore, is not merely a backdrop but a living, breathing actor that orchestrates the rhythms of emission patterns. It is spatial coherence—more than just density—that determines whether urban form facilitates or constrains low-carbon travel choices.
These findings reveal that transportation emissions emerge from complex interactions between landscape structure and human behavior, not simple urban-suburban divisions. This challenges static census-based approaches and highlights the need for dynamic landscape-human system strategies. Effective emission reduction requires addressing the systemic forces—settlement patterns, infrastructure design, and behavioral norms—at their source: local roads and neighborhoods. Solutions must align physical form with social function to create interventions responsive to real-world mobility patterns.
3.2 Carbon sequestration potential and green infrastructure solutions
Our analysis shows that arterial roads contribute over half of total emissions despite lower per-meter intensity, while areas with high sprawl indices (0.951 in southwestern regions) show elevated per capita emissions. These emission hotspots—particularly along arterial corridors embedded within residential zones—present prime opportunities for green infrastructure interventions that can both sequester carbon and address the underlying landscape fragmentation that drives car dependency. Targeted interventions that respond to distinct emission landscapes are now possible, moving from problem diagnosis to solution development.
Estimated carbon sequestration rates for Cook County (Zeng et al., 2024) provides a benchmark for assessing potential mitigation strategies. It shows that areas with extensive vegetation cover, particularly in open space zones and low-density suburban areas, exhibit the highest sequestration capacities. This makes green infrastructure particularly valuable for addressing the high per capita emissions identified in sprawling suburban zones. Notably, corridors with high emissions intensity—such as major arterials—coincide with areas that exhibit moderate-to-high sequestration potential, presenting opportunities for targeted interventions.
Introducing vegetative buffers in high-emission corridors could serve as a dual-purpose mitigation measure, reducing carbon output while enhancing air quality and microclimate regulation (Abhijith et al., 2017; Zhang et al., 2025). This multi-functional approach aligns with evidence that green infrastructure outperforms grey technology in urban environmental management (Ferreira and Rocha, 2024). These findings underscore the necessity of incorporating localized nature-based solutions into urban infrastructure planning (Campbell-Arvai and Lindquist, 2021), which will provide a versatile effect over the long term.
3.2.1 Technology integration
While our analysis shows that current green infrastructure implementation can sequester a portion of transportation emissions, technology adoption - particularly electric vehicles (EVs) significantly accelerates the trajectory toward carbon neutrality (Kontou et al., 2022). Aligning technological innovation with systemic urban optimizations such as integrated land use, transportation planning, and energy efficiency measures—can compress decarbonization timelines and increase cost-effectiveness by leveraging synergistic gains (Lovins, 1996). This synergistic approach—uniting electrification, landscape-based carbon sequestration, and spatial planning—offers the most promising pathway to rapidly achieve carbon-neutral transportation systems across diverse urban morphologies.
3.3 Policy implications and recommendations
Our findings reveal that arterial roads generate over half of transportation emissions, requiring a fundamental shift in intervention priorities. Municipalities should target green infrastructure deployment along arterial networks within residential and commercial zones rather than highway corridors, operationalizing place-based mitigation where emissions actually occur.
Green infrastructure implementation—tree-lined streets, vegetative buffers, and green roofs—offers multi-functional benefits in high-emission corridors. A localized toolkit incorporating spatial data analytics can guide optimal placement while adapting to neighborhood conditions and local climate patterns (Nielsen and Skov-Petersen, 2018).
Equity must drive resource allocation, prioritizing high-emission, low-income areas through targeted subsidies for low-emission vehicles, expanded transit access, and pedestrian-cycling infrastructure investments. The strong negative correlation between density and emissions supports transit-oriented development policies that reduce car dependency through integrated land-use planning.
Success requires connecting transportation emissions reduction with carbon sequestration efforts, creating walkable communities that align spatial form with social function. This integrated approach transforms our street-level findings into actionable strategies for sustainable urban mobility.
4 Conclusion
This study advances transportation emission science by developing and applying a novel landscape-based analytical framework that operates at a street level. By integrating spatial analysis, socioeconomic correlations, and green infrastructure assessment, we demonstrate that transportation emissions emerge from complex human-landscape interactions rather than simple infrastructure configurations.
Our core findings challenge conventional emission management paradigms. First, we suggest redirecting transportation mitigation foci from major highways to secondary road networks embedded within residential zones. We also suggest that spatial configuration can fundamentally affect mobility choices and resulting emissions and that household characteristics can produce predictable emission landscapes through residential location choices. We found, for example, that married households correlate positively with emissions by self-selecting car-dependent environments, while renter-occupied areas tend to concentrate in transit-accessible neighborhoods. These patterns transcend simple urban-suburban dichotomies, revealing instead how life-cycle events and housing tenure interact with landscape structure to produce distinct emission geographies. Finally, our quantification of green infrastructure potential transforms these findings into actionable solutions. This demonstrates that neighborhood-scale interventions can meaningfully contribute to regional carbon neutrality goals when properly targeted using street-level emission data.
The study’s primary contribution lies in providing a transferable methodology for translating global climate commitments into local action. By demonstrating how to identify, analyze, and address emission hotspots at the street level, we enable evidence-based planning that aligns spatial form with social function. This framework is particularly valuable for metropolitan regions seeking to operationalize carbon neutrality pledges through targeted, cost-effective interventions.
Future applications should extend this framework temporally to capture emission dynamics and spatially to account for cross-boundary flows. Integration with real-time traffic data and behavioral intervention studies would further enhance the approach’s precision and impact. As cities worldwide grapple with transportation decarbonization, this landscape-based methodology offers a practical pathway from emission diagnosis to implemented solutions, grounded in the recognition that sustainable mobility emerges from the thoughtful integration of urban form, social systems, and ecological infrastructure.
Data availability statement
The raw data supporting the conclusions of this article will be made available by the authors, without undue reservation.
Author contributions
JW: Writing – review and editing, Conceptualization, Writing – original draft, Software, Investigation, Project administration, Visualization, Methodology, Data curation, Formal Analysis. ZT: Methodology, Validation, Writing – review and editing. BD: Supervision, Project administration, Writing – review and editing, Methodology, Resources.
Funding
The author(s) declare that no financial support was received for the research and/or publication of this article.
Acknowledgments
The authors thank the Land Use Evolution and Impact Assessment Modeling (LEAM) Laboratory at the University of Illinois at Urbana-Champaign for research support and infrastructure. We also acknowledge the data providers whose publicly available datasets made this research possible.
Conflict of interest
The authors declare that the research was conducted in the absence of any commercial or financial relationships that could be construed as a potential conflict of interest.
Generative AI statement
The author(s) declare that no Generative AI was used in the creation of this manuscript.
Any alternative text (alt text) provided alongside figures in this article has been generated by Frontiers with the support of artificial intelligence and reasonable efforts have been made to ensure accuracy, including review by the authors wherever possible. If you identify any issues, please contact us.
Publisher’s note
All claims expressed in this article are solely those of the authors and do not necessarily represent those of their affiliated organizations, or those of the publisher, the editors and the reviewers. Any product that may be evaluated in this article, or claim that may be made by its manufacturer, is not guaranteed or endorsed by the publisher.
References
Abhijith, K. V., Kumar, P., Gallagher, J., McNabola, A., Baldauf, R., Pilla, F., et al. (2017). Air pollution abatement performances of green infrastructure in open road and built-up street canyon environments: a review. Atmos. Environ. 162, 71–86. doi:10.1016/j.atmosenv.2017.05.014
Biswas, M. H. A., Dey, P. R., Islam, M. S., and Mandal, S. (2022). Mathematical model applied to green building concept for sustainable cities under climate change. J. Contemp. Urban Aff. 6 (1), 36–50. doi:10.25034/ijcua.2022.v6n1-4
Campbell-Arvai, V., and Lindquist, M. (2021). From the ground up: using structured community engagement to identify objectives for urban green infrastructure planning. Urban For. and Urban Green. 59, 127013. doi:10.1016/j.ufug.2021.127013
Cao, X., Mokhtarian, P. L., and Handy, S. L. (2009). Examining the impacts of residential self-selection on travel behaviour: a focus on empirical findings. Transp. Rev. 29 (3), 359–395. doi:10.1080/01441640802539195
Chatman, D. G. (2013). Does TOD need the T? On the importance of factors other than rail access. J. Am. Plan. Assoc. 79 (1), 17–31. doi:10.1080/01944363.2013.791008
Chicago Metropolitan Agency for Planning (CMAP) (2020). CMAP land-use inventory 2020. Available online at: https://datahub.cmap.illinois.gov/datasets/CMAPGIS::cmap-land-use-inventory-2020/explore (Accessed May 15, 2025).
Chicago Metropolitan Agency for Planning (CMAP) (2022). Regional greenhouse gas emissions inventory: updated with 2019 data. Chicago: CMAP. Available online at: https://www.cmap.illinois.gov/data/greenhouse-gas-inventory (Accessed May 15, 2025).
Creutzig, F., Baiocchi, G., Bierkandt, R., Pichler, P. P., and Seto, K. C. (2015). Global typology of urban energy use and potentials for an urbanization mitigation wedge. Proc. Natl. Acad. Sci. 112 (20), 6283–6288. doi:10.1073/pnas.1315545112
Dipeolu, A. A., Ibem, E. O., and Oriola, O. A. (2022). Influence of green infrastructure on residents' endorsement of the new ecological paradigm in lagos, Nigeria. J. Contemp. Urban Aff. 6 (2), 159–173. doi:10.25034/ijcua.2022.v6n2-4
Echenique, M. H., Hargreaves, A. J., Mitchell, G., and Namdeo, A. (2012). Growing cities sustainably: does urban form really matter? J. Am. Plan. Assoc. 78 (2), 121–137. doi:10.1080/01944363.2012.666731
Ewing, R., and Cervero, R. (2010). Travel and the built environment: a meta-analysis. J. Am. Plan. Assoc. 76 (3), 265–294. doi:10.1080/01944361003766766
Ewing, R., and Hamidi, S. (2015). Compactness versus sprawl: a review of recent evidence from the United States. J. Plan. Literature 30 (4), 413–432. doi:10.1177/0885412215595439
Federal Highway Administration (2021). Roadway functional classification guidelines. Washington, D.C.: U.S: Department of Transportation.
Ferreira, M. J., and Rocha, H. R. (2024). Green roof infrastructure outperforms grey technology in flood mitigation in São Paulo's urbanized region. Front. Built Environ. 10, 1465277. doi:10.3389/fbuil.2023.1254942
Geels, F. W. (2012). A socio-technical analysis of low-carbon transitions: introducing the multi-level perspective into transport studies. J. Transp. Geogr. 24, 471–482. doi:10.1016/j.jtrangeo.2012.01.021
Goldstein, B., Gounaridis, D., and Newell, J. P. (2020). The carbon footprint of household energy use in the United States. Proc. Natl. Acad. Sci. 117 (32), 19122–19130. doi:10.1073/pnas.1922205117
Gurney, K. R., Mendoza, D. L., Zhou, Y., Fischer, M. L., Miller, C. C., Geethakumar, S., et al. (2009). High resolution fossil fuel combustion CO2 emission fluxes for the United States. Environ. Sci. and Technol. 43 (14), 5535–5541. doi:10.1021/es900806c
Handy, S., Cao, X., and Mokhtarian, P. (2005). Correlation or causality between the built environment and travel behavior? Evidence from Northern California. Transp. Res. Part D Transp. Environ. 10 (6), 427–444. doi:10.1016/j.trd.2005.05.002
He, K., Huo, H., Zhang, Q., He, D., An, F., Wang, M., et al. (2005). Oil consumption and CO2 emissions in China's road transport: current status, future trends, and policy implications. Energy Policy 33 (12), 1499–1507. doi:10.1016/j.enpol.2004.01.007
Illinois Department of Natural Resources (IDNR) (2023). Climate action plan. Springfield, IL: Bureau of Data Collection, IDOT. Available online at: https://dnr.illinois.gov/outreach/climate-action-plan.html (Accessed: May 15, 2025).IDNR
Illinois Department of Transportation (IDOT) (2004). Illinois traffic monitoring program. Springfield, IL: Bureau of Data Collection, IDOT. Available online at: https://idot.illinois.gov/transportation-system/network-overview/highway-system/manuals.html (Accessed August 20, 2025).
Illinois Department of Transportation (IDOT) (2024). Annual average daily traffic (AADT) dataset. Available online at: https://idot.illinois.gov/ (Accessed May 15, 2025).
Illinois Department of Transportation (IDOT) (2025). Network Overview. Available online at: https://idot.illinois.gov/transportation-system/network-overview.html (Accessed May 15, 2025).
Illinois Environmental Protection Agency (IEPA) (2024). Illinois priority climate action plan. Springfield, IL: Illinois Environmental Protection Agency.
Kontou, E., Wu, Y.-C., and Luo, J. (2022). Electric vehicle infrastructure plan in Illinois. FHWA-ICT-22-016, ICT Ser. No. 22-023. Rantoul, IL Ill. Cent. Transp. doi:10.36501/0197-9191/22-023
Lai, S., Zhang, L., Zeng, Y., and Deal, B. (2024). A landscape approach to understanding carbon sequestration assets at a state-wide scale for sustainable urban planning. Sustainability 16 (9), 3779. doi:10.3390/su16093779
Lovins, A. B. (1996). Negawatts: twelve transitions, eight improvements and one distraction. Energy Policy 24 (4), 331–343. doi:10.1016/0301-4215(95)00138-7
Marshall, J. D. (2007). Urban land area and population growth: a new scaling relationship for metropolitan expansion. Urban Stud. 44 (10), 1889–1904. doi:10.1080/00420980701471943
Marshall, W., and Garrick, N. (2012). 'Community design and how much we drive. J. Transp. Land Use 5 (2), 5–21. doi:10.5198/jtlu.v5i2.301
Mohimi, A., and Esmaeily, A. (2024). Spatiotemporal analysis of urban sprawl using a multi-technique approach and remote sensing satellite imagery from 1990 to 2020: kerman/Iran. Environ. Dev. Sustain. 26, 18033–18068. doi:10.1007/s10668-023-03378-8
Nakamura, K., and Hayashi, Y. (2013). Strategies and instruments for low-carbon urban transport: an international review on trends and effects. Transp. Policy 29, 264–274. doi:10.1016/j.tranpol.2012.07.003
Nielsen, T. A. S., and Skov-Petersen, H. (2018). Bikeability -- Urban structures supporting cycling. Effects of local, urban and regional scale urban form factors on cycling from home and workplace locations in Denmark. J. Transp. Geogr. 69, 36–44. doi:10.1016/j.jtrangeo.2018.04.015
Ou, J., Liu, X., Li, X., and Shi, X. (2016). Mapping global fossil fuel combustion CO2 emissions at high resolution by integrating nightlight, population density, and traffic network data. IEEE J. Sel. Top. Appl. Earth Observations Remote Sens. 9 (4), 1674–1684. doi:10.1109/JSTARS.2015.2476347
Sadat, N., Hameem, S., and Asaduzzaman, M. (2024). Evaluating urban heat Island mitigation strategies in rajshahi, using ENVI-met: a remote sensing approach. J. Contemp. Urban Aff. 8 (2), 546–556. doi:10.25034/ijcua.2024.v8n2-15
Seto, K. C., Güneralp, B., and Hutyra, L. R. (2012). Global forecasts of urban expansion to 2030 and direct impacts on biodiversity and carbon pools. Proc. Natl. Acad. Sci. 109 (40), 16083–16088. doi:10.1073/pnas.1211658109
U.S. Census Bureau (2021). American community survey 5-year estimates. Available online at: https://www.census.gov/programs-surveys/acs (Accessed May 15, 2025).
U.S. Census Bureau (2023). TIGER/Line shapefiles. Available online at: https://www.census.gov/geographies/mapping-files/time-series/geo/tiger-line-file.html (Accessed May 15, 2025).
U.S. Environmental Protection Agency (USEPA) (2025a). Emission factors for greenhouse gas inventories. Available online at: https://www.epa.gov/climateleadership/ghg-emission-factors-hub (Accessed May 15, 2025).
U.S. Environmental Protection Agency (USEPA) (2025b). Sources of greenhouse gas emissions. Available online at: https://www.epa.gov/ghgemissions/sources-greenhouse-gas-emissions (Accessed May 15, 2025).
Wang, S., Liu, X., Zhou, C., Hu, J., and Ou, J. (2017). Examining the impacts of socioeconomic factors, urban form, and transportation networks on CO2 emissions in China's megacities. Appl. Energy 185, 189–200. doi:10.1016/j.apenergy.2016.10.052
Wang, J., Deal, B., and Hakim, M. I. (2025). Data-driven multi-scale integration of transportation networks and greenhouse gas emissions for landscape infrastructure planning. Land 14 (4), 807. doi:10.3390/land14040807
Zeng, Y., Wang, J., Lai, S., and Deal, B. (2024). Understanding the carbon sequestration potential of urban landscapes: a state-wide assessment in Illinois. J. Digital Landsc. Archit. 2024 (9), 193–201. doi:10.14627/537752019
Zhang, A., Li, W., Xia, C., and Guo, H. (2025). The impact of urban landscape patterns on land surface temperature at the street block level: evidence from 38 big Chinese cities. Environ. Impact Assess. Rev. 110, 107673. doi:10.1016/j.eiar.2024.107673
Keywords: transportation emissions, landscape infrastructure, spatial analytics, urban-suburban dynamics, socio-spatial patterns, localized climate action
Citation: Wang J, Tao Z and Deal B (2025) Street-level climate action: a landscape based approach to investigate transportation emissions and green infrastructure solutions. Front. Built Environ. 11:1678169. doi: 10.3389/fbuil.2025.1678169
Received: 01 August 2025; Accepted: 29 August 2025;
Published: 10 September 2025.
Edited by:
Xiwei Shen, University of Nevada, Las Vegas, United StatesReviewed by:
Hourakhsh Ahmad Nia, Alanya University, TürkiyeTegegne Getachew Legass, Mekdela Amba University, Ethiopia
Copyright © 2025 Wang, Tao and Deal. This is an open-access article distributed under the terms of the Creative Commons Attribution License (CC BY). The use, distribution or reproduction in other forums is permitted, provided the original author(s) and the copyright owner(s) are credited and that the original publication in this journal is cited, in accordance with accepted academic practice. No use, distribution or reproduction is permitted which does not comply with these terms.
*Correspondence: Brian Deal, ZGVhbEBpbGxpbm9pcy5lZHU=